
Study on the Evolution Law of Surface Landscape Pattern in Earthquake-Stricken Areas by Remote Sensing: A Case Study of Jiuzhaigou County, Sichuan Province


Abstract
:1. Introduction
2. Materials
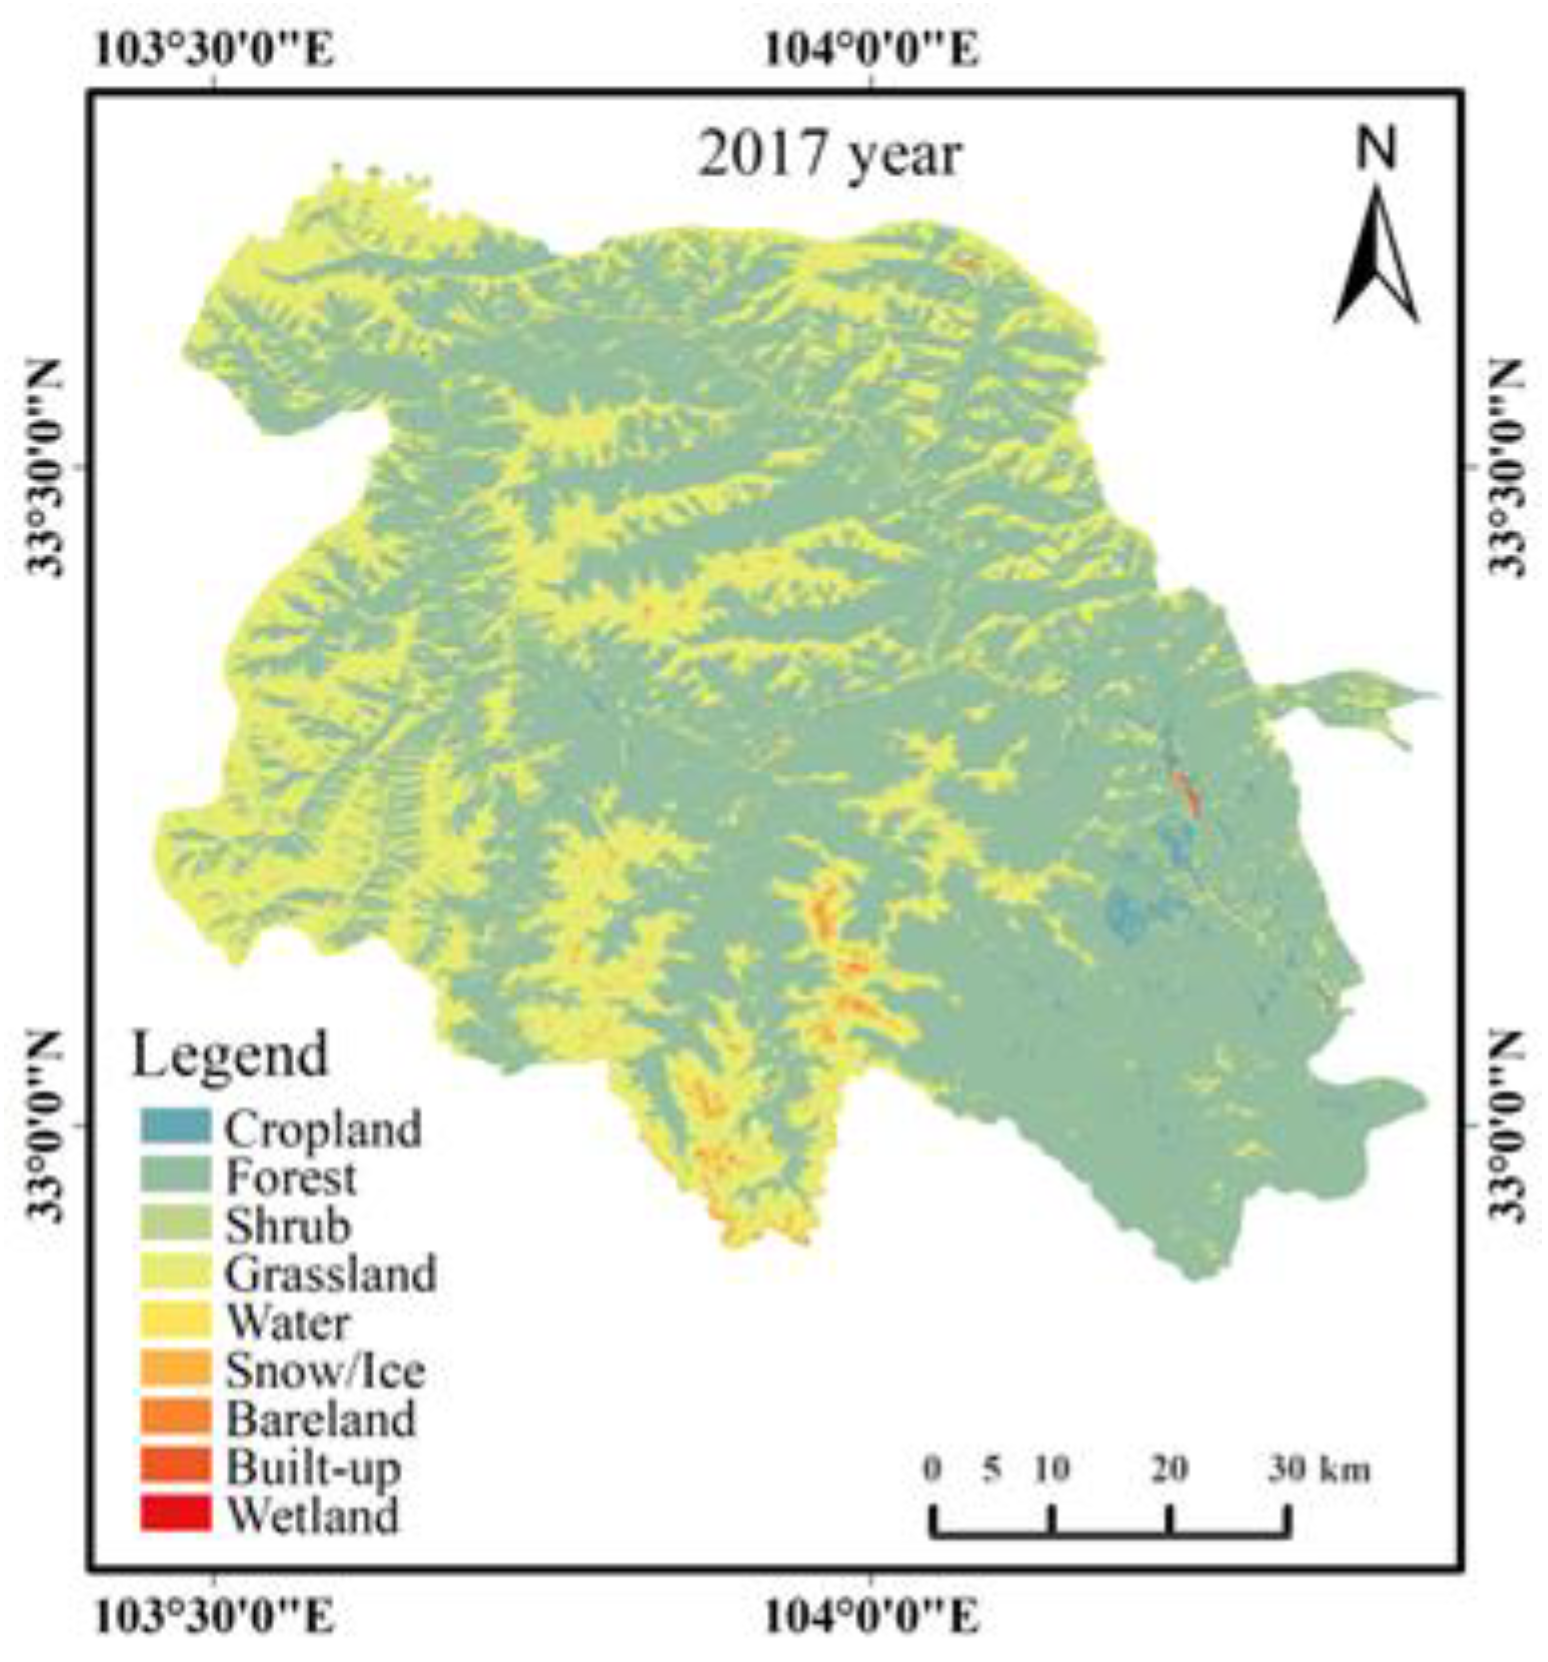
2.1. Study Area
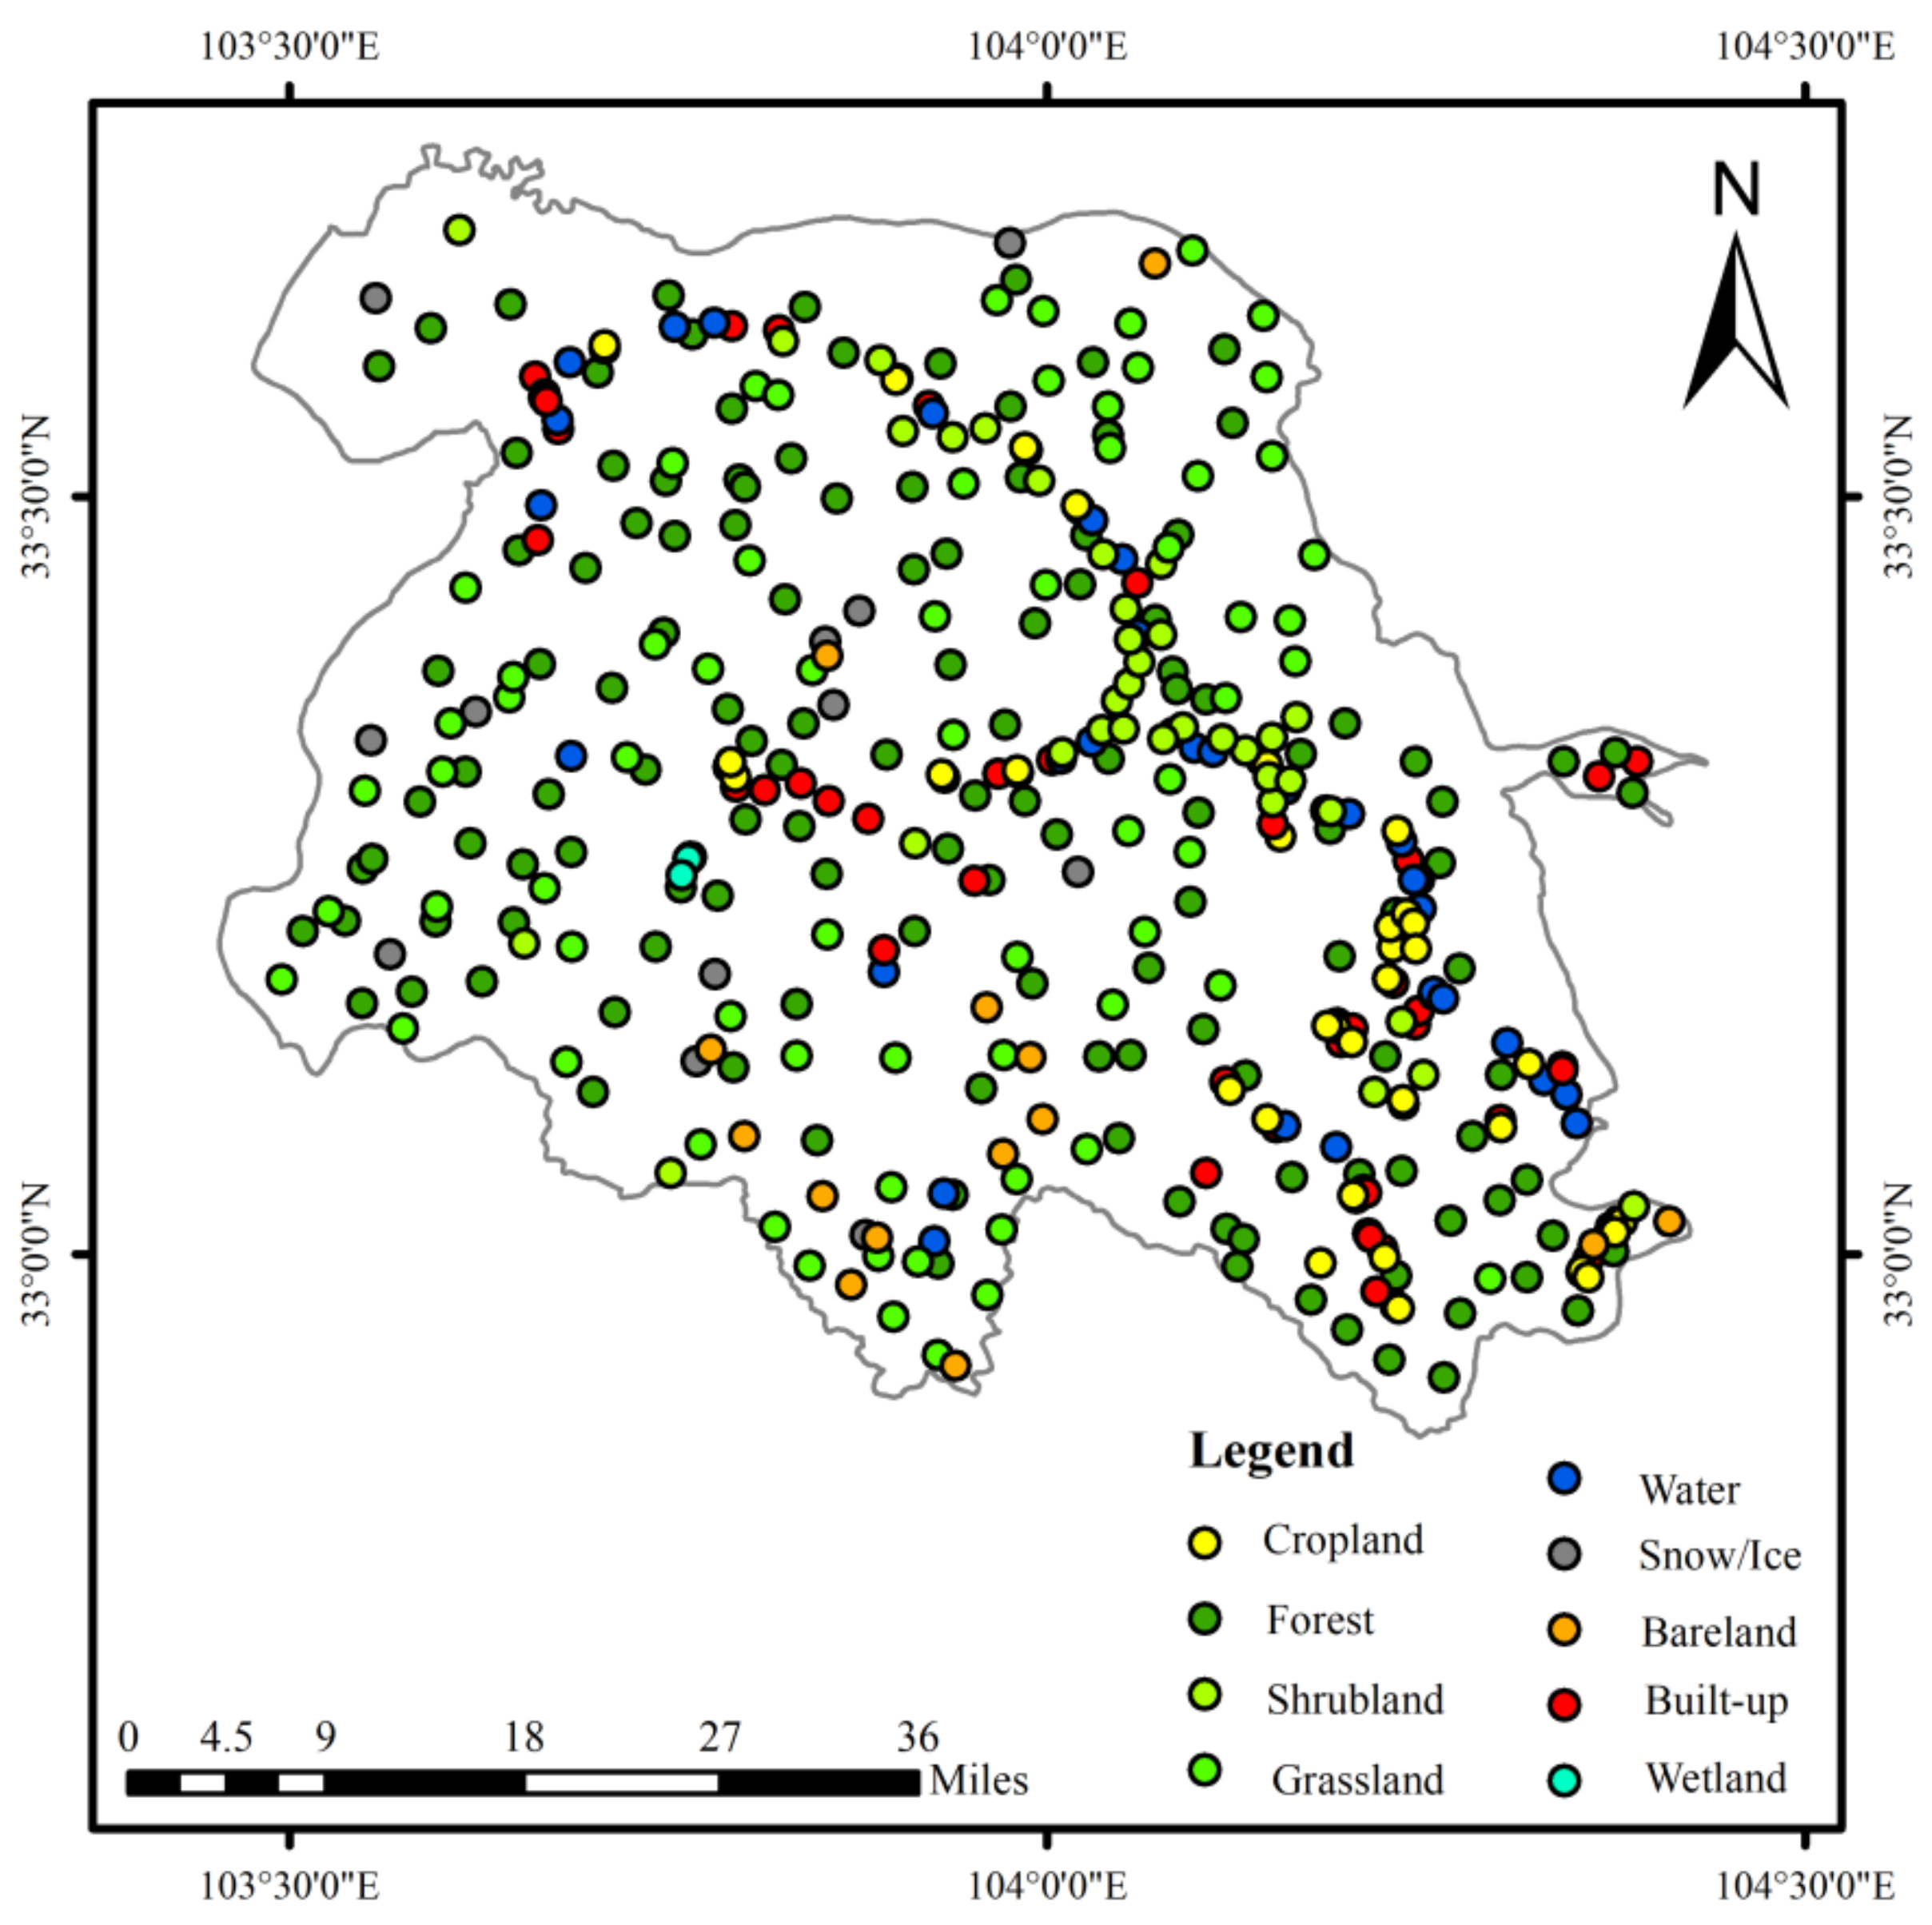
2.2. Data and Preprocessing
3. Methods
3.1. Comprehensive Index of Land-Use Degree
3.2. Land-Use Transfer Matrix
3.3. Landscape Ecological Index
4. Results
4.1. Land Cover Type Structure
4.2. Land-Use Degree Analysis
4.3. Analysis of Land-Use Intertransfer
4.4. Analysis of Landscape Pattern Evolution
4.4.1. Temporal Variation Characteristic
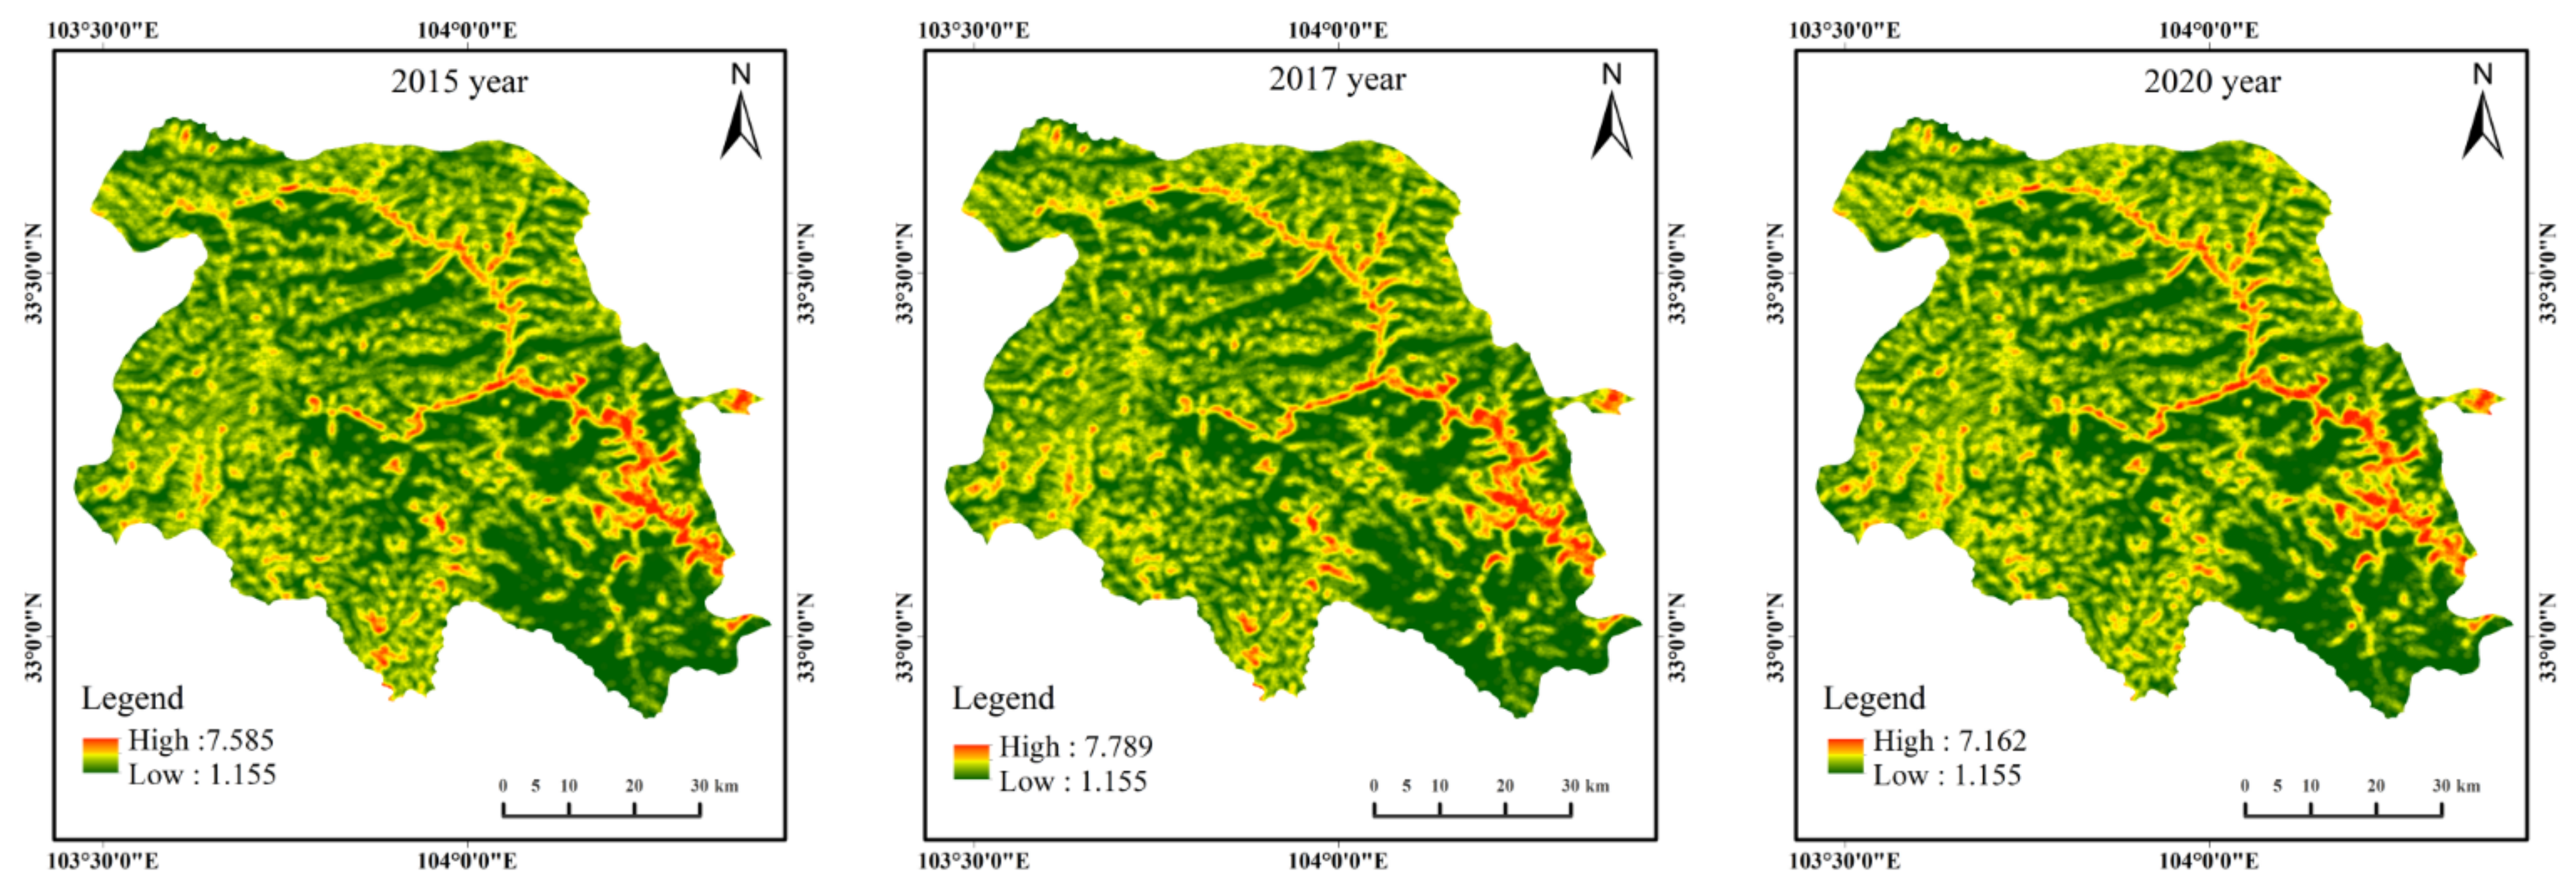
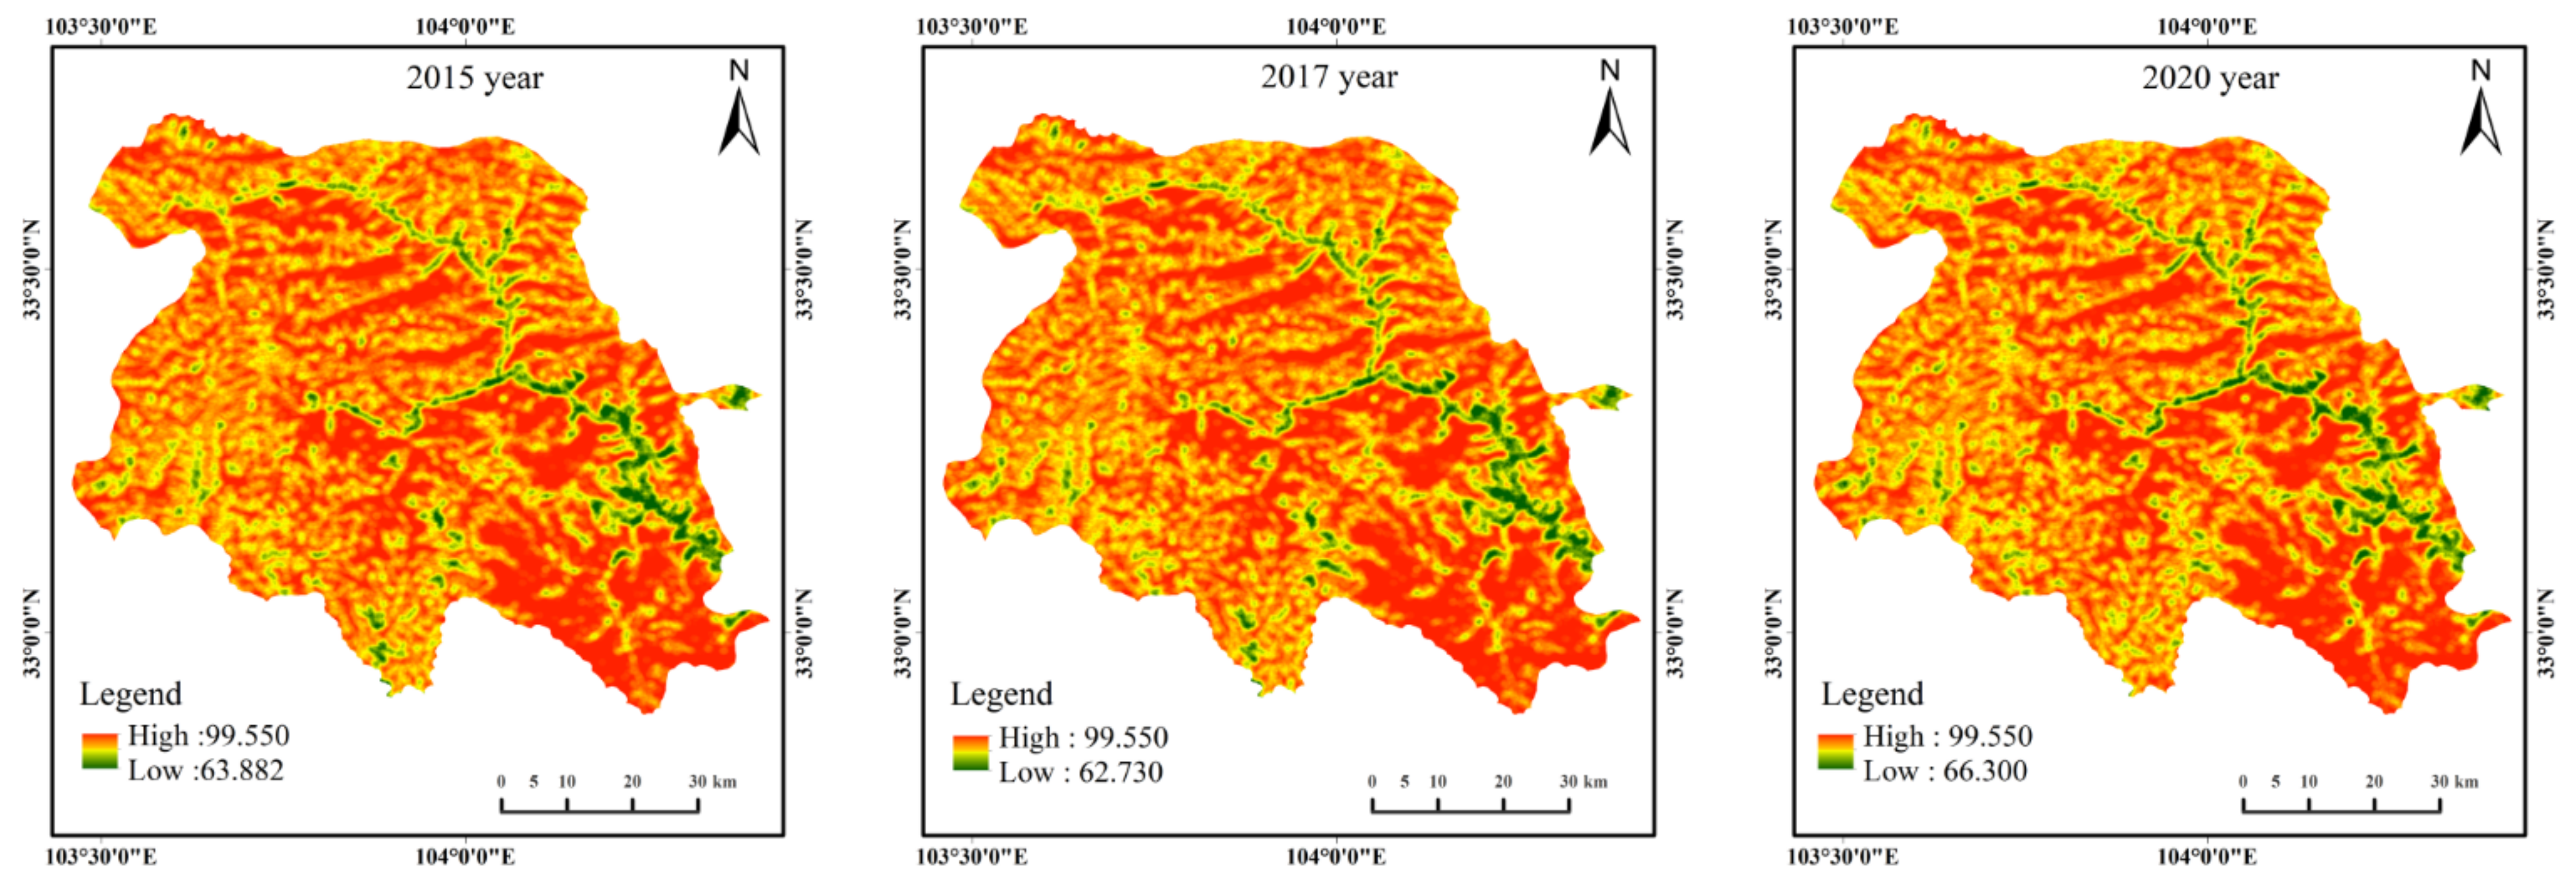
4.4.2. Spatial Variation Characteristic
4.5. Analysis on the Influence of Natural Factors on Land Cover Change in Earthquake Stricken Areas
5. Discussion
5.1. Analysis on the Influence of Human Factors on Land Cover Change in Earthquake Stricken Areas
- (1)
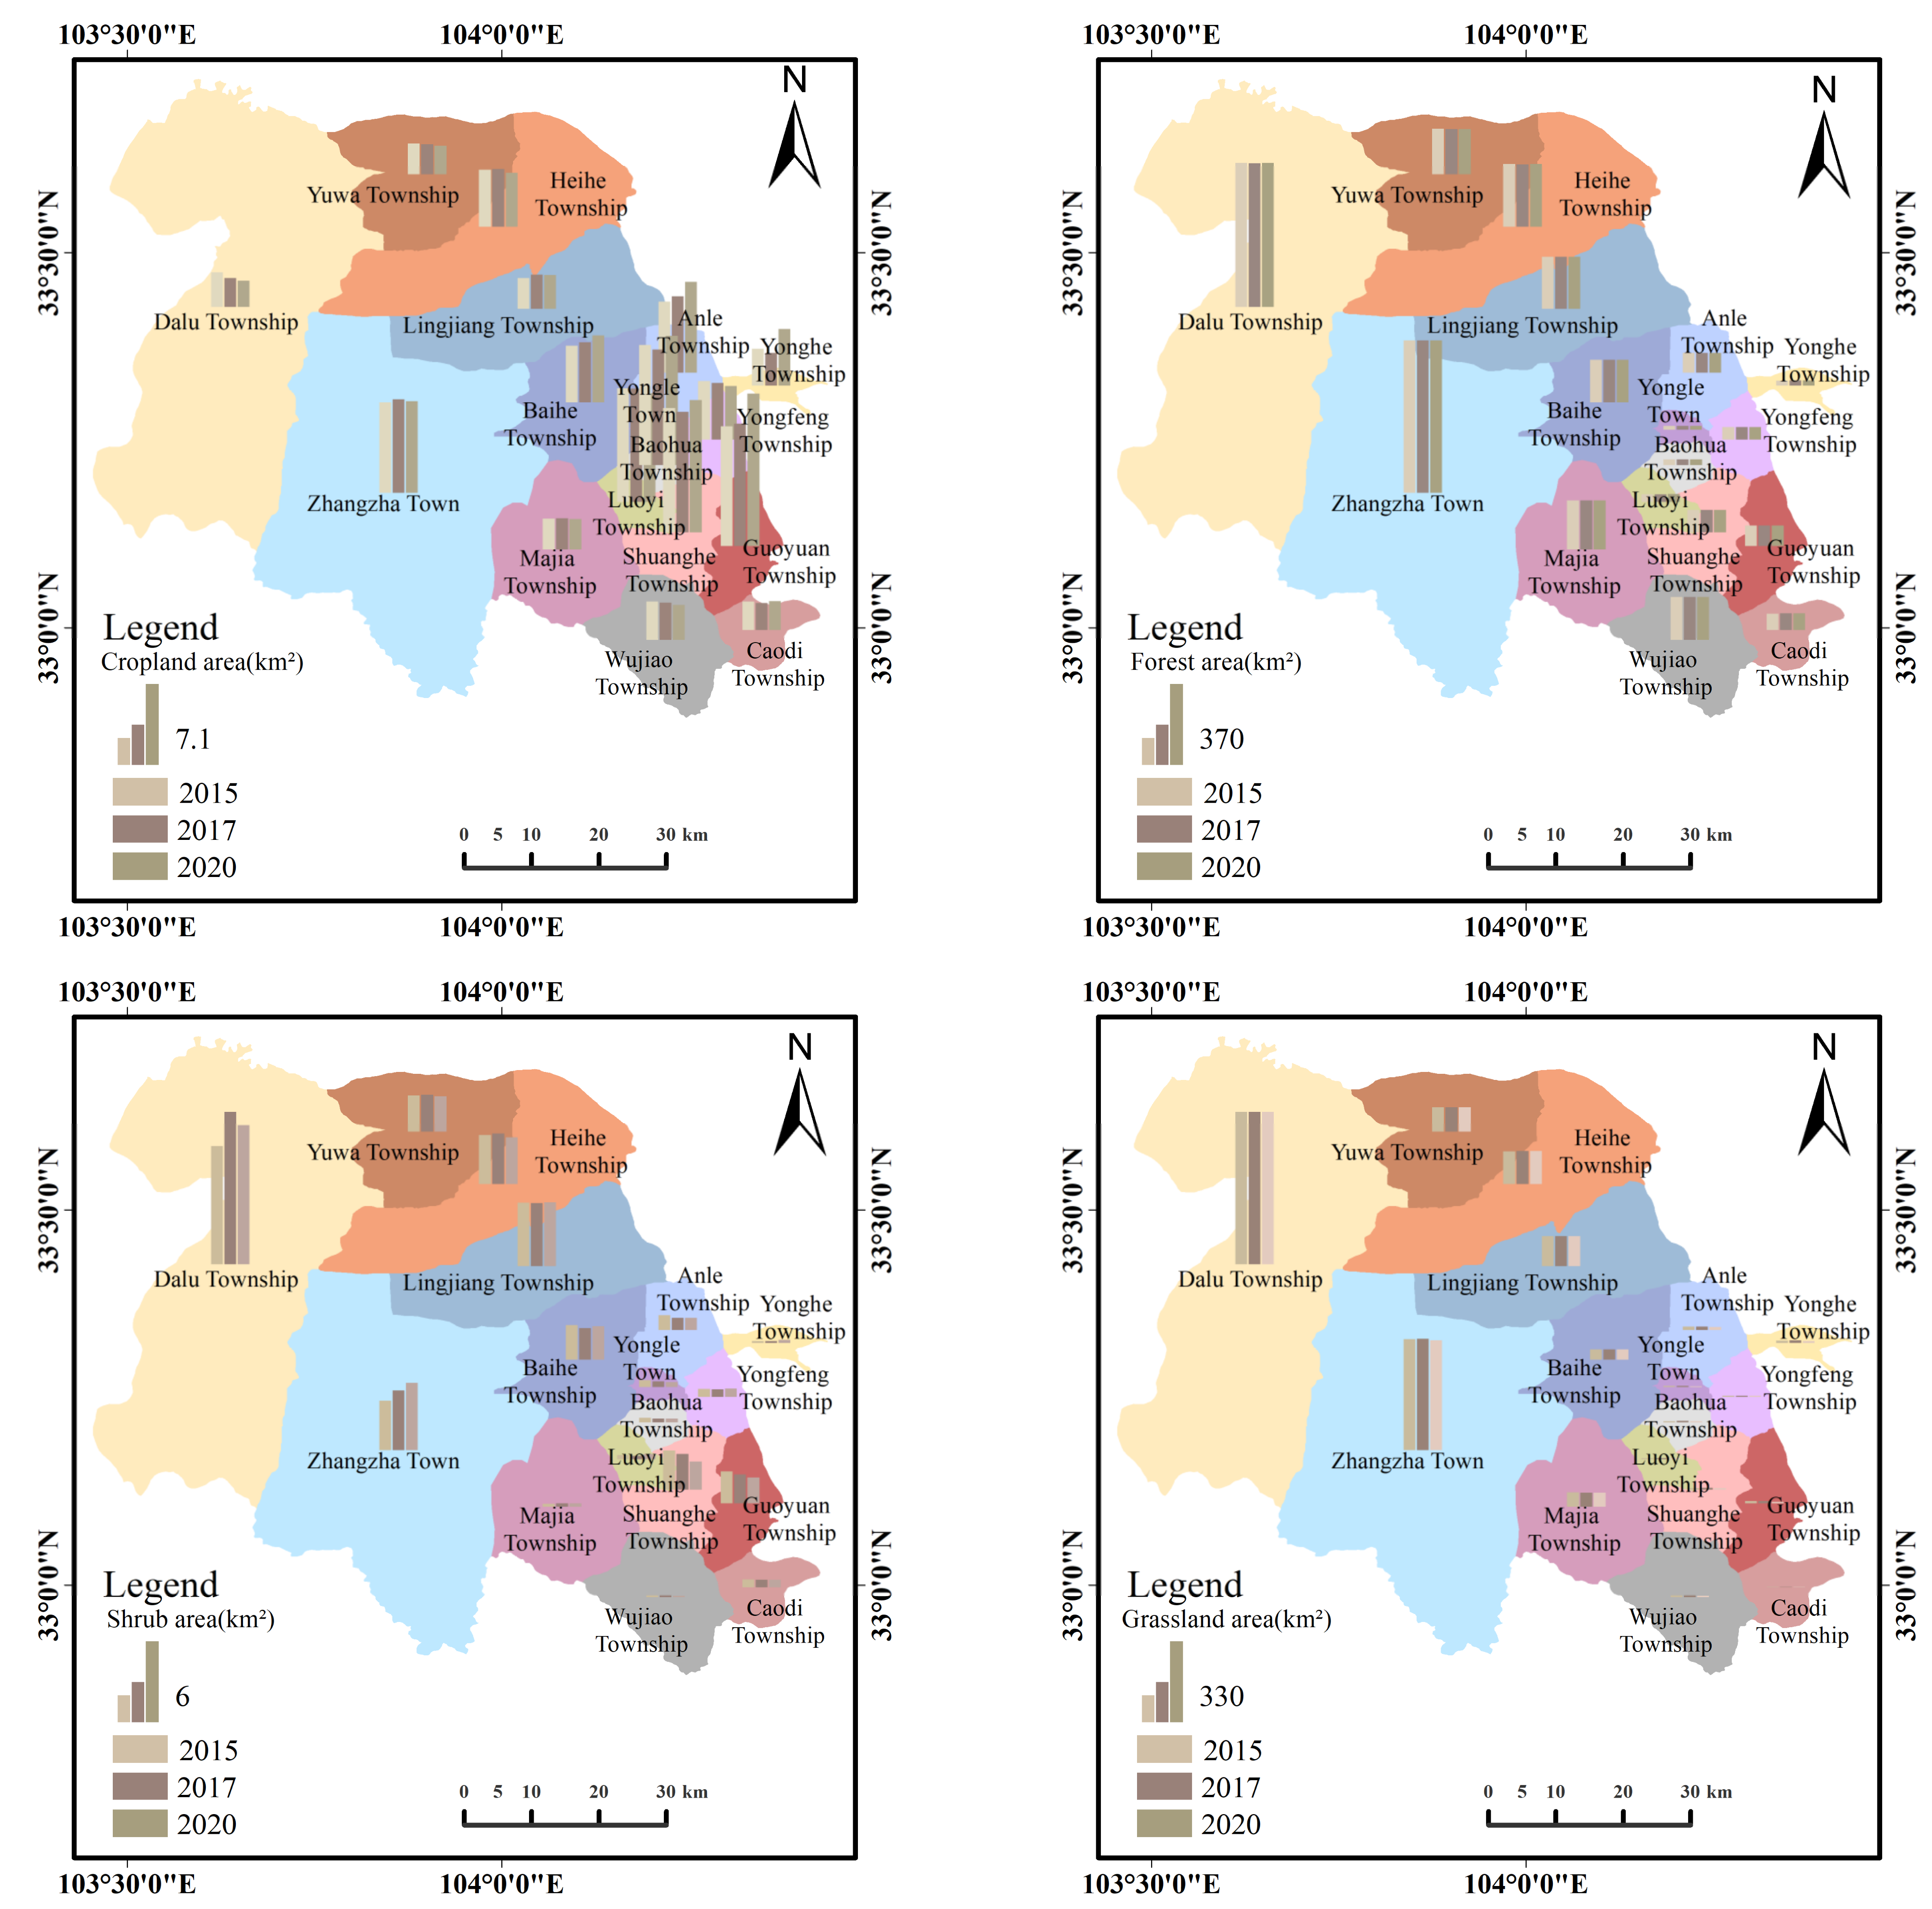
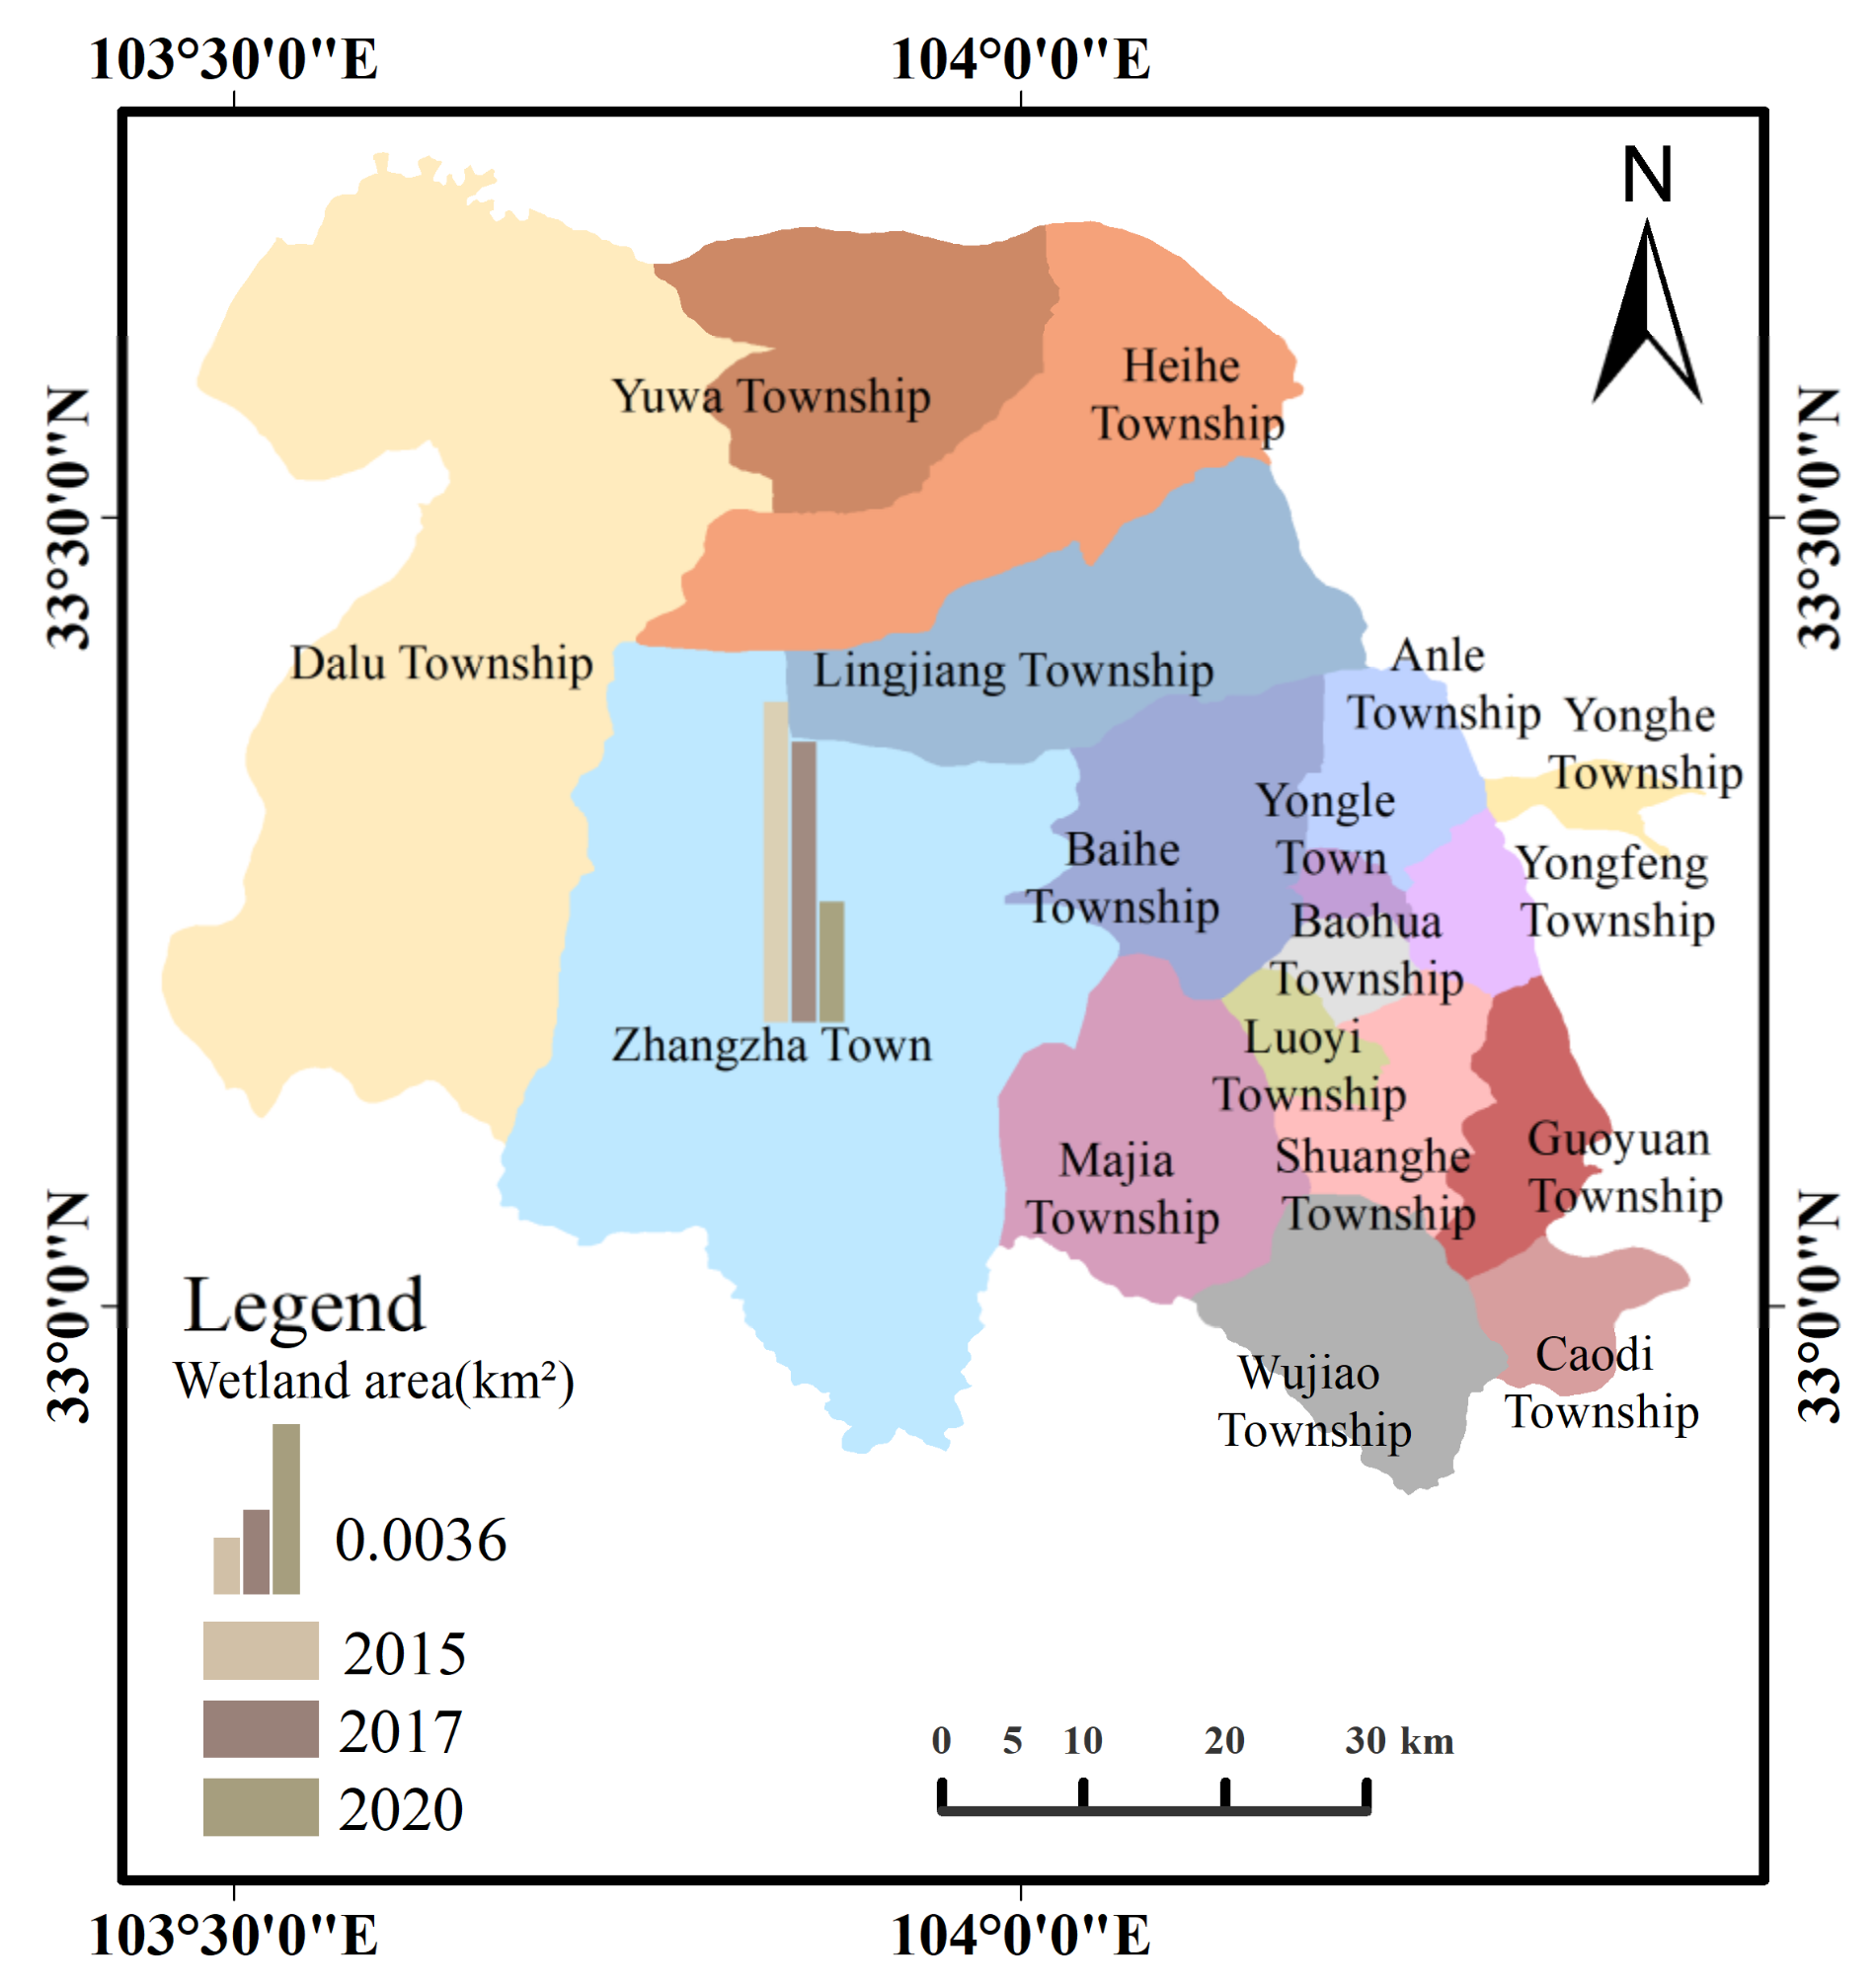
- Land policies of government departments directly affect land cover change. After the Jiuzhaigou earthquake, the government departments introduced land policies, such as post-disaster recovery and reconstruction of easy land, re-optimization and adjustment of basic farmland, and reclamation and utilization of abandoned industrial and mining land in the disaster area, which will lead to a change in land cover structure. According to the experimental results in Part 4.1 of this paper, from 2015 to 2020, the land cover types of all villages and towns in Jiuzhaigou have changed. For example, before and after the earthquake, the water area in Majia Township of Jiuzhaigou changed significantly and kept increasing from 0.43 km2 in 2015 to 1.06 km2 in 2020;
- (2)
- Ecological restoration and protection policies are also important factors affecting land cover change. After the Jiuzhaigou earthquake, the government issued a policy to include eligible arable land on steep slopes in the quake-hit areas in a new round of conversion projects, which will lead to the conversion of some arable land into forest land. For example, it can be seen from the experimental results in Section 4.3 of this paper that during 2015–2017, the transfer of cropland land type to grassland type was the largest, with a transfer area of 6.37 km2;
- (3)
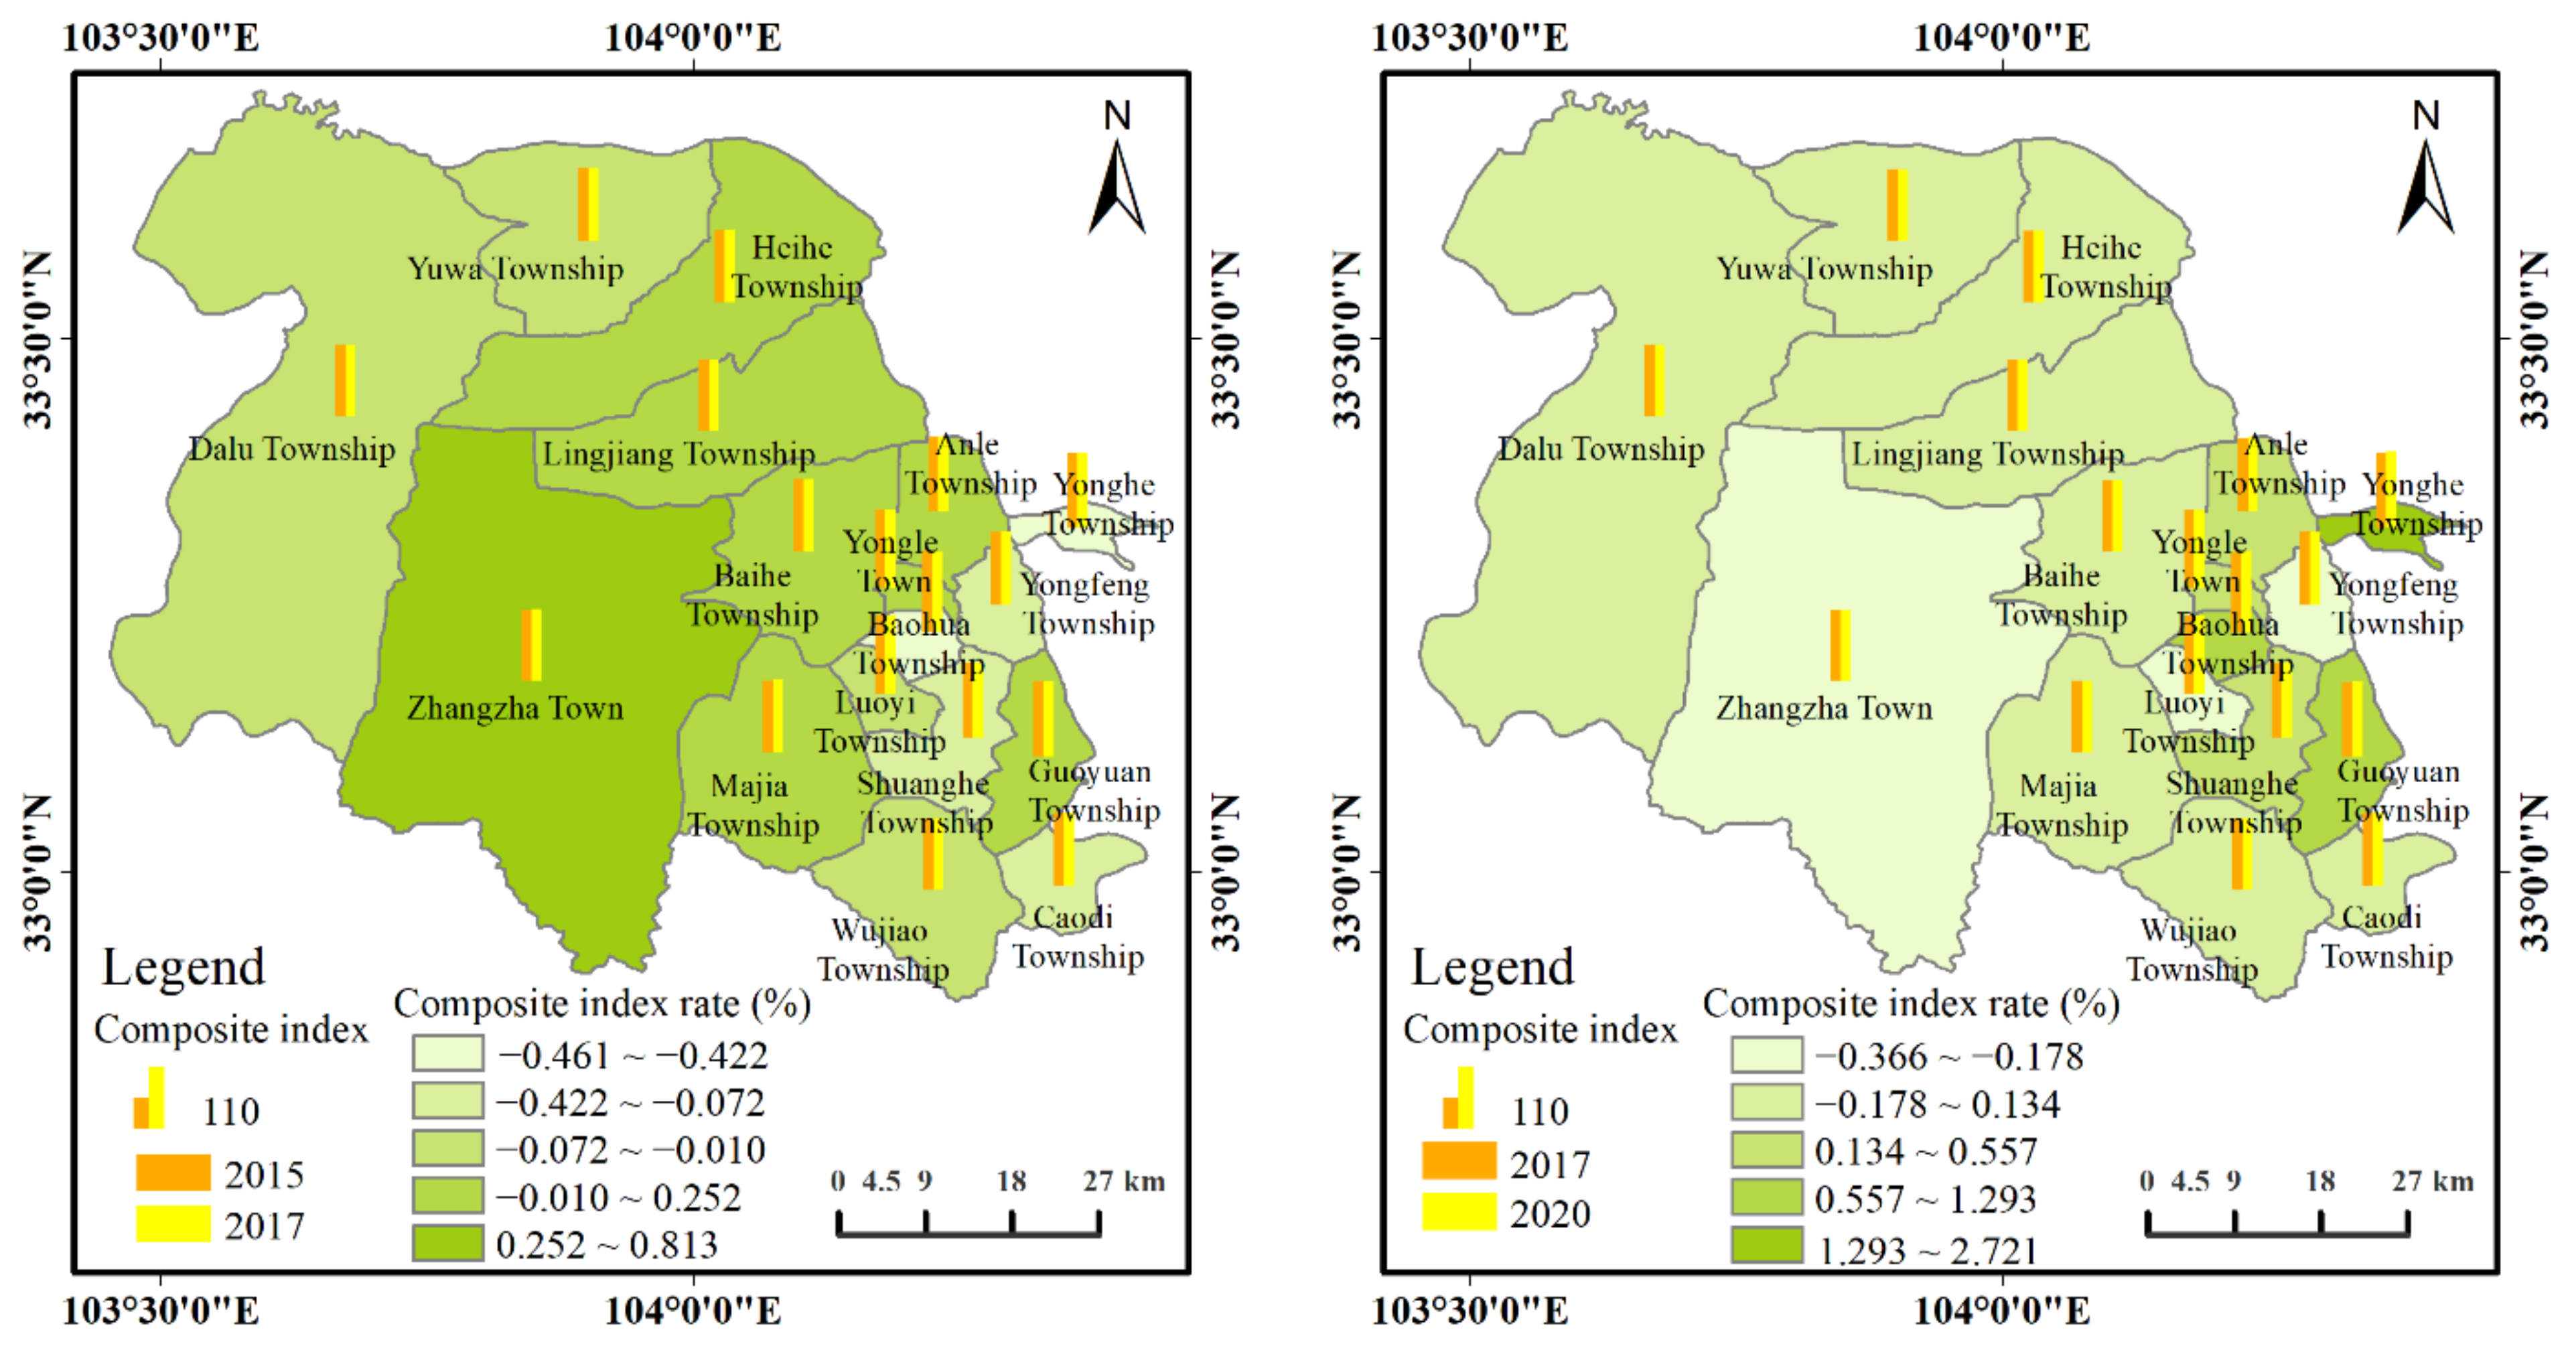
- As the first nature reserve in China whose main purpose is to protect natural scenery, policies related to scenic spot restoration and industrial development are also influencing land cover change in Jiuzhaigou. After the Jiuzhaigou earthquake, the government departments were required to support the revitalization and development of tourism in the disaster area, to support the development of modern agriculture in the disaster area, and to support the transformation and upgrading of the industry in the disaster area, green development, and other policies. For example, according to the spatial change in land-use degree calculated in this paper, from 2017 to 2020, the growth trend of land-use degree in Yonghe Township, Guoyuan Township, Anle Township, and Yongle Town in the study area was obvious. Yonghe Township, in particular, had a rate of change as high as 2.72%;
- (4)
- Infrastructure policies also affect land cover change. After the earthquake in Jiuzhaigou, the government departments also introduced relevant infrastructure construction policies, such as constructing the section of road from the main temple of the national highway 544 to the county seat of Jiuzhaigou in order to build a safe, smart and green eco-tourism new demonstration road. The construction of built-up land will make parts of cropland, forest, grassland, and other types of land shift to built-up types. During 2017–2020, the area of the study area changed from other land types to built-up was 0.12 km2.
5.2. The Results of This Study Were Compared with Those of Other Literatures
6. Conclusions
- (1)
- Before and after the Jiuzhaigou County earthquake, the types of forest, cropland, shrubland, and grassland in the study area changed greatly. Affected by the earthquake, the comprehensive index of land cover degree of most towns decreased first and then increased. The southeast of the study area has convenient transportation, high population density, and frequent human activities, and the comprehensive index of land cover degree changes more obviously;
- (2)
- Affected by the earthquake and secondary disasters, the cropland and forest were damaged to a large extent. However, due to the special climate of Jiuzhaigou, some vegetation can easily take root and sprout, and become grassland or shrubland. After the earthquake, under the artificial repair and reconstruction, the cropland damaged by the earthquake is restored again. In addition, part of the grassland has been turned into forest, indicating that the ecological environment damaged by the earthquake is gradually being repaired;
- (3)
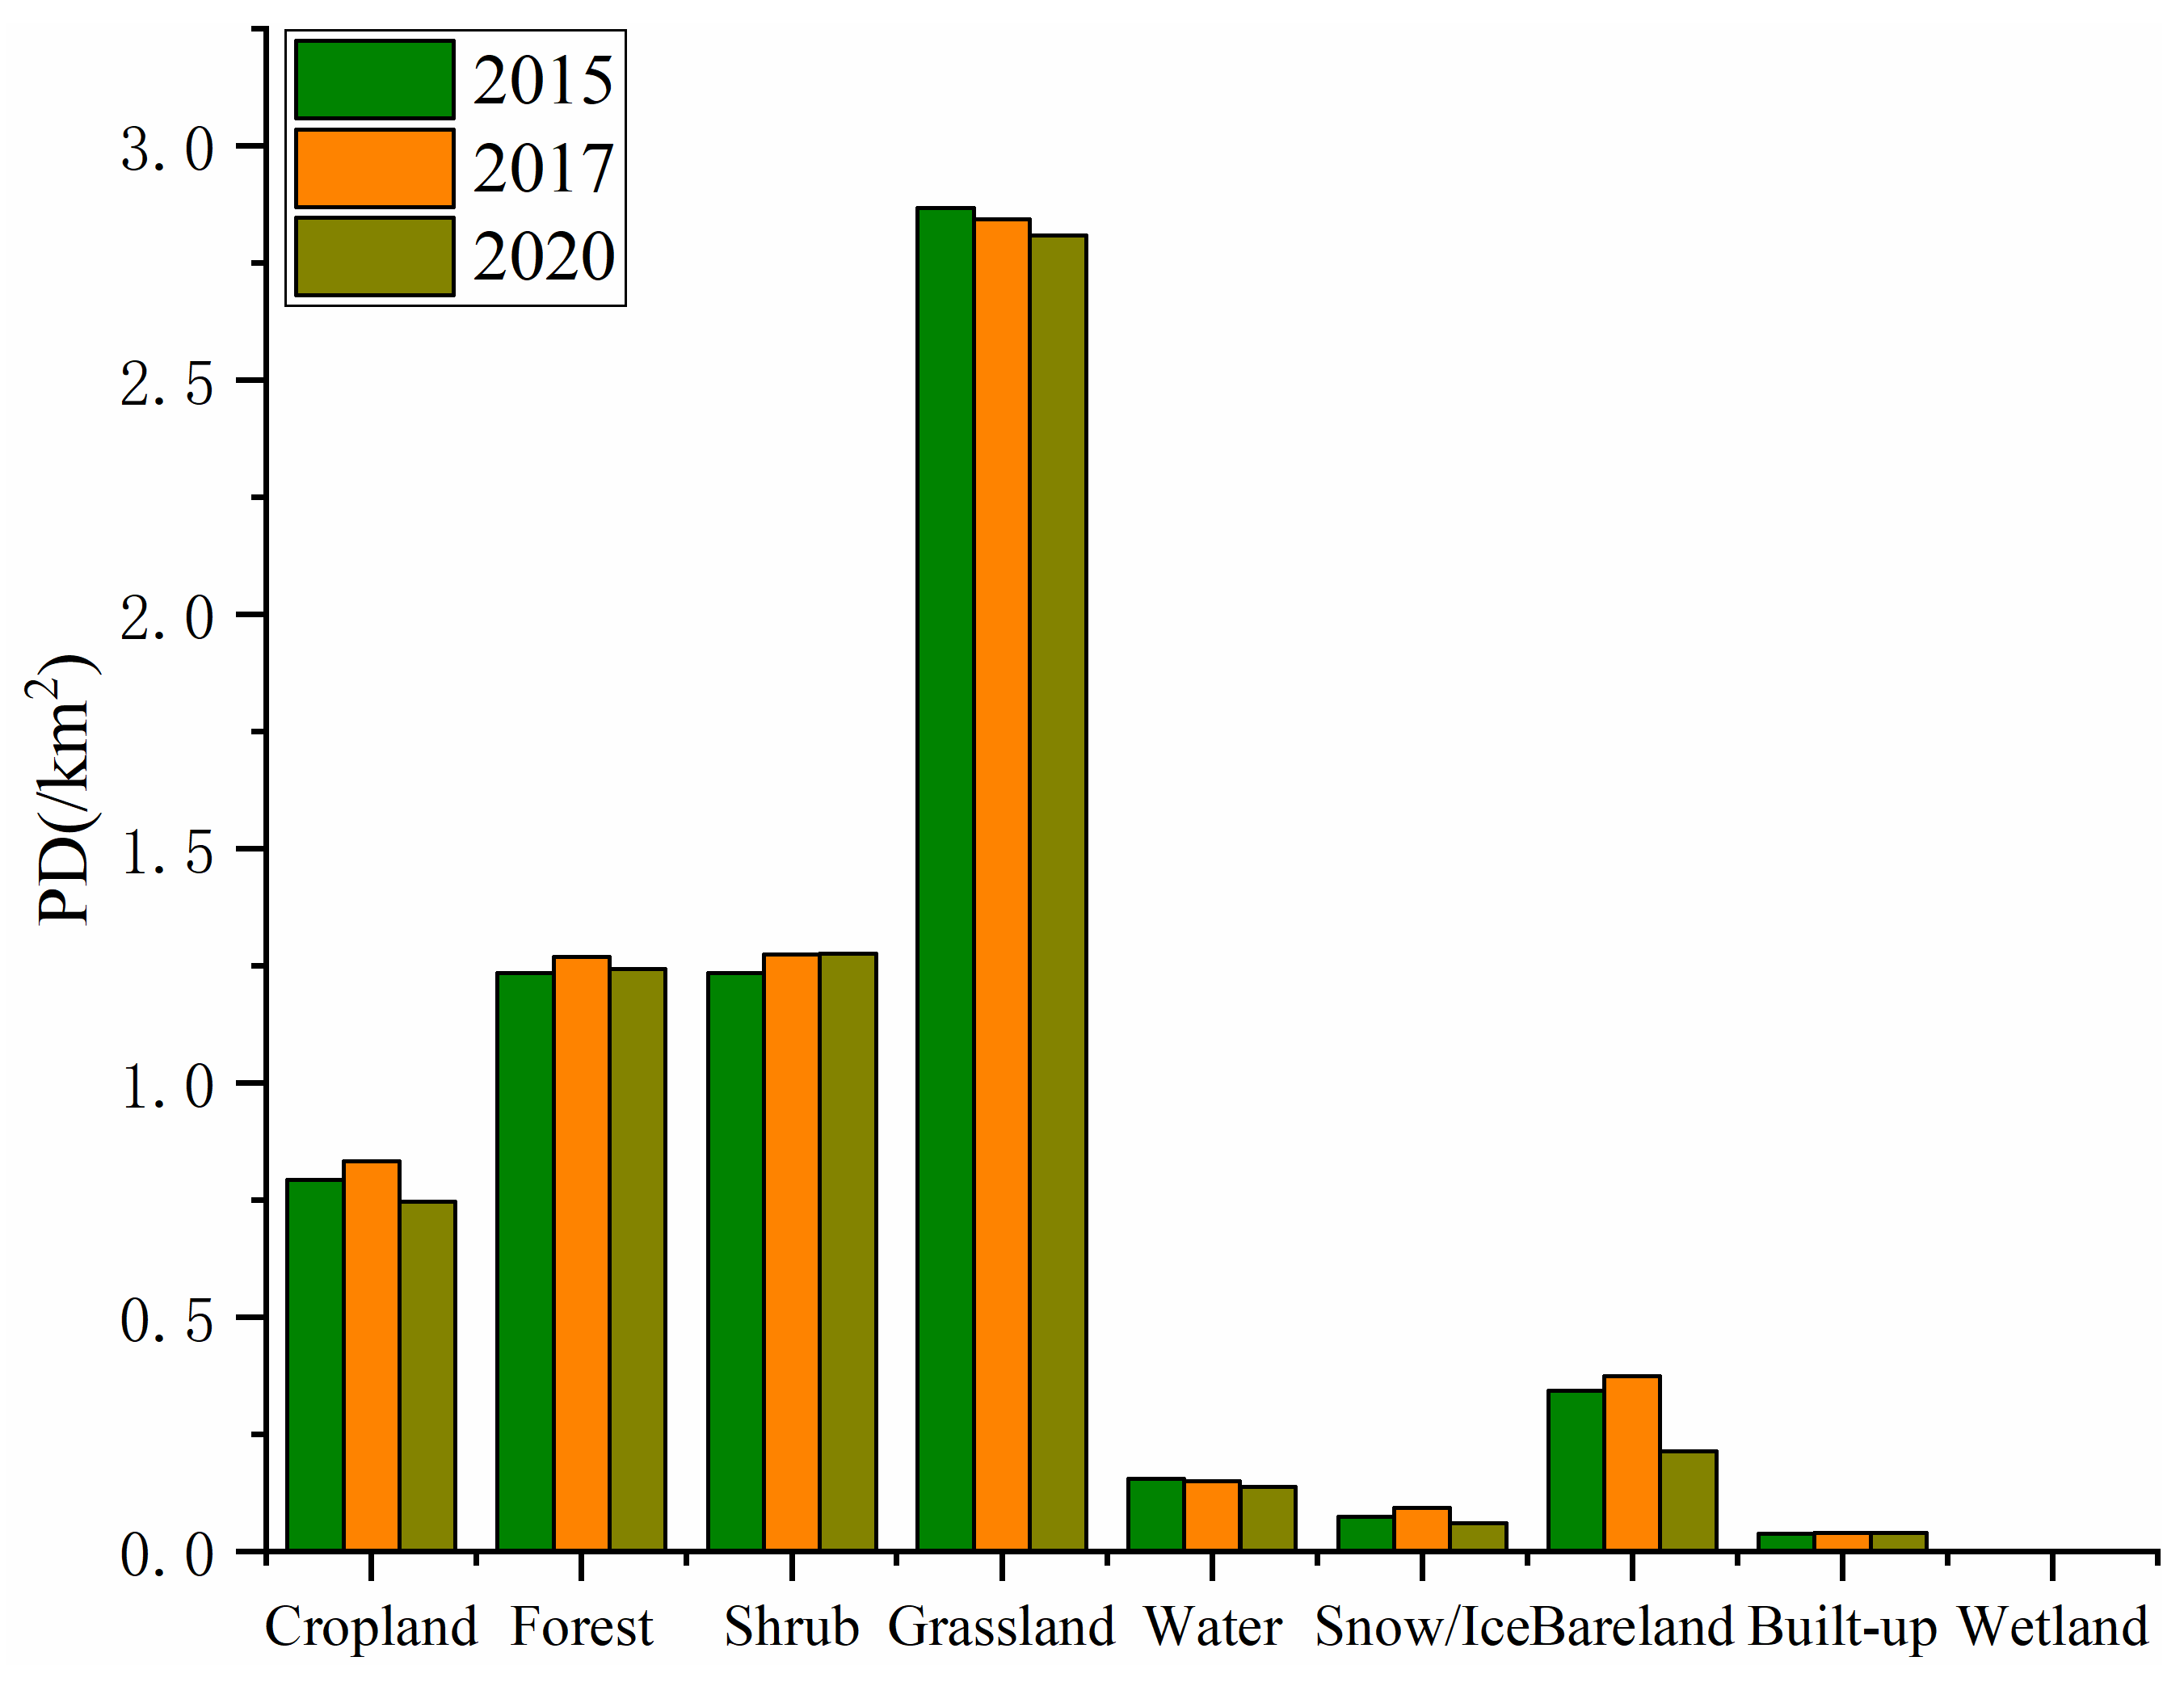
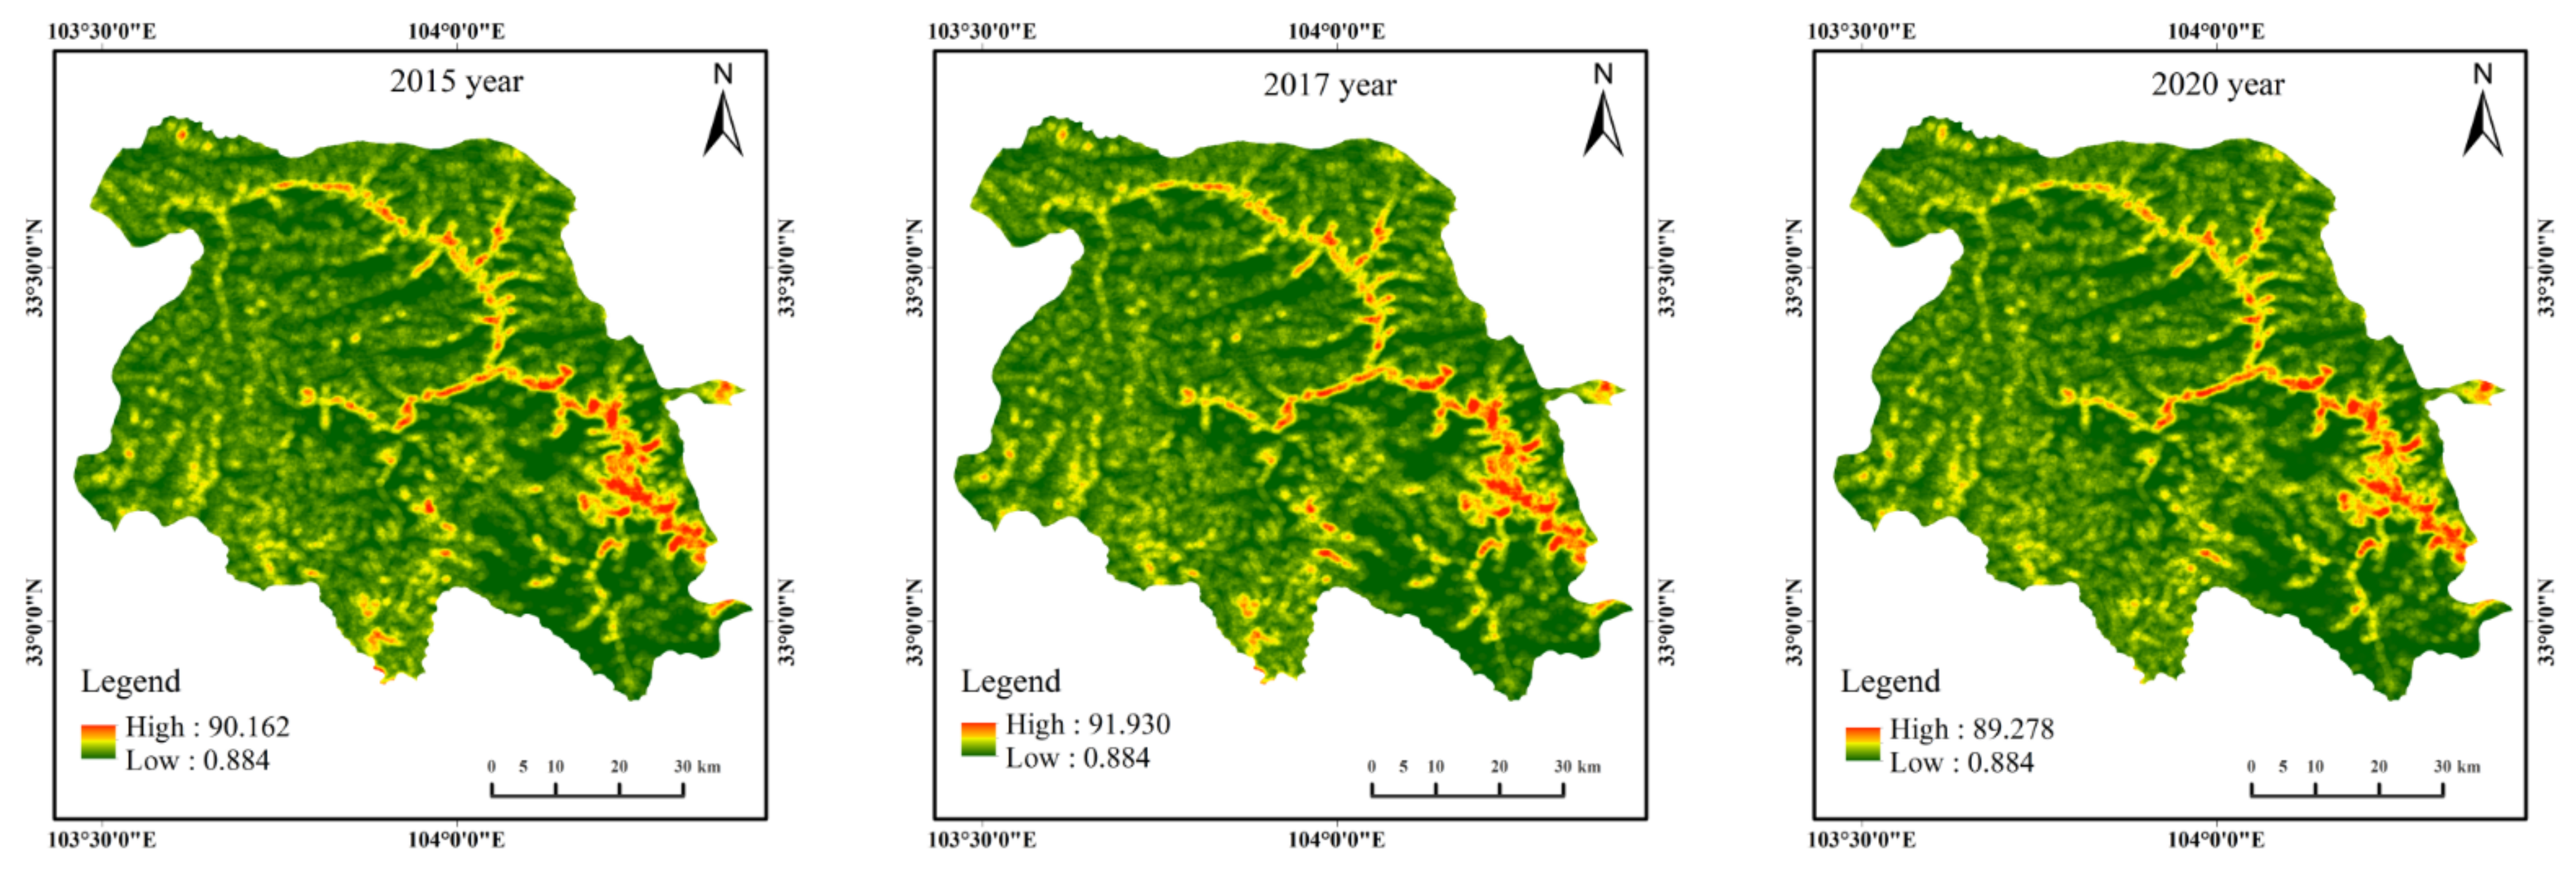
- In terms of time, the PD and LSI of most landscape types before and after the earthquake increased first and then decreased, and the AI decreased first and then increased. The results showed that the degree of landscape fragmentation was aggravated and the connectivity between patches was reduced. With the gradual recovery of the ecological environment after the earthquake, the degree of landscape fragmentation was less, the connectivity between patches was improved, and the ecological environment was gradually improved. From the perspective of space, the spatial changes in the PD, LSI, and AI landscape indexes were mainly concentrated in the southeast of the study area and around the Heihe and Baihe River basins, where the surface landscape was more complex and greatly disturbed by human activities;
- (4)
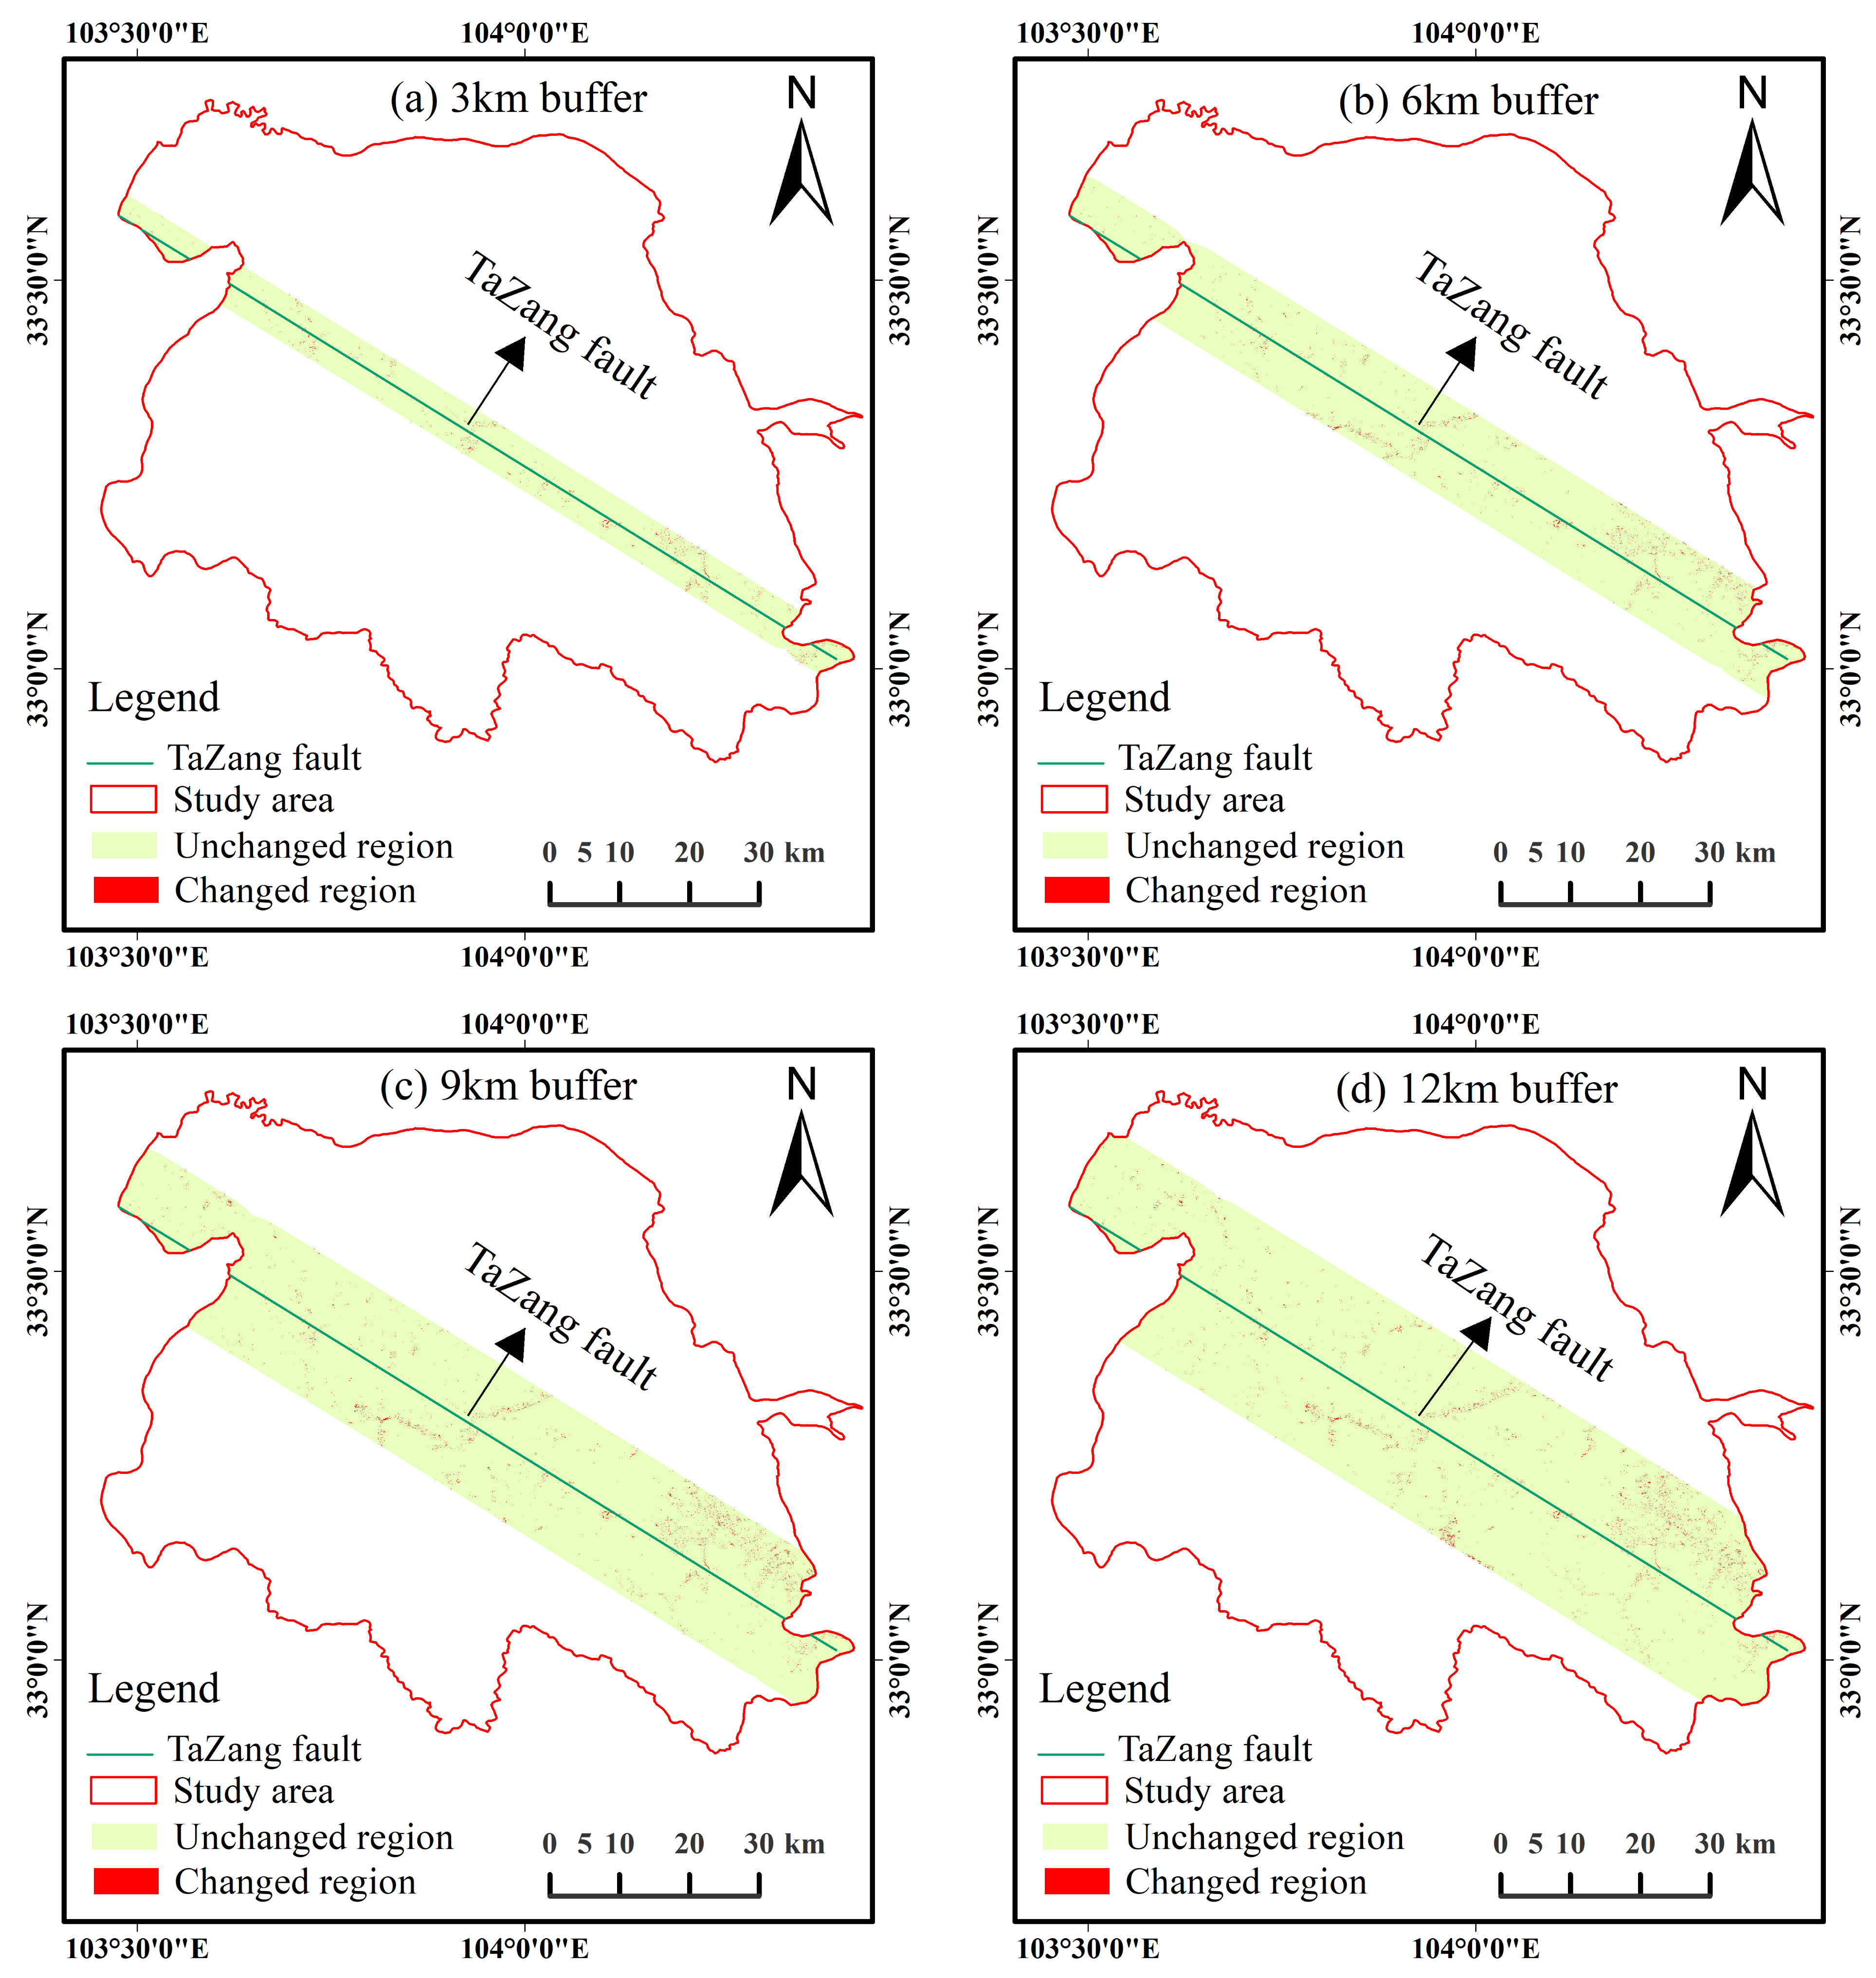
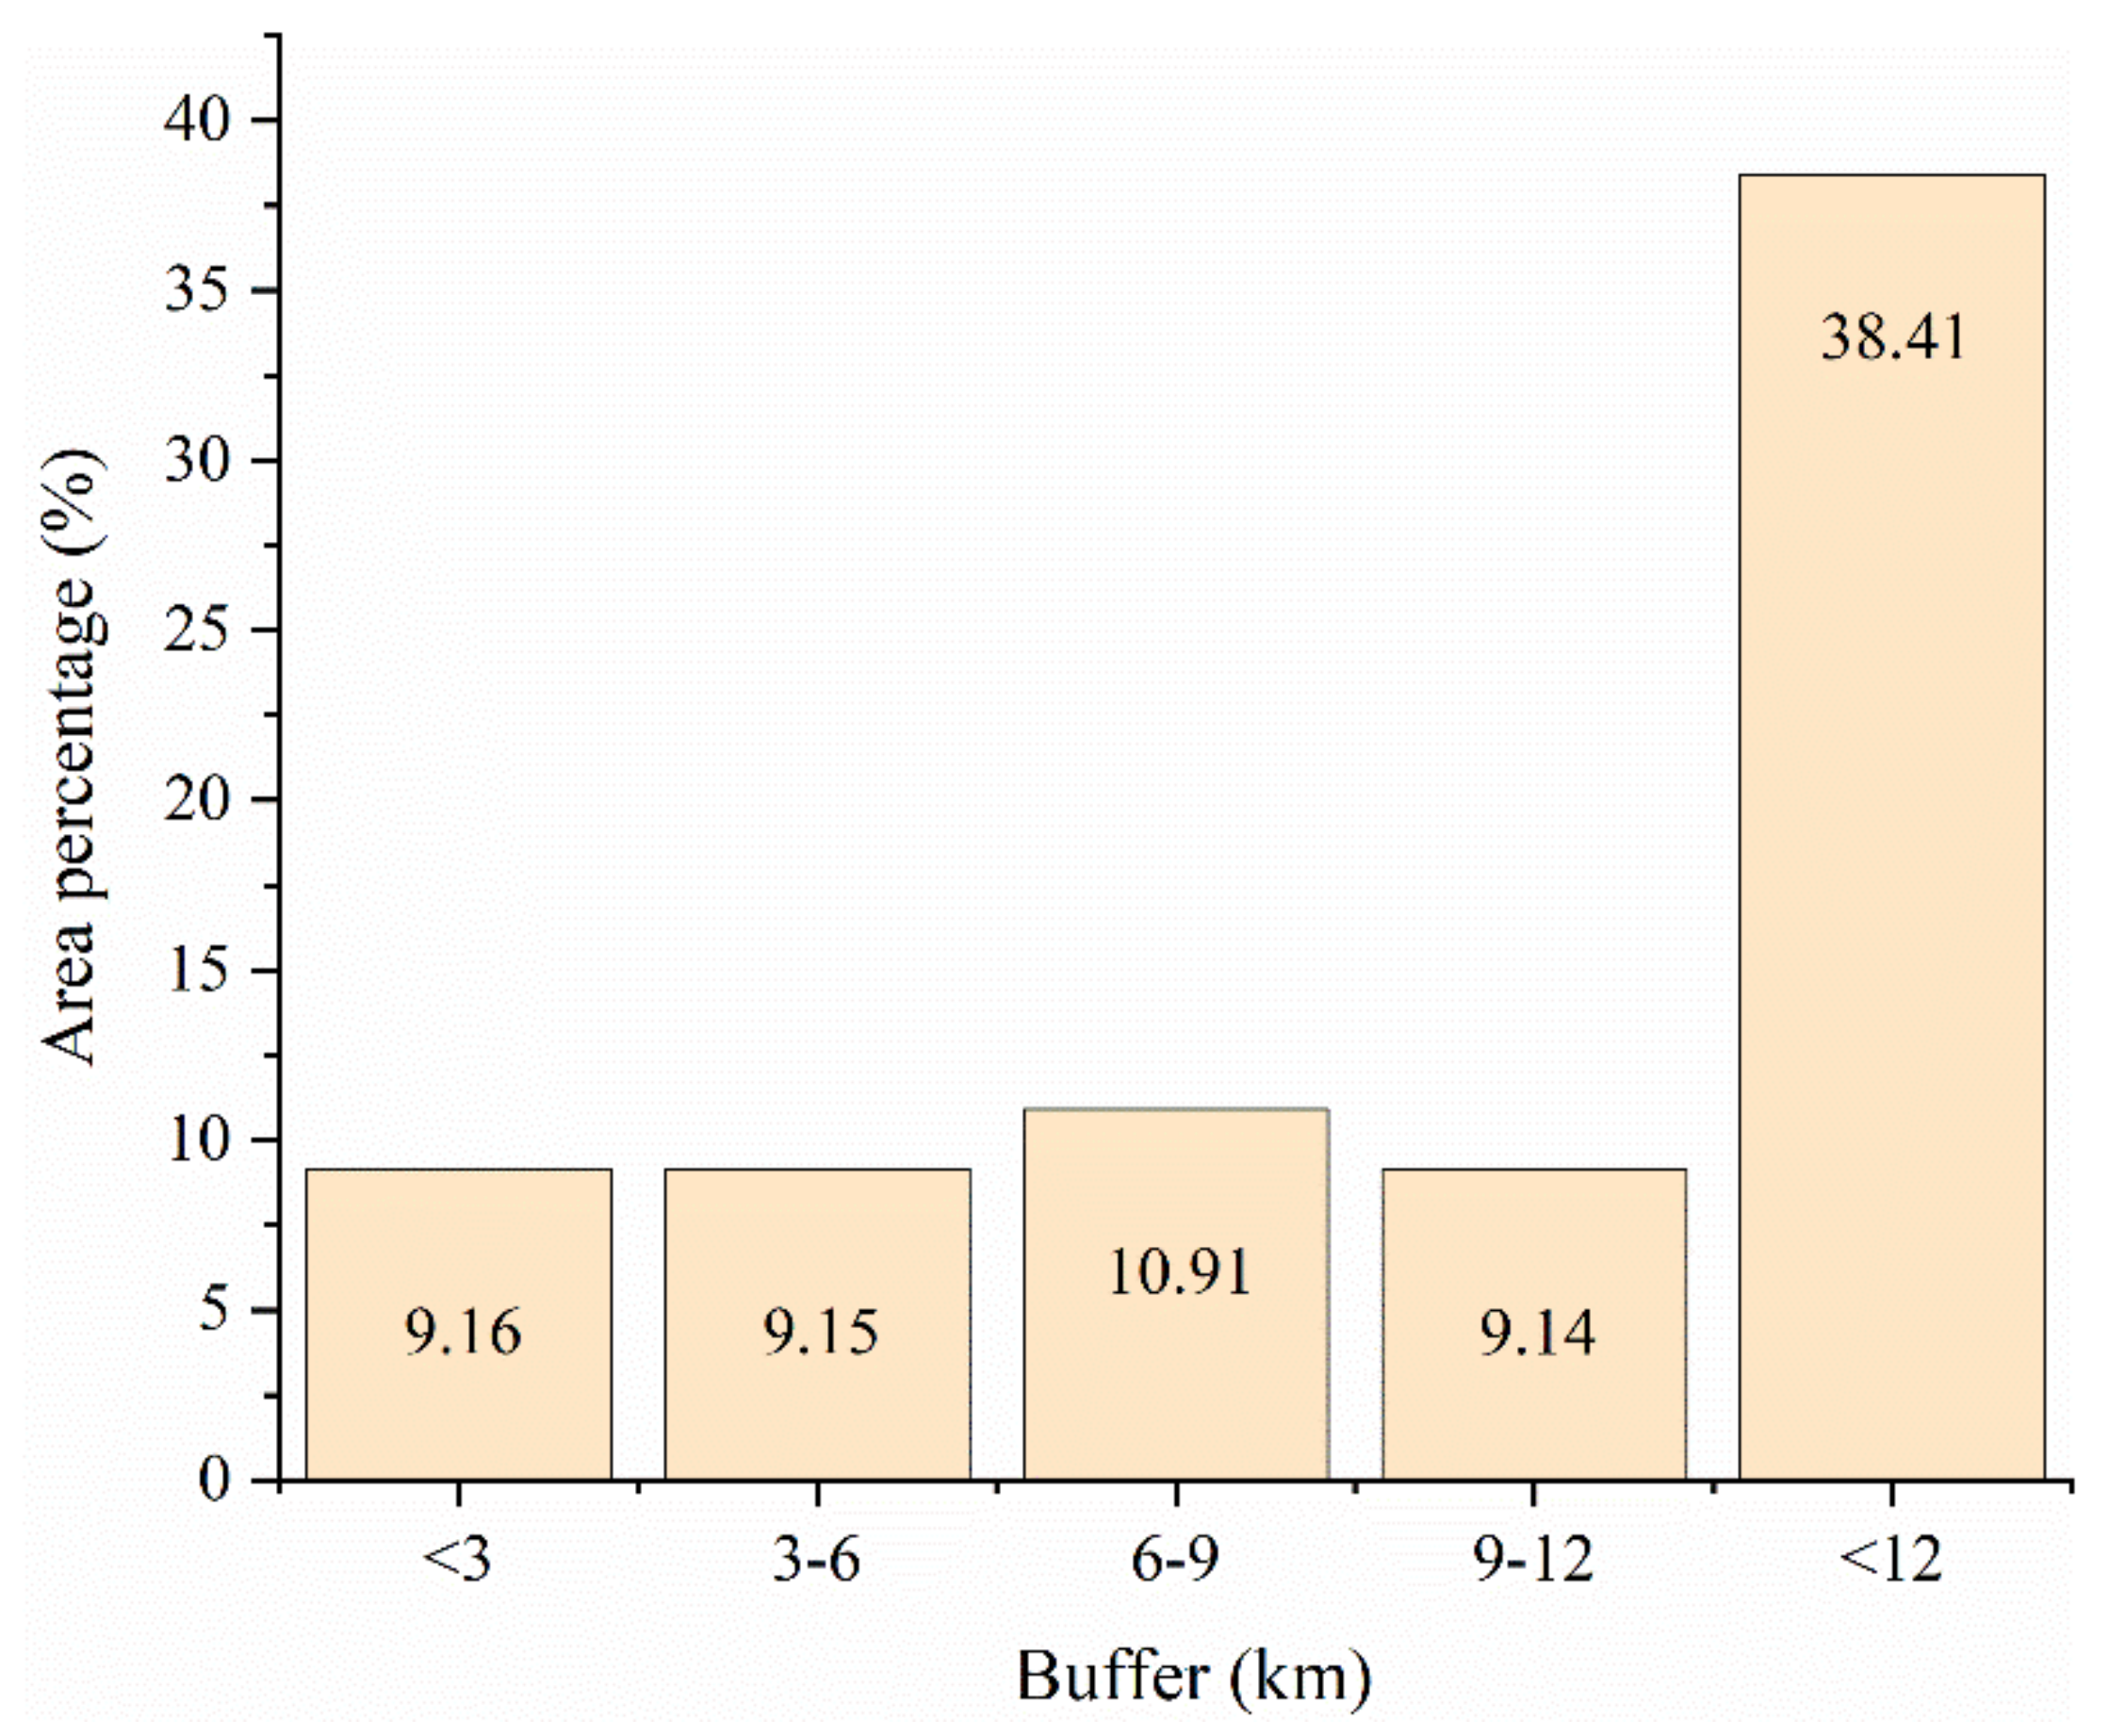
- From the perspective of overall change trend, the closer to the fault, the greater the land cover change and the more serious the land damage. Moreover, human activities are frequent in the southeastern region, which is more significantly affected by the fault zone.
Author Contributions
Funding
Conflicts of Interest
References
- Gupta, A.K.; Nair, S.S. Ecosystem Approach to Disaster Risk Reduction; National Institute of Disaster Management New Delhi: New Delhi, India, 2012. [Google Scholar]
- Li, G.; Fang, C.; Wang, S. Exploring spatiotemporal changes in ecosystem-service values and hotspots in China. Sci. Total Environ. 2016, 545, 609–620. [Google Scholar] [CrossRef]
- Duan, Y.; Di, B.; Ustin, S.L.; Xu, C.; Xie, Q.; Wu, S.; Li, J.; Zhang, R. Changes in ecosystem services in a montane landscape impacted by major earthquakes: A case study in Wenchuan earthquake-affected area, China. Ecol. Indic. 2021, 126, 107683. [Google Scholar] [CrossRef]
- Cui, P.; Lin, Y.-M.; Chen, C. Destruction of vegetation due to geo-hazards and its environmental impacts in the Wenchuan earthquake areas. Ecol. Eng. 2012, 44, 61–69. [Google Scholar] [CrossRef]
- Qiu, J.; Qiao, X. A study on the seismogenic structure of the 2016 Zaduo, Qinghai Ms6. 2 earthquake using InSAR technology. Geod. Geodyn. 2017, 8, 342–346. [Google Scholar] [CrossRef]
- Ishihara, M.; Tadono, T. Land cover changes induced by the great east Japan earthquake in 2011. Sci. Rep. 2017, 7, 45769. [Google Scholar] [CrossRef]
- Balamurugan, G.; Aravind, M. Land use land cover changes in pre-and post-earthquake affected area using Geoinformatics–Western Coast of Gujarat, India. Disaster Adv. 2015, 8, 1–14. [Google Scholar]
- Ubaura, M.; Miyakawa, M.; Nieda, J. Land Use Change after Large Scale Disasters a Case Study of Urban Area of Ishinomaki City after the Great East Japan Earthquake. Procedia Eng. 2016, 161, 2209–2216. [Google Scholar] [CrossRef] [Green Version]
- Wang, J.; Yang, X.; Wang, Z.; Cheng, H.; Kang, J.; Tang, H.; Li, Y.; Bian, Z.; Bai, Z. Consistency Analysis and Accuracy Assessment of Three Global Ten-Meter Land Cover Products in Rocky Desertification Region—A Case Study of Southwest China. ISPRS Int. J. Geo-Inf. 2022, 11, 202. [Google Scholar] [CrossRef]
- Kang, J.; Yang, X.; Wang, Z.; Cheng, H.; Wang, J.; Tang, H.; Li, Y.; Bian, Z.; Bai, Z. Comparison of Three Ten Meter Land Cover Products in a Drought Region: A Case Study in Northwestern China. Land 2022, 11, 427. [Google Scholar] [CrossRef]
- Chuang, C.-W.; Lin, C.-Y.; Chien, C.-H.; Chou, W.-C. Application of Markov-chain model for vegetation restoration assessment at landslide areas caused by a catastrophic earthquake in Central Taiwan. Ecol. Model. 2011, 222, 835–845. [Google Scholar] [CrossRef]
- Duan, L.; Xiang, M.; Yang, J.; Wei, X.; Wang, C. Dynamics and Change Features of the Eco-Environment Restoration in the Worst Hit Area of a Strong Earthquake. Planning 2020, 15, 819–825. [Google Scholar] [CrossRef]
- Opricovic, S.; Tzeng, G.H. Multicriteria planning of post-earthquake sustainable reconstruction. Comput.-Aided Civ. Infrastruct. Eng. 2002, 17, 211–220. [Google Scholar] [CrossRef]
- Campbell, J.B.; Wynne, R.H. Introduction to Remote Sensing; Guilford Press: New York, NY, USA, 2011. [Google Scholar]
- Giri, C.P. Remote Sensing of Land Use and Land Cover: Principles and Applications; CRC Press: Boca Raton, FL, USA, 2012. [Google Scholar]
- Liping, C.; Yujun, S.; Saeed, S. Monitoring and predicting land use and land cover changes using remote sensing and GIS techniques—A case study of a hilly area, Jiangle, China. PLoS ONE 2018, 13, e0200493. [Google Scholar] [CrossRef]
- Kim, S.; Kim, J.; Kim, J. National disaster scientific investigation and disaster monitoring using remote sensing and geo-information. Korean J. Remote Sens. 2019, 35, 763–772. [Google Scholar]
- Pettorelli, N.; Laurance, W.F.; O’Brien, T.G.; Wegmann, M.; Nagendra, H.; Turner, W. Satellite remote sensing for applied ecologists: Opportunities and challenges. J. Appl. Ecol. 2014, 51, 839–848. [Google Scholar] [CrossRef]
- Cohen, W.B.; Goward, S.N. Landsat’s role in ecological applications of remote sensing. Bioscience 2004, 54, 535–545. [Google Scholar] [CrossRef]
- Avtar, R.; Komolafe, A.A.; Kouser, A.; Singh, D.; Yunus, A.P.; Dou, J.; Kumar, P.; Gupta, R.D.; Johnson, B.A.; Minh, H.V.T. Assessing sustainable development prospects through remote sensing: A review. Remote Sens. Appl. Soc. Environ. 2020, 20, 100402. [Google Scholar] [CrossRef] [PubMed]
- Dell’Acqua, F.; Gamba, P. Remote sensing and earthquake damage assessment: Experiences, limits, and perspectives. Proc. IEEE 2012, 100, 2876–2890. [Google Scholar] [CrossRef]
- Yamazaki, F.; Liu, W. Remote sensing technologies for post-earthquake damage assessment: A case study on the 2016 Kumamoto earthquake. In Proceedings of the 6th Asia Conference on Earthquake Engineering, Cebu City, Philippines, 22–24 September 2016; p. 8. [Google Scholar]
- Zhao, X.; Pan, S.; Sun, Z.; Guo, H.; Zhang, L.; Feng, K. Advances of satellite remote sensing technology in earthquake prediction. Nat. Hazards Rev. 2021, 22, 03120001. [Google Scholar] [CrossRef]
- Kang, J.; Wang, Z.; Cheng, H.; Wang, J.; Liu, X. Remote Sensing Land Use Evolution in Earthquake-Stricken Regions of Wenchuan County, China. Sustainability 2022, 14, 9721. [Google Scholar] [CrossRef]
- Wang, J.; Wang, Z.; Cheng, H.; Kang, J.; Liu, X. Land Cover Changing Pattern in Pre-and Post-Earthquake Affected Area from Remote Sensing Data: A Case of Lushan County, Sichuan Province. Land 2022, 11, 1205. [Google Scholar] [CrossRef]
- Wang, M.; Yang, W.; Shi, P.; Xu, C.; Liu, L. Diagnosis of vegetation recovery in mountainous regions after the Wenchuan earthquake. IEEE J. Sel. Top. Appl. Earth Obs. Remote Sens. 2014, 7, 3029–3037. [Google Scholar] [CrossRef]
- Rodriguez, J.; Ustin, S.; Sandoval-Solis, S.; O’Geen, A.T. Food, water, and fault lines: Remote sensing opportunities for earthquake-response management of agricultural water. Sci. Total Environ. 2016, 565, 1020–1027. [Google Scholar] [CrossRef] [Green Version]
- Motamed, H.; Ghafory-Ashtiany, M.; Amini-Hosseini, K. An earthquake risk-sensitive model for spatial land-use allocation. In Proceedings of the 15th World Conference on Earthquake Engineering, Lisbon, Portugal, 24–28 September 2012. [Google Scholar]
- Run, C.; Xinyi, G.; Jie, D.; Xiao, H. Monitoring of disturbance on ecological environment caused by earthquake and post-disaster reconstruction at heye village area of jiuzhaigou using the high-resolution remote sensing imageries. Quat. Sci. 2020, 40, 1350–1358. [Google Scholar]
- Xiang, M.; Deng, Q.; Duan, L.; Yang, J.; Wang, C.; Liu, J.; Liu, M. Dynamic monitoring and analysis of the earthquake Worst-hit area based on remote sensing. Alex. Eng. J. 2022, 61, 8691–8702. [Google Scholar] [CrossRef]
- Pandey, H.P.; Gnyawali, K.; Dahal, K.; Pokhrel, N.P.; Maraseni, T.N. Vegetation loss and recovery analysis from the 2015 Gorkha earthquake (7.8 Mw) triggered landslides. Land Use Policy 2022, 119, 106185. [Google Scholar] [CrossRef]
- Yang, J.; Huang, X. The 30 m annual land cover dataset and its dynamics in China from 1990 to 2019. Earth Syst. Sci. Data 2021, 13, 3907–3925. [Google Scholar] [CrossRef]
- Ning, J.; Liu, J.; Kuang, W.; Xu, X.; Zhang, S.; Yan, C.; Li, R.; Wu, S.; Hu, Y.; Du, G. Spatiotemporal patterns and characteristics of land-use change in China during 2010–2015. J. Geogr. Sci. 2018, 28, 547–562. [Google Scholar] [CrossRef] [Green Version]
- Gong, P.; Wang, J.; Yu, L.; Zhao, Y.; Zhao, Y.; Liang, L.; Niu, Z.; Huang, X.; Fu, H.; Liu, S. Finer resolution observation and monitoring of global land cover: First mapping results with Landsat TM and ETM+ data. Int. J. Remote Sens. 2013, 34, 2607–2654. [Google Scholar] [CrossRef] [Green Version]
- Yi, L.; Zhang, G. Object-oriented remote sensing imagery classification accuracy assessment based on confusion matrix. In Proceedings of the 2012 20th International Conference on Geoinformatics, Shatin, Hong Kong, 15–17 June 2012; pp. 1–8. [Google Scholar]
- Hasmadi, M.; Pakhriazad, H.; Shahrin, M. Evaluating supervised and unsupervised techniques for land cover mapping using remote sensing data. Geogr. Malays. J. Soc. Space 2009, 5, 1–10. [Google Scholar]
- Rwanga, S.S.; Ndambuki, J.M. Accuracy assessment of land use/land cover classification using remote sensing and GIS. Int. J. Geosci. 2017, 8, 611–622. [Google Scholar] [CrossRef] [Green Version]
- Kang, J.; Wang, Z.; Sui, L.; Yang, X.; Ma, Y.; Wang, J. Consistency analysis of remote sensing land cover products in the tropical rainforest climate region: A case study of Indonesia. Remote Sens. 2020, 12, 1410. [Google Scholar] [CrossRef]
- Pontius, R.G., Jr.; Millones, M. Death to Kappa: Birth of quantity disagreement and allocation disagreement for accuracy assessment. Int. J. Remote Sens. 2011, 32, 4407–4429. [Google Scholar] [CrossRef]
- Shi, G.; Jiang, N.; Yao, L. Land use and cover change during the rapid economic growth period from 1990 to 2010: A case study of Shanghai. Sustainability 2018, 10, 426. [Google Scholar] [CrossRef]
- Gao, P.; Niu, X.; Wang, B.; Zheng, Y. Land use changes and its driving forces in hilly ecological restoration area based on gis and rs of northern china. Sci. Rep. 2015, 5, 11038. [Google Scholar] [CrossRef] [Green Version]
- Chen, Z.; Zhang, Q.; Li, F.; Shi, J. Comprehensive Evaluation of Land Use Benefit in the Yellow River Basin from 1995 to 2018. Land 2021, 10, 643. [Google Scholar] [CrossRef]
- Huang, M.H.; Wu, D.; Wu, Y.; Wang, S. Analysis of land use extent changes and their spatial heterogeneity in the Chaohu Lake watershed. Soils 2015, 47, 994–1000. [Google Scholar]
- Liu, B.; Pan, L.; Qi, Y.; Guan, X.; Li, J. Land use and land cover change in the Yellow River Basin from 1980 to 2015 and its impact on the ecosystem services. Land 2021, 10, 1080. [Google Scholar] [CrossRef]
- Xi, Y.; Thinh, N.X.; Li, C. Spatio-temporal variation analysis of landscape pattern response to land use change from 1985 to 2015 in Xuzhou City, China. Sustainability 2018, 10, 4287. [Google Scholar] [CrossRef] [Green Version]
- Bürgi, M.; Hersperger, A.M.; Schneeberger, N. Driving forces of landscape change-current and new directions. Landsc. Ecol. 2005, 19, 857–868. [Google Scholar] [CrossRef]
- Peng, J.; Wang, Y.; Ye, M.; Wu, J.; Zhang, Y. Effects of land-use categorization on landscape metrics: A case study in urban landscape of Shenzhen, China. Int. J. Remote Sens. 2007, 28, 4877–4895. [Google Scholar] [CrossRef]
- Kang, J.; Sui, L.; Yang, X.; Wang, Z.; Huang, C.; Wang, J. Spatial pattern consistency among different remote-sensing land cover datasets: A case study in Northern Laos. ISPRS Int. J. Geo-Inf. 2019, 8, 201. [Google Scholar] [CrossRef] [Green Version]
- Wang, F.-X.; Zhou, W.-C. The Study on Land Use Changes of Wenchuan Disaster Area based on RS and GIS. In Proceedings of the 2009 2nd International Congress on Image and Signal Processing, Tianjin, China, 17–19 October 2009; pp. 1–5. [Google Scholar]
- Wang, L.; Tian, B.; Masoud, A.; Koike, K. Relationship between remotely sensed vegetation change and fracture zones induced by the 2008 Wenchuan earthquake, China. J. Earth Sci. 2013, 24, 282–296. [Google Scholar] [CrossRef] [Green Version]
- Yang, X.; Yang, W.-N.; Li, Y.-H.; Hu, B.-R. Land Use Land Cover Change Analysis after the Earthquake of Wenchuan. In Proceedings of the 2010 International Conference on Multimedia Technology, Ningbo, China, 29–31 October 2010; pp. 1–4. [Google Scholar]
- Long, H.; Qu, Y. Land use transitions and land management: A mutual feedback perspective. Land Use Policy 2018, 74, 111–120. [Google Scholar] [CrossRef]
- Liu, Y.; Wu, K.; Cao, H. Land-use change and its driving factors in Henan province from 1995 to 2015. Arab. J. Geosci. 2022, 15, 247. [Google Scholar] [CrossRef]
- Chen, K.; Long, H.; Liao, L.; Tu, S.; Li, T. Land use transitions and urban-rural integrated development: Theoretical framework and China’s evidence. Land Use Policy 2020, 92, 104465. [Google Scholar] [CrossRef]
- Peng, B.; Fu, Y. Impact characteristics of human disturbance on land-use and landscape ecology pattern, Lushan, Southwest China. IOP Conf. Ser. Earth Environ. Sci. 2019, 227, 052050. [Google Scholar] [CrossRef]


| Reference Data | ||||||||||||
|---|---|---|---|---|---|---|---|---|---|---|---|---|
| Evaluation Data | Cropland | Forest | Shrub | Grassland | Water | Snow/Ice | Bare land | Built-up | Wetland | UA(%) | CE(%) | |
| Cropland | 30 | 1 | 1 | 2 | 1 | 1 | 83.33 | 16.67 | ||||
| Forest | 81 | 7 | 4 | 1 | 87.10 | 12.90 | ||||||
| Shrub | 2 | 7 | 43 | 7 | 72.88 | 27.12 | ||||||
| Grassland | 4 | 8 | 1 | 55 | 1 | 2 | 2 | 1 | 74.32 | 25.68 | ||
| Water | 1 | 22 | 95.65 | 4.35 | ||||||||
| Snow/Ice | 1 | 7 | 87.50 | 12.50 | ||||||||
| Bare land | 1 | 1 | 11 | 2 | 73.33 | 26.67 | ||||||
| Built-up | 2 | 1 | 1 | 39 | 90.70 | 9.30 | ||||||
| Wetland | 1 | 4 | 80.00 | 20.00 | ||||||||
| PA(%) | 81.08 | 83.51 | 78.18 | 77.46 | 91.67 | 77.78 | 78.57 | 88.64 | 80.00 | |||
| OE(%) | 18.92 | 16.49 | 21.82 | 22.54 | 8.33 | 22.22 | 21.43 | 11.36 | 20.00 | |||
| OA(%) | 82.02 | |||||||||||
| Reference Data | ||||||||||||
|---|---|---|---|---|---|---|---|---|---|---|---|---|
| Evaluation Data | Cropland | Forest | Shrub | Grassland | Water | Snow/Ice | Bare land | Built-up | Wetland | UA(%) | CE(%) | |
| Cropland | 36 | 2 | 1 | 2 | 1 | 1 | 83.72 | 16.28 | ||||
| Forest | 107 | 7 | 5 | 3 | 2 | 1 | 85.60 | 14.40 | ||||
| Shrub | 2 | 7 | 37 | 4 | 74.00 | 26.00 | ||||||
| Grassland | 3 | 7 | 4 | 52 | 2 | 2 | 1 | 73.24 | 26.76 | |||
| Water | 1 | 27 | 1 | 93.10 | 6.90 | |||||||
| Snow/Ice | 1 | 7 | 87.50 | 12.50 | ||||||||
| Bare land | 1 | 10 | 2 | 76.92 | 23.08 | |||||||
| Built-up | 2 | 48 | 96.00 | 4.00 | ||||||||
| Wetland | 1 | 5 | 83.33 | 16.67 | ||||||||
| PA(%) | 85.71 | 86.29 | 75.51 | 77.61 | 84.38 | 77.78 | 76.92 | 90.57 | 83.33 | |||
| OE(%) | 14.29 | 13.71 | 24.49 | 22.39 | 15.63 | 22.22 | 23.08 | 9.43 | 16.67 | |||
| OA(%) | 83.29 | |||||||||||
| Reference Data | ||||||||||||
|---|---|---|---|---|---|---|---|---|---|---|---|---|
| Evaluation Data | Cropland | Forest | Shrub | Grassland | Water | Snow/Ice | Bare land | Built-up | Wetland | UA(%) | CE(%) | |
| Cropland | 30 | 3 | 1 | 1 | 2 | 81.08 | 18.92 | |||||
| Forest | 92 | 8 | 2 | 1 | 89.32 | 10.68 | ||||||
| Shrub | 7 | 44 | 5 | 78.57 | 21.43 | |||||||
| Grassland | 5 | 7 | 2 | 62 | 3 | 1 | 77.50 | 22.50 | ||||
| Water | 30 | 100.00 | 0.00 | |||||||||
| Snow/Ice | 2 | 9 | 81.82 | 18.18 | ||||||||
| Bare land | 1 | 1 | 14 | 2 | 77.78 | 22.22 | ||||||
| Built-up | 1 | 0 | 56 | 98.25 | 1.75 | |||||||
| Wetland | 1 | 4 | 80.00 | 20.00 | ||||||||
| PA(%) | 83.33 | 83.64 | 81.48 | 84.93 | 93.75 | 75.00 | 93.33 | 91.80 | 100.00 | |||
| OE(%) | 16.67 | 16.36 | 18.52 | 15.07 | 6.25 | 25.00 | 6.67 | 8.20 | 0.00 | |||
| OA(%) | 85.89 | |||||||||||
| Land Cover Type | Bare land, Snow/Ice | Forest, Grassland, Shrub, Water | Cropland | Built-Up |
|---|---|---|---|---|
| Grading index | 1 | 2 | 3 | 4 |
| Name | Composite Index | Composite Index Rate (%) | |||
|---|---|---|---|---|---|
| 2015 | 2017 | 2020 | 2015–2017 | 2017–2020 | |
| Yongfeng | 206.97 | 206.70 | 206.34 | −0.13 | −0.18 |
| Guoyuan | 209.36 | 209.58 | 211.88 | 0.10 | 1.09 |
| Luoyi | 219.30 | 219.21 | 218.41 | −0.04 | −0.37 |
| Anle | 205.32 | 205.76 | 206.91 | 0.21 | 0.56 |
| Caodi | 203.66 | 203.51 | 203.72 | −0.07 | 0.10 |
| Majia | 199.50 | 200.00 | 200.04 | 0.25 | 0.02 |
| Yongle | 219.39 | 219.53 | 220.62 | 0.06 | 0.50 |
| Zhangzha | 197.34 | 198.95 | 198.52 | 0.81 | −0.22 |
| Baihe | 202.41 | 202.54 | 202.81 | 0.06 | 0.13 |
| Dalu | 200.15 | 200.12 | 200.09 | −0.01 | −0.02 |
| Heihe | 200.93 | 201.07 | 201.07 | 0.07 | 0.00 |
| Yonghe | 207.37 | 206.42 | 212.03 | −0.46 | 2.72 |
| Baohua | 226.46 | 225.50 | 228.42 | −0.42 | 1.29 |
| Wujiao | 201.65 | 201.60 | 201.51 | −0.03 | −0.04 |
| Shuanghe | 208.41 | 208.15 | 209.01 | −0.12 | 0.41 |
| Lingjiang | 200.42 | 200.55 | 200.54 | 0.07 | −0.01 |
| Yuwa | 200.56 | 200.54 | 200.52 | −0.01 | −0.01 |
| 2015 Land Cover Type | 2017 Land Cover Type | ||||||||
|---|---|---|---|---|---|---|---|---|---|
| Cropland | Forest | Shrub | Grassland | Water | Snow/Ice | Bare land | Built-Up | Wetland | |
| Cropland | 93.3021 | 0.6237 | 0.1269 | 6.3729 | 0.0144 | 0 | 0 | 0.0162 | 0 |
| Forest | 3.5874 | 3416.2695 | 5.9958 | 0 | 0 | 0 | 0 | 0.0036 | 0 |
| Shrub | 0.6444 | 0.702 | 32.8833 | 3.1968 | 0 | 0 | 0 | 0 | 0 |
| Grassland | 2.5173 | 2.4183 | 0.8316 | 1662.0669 | 1.1304 | 0 | 4.0833 | 0.0189 | 0 |
| Water | 0.0072 | 0.0117 | 0 | 0.594 | 3.3507 | 0 | 0.0279 | 0 | 0 |
| Snow/Ice | 0 | 0 | 0 | 0.1089 | 0.0108 | 2.4102 | 0.2061 | 0 | 0 |
| Bare land | 0.0018 | 0 | 0 | 4.1823 | 0.0414 | 1.6704 | 18.801 | 0 | 0 |
| Built-up | 0 | 0 | 0 | 0 | 0.0009 | 0 | 0 | 2.3823 | 0 |
| Wetland | 0.0009 | 0 | 0 | 0 | 0 | 0 | 0 | 0 | 0.0063 |
| 2017 Land Cover Type | 2020 Land Cover Type | ||||||||
|---|---|---|---|---|---|---|---|---|---|
| Cropland | Forest | Shrub | Grassland | Water | Snow/Ice | Bare land | Built-Up | Wetland | |
| Cropland | 91.0512 | 3.5739 | 0.4338 | 4.9023 | 0.0279 | 0 | 0 | 0.072 | 0 |
| Forest | 3.2157 | 3411.8919 | 4.9086 | 0 | 0 | 0 | 0 | 0.009 | 0 |
| Shrub | 0.8784 | 4.9203 | 31.1526 | 2.8908 | 0 | 0 | 0 | 0 | 0 |
| Grassland | 12.8007 | 6.8805 | 2.1744 | 1641.2742 | 1.5372 | 0 | 11.8116 | 0.0432 | 0 |
| Water | 0.0027 | 0.0054 | 0 | 0.8892 | 3.2013 | 0 | 0.4482 | 0.0018 | 0 |
| Snow/Ice | 0 | 0 | 0 | 0.234 | 0.0189 | 1.3032 | 2.5245 | 0 | 0 |
| Bare land | 0 | 0 | 0 | 7.1019 | 0.0504 | 0.3573 | 15.6087 | 0 | 0 |
| Built-up | 0 | 0 | 0 | 0 | 0 | 0 | 0 | 2.421 | 0 |
| Wetland | 0 | 0 | 0 | 0.0036 | 0 | 0 | 0 | 0 | 0.0027 |
| Source | Region | Method | Conclusion |
|---|---|---|---|
| Peng et al. [55] | Lushan, Southwest China | landscape ecology method, GIS technology | It is concluded that there exists a positive correlation between the land-use change in the earthquake-stricken areas and the intensity of human disturbance, and between the change in the landscape pattern index and the intensity of human disturbance. |
| Xiang et al. [30] | Beichuan County in Sichuan Province | Vegetation Coverage, Vegetation Coverage Transfer Matrix, Geodetector | The artificial measures have promoted eco-environment restoration and accelerated the restoration speed of regional eco-environment. |
| Balamurugan et al. [7] | Western Coast of Gujarat, India | Comparative analysis of land cover area in different periods | The output shows a decline in the agricultural and scrubland, an increase in fallow land and saltpans, and exponential increases in built-up regions in the area. |
Publisher’s Note: MDPI stays neutral with regard to jurisdictional claims in published maps and institutional affiliations. |
© 2022 by the authors. Licensee MDPI, Basel, Switzerland. This article is an open access article distributed under the terms and conditions of the Creative Commons Attribution (CC BY) license (https://creativecommons.org/licenses/by/4.0/).
Share and Cite
Bian, Z.; Zhang, D.; Xu, J.; Tang, H.; Bai, Z.; Li, Y. Study on the Evolution Law of Surface Landscape Pattern in Earthquake-Stricken Areas by Remote Sensing: A Case Study of Jiuzhaigou County, Sichuan Province. Sustainability 2022, 14, 13032. https://doi.org/10.3390/su142013032
Bian Z, Zhang D, Xu J, Tang H, Bai Z, Li Y. Study on the Evolution Law of Surface Landscape Pattern in Earthquake-Stricken Areas by Remote Sensing: A Case Study of Jiuzhaigou County, Sichuan Province. Sustainability. 2022; 14(20):13032. https://doi.org/10.3390/su142013032
Chicago/Turabian StyleBian, Zongpan, Dongdong Zhang, Jun Xu, Hongtao Tang, Zhuoli Bai, and Yan Li. 2022. "Study on the Evolution Law of Surface Landscape Pattern in Earthquake-Stricken Areas by Remote Sensing: A Case Study of Jiuzhaigou County, Sichuan Province" Sustainability 14, no. 20: 13032. https://doi.org/10.3390/su142013032