Abstract
A general consensus has been reached among many countries that low-carbon development is important for the protection of the environment and the mitigation of climate change. In line with the attitude of a responsible country, China urges enterprises to participate in energy conservation and emission reduction through various policies. Based on the faultline theory, this paper considers the data of 124 listed companies in China’s manufacturing industry from 2015 to 2019 as a research sample. From the perspective of corporate governance, this analysis discusses the influence of the aggregation effect of the multiple characteristics of board members on the environmental protection benefits of enterprises, and empirically studies the board group. The relationship between the faultline and the carbon performance of the enterprise is further investigated, and the internal slack resources of the enterprise are further investigated in relation to the board members and the moderating effect. The study found that the existence of the board’s bio-demographic-related faultline has a positive effect on the carbon performance level of enterprises, but it is not statistically significant. The existence of the board’s task-related faultline has a positive effect on the carbon performance level of the enterprise. Further research found that precipitated slack resources have a significant negative moderating effect on the relationship between the existence of boardroom faultlines and corporate carbon performance, and that the relationship had a positive moderating effect, but was not statistically significant. The preceding conclusions not only enrich the research on corporate internal governance in theory, but also provide useful guidance for how to improve corporate environmental protection behavior on a microlevel in practice.
1. Introduction
On 9 August 2021, the Intergovernmental Panel on Climate Change (IPCC) released a report entitled “Climate Change 2021: A Natural Science Basis”. The report pointed out that compared to pre-1900 temperatures, the Earth has warmed by 1.1 °C, and the greenhouse gases emitted by humans and their production activities have had a significant impact on the temperature increase. Therefore, developing a low-carbon economy and establishing a new development model for energy conservation and emission reduction has become an important topic of global concern. Due to the increasingly severe situation involving global climate change, China is facing mounting pressure to reduce carbon emissions. The Central Economic Work Conference held from 8 to 10 December 2021, proposed that one of the eight key tasks should be carbon peaking and carbon neutrality; that is, limiting cumulative carbon dioxide emissions and limiting global warming to a specific level—at least zero net carbon dioxide emissions—while substantially reducing other greenhouse gas emissions.
China is a developing country with a large population. In the past 40 years, China’s economic development has often, although not always, come at the expense of the environment, dominated by the model of extensive economic growth. China features heavy-duty industrial infrastructure, and its energy consumption mainly relies on non-renewable energy sources. The long-term accumulation of environmental pollution and ecological deterioration threatens the sustainable development of China’s economy. Therefore, the task of achieving carbon peaking and carbon neutrality is a long-term process and cannot be accomplished overnight. As the torch-bearers of the national economy, enterprises not only play a role in stimulating the economy, driving industry, digesting labor resources, and supporting finance and taxation for the country or a region [1], but also should respond to the national call to develop a low-carbon economy. In fact, climate change also affects the entire process of raw material procurement, transportation, production, and even sales, and affects the development of enterprises in all directions and at multiple levels. Low-carbon transformation has become an inevitable choice for enterprises to cultivate low-carbon competitiveness and achieve sustainable development [2].
For enterprises, pollution control and emission reduction are not only a legal and social responsibility but also a realistic need for survival. Enterprises are not only the main body of the market economy but also the main body of environmental protection and an important participant in environmental protection. As stakeholders such as the public, government, and investors begin to pay attention to corporate carbon emissions, companies must control the carbon emissions generated by companies and, at the same time, promote and supervise the enterprise’s carbon emission-reduction plan. Enhanced corporate carbon performance can achieve long-term sustainable development of enterprises. In the new stage of China’s economy which is turning to high-quality development, enterprises can only find a way out if they take the initiative to assume responsibility for environmental governance. With economic development and social progress, the state has introduced various new policies for low-carbon emission reduction, which have gradually transformed the behavior of enterprises from implementing a positive environment under the pressure of external regulations to the active and conscious behavior of enterprises [3]. The government and other external stakeholders are making more demands on enterprises to turn to non-financial indicators such as environmental protection than just financial indicators. It is hoped that enterprises will adopt even greater social responsibilities. At the same time, a series of measures and behaviors taken by enterprises to protect the environment can have an impact on the social image of the enterprise, increase the value of the enterprise, and thus affect the cost of capital of the enterprise. Scholars such as Porter and Vender Linde (1995) believe that in the context of appropriate environmental regulation, enterprises can be encouraged to carry out more innovative activities, thereby reducing the risks brought by the threat of carbon emissions and improving the productivity and resource use efficiency of enterprises.
A series of measures formulated and adopted by enterprises to protect the environment is the result of implementing the corporate governance mechanism and, to a certain extent, reflects the enterprise’s operating ability and market performance. For example, Rob Gray and Jan Bebbington specifically expounded the relationship between corporate governance and enterprises’ environmental protection investment behavior [4]. Peters and Romi argue that corporate governance mechanisms, as a set of institutional arrangements for coordinating the relationship between companies and stakeholders, play a key role in addressing companies’ environmental and climate-related risks and monitoring companies’ participation in carbon plans and that, to a large extent, this affects the attitude of shareholders and directors who represent the interests of shareholders toward the environment [5]. Furthermore, the role of internal corporate governance in taking decisive measures to manage and control GHG emissions is crucial for seeking a strategic competitive advantage [6,7].
As the core of the corporate governance mechanism, the board of directors undertakes the tasks of allocating resources for the company’s strategy, providing creative thinking, and establishing connections with the outside world [8,9]. The board of directors provides governance guarantees for the company’s shareholders’ rights and contractual employment relationship. Based on the principal-agent theory, the board of directors is the institution of collective decision-making management activities, so the level of board governance is directly related to the effect of corporate governance and corporate performance. The existing literature has confirmed the relationship between board characteristics and environmental performance. Mallin et al. explored the incentive role of the board of directors from the perspective of resource dependence theory and studied the relationship between board characteristics and corporate social performance. He believes that the board of directors can design an effective compensation structure to motivate self-serving executives to engage in environmental activities [10]. Following this integrated theoretical framework, Villiers et al. found significant relationships between board monitoring and incentive roles, resource allocation roles, and environmental performance. When the board plays the role of supervision and incentive, the independence of the board and the relative power of the CEO to the appointment of the board have a positive impact on environmental performance, whereas the level of board ownership and the duality of chairman and CEO have a negative impact on environmental performance. When the board plays the role of resource allocation, the size of the board and the proportion of directors with legal background have a positive impact on environmental performance, whereas the tenure of directors and the interlocking nature of the board have a negative impact on environmental performance [11]. Zou Hailiang et al. proposed that there is a close relationship between board characteristics and environmental performance. Among them, the independence of the board of directors, the chain nature of the board of directors, and the size of the board of directors have a positive impact on environmental performance, and the shareholding of the board of directors has a negative impact on environmental performance, which confirms the importance of the board of directors in fulfilling corporate environmental responsibility [12]. As a branch of environmental performance, carbon performance is also closely related to the characteristics of the board of directors. Haque analyzed 256 non-financial companies in the United Kingdom and found that board independence, board diversity, and compensation plans based on environmental–social governance have a positive impact on corporate carbon performance, whereas the chain of boards has a negative impact on corporate carbon performance [7]. Therefore, the board of directors, as the formulation body for enterprises to fulfill strategic decisions such as social responsibility and innovation, is the key for enterprises to actively reduce emissions and improve carbon performance [13].
The board of directors is a group composed of members with different characteristics. The differences in the characteristics of the members within the board will have an impact on the behavior of the members, and thus on the decision-making of the board. As the state vigorously advocates energy conservation and emission reduction and continuously promulgates relevant policies and regulations, considering the strategic and resource advantages that may be brought about by environmental protection, members of the board of directors, who are the core of the corporate governance mechanism, may influence companies to adopt environmental protection and reduce greenhouse gas emissions. Therefore, board members will have an important influence on decisions about corporate carbon emissions and the economic benefits of corporate low-carbon behavior [6,7,14,15,16]. The existing literature research focuses on the impact of the single characteristics of board members on corporate low-carbon behavior. Some scholars consider the dispersion of the characteristics of board members; that is, the heterogeneity of board members has an impact on corporate environmental protection behavior. The theory of faultlines points out that the consistency of differences among board members will have an impact on the behavior of members and thus on the decision-making of the board. At present, there are few studies on the interaction between the characteristics of board members and the environmental behavior of enterprises; that is, the existing literature ignores the impact of the interaction between the single characteristics of board members on the low-carbon behavior of enterprises.
Agency theory believes that managers tend to maintain the redundancy of internal resources because of their pursuit of power and job security, which makes the organization and its managers maintain the existence of slack resources [17]. On the one hand, enterprises are not always functioning within the optimal state of resource utilization, and idle resources are common. On the other hand, organization theory believes that slack resources have positive effects on enterprises, such as supporting innovation, reducing conflicts, buffering environmental changes, and ensuring organizational stability. Therefore, there is a complex, non-linear correlation between slack resource and firm performance. Moreover, studies have shown that resource redundancy is closely related to innovation and enterprise growth. Some scholars have proven the moderating effect of corporate slack resources on corporate performance. However, there are few empirical studies on the relationship between corporate slack resources and environmental management, that is, how corporate slack resources affect corporate low-carbon behavior. Based on this, we infer that there are differences in the impact of board group faultlines on corporate carbon performance in different redundant resource situations. Therefore, it is necessary to discuss the relationship between different types of resource redundancy and the relationship between board group faultlines and corporate carbon performance in future research.
Although some scholars have explored the relationship between board characteristics and corporate carbon performance, they still face the following problems. First, most of the relevant articles in the literature only studies the relationship between board characteristics and environmental performance or corporate carbon disclosure, or the relationship between corporate carbon performance and financial performance. Few articles in the literature discuss the impact on corporate carbon performance from the perspective of board members’ characteristics. Secondly, most of the existing studies consider the impact of the single characteristics of board members on corporate carbon performance, ignoring the impact of the aggregation effect between board members with overlapping multiple characteristics on corporate carbon performance, that is, the impact of board group faultlines and corporate carbon performance. In addition, there is a lack of relevant literature to study the moderating effect of corporate redundant resources on board group faultlines and corporate carbon performance. Some scholars have proven the moderating effect of corporate redundant resources on corporate performance. Based on this, we infer that there are differences in the impact of board group faultlines on corporate carbon performance in different redundant resource situations. Therefore, there is a lack of relevant literature that studies the moderating effect of corporate redundant resources on board group faultlines and corporate carbon performance. Fourth, in the quantification of enterprise carbon performance indicators, more domestic and foreign scholars are from the KLD database, carbon disclosure report (CDP) database or enterprise annual report to collect carbon emission reduction data. However, the number of Chinese enterprises participating in CDP reports is small, and there are few enterprises that can voluntarily disclose carbon emission data. Therefore, it is still unable to meet the complete, comprehensive and objective requirements in measuring carbon performance indicators.
Based on this, this paper will take China’s A-share manufacturing listed companies from 2015 to 2019 as research samples, collect data on the characteristics, finance and carbon emissions of board members of listed companies, rely on information decision-making, social classification and other theories, refer to the idea of group faultlines, and analyze the relationship between group faultlines of board members and corporate carbon performance. This paper also considers the moderating effect of resource redundancy on the relationship between board faultlines and corporate carbon performance. This article has the following contributions. This paper intends to carry out relevant research on carbon performance from the perspective of internal governance in corporate governance, focusing on the role of the interaction between the characteristics of corporate board members in corporate carbon performance. The research content of this paper not only fills the research gap of the thought of board group faultlines in enterprise carbon performance, but also enriches the existing research situation. We hope that through this study, we can improve the relationship between the characteristics of board members and corporate carbon performance, in order to better support business and government energy conservation plans.
2. Theoretical Analysis and Research Assumptions
The concept of group faultlines was proposed by Lau and Murnighan in 1998. Their study outlines a set of imaginary dividing lines that divide a group into several subgroups based on one or more similar characteristics of group members. The basic idea is that the consistency, rather than the dispersion, of differences in demographic characteristics affects group member behavior [18]. When one or more members of a group have some common characteristics, they will aggregate together based on these common characteristics to form a subgroup, that is, a small team. There is a strong similarity within the same subgroup. There will be greater variability between different subgroups based on member characteristics. Each subgroup has different behavioral characteristics. Communication, disagreement, alienation or contradiction can arise between different groups, which interact and influence each other in the process of group activities. The group faultline idea takes into account the multiplicity of individual characteristics and their aggregation, and to a certain extent solves the problem that team heterogeneity is independent of the group’s members, which may have more explanatory significance than traditional research on individual heterogeneity. Existing studies are usually combined and divided into different types of fault zones according to different characteristics, and there are differences in the mechanism of action and the results of different types of faultlines. Existing studies generally divide group fault zones into task-related faultlines and bio-demographic related faultlines.
Different types of board group faultlines will also have an impact on the board’s decision-making behavior and governance effects. As the elite of the company’s decision-making control system, the board members have a wide range of educational backgrounds, functional backgrounds, and industry backgrounds. That is, they have board diversity. The diversity of the board of directors can be divided into two categories: one is the diversity of the overall structure of the board of directors, and the other is the diversity of the characteristics of the members of the board of directors. That is, the heterogeneity of the board of directors. Board heterogeneity includes gender, ethnicity, age, tenure, education, and occupational experience heterogeneity, which shows the dispersion of board member characteristics. In an enterprise, the increased heterogeneity of group membership can cause board members with the same characteristics to attract each other and members with different characteristics to repel each other, thus forming a virtual “dividing line” between board members. This line is the board of directors’ group faultline. Some studies have shown that the group faultline formed according to the different characteristics of the members will have an impact on the company’s innovative decision-making, violations, and diversification strategies [9,19,20,21,22]. The board group faultline theory breaks the previous limitations based on the heterogeneity of individual members’ characteristics and explores the impact of “cooperation–conflict” behavior among board members with multiple overlapping characteristics on decision making and its effectiveness. A single board characteristic will have an impact on the decision-making behavior of enterprises. It can be inferred that the aggregation effect produced by the overlapping board characteristics of multiple characteristics will also affect the governance behavior of the board to a certain extent. Therefore, different types of board group faultlines divided by multiple characteristics will also have an impact on board decision-making behavior and governance effect.
The concept of carbon performance is not uniform in the existing literature. According to Table 1, the definition of the concept of carbon performance in the relevant literature is summarized, and carbon performance can be defined in two ways: broad and narrow. Carbon performance, in a broad sense, refers to the overall effect of an enterprise’s resource recycling, continuous improvement of governance measures, and pollution control, which is generally qualitative rather than quantitative. In a narrow sense, carbon performance is the economic or environmental effect achieved by enterprises after actual environmental governance, such as the reduction of emission pollution. Although different scholars have different expressions, the main points concern the effects and economic benefits produced by enterprises through a series of environmental protection behaviors (see Table 1). In general, the level of corporate carbon performance reflects the effectiveness of the results of the operation of the corporate governance mechanism and also reflects corporate management capabilities and market performance. Therefore, this paper draws on the existing literature on carbon emissions and the definition of the concept of environmental performance in a narrow sense, and integrates the “carbon emissions” indicator into the enterprise management evaluation system to measure the carbon performance of enterprises. The measurement of corporate carbon performance is based on the amount of reduction in corporate carbon emissions.

Table 1.
Definition of carbon performance concept.
2.1. Bio-Demographic Faultlines and Carbon Performance
Bio-demographic related faultlines are formed by differences in members’ innate traits that are immediately perceived by other members of the team and are almost immutable. They are usually measured by differences in members’ physiological characteristics in terms of age, gender, and nationality (race). Social classification theory, social identity theory, and similarity attraction theory argue that team members are classified based on homogeneous characteristics and tend to select people of the same category to interact and communicate to form different subgroups [30,31,32]. Studies have shown that the existence of a group faultline related to physiological characteristics makes members of different subgroups emotionally estranged, and members are less willing to communicate and cooperate with each other, and even form hostile emotions [33]. Members of the same subgroup will identify with each other [34], and there is discrimination between members of different subgroups [31]. Board members are divided into relatively fixed different subgroups within the board of directors by age, gender, and other characteristics. The cognitive level, values, and behavioral preferences of each subgroup are relatively consistent, and the differences in cognitive level among different subgroups are relatively large. Therefore, the existence of bio-demographic faultlines makes members identify with their own subgroup rather than other subgroups or the whole team [35].
The responsibilities of the board of directors mainly include formulating the business strategy of the company and providing the key resources required for corporate governance. These resources include advice and consultation on the legality of the company’s existence, communication channels for information transmission, priority access to key environmental resources, and important interests, such as stakeholder support, etc. In response to global climate change, the Chinese government has formulated low-carbon emission reduction targets and promulgated a series of emission reduction policies and regulations that will inevitably have favorable or unfavorable impacts on enterprises. In order to ease the pressure of government regulation, enterprises must formulate relevant energy-saving and emission-reduction strategies. Energy conservation and emission reduction belong to the scope of corporate social responsibility, with a long payback period and high risks, so the impact on enterprises is long-term and uncertain. Therefore, how to carry out environmental investment not only needs the support of the company’s existing resources but also requires the board of directors to reach a consensus through discussion.
Due to the existence of bio-demographic faultlines of the board of directors, the cognitive characteristics of different subgroups are quite different, and the views and attitudes of members of different genders and age groups on environmental issues may tend to be inconsistent. For example, women are “loving, sensitive, and gentle,” so female directors tend to be more risk-averse. The government enacts various regulations and policies to urge companies to implement energy conservation and emission reduction policies. Based on the principle of legitimacy, female board members are inclined to request the company to take relevant measures to respond to the government’s regulatory pressure in order to reduce risks, and to release the message to the public that the company is actively protecting the environment. At the same time, men are more characterized by ambition, independence and “good struggle”, and usually pay more attention to short-term economic benefits. Due to the uncertainty of the return on energy conservation and emission-reduction measures and the long investment cycle, male board members may be less positive than female board members.
Therefore, the existence of the bio-demographic related faultline of the board of directors will intensify the conflicts among its members, lead to prejudice and discrimination among the board subgroups, hinder the communication and cooperation of the board members on environmental investment, hinder the decision-making process such as carbon emissions, and reduce the effectiveness of internal corporate governance, which in turn negatively impacts a firm’s carbon performance. Therefore, the strength of the board’s bio-demographic related faultline will have a negative impact on the carbon performance of the company. Therefore, the following is proposed.
Hypothesis 1.
Bio-demographic related faultlines in the boardroom negatively affect corporate carbon performance.
2.2. Board Task-Related Faultlines and Carbon Performance
Task-related faultlines refer to the faultlines caused by differences in knowledge and viewpoints related to work tasks due to differences in the characteristics of team members. This is generally measured by characteristics such as educational background, functional background, and expertise knowledge. Board members are highly diverse with different educational and professional backgrounds as well as differing areas of expertise. The greater the diversity of the board team, the more professional knowledge and perspective it brings, and therefore, the more helpful it is for the board to make accurate decisions. In the process of formulating energy conservation and emission-reduction measures for enterprises and actively cooperating with the government, the board of directors will encounter a series of problems such as enterprise operation risks and insufficient internal and external resources. Due to the uncertainty of the operating environment and the continuous promulgation of various policies by the government, it is difficult for the board of directors to make optimal decisions in a short period of time when faced with a large amount of information and data that exceeds the company’s capacity. And in the decision-making process, each board member has different opinions and viewpoints due to different experiences and cognitions. However, due to the existence of the task-related faultline, board members are divided into small groups, and members of each group share their views with each other and pass their own information to other people in the group. Because internal members identify with each other, the information shared by other members is carefully considered and discussed, and a relatively unanimous opinion is finally reached. The existence of task-related faultlines makes members of the board of directors form subgroups, and subgroups will first reach a certain consensus when making major decisions. Therefore, task-related faultlines can reduce competition among subgroups and help companies make correct and high-quality decisions [36], which saves time and improves decision-making efficiency.
Under the social background of the deep transformation of the global economy, “low carbon and environmental protection” is regarded as a universal business ethical and moral standard by which enterprises should abide. Business operations should comply with this recognized business ethic and, indeed, ethics need to be demonstrated by the behavior and results of energy conservation and emission reduction. Therefore, when the state advocates the protection of the environment and encourages enterprises to implement energy conservation and emission reduction measures, the differences in the professional skills, knowledge background, and functional background of the board members can prompt the board members to quickly understand and absorb different types of market information and operational standards that the government requires. These differences will help the rapid flow, exchange, and sharing of knowledge and information among board members, avoid the phenomenon of “group thinking” in the process of group decision-making, and help the board to make optimal decisions that are beneficial to the enterprise. Therefore, when making decisions on energy conservation and emission-reduction measures, due to the existence of faultlines related to the board’s tasks, the board of directors can weigh the pros and cons and make the right choice, thereby promoting the carbon performance of the enterprise. Therefore, the following is proposed.
Hypothesis 2.
Board task-related faultlines positively affect corporate carbon performance.
2.3. Precipitated Slack Resources, Board Group Faultline and Corporate Carbon Performance
Resource redundancy, also known as slack resources, literally refers to excess, temporarily idle resources in an enterprise. For example, Bromiley defines it as “the available excess resources stored by an organization within a given planning cycle.” From the perspective of organizational theory, the redundancy of corporate resources provides the board of directors and managers with opportunities to pursue organizational goals [37]. Sharfman et al. divided slack resources into two categories: non-precipitation slack resources and precipitation slack resources [38,39]. Non-precipitated slack resources include surplus cash, cash equivalents, and credit quotas, and precipitated slack resources include remunerations paid to employees above market prices, management fees, semi-finished products, idle production equipment, etc. Precipitated slack resources have been embedded in the enterprise process, poor liquidity, and strong specificity, not easy to reconfigure. Reduced randomness in the use of such redundant resources makes it difficult for managers to translate them into specific resources for low-carbon activities in the short term [40]. Therefore, such resources are highly “sticky”, and it takes a certain amount of time to convert them to meet other needs, and the conversion cost between different types of slack resources is very high [41].
Precipitated slack resources are generally closely related to the core business or key business of the enterprise and can protect the “core” of the organization when the enterprise faces difficulties. To a certain extent, the precipitation of slack resources is more responsible for the “buffer” role proposed by organizational theory. However, due to close connection with the core business of the enterprise, the precipitation of slack resources is characterized by a certain “concealment”, and the time required for resource conversion is relatively long. When the enterprise has fewer accumulated slack resources, it is not easy for the enterprise to immediately search for these slack resources to support the projects invested in by the enterprise.
Low-carbon investment and management by enterprises may increase operating and production costs in the short term and reduce competitiveness in the product market. At this time, enterprises need strong resources to maintain long-term, low-carbon behavior, thus creating a long-term competitive advantage through technological innovation and the enhancement of the company’s reputation. The precipitation slack resources of the enterprise correspond to the existing projects of the enterprise and cannot be converted into the required resources at will. The precipitation slack resources also have a certain degree of ambiguity, and their accurate identification requires the enterprise to spend a certain amount of time and cost. When enterprises make decisions and implement low-carbon activities, the precipitation of slack resources cannot immediately support them due to their characteristics, and even restrict enterprises’ energy conservation, emission reduction, and environmental protection behaviors under certain circumstances. Therefore, the following is proposed.
Hypothesis 3.
Precipitated slack resources negatively regulate the relationship between the bio-demographic-related faultlines of the board of directors and corporate carbon performance, that is, the more precipitated slack resources, the greater the negative impact of bio-demographic related faultlines on corporate carbon performance.
Hypothesis 4.
Precipitated slack resources have a negative moderating effect on the relationship between board task-related faultlines and corporate carbon performance, that is, the more precipitated slack resources there are, the less positive the impact of task-related faultlines on corporate carbon performance.
2.4. Non-Precipitated Slack Resources, Board Group Faultline and Corporate Carbon Performance
Non-precipitated slack resources generally have an impact on enterprises in the following aspects. First, non-precipitated slack resources are resources such as cash and cash equivalents. When liquidity is high, the adjustment cost of resource allocation is relatively low. When enterprises carry out long-term environmental protection and energy-saving and emission-reduction behaviors, the impact on enterprises caused by the use of non-precipitating slack resources is relatively gentle. Secondly, non-precipitating slack resources are security resources owned by enterprises, which can not only provide relatively stable cash flow for enterprises, but can also be suitable for various situations faced by enterprises and can resist the external environment to a certain extent. It is able to resist to some extent the difficulties caused by the external environment and help the company to better cope with the changes in the external environment [42]. When there are a large number of non-precipitating slack resources available, enterprises can not only pursue long-term projects with higher risks, higher returns, and longer time, but can also invest in short-term projects within shorter times and at higher returns. Thirdly, enterprises can reconfigure non-precipitating slack resources into projects that can enhance corporate value and corporate reputation. It can also improve the allocation efficiency of existing resources and enhance the competitive advantage of enterprises. At the same time, if the enterprise has relatively more non-precipitated slack resources, out of personal and corporate interests, the decision-makers and the board of directors of the enterprise will be quite eager to seek value-added investment opportunities for the non-precipitated slack resources. Although the implementation of carbon emission-reduction projects by enterprises is a long-term project, enterprises with high carbon performance levels will not only be able to establish a green corporate image in the external environment but will also obtain competitive environmental resources, a good business environment, and enhanced technical skills. This is beneficial for the enterprise to establish a long-term competitive advantage, and it is also beneficial to the brand building of the enterprise. At the same time, the board of directors and relevant stakeholders are actively looking for feasible projects for non-precipitated slack resources for the sake of improving corporate value and safeguarding their own interests. Therefore, non-precipitating slack resources will increase the opportunity for enterprises to engage in low-carbon behavior. Therefore, the following is proposed.
Hypothesis 5.
Non-precipitated slack resources positively regulate the relationship between the bio-demographic-related faultlines of the board of directors and corporate carbon performance; that is, the more non-precipitated slack resources, the greater the negative impact of bio-demographic related faultlines on corporate carbon performance.
Hypothesis 6.
Non-precipitated slack resources positively moderate the relationship between board task-related faultlines and corporate carbon performance. That is, the more non-precipitated slack resources, the greater the positive impact of task-related faultlines on corporate carbon performance.
Based on the six hypotheses presented in the previous section, the conceptual model of this paper can be derived. Details are shown in Figure 1.
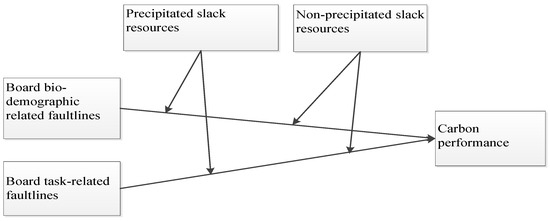
Figure 1.
Conceptual model.
3. Study Design
3.1. Sample Selection and Data Sources
The manufacturing industry is the industry with the highest energy consumption in the country, which covers many subsectors. In order to ensure that the research objects are high energy-consuming sub-sectors, this paper ranks the energy consumption of the manufacturing sub-sectors (see Table 2), and selects the top five subsectors in terms of energy consumption, namely the ferrous metal smelting and rolling processing industry, chemical raw material and chemical product manufacturing industry, non-metallic mineral product industry, petroleum, coal, and other fuel processing industry, non-ferrous metal smelting and rolling processing industry.
Table 2.
Manufacturing industry segments and the proportion of energy consumption in 2019.
In order to ensure that the characteristic data of each enterprise board member is complete, when processing the characteristic data of the board members of the enterprise, as long as the enterprise lacks certain characteristic information of a member, the enterprise will not be considered for use. By the end of 2021, the China Statistical Yearbook will only publish the latest data on industrial energy consumption up to 2019. Therefore, after excluding ST and *ST companies and companies with missing data, the time interval of the sample data selected in this paper is from 2015–2019, a total of 620 samples were obtained from 124 companies. The original data used in this study came from the China Statistical Yearbook, the CSMAR database, and the annual reports of various companies. Most of the variables, such as corporate carbon performance, faultlines of the board of directors, etc., are obtained by calculating and sorting out the relevant raw data.
3.2. Variable Definition
- (1)
- Dependent variable: carbon performance. Regarding the definition and measurement methods of carbon performance, this paper believes that relatively mature environmental performance can be referred to. Trump divided environmental performance into two dimensions: environmental management performance (EMP) and environmental operational performance (EOP). The study found that EMP focuses on capturing the strategic dimensions of environmental performance (environmental policies, objectives, processes, monitoring and organizational structure), whereas EOP captures the actual and quantifiable results of EMP [43]. Similarly, Busch and Hoffinann refer to the definition and measurement of environmental performance, using two different criteria to measure carbon performance: carbon management strategy (process-oriented) and greenhouse gas emissions (result-oriented) [44]. Referring to the existing literature, this paper represents the carbon performance of enterprises as the ratio of the current main business income of enterprises to carbon emissions to measure the carbon emissions per unit of income of enterprises [24]. That is, the lower carbon emissions, the higher corporate carbon performance.
- (2)
- Independent variable. The calculation of the faultline has attracted continuous attention from academia since it was proposed. Thatcher et al. first developed a measure of the group faultline, and proposed to use the Fau algorithm to quantify the strength of the group fracture, that is, to measure the degree to which the overall difference of the group is explained by the difference of the subgroup by the ratio of the between-group variance to the overall variance. It is one of the most widely used measurement methods in current research [45]. In the same year, Gibson et al. developed the subgroup strength algorithm, Shaw developed the FLS algorithm, and Trezzini developed the PMDcat algorithm [46,47,48]. Bezrukova et al. developed the Fau×De exponential algorithm based on the Fau algorithm, expanded the understanding of faultlines by Thatcher et al. at the structural level, and further optimized the Fau algorithm index, but also inherited the limitations of the Fau indicator’s subjectivity in the processing of variables and the insufficiency of only measuring two subgroups [49]. Knippenberg et al. developed the Fk algorithm to determine the degree of group split by the correlation between the attributes of the group faultline [50]. In the same year, Lawrence et al. proposed the LCCA index, which is suitable for cluster analysis of multiple binary variables [51]. Meyer et al. developed the average silhouette width (ASW) algorithm, which also uses clustering to classify groups [52].
In general, research of the faultline method has gradually deepened from the previous qualitative description and simple classification to the measurement of multi-attribute alignment, subgroup identification, subgroup structure (subgroup number, scale, equilibrium, dependency relationship), subgroup classification accuracy test [53,54], etc. Different faultline measurement methods have their own advantages and disadvantages in the three dimensions of data processing, subgroup structure, and accuracy testing. According to Liu Xuexin and Cao Xiaofang [55], the comprehensive comparison of the several faultline measurement methods, it is found that the ASW algorithm is suitable for the situation where the talented team is divided into three or more subgroups, and can calculate categorical variables and continuous variables at the same time, and satisfies all the ideal properties of the faultline measure. Therefore, the ASW algorithm is used in this paper to calculate the physiological characteristic faultline of the board and the task-related faultline. The ASW algorithm measures how well a group member matches subgroup A relative to subgroup B under a particular partition. The specific formula is as follows:
Here, is the intracluster dissimilarity, which refers to the average distance from an individual i to other individuals in the same group, and is the inter-cluster dissimilarity, which refers to the average distance between an individual i and other groups of individuals. takes value ranges from −1 to 1, and if it is greater than 1, it indicates that the clustering effect is good, and if it is less than 1, it indicates that the clustering effect is not good. takes value of 1 indicates that the divided subgroups are completely homogeneous; that is, the strength of the faultline is the largest, and the value of 0 indicates that there is no subgroup with internal homogeneity, and the negative value indicates that the difference between the members of the subgroup under this classification method is greater than the difference between the members in the subgroup and the members outside the subgroup.
According to the relevant literature, the board group faultline is divided into the board bio-demographic faultline (demo) and the board task-related faultline (task). Typically, the bio-demographic faultline of the board consists of the age, gender, and ethnicity of the board members. According to the specific information of board members of listed companies in China, it can be concluded that the racial categories of board members are relatively simple. Therefore, this paper will use the age and gender of board members to measure the bio-demographic faultlines of the board. Drawing on relevant research, the task-related faultline-measurement indicators are composed of tenure, education, and occupational background. Among them, tenure is measured by the length of time served by the board members. Educational indicators are divided into five categories: below junior college, junior college, undergraduate, master’s, and doctoral degree. The professional background consists of ten categories, including production, R&D, design, human resources, management, marketing, finance, etc. Because one person may have multiple occupational backgrounds due to his or her rich occupational experience, a board member with one occupational background is recorded as 1, two occupational backgrounds as 2, and so on.
- (3)
- Moderator variable: slack resources. According to the existing literature, this paper divides slack resources into two types: precipitated slack resources and non-precipitated slack resources. Drawing on the financial index measurement method proposed by Bourgeois [56] to measure the internal resource endowment of enterprises and use financial data to represent slack resources [57,58,59]. Therefore, the measurement method of the moderator variable in this paper is as follows: the non-precipitated slack resources are measured by the current ratio, which reflects the number of resources available for immediate use by the enterprise. With regard to precipitated slack resources, drawing on the practice of Greenley et al., because the management cost is oriented to specific management activities in the organization, its transformation and utilization will be subject to time constraints. This is in line with the characteristics of precipitated slack resources [60]. Therefore, this paper uses the proportion of management costs to sales revenue to measure.
- (4)
- Control variable. Based on the existing research conclusions, the company size, company age, return on assets, ownership concentration, capital intensity, tangible asset ratio, and other indicators such as control variables, reflect the profitability of the company, operating capacity, and solvency. It aims to control the impact of financial performance and board group characteristics on corporate carbon performance. The specific variable definitions are shown in Table 3.
Table 3. Variable definition.
3.3. Model Construction
Based on the above, in order to verify the impact of board group faultlines on corporate carbon performance, the following model is constructed:
In the formula: is the constant term, is the influence coefficient of the bio-demographic related faultline on the enterprise carbon performance, is the influence coefficient of the task characteristic faultline on the enterprise carbon performance, is the influence coefficient of the precipitation slack resources on the enterprise carbon performance, is influence coefficient of the non-precipitation slack resources on corporate carbon performance, , , , are the influence coefficients of the interaction terms of two independent variables and two moderating variables on the internationalization strategy, respectively, are the influence coefficients of each control variable on corporate carbon performance, and ε is the error term.
4. Analysis of Empirical Results
4.1. Analysis of Descriptive Statistical Results
Table 4 reflects the descriptive statistics of all variables. As far as the sample data is concerned, the results show that the minimum value of carbon performance is 0.091 and the maximum value is 7.071, indicating that the carbon performance levels of different enterprises are quite different, and the average value is only 0.38. The mean value is 1.412, indicating that the carbon performance level of most sample companies is low, and there is a lot of room for improvement. The minimum value of the fracture line strength of physiological characteristics is 0.403, and the maximum value is 0.913, indicating that in the sample companies, the gender ratio and age gap in different board groups are large. However, in some companies, the age and gender of board members in different subgroups are almost the same. The minimum value of task-related faultline strength is 0.498, the maximum value is 0.964, and the mean value is 0.765, indicating that there are relatively small differences in terms of office, educational background and functional background among the subgroups formed by the board members of different sample companies. The minimum value of the slack resource value is 0.004, the maximum value is 1.148, and the average value is 0.105, whereas the minimum value of the precipitation slack resource value is 0.094, the maximum value is 26.62, and the average value is 2.13. It shows that the gap between the special assets of different manufacturing enterprises is small, while the current assets have a large gap. Generally speaking, there are many non-precipitated slack resources in manufacturing enterprises, and there are commonly precipitated slack resources.
Table 4.
Descriptive statistics of variables.
4.2. Correlation Analysis
This paper uses Stata 15.0 software and the Pearson analysis method to test the correlation between variables. The results are shown in Table 5. According to the correlation analysis results in Table 5, the absolute values of the correlation coefficients between variables are all less than 0.6, indicating that there is no serious multicollinearity problem in the model, which is less likely to have a serious impact on the regression results (Lind, 2002) [61]. In order to avoid the possibility of a high “composite” correlation coefficient between variables and to further test whether the model has multicollinearity, it is necessary to calculate the test variance inflation factor (VIF) value of each variable. According to Table 6, it can be seen that in all regression equations, the maximum VIF value is 1.25, which is far less than the standard of 10. Therefore, there is no multicollinearity problem in the regression results of this paper.
Table 5.
Correlation coefficient table.
Table 6.
VIF inspection.
4.3. Regression Results and Analysis
The Hausman test was used to determine whether each model should be a random-effects model or a fixed-effects model. It can be seen from Table 7 that the p values of the Hausman test in all models are less than 0.01, which indicates that each model is suitable for using a fixed-effect regression model.
Table 7.
Regression results.
This paper uses the fixed-effect model in STATA 15.0 software to analyze the relationships between board group bio-demographic related faultlines, board task-related faults, and corporate carbon performance, and the moderating effect of slack resources on the relationship between board group bio-demographic-related faultlines, board task-related faultlines and corporate carbon performance. Among them, Model 1 and Model 2 are the regression results of the board group’s bio-demographic-related faultlines, task-related faultlines, and corporate carbon performance. Model 3 and Model 4 are based on Model 1 and Model 2, plus the interaction term between precipitating slack resources and board group bio-demographic-related faultlines and task-related faultlines to test the moderating effect of precipitating slack resources. Models 5 and 6 build on Models 1 and 2, plus the interaction terms of non-precipitating slack resources with board population bio-demographic-related faultlines and task-related faultlines to test the moderating effects of non-precipitating slack resources.
It can be seen from Model 1 that the constant is negative, and the direction of the coefficient is in line with expectations, but the relationship between the bio-demographic related faultlines of the board group and the carbon performance of the enterprise is not significant (β = −0.134, p > 0.10), so Hypothesis 1 does not get support. Model 2 shows a significant positive correlation between board group task-related faultlines and corporate carbon performance (β = 0.208, p < 0.10), indicating that the presence of board task-related faultlines can promote the improvement of corporate carbon performance. Model 2 shows that the force aggregated by the heterogeneity of a single board member can promote the environmental protection behavior of enterprises and improve their carbon performance. So, Hypothesis 2 is supported. From the results of Model 3, it can be seen that the precipitation slack resources have a negative moderating effect on the relationship between the bio-demographic-related faultline of the board of directors and the carbon performance of enterprises (β = −2.787, p < 0.05). It shows that with the increase of sedimentary slack resources, the negative impact of bio-demographic-related faultlines on corporate carbon performance is greater. Due to the relatively strong specificity of precipitation slack resources, it has a negative impact on the improvement of corporate carbon performance, which is consistent with the expected direction, so Hypothesis 3 is supported. Model 4 results show that precipitation slack resources have a significant negative moderating effect on the relationship between board task-related faultlines and corporate carbon performance (β = −2.584, p < 0.10). This shows that the more precipitation slack resources, the smaller the positive impact of task-related faultlines on corporate carbon performance. Even the diverse decisions of board members cannot change the inherent resource constraints of a business. Although board members with diverse occupations and experiences have a strong ability to receive and process information and accept new things, it is undeniable that a large number of slack resources will limit the development of enterprises. So, Hypothesis 4 is supported.
From the results of Model 5 and Model 6, it can be seen that although the coefficient direction of regression results is consistent with expectation, the non-precipitation slack resources are not significant to the board bio-demographic-related faultline and enterprise carbon performance (β = 0.099, p > 0.10). Moreover, the positive moderating effect of non-precipitation slack resources on the relationship between task-related faultlines and corporate carbon performance (β = 0.006, p > 0.10) is not significant. Therefore, Hypotheses 5 and 6 are not supported. Compared with the precipitated slack resources, the non-precipitated slack resources are not embedded in the enterprise and have higher liquidity, which can not only play a certain buffering role in the face of changes in the external environment but also provide enterprises with support for new projects. According to the results of Model 5 and Model 6, although p > 0.10, according to the direction of the coefficient, the non-precipitation slack resources play a certain positive role in the relationship between the physiologically related faultlines and task-related faultlines of the board of directors and corporate carbon performance.
4.4. Robustness Check
In order to ensure the reliability of the research conclusions, this paper adopts the method of changing variables to measure the indicators to carry out the following demonstration [59], and the quick ratio is used to analyze the redundancy of precipitation resources. Based on the research results of Du Yushen, Liu Ziyu [62], Li Xiaoxiang, Huo Guoqing, Liu Chunlin [63], use the ratio of the sum of sales expenses and management expenses to sales revenue to determine the non-precipitation redundancy of enterprises. The larger the ratio, the better the non-precipitated slack resources of the enterprise, the enterprise size, enterprise age, return on capital, return on equity, and capital intensity are introduced as control variables. The variables were brought into the model and the fixed effect regression analysis was carried out again. It was found that the conclusion was consistent with the research conclusion of this paper, which fully indicated that the research conclusion of this paper was robust.
5. Conclusions and Discussion
Based on the perspective of board member group faultlines, this paper takes a total of 620 samples of 124 listed companies in the manufacturing industry from 2015 to 2019 as the research object, and analyzes the impact of the bio-demographic-related faultlines of board and task-related faultlines on the carbon performance of enterprises, and the moderating effect of precipitating slack resources and non-precipitating slack resources is discussed. The main research results are as follows. (1) The task faultline divided by members of the board of directors according to their educational background, term of office, and functional background will have a significant impact on the carbon performance of the enterprise. That is, the greater the strength of the board task-related faultlines, the more conducive it is to improve the carbon performance level of the enterprise. The members of the board of directors are divided into subgroups according to their received education, professional training, and other experience. Due to the communication and integration of personal experience and professional skills in the group, their understanding of various aspects of information and their acceptance of new things will be enhanced. The research in this paper shows that the board group task-related faultline will have a positive impact on the carbon performance level of enterprises. (2) The long-term accumulation of precipitation slack resources will affect the effect of the board faultline on the carbon performance of enterprises. The more resource redundancy, the greater the negative impact of bio-demographic-related faultlines’ strength on enterprise carbon performance and the smaller the positive impact of task-related faultline strength on enterprise carbon performance level. Therefore, for manufacturing enterprises, precipitated slack resources limit the development of new projects due to their high specificity and high conversion cost. Due to their high specificity and high conversion cost, slack resources limit the development of new projects by enterprises. Moreover, when there are fewer precipitation slack resources in the enterprise, it is not easy to detect, and even if it can be accurately identified, the enterprise often uses it as a tool to improve production efficiency, reduce production costs, and increase short-term performance. As a result, the existence of slack resources is frequently insufficient to support businesses. (3) The greater the strength of the bio-demographic-related faultline of the board of directors, the less conducive it is to improving the carbon performance level of enterprises, but the results are not statistically significant. The bio-demographic faultline is divided by the age, gender, and other characteristics of the board members. The way of thinking and the experience generated by age due to gender are innate and unique to each person. Therefore, the decision caused by these two characteristics is not easily changed. For the board members, promoting the development of the enterprise is the top priority, and it is a risky thing to protect the environment and reduce carbon emissions. Therefore, the greater the strength of the bio-demographic-related faultline, the less conducive to the improvement of the carbon performance level of the enterprise. (4) The greater the non-precipitation resource redundancy, the smaller the negative impact of physiologically related faultline strength on enterprise carbon performance, whereas the greater the task-related faultline strength, the stronger the positive impact on enterprise carbon performance level, although this did not pass the significance test. The non-precipitated resource redundancy is a liquid asset owned by the enterprise, which has the characteristics of high flexibility, liquidity, and low specificity. Thus, non-precipitation slack resources can help companies when they respond to government calls to implement environmentally friendly practices in their production processes. Consequently, non-precipitated slack resources can reduce the negative impact of boardroom bio-demographic-related faultlines on corporate carbon performance and enhance the positive impact of board task-related faultlines on corporate carbon performance.
This paper divides the group faultlines based on the demographics and educational characteristics of board members and reveals the impact of the strength of the faultlines on the carbon performance of the company. It provides some management implications for the communication, interaction, and information acquisition when the board of directors formulates the green strategy of the company. For example, in today’s increasingly intensified environmental supervision, when deciding the composition of the board of directors, we advise balancing the number of male and female directors and appointing board members of different ages to increase the voice of female directors in corporate environmental protection behavior and green production, minimizing the negative effects of bio-demographic faultline on board members’ green decisions. We advise reasonably arranging the number of board members with different educational backgrounds and functional backgrounds, optimizing the quality of board decisions, and strengthening the positive impact of board task fault lines on corporate board decisions. Enterprises should avoid the existence of a large number of slack resources and need to pay attention to the number of slack resources within the enterprise from time to time, convert them into available resources in time, avoid resource waste, and better support the environmental protection behavior of enterprises, etc.
Due to the limitation of research resources and personal level, the research presented in this paper also has the following limitations: This paper uses the personal characteristics of board members to calculate the strength of different faultlines, and the feature selection may not be sufficiently comprehensive. Future research may consider combining more individual characteristics for the calculation of faultline strength. In addition, this paper adopts a calculation method of the relative amount of carbon performance of enterprises, not the absolute amount of carbon performance, which may have errors with the economic benefits generated by the company’s real carbon emissions. Therefore, in the future, research can consider how to more accurately calculate the carbon performance level of enterprises.
Author Contributions
Conceptualization, all authors; methodology, B.Q. and Z.Y.; formal analysis, B.Q.; investigation, B.Q.; resources, B.Q. and Z.Y.; data curation, B.Q.; writing—original draft preparation, Q.B; writing—review and editing, B.Q. and Z.Y.; visualization, B.Q.; supervision, Z.Y.; project administration, B.Q.; funding acquisition, B.Q. All authors have read and agreed to the published version of the manuscript.
Funding
This research was funded by Doctoral Innovation Fund Project of North China University of Water Resources and Electric Power.
Institutional Review Board Statement
Not applicable.
Informed Consent Statement
Informed consent was obtained from all participants involved in the study.
Data Availability Statement
The data presented in this study are available on request from the corresponding author.
Conflicts of Interest
The authors declare no conflict of interest. The funders had no role in the design of the study; in the collection, analyses, or interpretation of data; in the writing of the manuscript; or in the decision to publish the results.
References
- Lu, F.S.; Qi, P. Research on the optimization strategy of beautiful rural construction in the rural revitalization strategy. Theor. J. 2020, 6, 141–150. [Google Scholar]
- Tan, D.M.; He, H.Q. Construction of enterprise carbon performance evaluation model based on the perspective of resource value stream analysis. Hunan Soc. Sci. 2016, 5, 115–119. [Google Scholar]
- Ren, G.Q.; Zhou, X.Y.; Li, X.Y.; Liu, L. Nature of property right, corporate governance and enterprises environment and behavior. J. Beijing Inst. Technol. 2021, 23, 44–55. [Google Scholar]
- Gray, R.H.; Bebbington, K.J. Accounting for the environment. Soc. Indic. Res. 1975, 2, 191–210. [Google Scholar]
- Peters, G.F.; Romi, A.M. Does the voluntary adoption of corporate governance mechanisms improve environmental risk disclosures? Evidence from greenhouse gas emission accounting. J. Bus. Ethics 2014, 125, 637–666. [Google Scholar] [CrossRef]
- Luo, L.; Tang, Q. Corporate governance and carbon performance: Role of carbon strategy and awareness of climate risk. Acc. Financ. 2020, 61, 2891–2934. [Google Scholar] [CrossRef]
- Haque, F. The effects of board characteristics and sustainable compensation policy on carbon performance of UK firms. Br. Account. Rev. 2017, 49, 347–364. [Google Scholar] [CrossRef]
- Tuggle, C.S.; Schnatterly, K.; Johnson, R.A. Attention patterns in the boardroom: How board composition and processes affect discussion of entrepreneurial issues. Acad. Manag. J. 2010, 53, 550–571. [Google Scholar] [CrossRef]
- Li, X.Q.; Zhou, J. On the Influence of board group faultline on corporate strategic performance: Moderating role of chairman functional background. Foreign Econ. Manag. 2015, 37, 3–14. [Google Scholar]
- Mallin, C.; Michelon, G. Board Reputation Attributes and Corporate Social Performance: An Empirical Investigation of the US Best Corporate Citizen. Account. Bus. Res. 2011, 41, 119–144. [Google Scholar] [CrossRef]
- Villiers, C.D.; Naiker, V.; Staden, C. The Effect of Board Characteristics on Firm Environmental Performance. J. Manag. 2011, 37, 1636–1663. [Google Scholar] [CrossRef]
- Zou, H.L.; Zeng, S.X.; Lin, H. Board Characteristics, Resource Slack and Environmental Performance: An Empirical Analysis of Manufacturing Listed Companies. J. Syst. Manag. 2016, 25, 193–202. [Google Scholar]
- Lu, Y.J.; Geng, Y.J. Corporate social responsibility and innovation of mixed-ownership enterprises. A perspective from board group. Collect. Essays Financ. Econ. 2020, 4, 73–83. [Google Scholar]
- Nuber, C.; Velte, P. Board gender diversity and carbon emissions: European evidence on curvilinear relationships and critical mass. Bus. Strateg. Environ. 2021, 30, 1958–1992. [Google Scholar] [CrossRef]
- Moussa, T.; Allam, A.; Elbanna, S.; Banicmustafa, A. Can board environmental orientation improve US firms’ carbon performance? The mediating role of carbon strategy. Bus. Strateg. Environ. 2020, 29, 72–86. [Google Scholar] [CrossRef]
- Liao, L.; Luo, L.; Tang, Q. Gender diversity, board independence, environmental committee and greenhouse gas disclosure. Br. Account. Rev. 2015, 47, 409–424. [Google Scholar] [CrossRef]
- Tan, J.; Peng, M.W. Organizational slack and firm performance during economic transitions: Two studies from an emerging economy. Strateg. Manag. J. 2003, 24, 1249–1263. [Google Scholar] [CrossRef]
- Lau, D.C.; Murnighan, J.K. Demographic diversity and faultlines: The compositional dynamics of organizational groups. Acad. Manag. Rev. 1998, 23, 325–340. [Google Scholar] [CrossRef]
- Fan, R.R.; Liao, G.W. Research on the influence of the faultline of the board of directors team on the innovation performance of enterprises—Based on the moderating effect of the degree of internationalization. Account. Learn. 2019, 9, 174–175. [Google Scholar]
- Ma, L.F.; Zhang, Y.F.; Gao, Y.F. Boardroom faultline and innovation strategic decision: Research on technology-intensive firms in A-Share. Front. Sci. Technol. Eng. Manag. 2018, 37, 37–43. [Google Scholar]
- Geng, X.; Wang, X.L. Impact of embeddedness of independent director network on enterprises’ diversification strategy? Moderating effects of slack resources and environmental uncertainty. R&D Manag. 2021, 33, 108–121. [Google Scholar]
- Liang, S.K.; Xu, C.Y.; Wang, R.H. Harmony in diversity as good governance: Board faultline and corporate fraud. J. World Econ. 2020, 43, 171–192. [Google Scholar]
- Wang, Z.L.; Guo, Y.Q.; Yang, Y. Research on comprehensive evaluation of carbon performance of Chinese enterprises. Ecol. Econ. 2017, 33, 47–50+86. [Google Scholar]
- Xie, Z.M.; Liu, X.Q. Research on the influence of board characteristics on enterprise carbon performance. Ecol. Econ. 2020, 36, 28–34. [Google Scholar]
- Guan, Y.M.; Zhao, R. Nature of property environmental regulation and corporate carbon performance. Chin. Certif. Public Account. 2018, 10, 56–61. [Google Scholar]
- Zhang, Y.L.; Liu, Q. Construction and calculation of enterprise carbon performance index system. Stat. Decis. 2020, 36, 166–169. [Google Scholar]
- Zhou, Z.F.; Xiao, T.; Zeng, H.X. Research on the correlation between corporate carbon performance and financial performance—Evidence from FTSE 350. J. Univ. Geosci. (Soc. Sci. Ed.) 2017, 17, 32–43. [Google Scholar]
- Wang, A.G. Connotation of carbon performance and construction of comprehensive evaluation index system. Financ. Account. 2014, 11, 41–44. [Google Scholar]
- Xiang, H.Y.; Zhang, T.J.; Liu, T. Design and thinking of low carbon performance evaluation system for Chinese enterprises. Econ. Herald. 2011, 5, 68–69. [Google Scholar]
- Turner, J.C.; Hogg, M.A.; Oakes, P.J. Rediscovering the Social Group: A Self-Categorization Theory; Basil Blackwell: Oxford, UK, 1987; Volume 94. [Google Scholar]
- Tajfel, H. The social identity theory of intergroup behavior. Psychol. Interg. Relat. 1986, 13, 7–24. [Google Scholar]
- Byrne, D.E. The Attraction Paradigm; Academic Press: New York, NY, USA, 1971. [Google Scholar]
- Li, J.; Hambrick, D.C. Factional groups: A new vantage on demographic faultlines, conflict, and disintegration in work teams. Acad. Manag. J. 2005, 48, 794–813. [Google Scholar] [CrossRef]
- Hogg, M.A.; Terry, D.J. Social identity and self-categorization processes in organizational contexts. Acad. Manag. Rev. 2000, 25, 121–140. [Google Scholar] [CrossRef]
- Liu, X.; Park, J.; Hymer, C.; SMB, T. Multidimensionality: A cross-disciplinary review and integration. J. Manag. 2019, 45, 197–230. [Google Scholar] [CrossRef]
- Williams, K.Y.; O’Reilly, C.A. Demography and diversity in organizations: A review of 40 years of research. Res. Organ. Behav. 1998, 20, 77–140. [Google Scholar]
- Bromiley, P. Testing a causal model of corporate risk taking and performance. Acad. Manag. J. 1991, 34, 37–59. [Google Scholar]
- Sharfman, M.P.; Wolf, G.; Chase, R.B.; Tansik, D.A. Antecedents of organizational slack. Acad. Manag. Rev. 1988, 13, 601–614. [Google Scholar] [CrossRef]
- Li, X.X.; Liu, C.L. Contextual analysis on the relationship between slack and firms’ performance: Also on quantitative change of slack. Nankai Bus. Rev. 2011, 3, 4–14. [Google Scholar] [CrossRef]
- Latham, S.F.; Braun, M.R. The Performance implications of financial slack during economic recession and recovery: Observations from the software industry (2001–2003). J. Manag. Issues 2008, 20, 30–50. [Google Scholar]
- Li, J.L. Exploratory innovation, exploitative innovation and enterprise’s performance: Empirical analysis based on moderating effect of characteristics of organizational structure. J. Tech. Econ. 2009, 27, 1418–1427. [Google Scholar]
- O’Brien, J.P. The capital structure implications of pursuing a strategy of innovation. Strateg. Manag. J 2003, 24, 415–431. [Google Scholar] [CrossRef]
- Trumpp, C.; Endrikat, J.; Zopf, C. Definition, Conceptualization, and Measurement of Corporate Environmental Performance: A Critical Examination of a Multidimensional Construct. J. Bus. Ethics 2015, 126, 185–204. [Google Scholar] [CrossRef]
- Ziegler, A.; Busch, T.; Hoffmann, V.H. Disclosed corporate responses to climate change and stock performance: An international empirical analysis. Energy Econ. 2011, 33, 1283–1294. [Google Scholar] [CrossRef]
- Thatcher, S.M.B.; Zanutto, K.A.J.E. Cracks in diversity research: The effects of diversity faultlines on conflict and performance. Group Decis. Negot. 2003, 12, 217–241. [Google Scholar] [CrossRef]
- Gibson, C.; Vermeulen, F. A healthy divide: Subgroups as a stimulus for team learning behavior. Admin. Sci. Q. 2003, 48, 202. [Google Scholar] [CrossRef]
- Shaw, J.B. The development and analysis of a measure of group faultlines. Organ. Res. Methods 2004, 7, 66–100. [Google Scholar] [CrossRef]
- Trezzini, B. Probing the group faultline concept: An evaluation of measures of patterned multi-dimensional group diversity. Qual. Q. 2008, 42, 339–368. [Google Scholar] [CrossRef]
- Bezrukova, K.; Jehn, K.A.; Zanutto, E.L.; Thatcher, S.M.B. Do workgroup faultlines help or hurt? A moderated model of faultlines, team identification, and group performance. Organ. Sci. 2009, 20, 35–50. [Google Scholar] [CrossRef]
- Knippenberg, D.V.; Dawson, J.F.; West, M.A.; Homan, A.C. Diversity faultlines, shared objectives, and top management team performance. Hum. Relat. 2011, 64, 307–336. [Google Scholar] [CrossRef]
- Lawrence, B.S.; Zyphur, M.J. Identifying organizational faultlines with latent class cluster analysis. Organ. Res. Methods 2011, 14, 32–57. [Google Scholar] [CrossRef]
- Meyer, B.; Glenz, A. Team faultline measures: A computational comparison and a new approach to multiple subgroups. Organ. Res. Methods 2013, 16, 393–424. [Google Scholar] [CrossRef]
- Thatcher, S.; Patel, P.C. Group faultlines: A review, integration, and guide to future research. J. Manag. 2012, 38, 969–1009. [Google Scholar] [CrossRef]
- Meyer, B.; Glenz, A.; Antino, M. Faultlines and subgroups: A meta-review and measurement guide. Small Group Res. 2014, 45, 633–670. [Google Scholar] [CrossRef]
- Liu, X.X.; Cao, X.F. Progress in group faultline measurement: A review. Bus. Manag. J. 2019, 41, 191–208. [Google Scholar]
- Bourgeois, L.J. On the measurement of organizational slack. Acad. Manag. Rev. 1981, 6, 29–39. [Google Scholar] [CrossRef]
- Jiang, C.Y.; Zhao, S.M. The relationship between organizational redundancy and performance: A time series empirical study of Chinese listed companies. Manag. World 2004, 5, 108–115. [Google Scholar]
- Huang, J.W.; Li, Y.H. Slack resources in team learning and project performance. J. Bus. Res. 2012, 65, 381–388. [Google Scholar] [CrossRef]
- Love, E.G.; Nohria, N. Reducing slack: The performance consequences of downsizing by large industrial firms, 1977–93. Strateg. Manag. J 2005, 26, 1087–1108. [Google Scholar] [CrossRef]
- Greenley, G.E.; Oktemgil, M. A Comparison of slack resources in high and low performing British companies. J. Manag. Stud. 1998, 35, 377–398. [Google Scholar] [CrossRef]
- Lind, A.; Marchal, W.G.; Mason, R.D. Statistical Techniques in Business and Economics; Irwin/Ma Graw-Hill: New York, NY, USA, 2002. [Google Scholar]
- Du, Y.S.; Liu, Z.Y. Slack resources, political connections, and profits of private enterprise innovation. Stud. Explor. 2020, 8, 122–130. [Google Scholar]
- Li, X.X.; Huo, G.Q.; Liu, C.L. Research on the slack measurement, distribution and effect based on available resources. Manag. Rev. 2014, 26, 22–33. [Google Scholar]

Publisher’s Note: MDPI stays neutral with regard to jurisdictional claims in published maps and institutional affiliations. |
© 2022 by the authors. Licensee MDPI, Basel, Switzerland. This article is an open access article distributed under the terms and conditions of the Creative Commons Attribution (CC BY) license (https://creativecommons.org/licenses/by/4.0/).