Abstract
To combat global warming, China proposed the “dual carbon” policy in 2020. In this context, it becomes crucial to improve carbon emissions efficiency. Currently, some scholars have utilized data envelopment analysis (DEA) to study carbon emissions efficiency. However, uncertainty about climate and government economic policy is ignored. This paper establishes a robust DEA model to reduce uncertainty and improve robustness. First, robust optimization theory is combined with DEA to establish the robust DEA model. Second, considering three uncertainty sets (box set, ellipsoid set, and polyhedron set), a robust DEA model for different situations is considered. Finally, to address the problem of over-conservatism in robust optimization, this paper applies the data-driven robust DEA model to further analyze the carbon emissions efficiency of China. The results of the data-driven robust DEA model suggest that the government should focus on coordinated regional development, promote the transformation and upgrading of the energy structure, innovate in green technology, and advocate for people to live a green and low-carbon lifestyle.
1. Introduction
Climate anomalies and frequent occurrence of extreme weather are global problems faced by mankind. With the continuous emission of carbon dioxide in various countries in the world, greenhouse gases have soared, posing a major threat to life systems [1]. A recent study by Huang et al. [2] found that under a 2 C global warming scenario, mortality rates associated with extreme temperatures would rise significantly. With the reform and opening up [3], China’s economic level has been continuously improving, but at the same time, environmental problems have become more and more prominent. China is currently the largest carbon emitter in Asia and the world, with annual emissions of nearly 10 million tons, more than a quarter of global emissions [4]. In this context, China has proposed the “dual carbon” policy, that is, to achieve a carbon peak by 2030 and carbon neutrality by 2060 [5].
Carbon emissions efficiency indicates the amount of that must be emitted to generate each unit of economic output [6]. Yamaji et al. [7] proposed carbon productivity for the first time. In the context of the “dual carbon” policy, improving carbon emissions efficiency becomes crucial. We plan to study carbon emissions efficiency in China in order to find the factors influencing carbon emissions efficiency. Previous scholars have adopted various methods to measure carbon emissions efficiency, and have achieved certain research results. There are two main methods for evaluating carbon emissions efficiency; one is the parametric method and the other is the non-parametric method. The former is represented by stochastic frontier analysis (SFA) and the latter is represented by DEA. SFA was first proposed by Aigner et al. [8] and Meeusen and Broeck [9] in 1977. It takes into account that the production frontier will be affected by random factors, sets the specific function form of the production frontier, and uses statistical methods to estimate the frontier production function. In recent years, some scholars have used SFA to evaluate the carbon emissions efficiency. Sun et al. [10] evaluated greenhouse gas emissions efficiency in China’s industry based on SFA. Sun and Huang [11] applied SFA to explore the impact of urbanization on carbon emissions efficiency. Zhang et al. [12] applied SFA to discuss the relationship between economic development and carbon emissions efficiency. However, SFA needs to set the function form of the SFA model and make assumptions about the distribution of the error term. If the assumption is improper, it will cause estimation deviation [13]. In addition, some scholars have applied the DEA method to green development efficiency [14] and to R&D activity efficiency [15].
DEA was first proposed in 1978 by Charnes et al. [16]. The classic DEA models are the CCR model and the BCC model [17]. Zhang et al. [6] applied the three-stage DEA-Tobit model to study carbon emission efficiency in the Chinese construction industry. Meng et al. [18] applied DEA model to measure China’s regional energy and carbon emissions efficiency. Cheng et al. [19] used an improved non-radial directional distance function (NDDF) to measure the carbon emissions efficiency of China’s provincial industrial sectors. Yan et al. [20] used the SBM model considering undesired output to study the carbon emissions efficiency of China’s thermal power industry.
However, previous studies on carbon emissions efficiency have ignored the uncertainty of the climate and governmental economic policies. Ben-Tal [21] pointed out that small perturbations can lead to large errors and even lead to infeasible solutions for the model. It can be seen that it is necessary to consider robust optimization when the environment is uncertain. Robust optimization is now widely used in many fields [22,23,24], such as the consensus field [25,26,27,28,29,30], supply chain management [31,32], the energy field [33], etc. Some scholars have combined robust optimization and DEA [34]. Sadjadi and Omrani adopted robust DEA for performance assessment of electricity distribution companies [35]. However, to the best of our knowledge, few scholars have applied robust DEA to the field of carbon emissions efficiency.
In addition, the existing robust optimization models have the drawback of being too conservative. Nowadays, in the era of big data, a data-driven approach can be adopted to alleviate this drawback. On the one hand, the robustness of the original robust model can be retained, and on the other hand, these models are closer to reality and not as conservative. The data-driven approach has been used in some fields, such as consensus aspects [26,36] and energy systems [37]. Some scholars have combined robust DEA and a data-driven approach [38]. However, to the best of our knowledge, few scholars have applied data-driven robust DEA to the field of carbon emissions efficiency.
Although the existing research on carbon emissions efficiency promotes our understanding of this field, there are several deficiencies.
- Few of the original carbon emissions efficiency studies have considered climate uncertainty and government economic policy uncertainty;
- The original robust optimization model is too conservative and deviates somewhat from the actual situation.
The main contributions of this paper lie in the following aspects:
- Due to the uncertainty of climate and government economic policies, robust DEA models are proposed to analyze the treatment;
- This paper proposes a data-driven robust DEA model to address the inherent over-conservatism of robust optimization;
- This paper uses real data to study the carbon emissions efficiency of China to verify the validity of the model.
The rest of the paper is organized as follows. Section 2 reviews the literature related to this research. Section 3 introduces the DEA model and builds the robust DEA model. Then, Section 4 presents empirical analysis and discussion. Section 5 applies the data-driven robust DEA model to further analyze the carbon emissions efficiency of China. Finally, Section 6 presents the conclusions. Detailed proof is displayed in Appendix A.
2. Literature Review
2.1. Carbon Emissions Efficiency
Carbon emissions efficiency indicates the amount of carbon dioxide that needs to be emitted when generating each unit of economic output.
Carbon emissions efficiency is the focus of current research by scholars. Carbon emissions efficiency is mainly calculated from two perspectives. One is the single-factor perspective and the other is the full-factor perspective. The single-factor perspective defines carbon emission efficiency as the ratio of two variables. There are two main single-factor carbon emission efficiency indicators. One is carbon productivity, which was first proposed by Kaya et al. in 1993 [7]. Carbon productivity is the ratio of GDP to emissions, i.e., GDP per unit of emissions. This indicator is based on GDP when measuring carbon efficiency. The second is the carbon index, which was proposed by Mielnik and Goldemberg [39]; its meaning is the carbon emissions per unit of energy consumption, that is, the ratio of total carbon emissions to total energy consumption, to measure carbon emission efficiency.
The above single-factor carbon emission efficiency indicators are simple to calculate and easy to understand, but they are controversial due to the large number of indicators they measure. For this reason, scholars have started to define carbon emission efficiency from the perspective of all factors. The full-factor perspective includes two approaches. One is the parametric method and the other is the non-parametric method. The former is represented by SFA and the latter is represented by DEA.
2.2. The Evolution of the Data-Driven Robust DEA Model
How to calculate carbon emissions efficiency is also a hot topic. Previous researchers have utilized numerous approaches to quantify carbon emissions efficiency and got specific study outcomes. The methods to assess the efficiency of carbon emissions can be divided into parametric and non-parametric methods. The former is represented by stochastic frontier analysis (SFA) [8,9], whereas the latter is represented by discrete event analysis (DEA) [16]. In recent years, several researchers have employed the SFA model to assess carbon emissions efficiency [10,11,12]. However, the SFA must define the function form of the SFA model and make assumptions about the error term distribution. If the assumption is incorrect, estimate deviation will occur [13].
DEA was first proposed in 1978 by Charnes et al. [16]. Cheng et al. [19] used an improved non-radial directional distance function (NDDF) to estimate the meta-frontier TCEI of China’s 30 provincial industrial sectors in 2005–2015 and analyzed their dynamic evolution. Ren et al. (2020) [40] contributed to measuring the energy and carbon emission efficiency (ECEE) of regional transportation systems (RTS) in China considering uncertain carbon emissions.
However, previous studies on carbon emissions efficiency have ignored the uncertainty of climate and government economic policies. Ben-Tal [21] pointed out that small perturbations can lead to large errors, and can even lead to no feasible solution for the model. Robust optimization is now widely used in many fields [22,23,24], such as the consensus field [25,26,27,28,29,30], supply chain management [31,32], the energy field [33], etc.
Furthermore, the drawback of present robust optimization models is that they are overly conservative. A data-driven approach can be used to mitigate this disadvantage. Some fields have used the data-driven approach, such as consensus aspects [26,36] and energy systems [37]. Some scholars have combined robust DEA and data-driven approaches [38]. However, to the best of our knowledge, few scholars have applied data-driven robust DEA to the field of carbon emissions efficiency.
2.3. General Comment
In general, the previous studies provide an important reference value for this literature, but there are still some deficiencies. Few of the original carbon emissions efficiency studies considered climate uncertainty and government economic policy uncertainty. The original robust optimization model is too conservative and deviates somewhat from the actual situation. Therefore, this paper constructs robust DEA to study the carbon emissions efficiency problem. Subsequently, in order to overcome the prsoblem of over-conservative robust optimization, this paper constructs a data-driven robust optimization model to further study the carbon emissions efficiency problem.
3. Model Construction
3.1. DEA
Suppose that there are n (decision making units), and has m inputs and s outputs . are the vectors of weight coefficients for the input and output indicators, respectively. We assume that these data are positive numbers. This paper selects labor, energy consumption and capital stock as inputs, and real GDP and carbon emissions as outputs. The DEA model is shown below:
Through the Charnes–Cooper transformation, this can be transformed into a linear programming model, the objective function of which is a linear function as follows:
In this context, refers to the effectiveness of decision-making units. Simultaneously, we use “≤” in our DEA model rather than “=” in the standard DEA model. We make this change to avoid any incompatibility.
Definition 1
([16]). If the optimal value of Model (2) is 1, the evaluated decision-making unit is valid; on the contrary, if the optimal value is less than 1, the evaluated decision-making unit is not valid.
Definition 2
([16]). We shall represent the production possibility set as:
According to Banker’s research [17], the production possible set (PPS) needs to satisfy the following four assumptions:
Assumption 1.
Convexity: if and are nonnegative scalars such that , then .
Assumption 2.
Inefficiency postulate: (a) if and , then . (b) If and , then .
Assumption 3.
Ray unboundedness: if , then .
Assumption 4.
Minimum extrapolation: T is the intersection set of all satisfying Assumptions 1–3, subject to the condition that each of the observed vectors .
In an uncertain economic environment, the outputs of decision-making units are often uncertain. This paper introduces robust optimization into the DEA model. Robust DEA considering uncertainty is proposed.
Next, based on the above model, this paper considers three situations, namely, the box set, ellipsoid set, and polyhedron set. Then, we consider the corresponding uncertainty sets.
3.2. RDEA Based on Uncertain Outputs with Box Set
Definition 3.
The box uncertainty set is defined as:
where τ is the uncertainty parameter that is used to assess the uncertainty of climate and government economic policies.
Theorem 1.
The robust DEA model using may then be built as follows:
The proof is in Appendix A.1.
3.3. RDEA Based on Uncertain Outputs with Ellipsoid Set
We now examine the model based on the ellipsoid set.
Definition 4.
The ellipsoid uncertainty set is defined as:
where Ω is the uncertainty parameter that is used to assess the uncertainty of climate and government economic policies.
Theorem 2.
The robust DEA model using may then be built as follows:
The proof is in Appendix A.2.
3.4. RDEA Based on Uncertain Outputs with Polyhedron Set
Last, we consider the polyhedron uncertainty set.
Definition 5.
Let us define the polyhedron set as:
where Γ is the uncertainty parameter that is used to assess the uncertainty of climate and government economic policies.
Theorem 3.
Then, the robust DEA model with can be constructed as:
The proof is in Appendix A.3.
Based on the above three theorems, the following theorems are proposed.
Theorem 4.
The larger the uncertainty level parameter, the smaller the efficiency value of the robust model.
The proof is in Appendix A.4.
Theorem 5.
Robust DEA has lower efficiency values than DEA models.
The proof is in Appendix A.5.
Some economic implications can be seen from the above conclusions; in reality, the decision-making unit may have certain risks when making decisions. For example, when governments make economic decisions, there may be some climate and government economic policy uncertainty. At this time, it can help to improve the robustness of the model. In addition, the government can also choose different parameters according to its own situation to adjust the robustness of the model. In this way, the government can achieve a balance between the economy and the environment under the background of the “dual-carbon“ policy.
4. Empirical Analysis and Discussions
4.1. Study Area
In order to scientifically reflect the economic development status of various parts of Chinese society, China’s economic regions are divided into four categories, namely eastern, central, western, and northeastern regions. This study will examine the differences in carbon emissions efficiency between different regions from these four economic regions. Table 1 and Figure 1 shows the geographical distribution of these four major regions.

Table 1.
Geographical distribution of the four major regions in China.
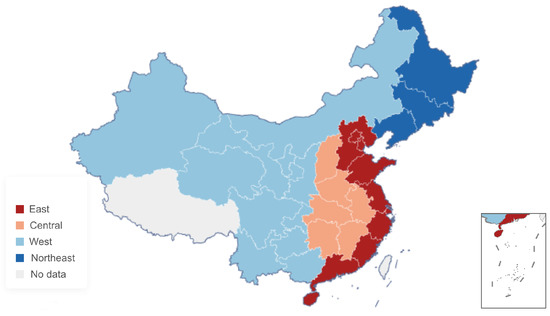
Figure 1.
Geographical distribution of the four major regions in China.
4.2. Variable Description and Data Sources
4.2.1. Variable Description
To measure the carbon emissions efficiency of 30 provinces in mainland China, this paper selects labor, energy consumption, and capital stock as inputs, and real GDP and carbon emissions as outputs [6]. The details are as follows.
- Labor. The sum of employees in the three major industries in each region is used as the labor input.
- Energy consumption. The total energy consumption of each region is used as the energy consumption input.
- Capital. This study uses the “perpetual inventory method” proposed by Goldsmith [41] in 1951 to calculate the capital stock. The formula for calculating capital stock iswhere K represents the capital stock, I represents the gross capital formation; represents the depreciation rate of capital stock, which is set to 9 in this research [42]; i represents the province; and t stands for the year.
- Real GDP. This is calculated by converting nominal GDP and price indices for each provinces.
- Carbon emissions. The carbon emissions comes from the CEAD database [43,44], which is a carbon accounting database in China. It provides a solid theoretical basis and technical support for China to achieve green and low-carbon development, and contributes to policy design and implementation of greenhouse gas emissions control in China.
4.2.2. Data Sources
This study examined the carbon emissions of 30 provinces in mainland China (all except Tibet, due to the absence of relevant energy data) from 2000 to 2019. The statistical data in this study come from the China Statistical Yearbook, China Energy Statistical Yearbook, China Provincial Statistical Yearbook, and CEAD database [43,44]. Some missing values were filled by interpolation.
4.3. Discussion
In this section, firstly, carbon emissions efficiency evaluation analysis is discussed. Secondly, the influence of some parameters on the model is analyzed, Finally, a comparative analysis is performed with existing DEA methods.
Carbon Emissions Efficiency Evaluation Analysis
This section considers the BRDEA model ( = 1) to calculate the corresponding values.
As can be seen from Figure 2, the carbon emissions efficiency is generally between 0.6 and 0.9, and the efficiency values are all below 1. It can be seen that most of the efficiency values are low and that the carbon emissions efficiency has not reached the effective level.
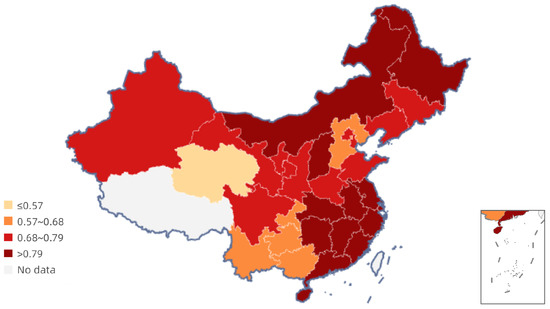
Figure 2.
Geographical distribution of mean carbon emissions efficiency of China from 2000 to 2019 in robust DEA model.
From Figure 2, it can be seen that carbon emissions efficiency varies widely among different provinces.
Some places have higher carbon emissions efficiency (greater than 0.79), for example, Shanghai, Zhejiang, Jiangsu, Fujian, and Guangdong. These places have higher levels of economic development, a higher level of urbanization, and a more reasonable industrial structure. In addition, these places have more universities, greater talent and labor forces, higher management levels, and higher science and technology levels. There are also some provinces such as Heilongjiang and Inner Mongolia where the carbon emissions efficiency is also relatively high. Given the geographical location and climatic conditions of these places, tertiary industry in these places does not account for much GDP and there are not many high pollution and high energy consumption enterprises, so their carbon emissions efficiency is also higher.
Unlike high-efficiency provinces, some places have medium carbon emissions levels, between 0.68–0.79, and these places are widely distributed, including Jilin, Liaoning, Shandong, Xinjiang, etc. Most of these places have medium levels of various indicators.
In addition, some places have a slightly lower level of carbon emissions efficiency, below 0.68, mainly in the western region. These regions have a low level of economic development and a small labor force. With the transfer of industries from the east, a large number of high pollution and high energy consumption enterprises have been transferred to the west, which on the one hand promotes economic development and on the other hand causes environmental pollution. While developing, these places should focus on innovation and combine their own characteristics to develop their economy, develop new energy, and achieve high-quality development.
In order to further analyze the differences in the distribution of carbon emissions efficiency among regions in China, the next step is to analyze the differences in carbon emissions efficiency in China from four regions, one by one.
Figure 3 shows the clear differences between the four regions in recent years. The eastern and central regions are flat, and the northeastern and western regions are lower.
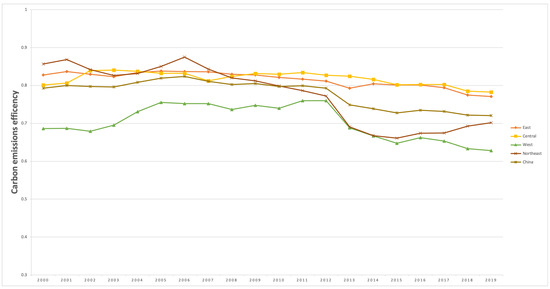
Figure 3.
Trends of carbon emissions efficiency for four regions in China from 2000 to 2019.
As a result of the reform and opening up, the eastern region has a higher level of economic development and a higher degree of openness to the outside world, and is, therefore, more efficient in terms of carbon emissions, which is also related to China’s current regional policy of “taking the lead in the east”.
The carbon emissions efficiency of the central region is around 0.8. Since the central region is located inland, the level of openness needs to be improved. The development of the central region is unbalanced and insufficient, the innovation capability of the manufacturing industry needs to be enhanced, and ecological and green development needs to be improved.
The northeast region belongs to the old industrial region, which is the cradle of China’s industrial development and has a long history of industrial development. However, the industrial structure of the eastern region is more homogeneous, and the loss of talent and labor force is more serious.
Due being deep inland, the western region has a low level of openness to the outside world, slow development of transportation, and a low technology level. In addition, in recent years, with the implementation of the western opening strategy, many industries in the eastern coastal areas have been transferred to the western region, but at the same time, this has also brought about environmental problems. Some high pollution, high energy consumption enterprises transferred to the western region have, to a certain extent, caused energy consumption and environmental pollution problems. The self-development ability of the western region is not high. At present, with the development of China’s rural revitalization, the western region should combine its characteristics to achieve high-quality development.
4.4. Sensitivity Analysis
Sensitivity analysis is a typical method to quantify the effect of parameter uncertainty on the overall simulation/prediction of uncertainty.
4.4.1. The Effects of Uncertain Parameters in Box Set
This paper sets the uncertainty parameter from 1 to 3, and then analyzes the impact of these changes on the RDEA model. As shown in Figure 4 and Table 2, as increases, the efficiency value gradually becomes smaller and more conservative, which also confirms Theorem 4. It can be seen that robust optimization considers the best case in the worst case, and is relatively conservative.
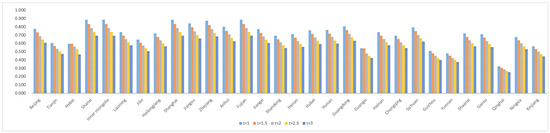
Figure 4.
The influence of uncertain parameters on the model in 2019.
Table 2.
The influence of uncertain parameters on the model in 2019.
4.4.2. The Effects of Uncertain Parameters in the Ellipsoid Set
This paper sets the uncertainty parameter from 1 to 3, and then analyzes the impact of these changes on the RDEA model. As shown in Figure 5 and Table 3, as increases, the efficiency value gradually becomes smaller and more conservative, which also confirms Theorem 4. It can be seen that robust optimization considers the best case in the worst case and is relatively conservative.
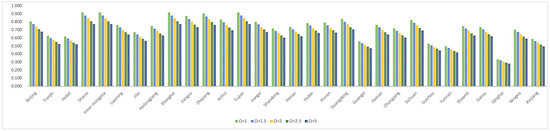
Figure 5.
The influence of uncertain parameters on the model in 2019.
Table 3.
The influence of uncertain parameters on the model in 2019.
4.4.3. The Effects of Uncertain Parameters in the Polyhedron Set
This paper sets the uncertainty parameter from 1 to 3, and then analyzes the impact of these changes on the RDEA model. As shown in Figure 6 and Table 4, as increases, the efficiency value gradually becomes smaller and more conservative, which also confirms Theorem 4. It can be seen that robust optimization considers the best case in the worst case and is relatively conservative.
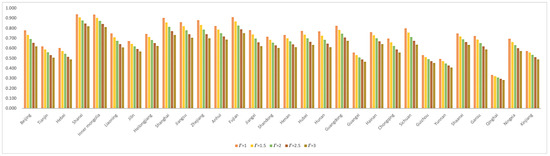
Figure 6.
The influence of uncertain parameters on the model in 2019.
Table 4.
The influence of uncertain parameters on the model in 2019.
Combining the above three sensitivity analyses, it can be seen that the value of the RDEA model becomes smaller and more conservative as the uncertainty parameter increases, which also verifies Theorem 4.
4.5. Comparison Analysis
In this subsection, the advantages of the proposed methods are described by comparing them with existing methods.
As shown in Figure 7 and Table 5, this paper chooses the data of carbon emissions efficiency in 2019, from which we choose Jiangsu as an example; the value of the DEA model is 0.950. The values of BRDEA (), ERDEA (), and PRDEA () are 0.842, 0.872, and 0.860, respectively. This shows that the values of the three RDEA models are smaller than the values of the DEA model, meaning that the RDEA model is more conservative and reduces the risk of the model, which also confirms Theorem 5.
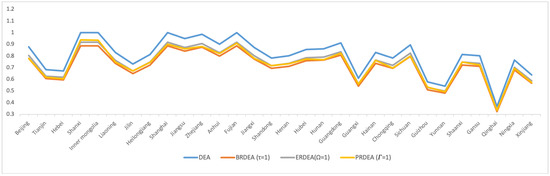
Figure 7.
Comparison of the DEA model and robust DEA.
Table 5.
Comparison of the DEA model and robust DEA.
5. Data-Driven Robust DEA Model
In Section 3, we show the robust DEA model. The traditional robust model calculates the results based on the uncertainty set, which leads to an overly conservative and somewhat unrealistic model. To deal with this problem, we use the data-driven robust optimization model to improve the DEA model. This approach does not require knowing the exact distribution of carbon emissions output, but only the historical data of carbon emissions output. This makes full use of the historical data and makes it more realistic and economically efficient.
We assume, contrary to the preceding, that the observation sets of the output unit P may be retrieved, where P =
and . In other words, P represents the initial data that we can obtain. Simultaneously, let represent the mean values of
i.e., , where . As a result, we must identify a decision variable that maximizes worst-case efficiency across all costs in the uncertainty set Z. The robust DEA problem is as follows:
Several approaches for creating Z will be described in the next part [45], with each set having a scaling parameter to determine its size.
5.1. Box Uncertainty
We set , ; there is , where × is the Cartesian product and . It is worth noting that . Therefore, the obtained data-driven robust DEA model based on the box uncertainty set is as follows:
The proof is in Appendix A.6.
Model (15) is determined by both the uncertain parameters and the observation set, and is different from the previous robust DEA model in Section 3. The proofs for Section 5.2 and Section 5.3 are similar to this proof.
5.2. Ellipsoid Uncertainty
The ellipsoid uncertainty set was generated from the fact that the multivariate normal distribution’s iso-density locus is an ellipse. Therefore, it usually uses a maximum likelihood fit to create a normal distribution. According to statistical mathematical theory, the maximum likelihood fit of a normal distribution of data point is given by . We set an ellipsoid of the form with the scaling parameter and centered on . Therefore, the obtained data-driven robust DEA model based on the ellipsoid uncertainty set is as follows:
5.3. Polyhedron Uncertainty
A polyhedron defined using linear equations and inequalities is equivalent to a convex hull. We set where the scaling parameter controls the size of the set. Through the duality of the internal maximization problem, the obtained data-driven robust DEA model based on the box uncertainty set is as follows:
5.4. Case Study
In the previous robust DEA model, although considering the uncertainty of carbon emissions, some data are not taken into account and are not relevant, making the model too conservative. To address this issue, we further analyze the robust DEA in a data-driven context. To unify the comparison, the data in Section 4 are then used to further analyze the carbon emissions efficiency of China. The values will be calculated in turn under the three uncertainty sets.
This section considers the data-driven robust DEA model () to calculate the corresponding values. As can be seen from Figure 8, the carbon emissions efficiency is generally between 0.4 and 0.9, and the efficiency values are all below 1. It can be seen that most of the efficiency values are low and the carbon emissions efficiency has not reached the effective level. Next, the sensitivity analysis of uncertain parameters is studied.
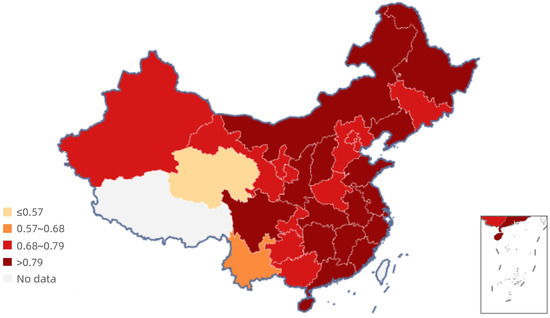
Figure 8.
Geographical distribution of mean carbon emissions efficiency of China from 2000 to 2019 in data-driven robust DEA model.
First, when the uncertainty set is the box set, this paper sets the uncertainty parameter from 1 to 3, and then analyzes the impact of these changes on the data-driven robust DEA model. As shown in Figure 9 and Table 6, as increases, the efficiency value gradually becomes smaller. We take Jiangsu as an example. As the parameters become progressively larger, the carbon emissions efficiency of Jiangsu becomes 0.873, 0.830, 0.782, 0.743, and 0.710, respectively.
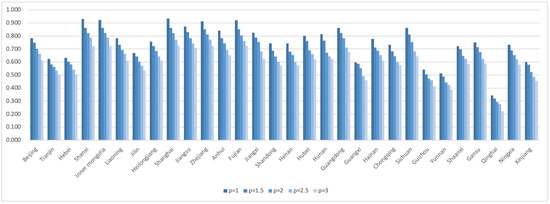
Figure 9.
Carbon emissions efficiency based on box set in data-driven robust DEA model.
Table 6.
Carbon emissions efficiency based on box set in data-driven robust DEA model.
Secondly, when the uncertainty set is the ellipsoid set, this paper sets the uncertainty parameter from 1 to 3 and then analyzes the impact of these changes on the data-driven robust DEA model. As shown in Figure 10 and Table 7, as increases, the efficiency value gradually becomes smaller. We take Jiangsu as an example. As the parameters become progressively larger, the carbon emissions efficiency of Jiangsu becomes 0.889, 0.854, 0.824, 0.802, and 0.757, respectively.
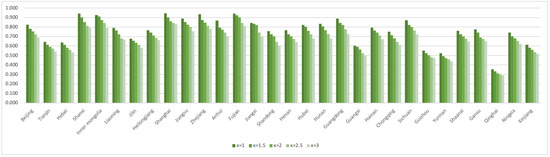
Figure 10.
Carbon emissions efficiency based on ellipsoidal set in data-driven robust DEA model.
Table 7.
Carbon emissions efficiency based on ellipsoidal set in data-driven robust DEA model.
Finally, when the uncertainty set is the polyhedron set, this paper sets the uncertainty parameter from 1 to 3 and then analyzes the impact of these changes on the data-driven robust DEA model. As shown in Figure 11 and Table 8, as increases, the efficiency value gradually becomes smaller. We take Jiangsu as an example. As the parameters become progressively larger, the carbon emissions efficiency of Jiangsu becomes 0.853, 0.832, 0.812, 0.782, and 0.762, respectively.
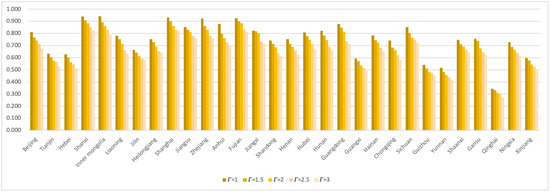
Figure 11.
Carbon emissions efficiency based on polyhedron set in data-driven robust DEA model.
Table 8.
Carbon emissions efficiency based on polyhedron set in data-driven robust DEA model.
Comparison Analysis
Comparing the data-driven robust DEA model (Table 9), the robust DEA model, and the traditional DEA model, it can be seen that the value of the data-driven robust DEA model is between the robust DEA model and the traditional DEA model. In this way, the data-driven robust DEA model overcomes the drawback of over-conservatism of robust optimization and, on the other hand, retains the robustness of robust optimization to some extent. In the case of climate uncertainty and government economic policy uncertainty, the data-driven robust DEA model is more realistic and can be used as a reference for decision makers.
Table 9.
Comparison of the DEA model, robust DEA, and data-driven robust DEA.
From the above comparison with other literature (Table 10), there are regions in the three-stage DEA approach where the efficiency is greater than robust DEA and data-driven robust DEA. It is evident that the three-stage DEA approach is somewhat optimistic and does not take into account climate and policy uncertainties. The method in this paper deals with this problem well. We will further present the corresponding economic and government economic policy implications below.
Table 10.
Comparison of the DEA model, robust DEA, data-driven robust DEA, and three-stage DEA.
5.5. Economic Implications
From the discussion above, it can be seen that the carbon emission efficiency values under different uncertain parameters are different. Governments can formulate policies according to their geographical location and economic development. With a high level of economic development and a relatively high level of carbon emissions, the eastern region can continue to develop its own advantages. In the information age, we will continue to vigorously develop science and technology, closely follow national policies, provide technical support to the central and western regions, and jointly improve carbon emission efficiency. The northeast, central, and western regions have relatively low carbon emissions due to geographical location, resource endowment, and other problems. They need to develop the economy on the one hand and improve the level of science and technology on the other hand, while adjusting the energy structure and industrial structure. To sum up, each region in China can formulate appropriate economic policies related to double carbon according to its own characteristics.
5.6. Policy Implications
To realize the commitment to the global “dual carbon” policy, achieve “high-quality” economic development, and promote the improvement of the ecological environment, several policy recommendations have been put forward.
- Pay attention to the coordinated development among regions and develop the economy according to local conditions. There are huge differences in regional economic development in China, as well as in resource endowments, industrial advantages, and economic development levels between different regions. The central, western, and northeastern regions should focus on optimizing the energy structure, following the requirements of industrial policies and dual control of energy consumption, promoting the concentration of high-energy-consuming industries in areas with advantages in clean energy, and actively cultivating green development momentum.
- Promote energy transition and promote green development. Energy is an important material basis for economic and social development, and the most important source of carbon emissions. Continue to reduce the proportion of fossil energy consumption, vigorously develop clean energy, accelerate the construction of a clean, low-carbon, safe and efficient modern energy system, comprehensively promote energy transformation, and take multiple measures to reduce carbon emissions.
- Innovate green technology and vigorously develop science and technology. Innovation is the first driving force for development. In the new era, energy science and technology must closely follow the national strategic needs, be problem-oriented and goal-oriented, target major frontier areas to speed up development, strengthen the effective matching of systems and mechanisms, and promote the market-oriented allocation of technical elements, thereby promoting the engine of energy science and technology innovation-driven development.
- Advocate for people to live a green and low-carbon lifestyle and reduce carbon emissions. The sudden outbreak of the COVID-19 epidemic in 2020 reminds us that human beings need a self-revolution, to accelerate the formation of green development methods and lifestyles, and build an ecological civilization and beautiful earth. The key to the implementation of the “dual carbon” policy lies in the awakening and promotion of public awareness. If more and more people can realize the importance of the “dual carbon” policy, reduce or eliminate disposable tools use, and reduce the use of fuel vehicles, etc., it will improve carbon emissions efficiency and promote green economic development.
6. Conclusions
The traditional DEA model focuses on efficiency evaluation, which assumes that the output data are deterministic. However, uncertainty about climate and government economic policies is ignored. Therefore, first we used a robust optimization approach to investigate the uncertainty of traditional DEA. Then, three different types of uncertainty sets were considered, including the box set, ellipsoidal set, and polyhedral set. The model proposed in this paper improves the conservatism of the model and reduces the risk impact of climate and government economic policies. Finally, to verify the validity of the model in this paper, we studied carbon emissions efficiency in China. Some interesting conclusions are described as follows:
- The higher the level of uncertainty parameters, the less efficient the corresponding robust DEA model is; in other words, more conservative models are more robust. This trend can be reflected in the three robust models in this paper.
- The values of the robust DEA model proposed in this paper are smaller than those of the original DEA model. This shows that the model in this paper is more robust and conservative. It can be seen that the traditional DEA model is too optimistic and does not take into account the uncertainty caused by various risks. When the effect of uncertain output variables is considered, the efficiency value of the proposed robust model becomes smaller.
- The carbon emissions efficiency values from the data-driven robust data envelopment analysis are slightly higher than those from the robust optimization, which shows that the data-driven robust DEA model retains the robustness of the model and overcomes the over-conservatism of the robust optimization.
In the future, the government should focus on coordinated regional development, promote the transformation and upgrading of the energy structure, innovate in green technology, and advocate for people to live a green and low-carbon lifestyle.
Author Contributions
Conceptualization, S.Q. and Y.J.; data curation, Y.X. and S.J.; formal analysis, Y.X. and C.F.; investigation, Y.X.; methodology, S.Q. and J.W.; resources, Y.X.; validation, S.Q. and Y.J.; writing—original draft, Y.X.; writing—review and editing, S.Q. and Y.J. All authors have read and agreed to the published version of the manuscript.
Funding
This research was supported by the National Natural Science Foundation of China (No. 72171149, 72171123) and the Shanghai Philosophy and Social Science Foundation (No. 2020BGL010).
Institutional Review Board Statement
Not applicable.
Informed Consent Statement
Not applicable.
Data Availability Statement
The data presented in this study are available on request from the corresponding author. The data are not publicly available due to privacy considerations.
Acknowledgments
The authors would like to thank the anonymous reviewers for their comments and suggestions.
Conflicts of Interest
The authors declare no conflict of interest.
Appendix A
Appendix A.1. Proof of Theorem 1
Proof of Theorem 1.
The first constraint of Model (6) may be rewritten using the form of the box set as:
This is the same as:
Obviously, the minimal value of Constraint (A2)’s left-hand side is:
The explicit version of Model (6)’s initial constraint may then be produced.
The same approach may be simply used to produce the explicit version of Model (6)’s third constraint:
The proof is complete. □
Appendix A.2. Proof of Theorem 2
Proof of Theorem 2.
The first constraint of Model (8) may be phrased using the ellipsoid set form as:
This is the same as:
Taking the minimum of the left-hand side of Constraint (A7), we obtain the corresponding inequality:
Simply repeat the technique for the third constraint of Model (8), and we obtain:
Finally, the RDEA based on the ellipsoid set may be produced.
The proof is complete. □
Appendix A.3. Proof of Theorem 3
Appendix A.4. Proof of Theorem 4
Proof of Theorem 4.
Let us take BRDEA as an example. The first constraint of Model 9 contains the uncertain variable and is greater than 0. Therefore, we can complete this proof by considering only the first constraint of Model 9. As increases, also increases, and the part of becomes smaller to satisfy the constraint. That is, Model 9 will obtain a lower efficiency and become more robust.
Similar conclusions can be obtained from other robust optimization models. □
Appendix A.5. Proof of Theorem 5
Proof of Theorem 5.
Let us take BRDEA as an example. When the uncertain variables are added, the value of is greater than 0, that is, the value of Must be smaller to satisfy the constraints. In other words, the efficiency value of Model 9 must be smaller and a little more conservative than the original Model 2.
Similar conclusions can be obtained from other robust optimization models. □
Appendix A.6. Proof of Section Box Uncertainty
Proof of Section 5.1.
We simply acquire the largest value of (2)’s goal function:
It can then be translated into the corresponding form:
Likewise, the third inequality of (2) may be expressed as follows:
□
References
- Jeffry, L.; Mei, Y.O.; Nomanbhay, S.; Mofijur, M.; Show, P.L. Greenhouse gases utilization: A review. Fuel 2021, 301, 121017. [Google Scholar] [CrossRef]
- Huang, W.T.K.; Braithwaite, I.; Charlton-Perez, A.; Sarran, C.; Sun, T. Non-linear response of temperature-related mortality risk to global warming in England and Wales. Environ. Res. Lett. 2022, 17, 034017. [Google Scholar] [CrossRef]
- Lu, Y.; Zhang, Y.; Cao, X.; Wang, C.; Wang, Y.; Zhang, M.; Ferrier, R.C.; Jenkins, A.; Yuan, J.; Bailey, M.J.; et al. Forty years of reform and opening up: China’s progress toward a sustainable path. Sci. Adv. 2019, 5, eaau9413. [Google Scholar] [CrossRef] [PubMed]
- Ritchie, H.; Roser, M. CO2 and Greenhouse Gas Emissions. Our World in Data. 2020. Available online: https://ourworldindata.org/$\protect\protect\unhbox\voidb@x\hbox{CO}_2$-and-other-greenhouse-gas-emissions (accessed on 5 July 2022).
- Li, Y.; Chen, K.; Zheng, N.; Cai, Q.; Li, Y.; Lin, C. Strategy Research on Accelerating Green and Low-Carbon Development under the Guidance of Carbon Peak and Carbon Neutral Targets. IOP Conf. Ser. Earth Environ. Sci. 2021, 793, 012009. [Google Scholar] [CrossRef]
- Zhang, M.; Li, L.; Cheng, Z. Research on carbon emission efficiency in the Chinese construction industry based on a three-stage DEA-Tobit model. Environ. Sci. Pollut. Res. 2021, 28, 51120–51136. [Google Scholar] [CrossRef]
- Yamaji, K.; Matsuhashi, R.; Nagata, Y.; Kaya, Y. A study on economic measures for CO2 reduction in Japan. Energy Policy 1993, 21, 123–132. [Google Scholar] [CrossRef]
- Aigner, D.; Lovell, C.K.; Schmidt, P. Formulation and estimation of stochastic frontier production function models. J. Econom. 1977, 6, 21–37. [Google Scholar] [CrossRef]
- Meeusen, W.; van Den Broeck, J. Efficiency Estimation from Cobb-Douglas Production Functions with Composed Error. Int. Econ. Rev. 1977, 18, 435–444. [Google Scholar] [CrossRef]
- Sun, J.; Du, T.; Sun, W.; Na, H.; He, J.; Qiu, Z.; Yuan, Y.; Li, Y. An evaluation of greenhouse gas emission efficiency in China’s industry based on SFA. Sci. Total Environ. 2019, 690, 1190–1202. [Google Scholar] [CrossRef]
- Sun, W.; Huang, C. How does urbanization affect carbon emission efficiency? Evidence from China. J. Clean. Prod. 2020, 272, 122828. [Google Scholar] [CrossRef]
- Zhang, C.; Chen, P. Industrialization, urbanization, and carbon emission efficiency of Yangtze River Economic Belt—empirical analysis based on stochastic frontier model. Environ. Sci. Pollut. Res. 2021, 28, 66914–66929. [Google Scholar] [CrossRef] [PubMed]
- Cullinane, K.; Wang, T.F.; Song, D.W.; Ji, P. The technical efficiency of container ports: Comparing data envelopment analysis and stochastic frontier analysis. Transp. Res. Part A Policy Pract. 2006, 40, 354–374. [Google Scholar] [CrossRef]
- Yu, Y.; Yi, Z.; Jia, J. The Efficiency Evolution and Risks of Green Development in the Yangtze River Economic Belt, China. Sustainability 2022, 14, 10417. [Google Scholar] [CrossRef]
- Du, Y.; Seo, W. A Comparative Study on the Efficiency of R&D Activities of Universities in China by Region Using DEA–Malmquist. Sustainability 2022, 14, 10433. [Google Scholar]
- Charnes, A.; Cooper, W.W.; Rhodes, E. Measuring the efficiency of decision making units. Eur. J. Oper. Res. 1978, 2, 429–444. [Google Scholar] [CrossRef]
- Banker, R.D.; Charnes, A.; Cooper, W.W. Some models for estimating technical and scale inefficiencies in data envelopment analysis. Manag. Sci. 1984, 30, 1078–1092. [Google Scholar] [CrossRef]
- Meng, F.; Su, B.; Thomson, E.; Zhou, D.; Zhou, P. Measuring China’s regional energy and carbon emission efficiency with DEA models: A survey. Appl. Energy 2016, 183, 1–21. [Google Scholar] [CrossRef]
- Cheng, Z.; Li, L.; Liu, J.; Zhang, H. Total-factor carbon emission efficiency of China’s provincial industrial sector and its dynamic evolution. Renew. Sustain. Energy Rev. 2018, 94, 330–339. [Google Scholar] [CrossRef]
- Yan, D.; Lei, Y.; Li, L.; Song, W. Carbon emission efficiency and spatial clustering analyses in China’s thermal power industry: Evidence from the provincial level. J. Clean. Prod. 2017, 156, 518–527. [Google Scholar] [CrossRef]
- Ben-Tal, A.; Nemirovski, A. Robust solutions of linear programming problems contaminated with uncertain data. Math. Program. 2000, 88, 411–424. [Google Scholar] [CrossRef]
- Ben-Tal, A.; Nemirovski, A. Robust optimization—Methodology and applications. Math. Program. 2002, 92, 453–480. [Google Scholar] [CrossRef]
- Bertsimas, D.; Sim, M. The price of robustness. Oper. Res. 2004, 52, 35–53. [Google Scholar] [CrossRef]
- Ben-Tal, A.; El Ghaoui, L.; Nemirovski, A. Robust Optimization; Princeton University Press: Princeton, NJ, USA, 2009. [Google Scholar]
- Han, Y.; Qu, S.; Wu, Z.; Huang, R. Robust consensus models based on minimum cost with an application to marketing plan. J. Intell. Fuzzy Syst. 2019, 37, 5655–5668. [Google Scholar] [CrossRef]
- Qu, S.; Han, Y.; Wu, Z.; Raza, H. Consensus modeling with asymmetric cost based on data-driven robust optimization. Group Decis. Negot. 2021, 30, 1395–1432. [Google Scholar] [CrossRef]
- Lu, Y.; Xu, Y.; Herrera-Viedma, E.; Han, Y. Consensus of large-scale group decision making in social network: The minimum cost model based on robust optimization. Inf. Sci. 2021, 547, 910–930. [Google Scholar] [CrossRef]
- Qu, S.; Li, Y.; Ji, Y. The mixed integer robust maximum expert consensus models for large-scale GDM under uncertainty circumstances. Appl. Soft Comput. 2021, 107, 107369. [Google Scholar] [CrossRef]
- Ji, Y.; Li, H.; Zhang, H. Risk-averse two-stage stochastic minimum cost consensus models with asymmetric adjustment cost. Group Decis. Negot. 2022, 31, 261–291. [Google Scholar] [CrossRef]
- Qu, S.; Wei, J.; Wang, Q.; Li, Y.; Jin, X.; Chaib, L. Robust minimum cost consensus models with various individual preference scenarios under unit adjustment cost uncertainty. Inf. Fusion 2022, 89, 510–526. [Google Scholar] [CrossRef]
- Hosseini-Motlagh, S.M.; Samani, M.R.G.; Homaei, S. Blood supply chain management: Robust optimization, disruption risk, and blood group compatibility (a real-life case). J. Ambient. Intell. Humaniz. Comput. 2020, 11, 1085–1104. [Google Scholar] [CrossRef]
- Cantini, A.; Peron, M.; Carlo, F.D.; Sgarbossa, F. A decision support system for configuring spare parts supply chains considering different manufacturing technologies. Int. J. Prod. Res. 2022, 1–21. [Google Scholar] [CrossRef]
- Yang, J.; Su, C. Robust optimization of microgrid based on renewable distributed power generation and load demand uncertainty. Energy 2021, 223, 120043. [Google Scholar] [CrossRef]
- Peykani, P.; Mohammadi, E.; Saen, R.F.; Sadjadi, S.J.; Rostamy-Malkhalifeh, M. Data envelopment analysis and robust optimization: A review. Expert Syst. 2020, 37, e12534. [Google Scholar] [CrossRef]
- Sadjadi, S.J.; Omrani, H. Data envelopment analysis with uncertain data: An application for Iranian electricity distribution companies. Energy Policy 2008, 36, 4247–4254. [Google Scholar] [CrossRef]
- Han, Y.; Ji, Y.; Qu, S. A Robust Minimum-Cost Consensus Model With Uncertain Aggregation Weights Based on Data-Driven Method. IEEE Trans. Comput. Soc. Syst. 2022, 9, 1167–1184. [Google Scholar] [CrossRef]
- Shen, F.; Zhao, L.; Du, W.; Zhong, W.; Qian, F. Large-scale industrial energy systems optimization under uncertainty: A data-driven robust optimization approach. Appl. Energy 2020, 259, 114199. [Google Scholar] [CrossRef]
- Qu, S.; Feng, C.; Jiang, S.; Wei, J.; Xu, Y. Data-Driven Robust DEA Models for Measuring Operational Efficiency of Endowment Insurance System of Different Provinces in China. Sustainability 2022, 14, 9954. [Google Scholar] [CrossRef]
- Mielnik, O.; Goldemberg, J. Communication The evolution of the “carbonization index” in developing countries. Energy Policy 1999, 27, 307–308. [Google Scholar] [CrossRef]
- Ren, J.; Gao, B.; Zhang, J.; Chen, C. Measuring the energy and carbon emission efficiency of regional transportation systems in China: Chance-constrained DEA models. Math. Probl. Eng. 2020, 2020. [Google Scholar] [CrossRef]
- Goldsmith, R.W. A perpetual inventory of national wealth. In Studies in Income and Wealth; NBER: Cambridge, MA, USA, 1951; Volume 14, pp. 5–73. [Google Scholar]
- Jun, Z.; Yuan, Z. reestimate of China’s capital stock K. Econ. Res. 2003, 7, 675–699. [Google Scholar]
- Shan, Y.; Guan, D.; Zheng, H.; Ou, J.; Li, Y.; Meng, J.; Mi, Z.; Liu, Z.; Zhang, Q. China CO2 emission accounts 1997–2015. Sci. Data 2018, 5, 1–14. [Google Scholar] [CrossRef]
- Shan, Y.; Huang, Q.; Guan, D.; Hubacek, K. China CO2 emission accounts 2016–2017. Sci. Data 2020, 7, 1–9. [Google Scholar] [CrossRef] [PubMed]
- Chassein, A.; Dokka, T.; Goerigk, M. Algorithms and uncertainty sets for data-driven robust shortest path problems. Eur. J. Oper. Res. 2019, 274, 671–686. [Google Scholar] [CrossRef]


Publisher’s Note: MDPI stays neutral with regard to jurisdictional claims in published maps and institutional affiliations. |
© 2022 by the authors. Licensee MDPI, Basel, Switzerland. This article is an open access article distributed under the terms and conditions of the Creative Commons Attribution (CC BY) license (https://creativecommons.org/licenses/by/4.0/).