2.2.2. Analysis of Test Results
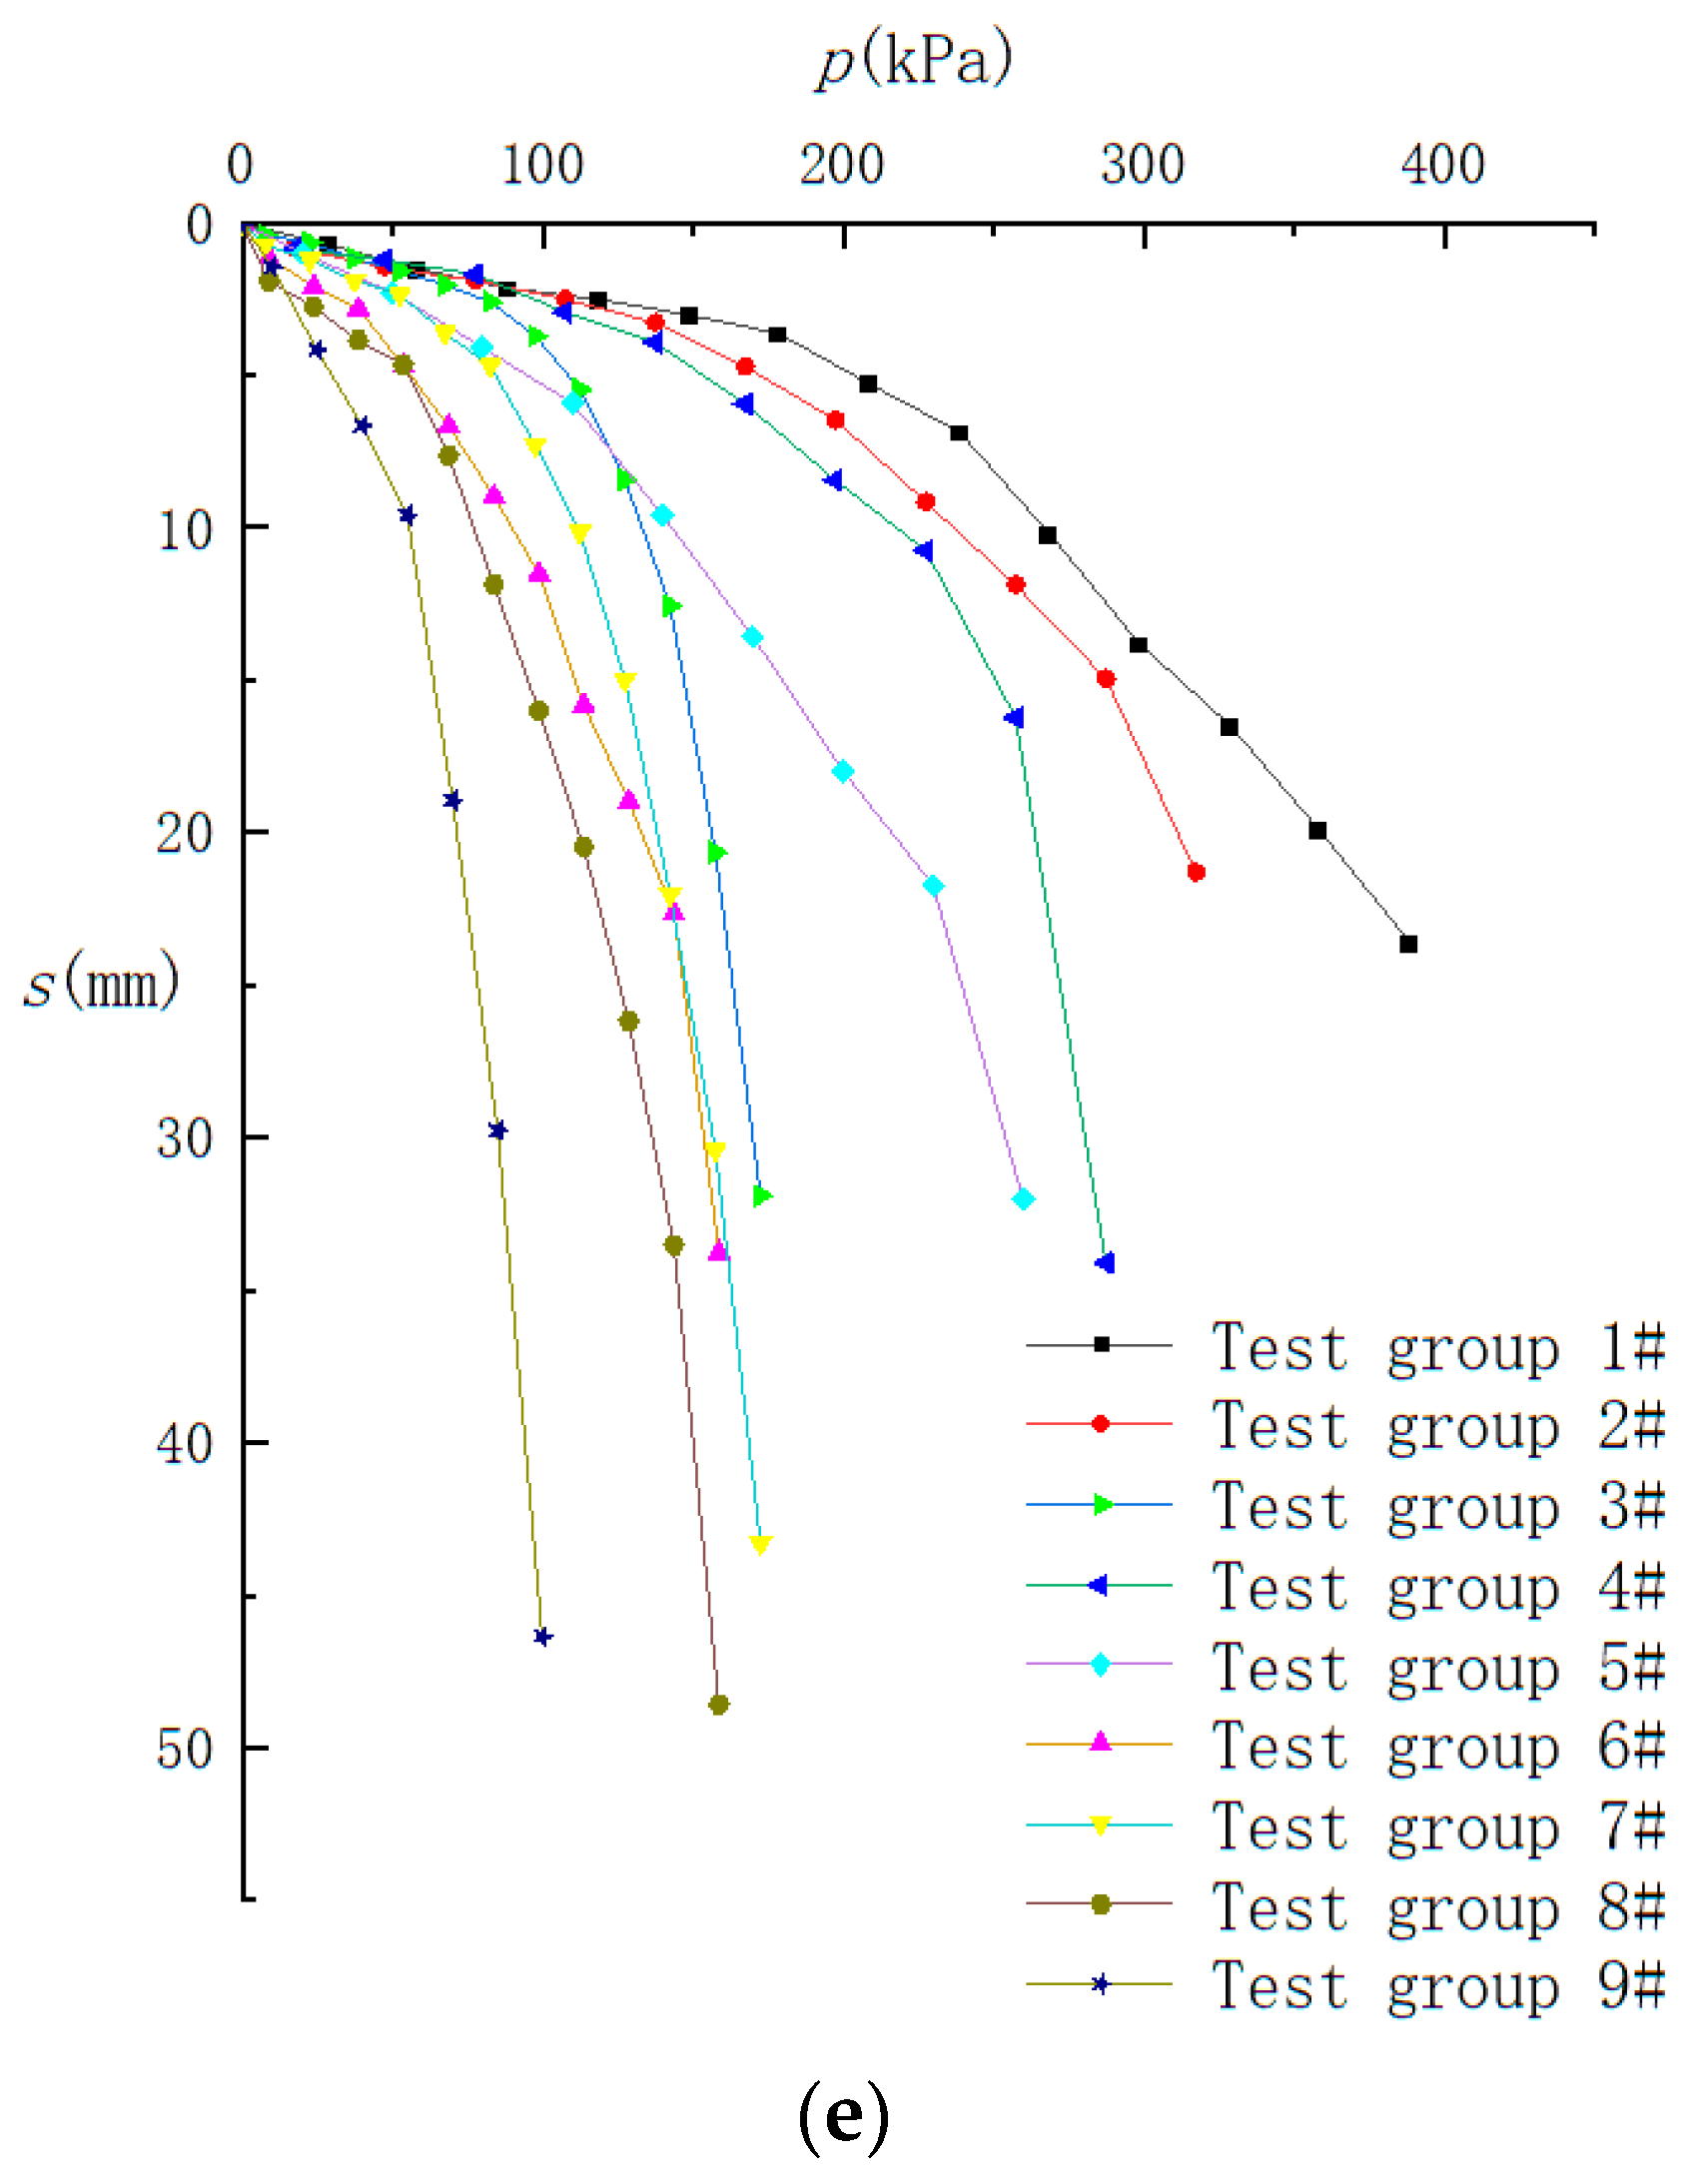
The pressure–settlement relationship curves (
p-
s curves) for each group of foundation soils under different stress histories were established by recording the magnitude of pressure on each group of foundation soils in real time under different stress histories and their corresponding settlement values, as shown in
Figure 1.
As seen in
Figure 1, under the same external load, the deformation of foundation soil generally increases with the decrease in density. The reason is that the smaller the soil density is, the looser the arrangement of soil particles is, and the smaller the friction between soil particles is. As a result, soil particles are more likely to move with each other under the same external load, resulting in greater soil deformation.
Under the same external load, the deformation of foundation soil generally increases with the increase in water content. The reason is that the increase in water content, on the one hand, increases the thickness of water-binding film adsorbed by soil particles and enhances the lubrication between particles; on the other hand, it dissolves more soluble salts between soil particles, reducing the cementation between particles, leading to the reduction in friction and thus increasing soil deformation.
Under the same external load, the deformation of foundation soil generally increases with the increase in over consolidation ratio. The reason is that the foundation soil in the normal consolidation state continues to increase the overburden pressure after the pre-consolidation pressure, the soil particles are arranged more closely, and the friction between soil particles increases. Under the same external load, the soil particles are difficult to move each other, which leads to less soil deformation. With the increase in the over consolidation ratio, the unloading amount of the foundation soil after the pre-consolidation pressure increases, the unloading rebound amount of the foundation soil increases, and the soil void volume increases. Therefore, under the same external load, the compressibility of the soil increases, leading to an increase in soil deformation.
According to the
p-
s curve, the deformation modulus of each group was determined using the following Equation (1) (with results shown in
Table 2):
where
i is 1, 2, 3, 4, and 5, which, respectively, represent the deformation modulus
E0i (MPa) of foundation soil with an over consolidation ratio of 1, 1.5, 4, 6, and 12,
μ is the Poisson’s ratio of the soil,
ac is the edge length of the bearing plate (mm) (taken as 150 mm),
p is the load value of the linear section of the plate loading test curve (MPa), and
s is the settlement corresponding to
p (mm).
In accordance with the results from
Table 2, the relationship curves between
ρ and
E01, and
ω and
E01 when in a normal consolidation state were plotted (see
Figure 2 and
Figure 3).
As seen in
Figure 2, the deformation modulus and soil density share an approximately positive linear correlation. In addition, when the density remains constant, the increase in deformation modulus increases with diminishing water content. For example, at a density of 1.6 g/cm
3, the modulus increased by 2.45 MPa and 5.45 MPa when the water content was reduced from 49% to 43% and 43% to 37%, respectively. To explain this trend, the increase in soil density is caused by a decrease in pore volume due to the compact arrangement of soil particles, which leads to greater frictional resistance between particles. The relative displacement among them is reduced under the same external load. Thus, the soil compression decreases and the deformation modulus increases. Under conditions of constant density and diminishing soil water content, the deformation modulus increases exponentially. This is due to the fact that, at high water content (e.g.,
ω = 49%), the thickness of water-binding film adsorbed by soil particles is large, and the reduction in the water-binding film thickness caused by the decrease in the water content has no significant effect on the mutual movement between soil particles. However, at low water content (e.g.,
ω = 43%), the thinned water-binding film caused by the lowered water content significantly raises the frictional resistance between soil particles, and their relative displacement is reduced under the same external load. Overall, this results in a larger increase in the deformation modulus at low water content.
As seen in
Figure 3, the deformation modulus decreases as the water content of the soil increases. Under the same water content, the reduction in the deformation modulus decreases along with the decrease in density. For example, given a 49% water content, the deformation modulus decreased by 2.43 MPa and 1.23 MPa when the density decreased from 1.8 g/cm
3 to 1.7 g/cm
3 and 1.7 g/cm
3 to 1.6 g/cm
3, respectively. This is due to the softening effect of water on soil particles; as the water content increases, the frictional resistance between soil particles decreases, and soil particles are more likely to produce rotation and relative displacement. Therefore, the compression produced under the same external load is greater and the deformation modulus is smaller. Under the same water content, the reduction in the deformation modulus is less as the density of the soil decreases. This occurs because at higher densities (e.g., 1.8 g/cm
3), the soil particles are more closely arranged, and the resulting increase in the inter-particle spacing caused by the decrease in density has a significant effect on the reduction in inter-particle frictional resistance. Even so, at smaller densities (e.g., 1.7 g/cm
3), the soil particles are more loosely arranged, leading to inter-particle spacing having less of an effect on frictional resistance. Thus, as the soil density decreases, the effect of inter-particle frictional resistance also decreases under the same external load, resulting in a smaller reduction in the reduction in the deformation modulus at low densities.
Considering the effect of soil density and water content on deformation modulus, the relationship between
E01 and
ρ/
ω is curve fitted. as shown in
Figure 4.
As evidenced in
Figure 4, excluding data points 4 and 7, it was found that the larger the ratio of density to water content, the larger the corresponding soil deformation modulus.
E01 has a linear relationship with
ρ/
ω, so Equation (2) is used for fitting:
where
a = 9.016 ± 0.586 (10
5 cm) and
b = 28.477 ± 2.367 (MPa). The unit of parameter
a is cm. The parameter
a reflects the influence of the side length of the bearing plate on the deformation modulus. The larger parameter
a is, the larger the side length of the bearing plate is, and the greater the deformation modulus is. Zhang [
26] has obtained the same conclusion through plate load tests of different sizes. On the other hand, the unit of parameter
b is MPa. Parameter
b reflects the influence of overburden pressure on the deformation modulus. The larger parameter
b is, the greater the overburden pressure is, and the smaller
E01 is.
ρ is the density of the foundation soil (g/cm
3), and
ω is the water content of the foundation soil;
ρ/
ω > 3.16 ensures that
E01 > 0.
According to
Table 2, the relationship curves between
E0i (
i = 2, 3, 4, 5) and OCR were plotted for different groups, as shown in
Figure 5.
As shown in
Figure 5 (except for the third group of data), although the density and water content are different, the variation law for each curve is the same, and the larger the over consolidation ratio is, the smaller the deformation modulus is. Zhang [
27] also reached a similar conclusion. Due to the large dispersion of each group’s
E0i-OCR curves, a dimensionless treatment of
Figure 5 was done.
E0i of each group of the foundation was divided by
E01 to obtain the
E0i/
E01-OCR curve, which is illustrated in
Figure 6.
As can be seen in
Figure 6, excluding the third group of data, the ratio of
E0i/
E01 decreases with the increase in the over consolidation ratio. In addition, when the over consolidation ratio is low (OCR = 1~4), the rate of decrease increases, and as it increases (OCR = 4~12), the rate of decrease diminishes before eventually stabilizing.
Each group produced curves that are close to each other, which can be expressed by their mean curves, and they were close to power functions in form. Therefore, the power function was used to fit them with the results listed in
Figure 7.
E0i/
E01 can be determined by the following equation, with the correlation coefficient being R
2 = 0.96769:
where
A = 1.028 ± 0.053 and
B = −0.487 ± 0.058 are dimensionless. Parameter
B is the influence coefficient of the over consolidation ratio of foundation soil. The larger parameter
B is, the greater the influence of the over consolidation ratio of foundation soil is. Parameter
A is the comprehensive influence coefficient on
E0i/
E01 except for the influence of the over consolidation ratio. OCR stands for the over consolidation ratio of the foundation soil, 1 < OCR.
By determining
E01 using Equation (2) and substituting it into Equation (3),
E0i can be calculated as below:
In summary, when the over consolidation ratio equals 1, Equation (2) is used to calculate the deformation modulus. When it is greater than 1, Equation (4) is used instead to carry out the calculation. This can be combined as Equation (5):


