
Information Extraction and Prediction of Rocky Desertification Based on Remote Sensing Data

Abstract
:1. Introduction
2. Materials and Methods
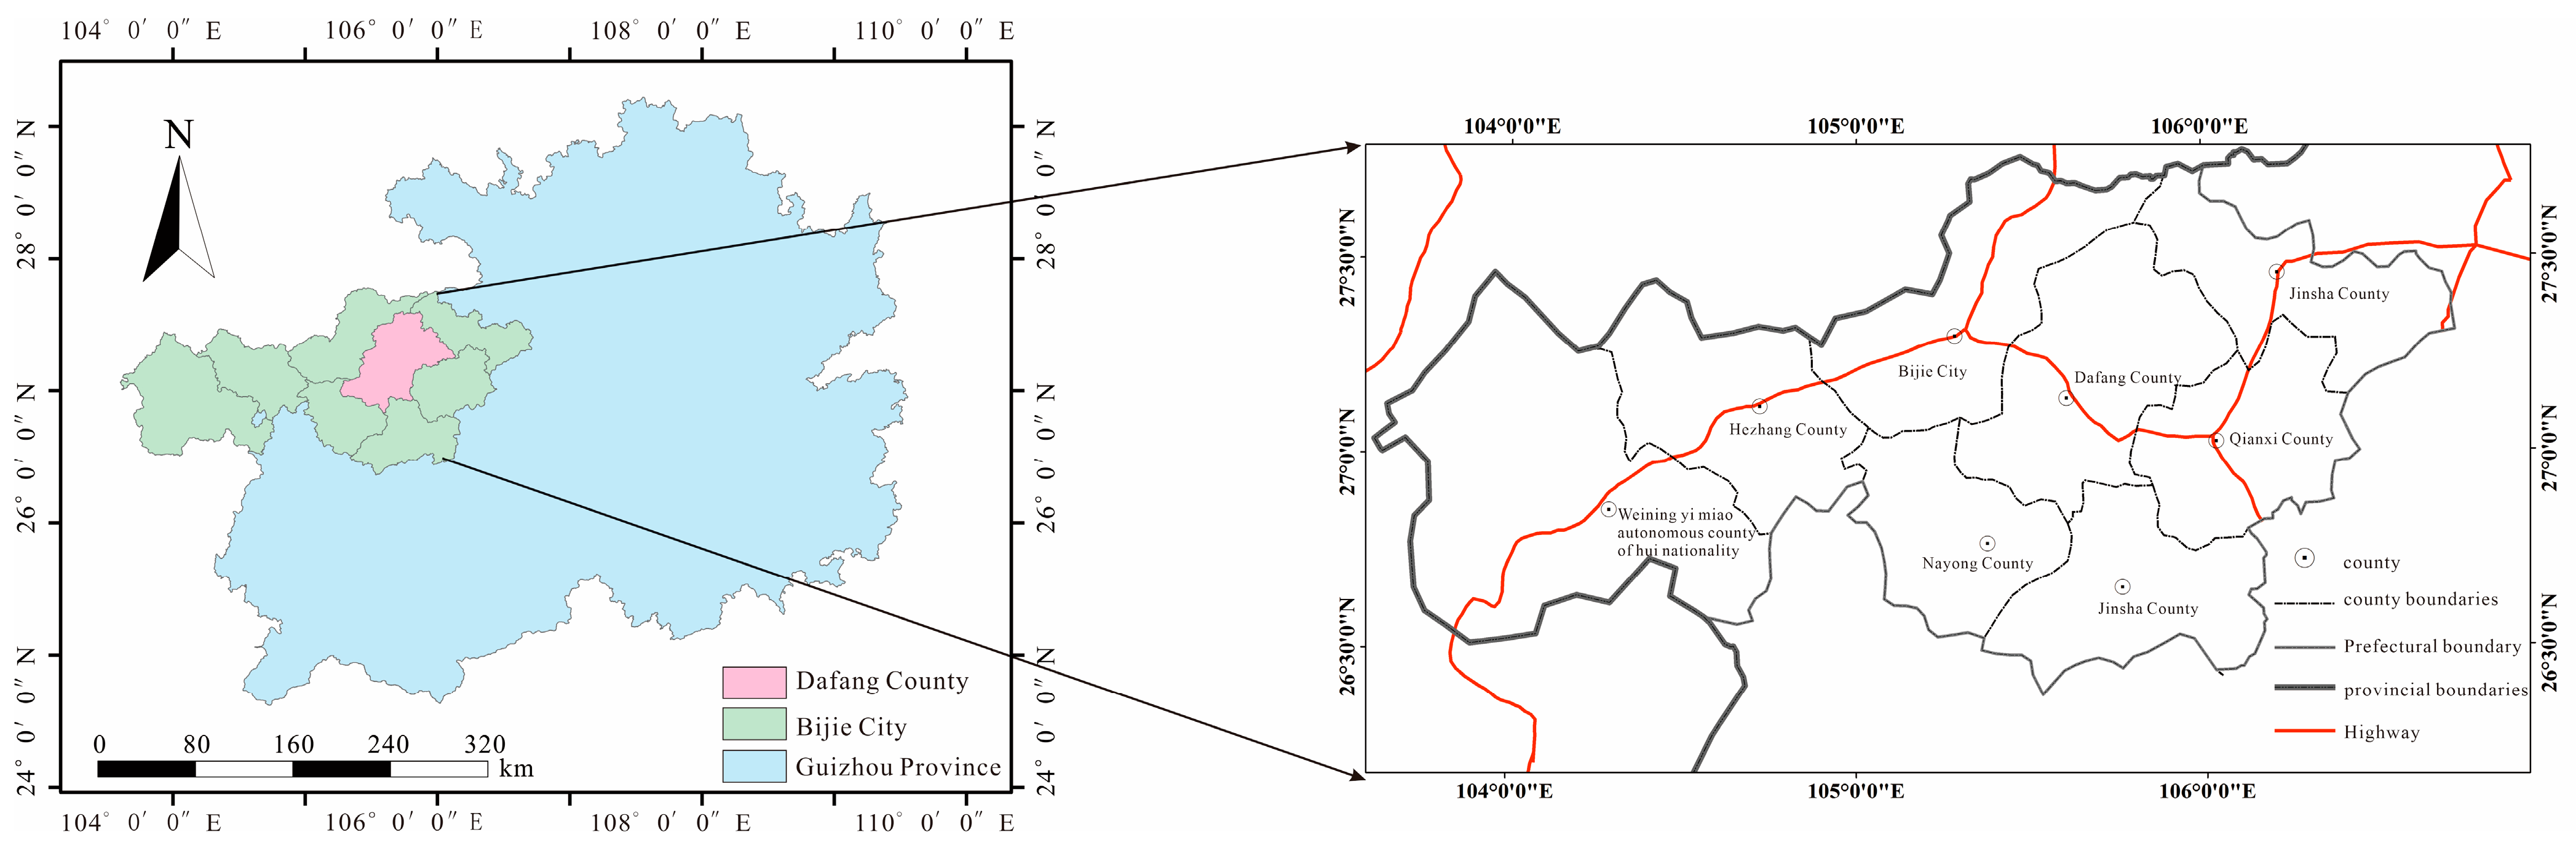
2.1. Overview of the Study Area
2.2. Experimental Design and Data Source
2.3. Research Methods
2.3.1. Decision Tree Construction
- (1)
- Vegetation coverage (FVC)
- (2)
- Rock exposure rate (FR)
2.3.2. Construction of Multiple Linear Regression Model
2.3.3. FLUS Model
- (1)
- The calculation formula for the suitability probability of the ANN neural network model is:
- (2)
- The basic formula of the Markov model is:
- (3)
- Adaptive inertia competition model formula:
3. Results
3.1. Spatial and Temporal Evolution Characteristics of Rocky Desertification in Dafang County
3.2. FLUS Model Prediction
4. Discussion
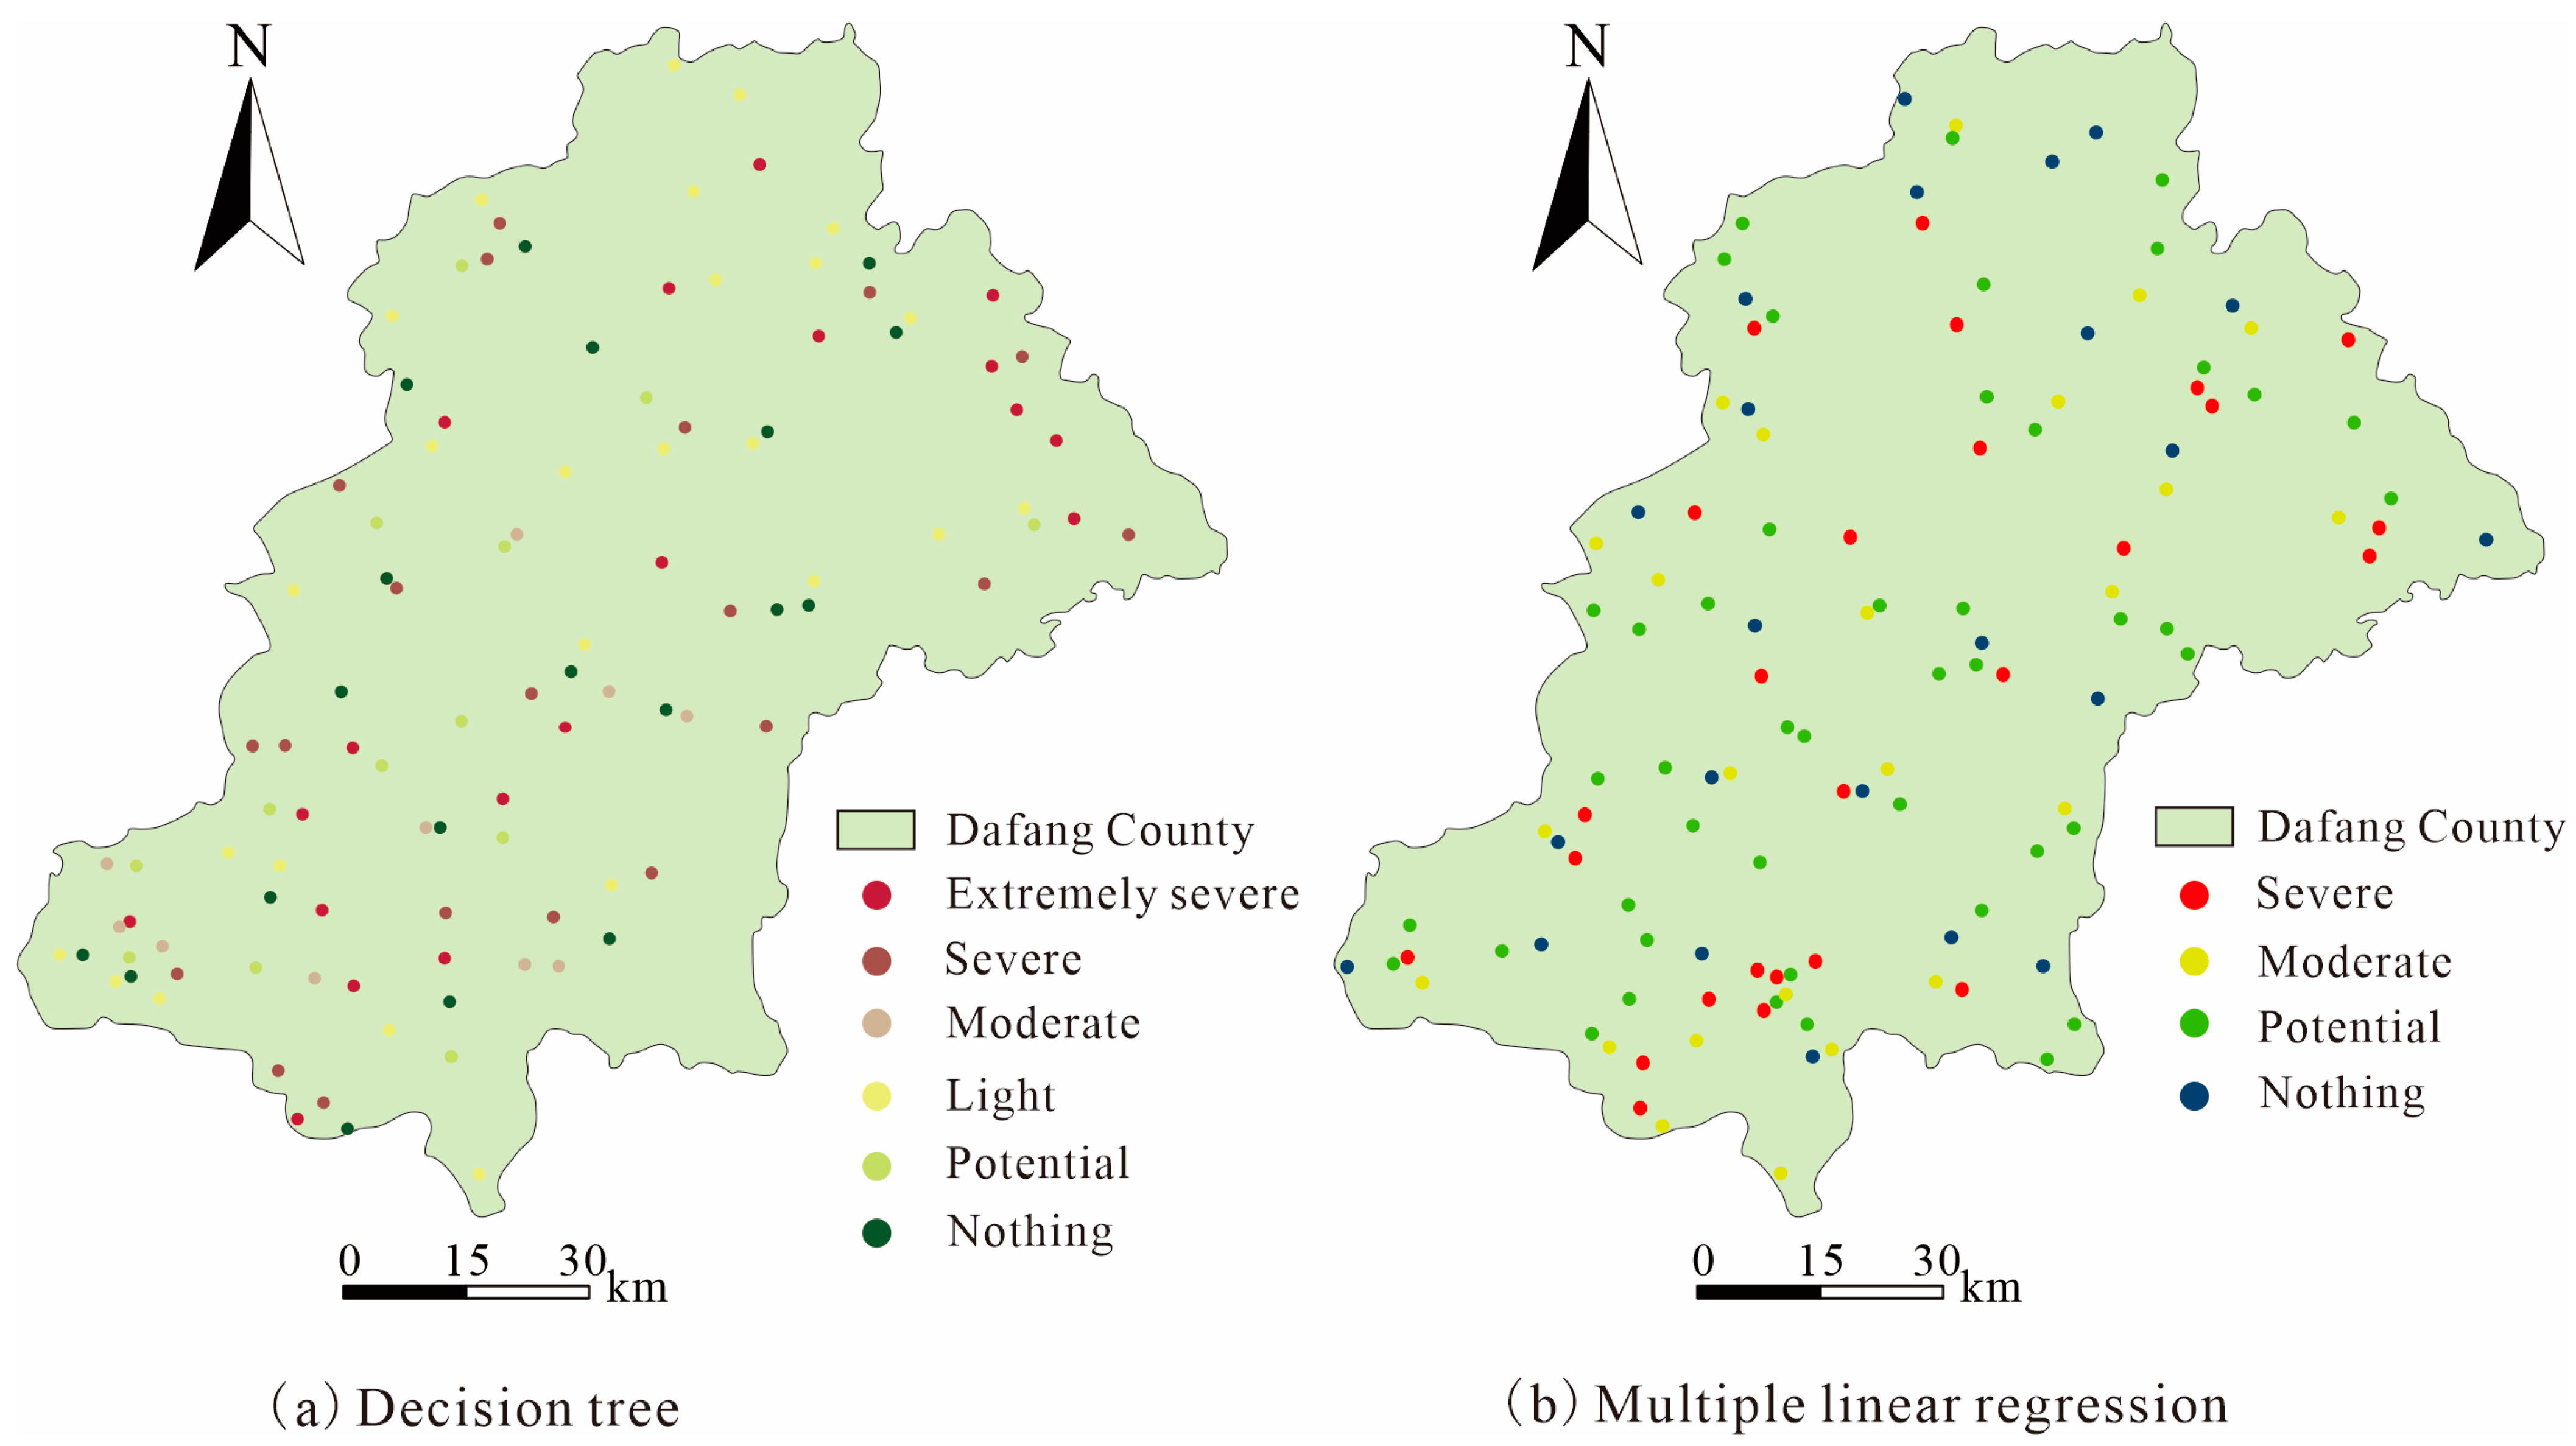
- (1)
- The research shows that the kappa coefficient of rocky desertification extracted by the decision tree is 0.521, and the overall classification accuracy is 60%. The kappa coefficient of rocky desertification extracted by the multiple linear regression model is 0.69, and the overall classification accuracy is 70%. Therefore, the multiple linear regression model extracts stone desertification data with higher accuracy compared with the decision tree.
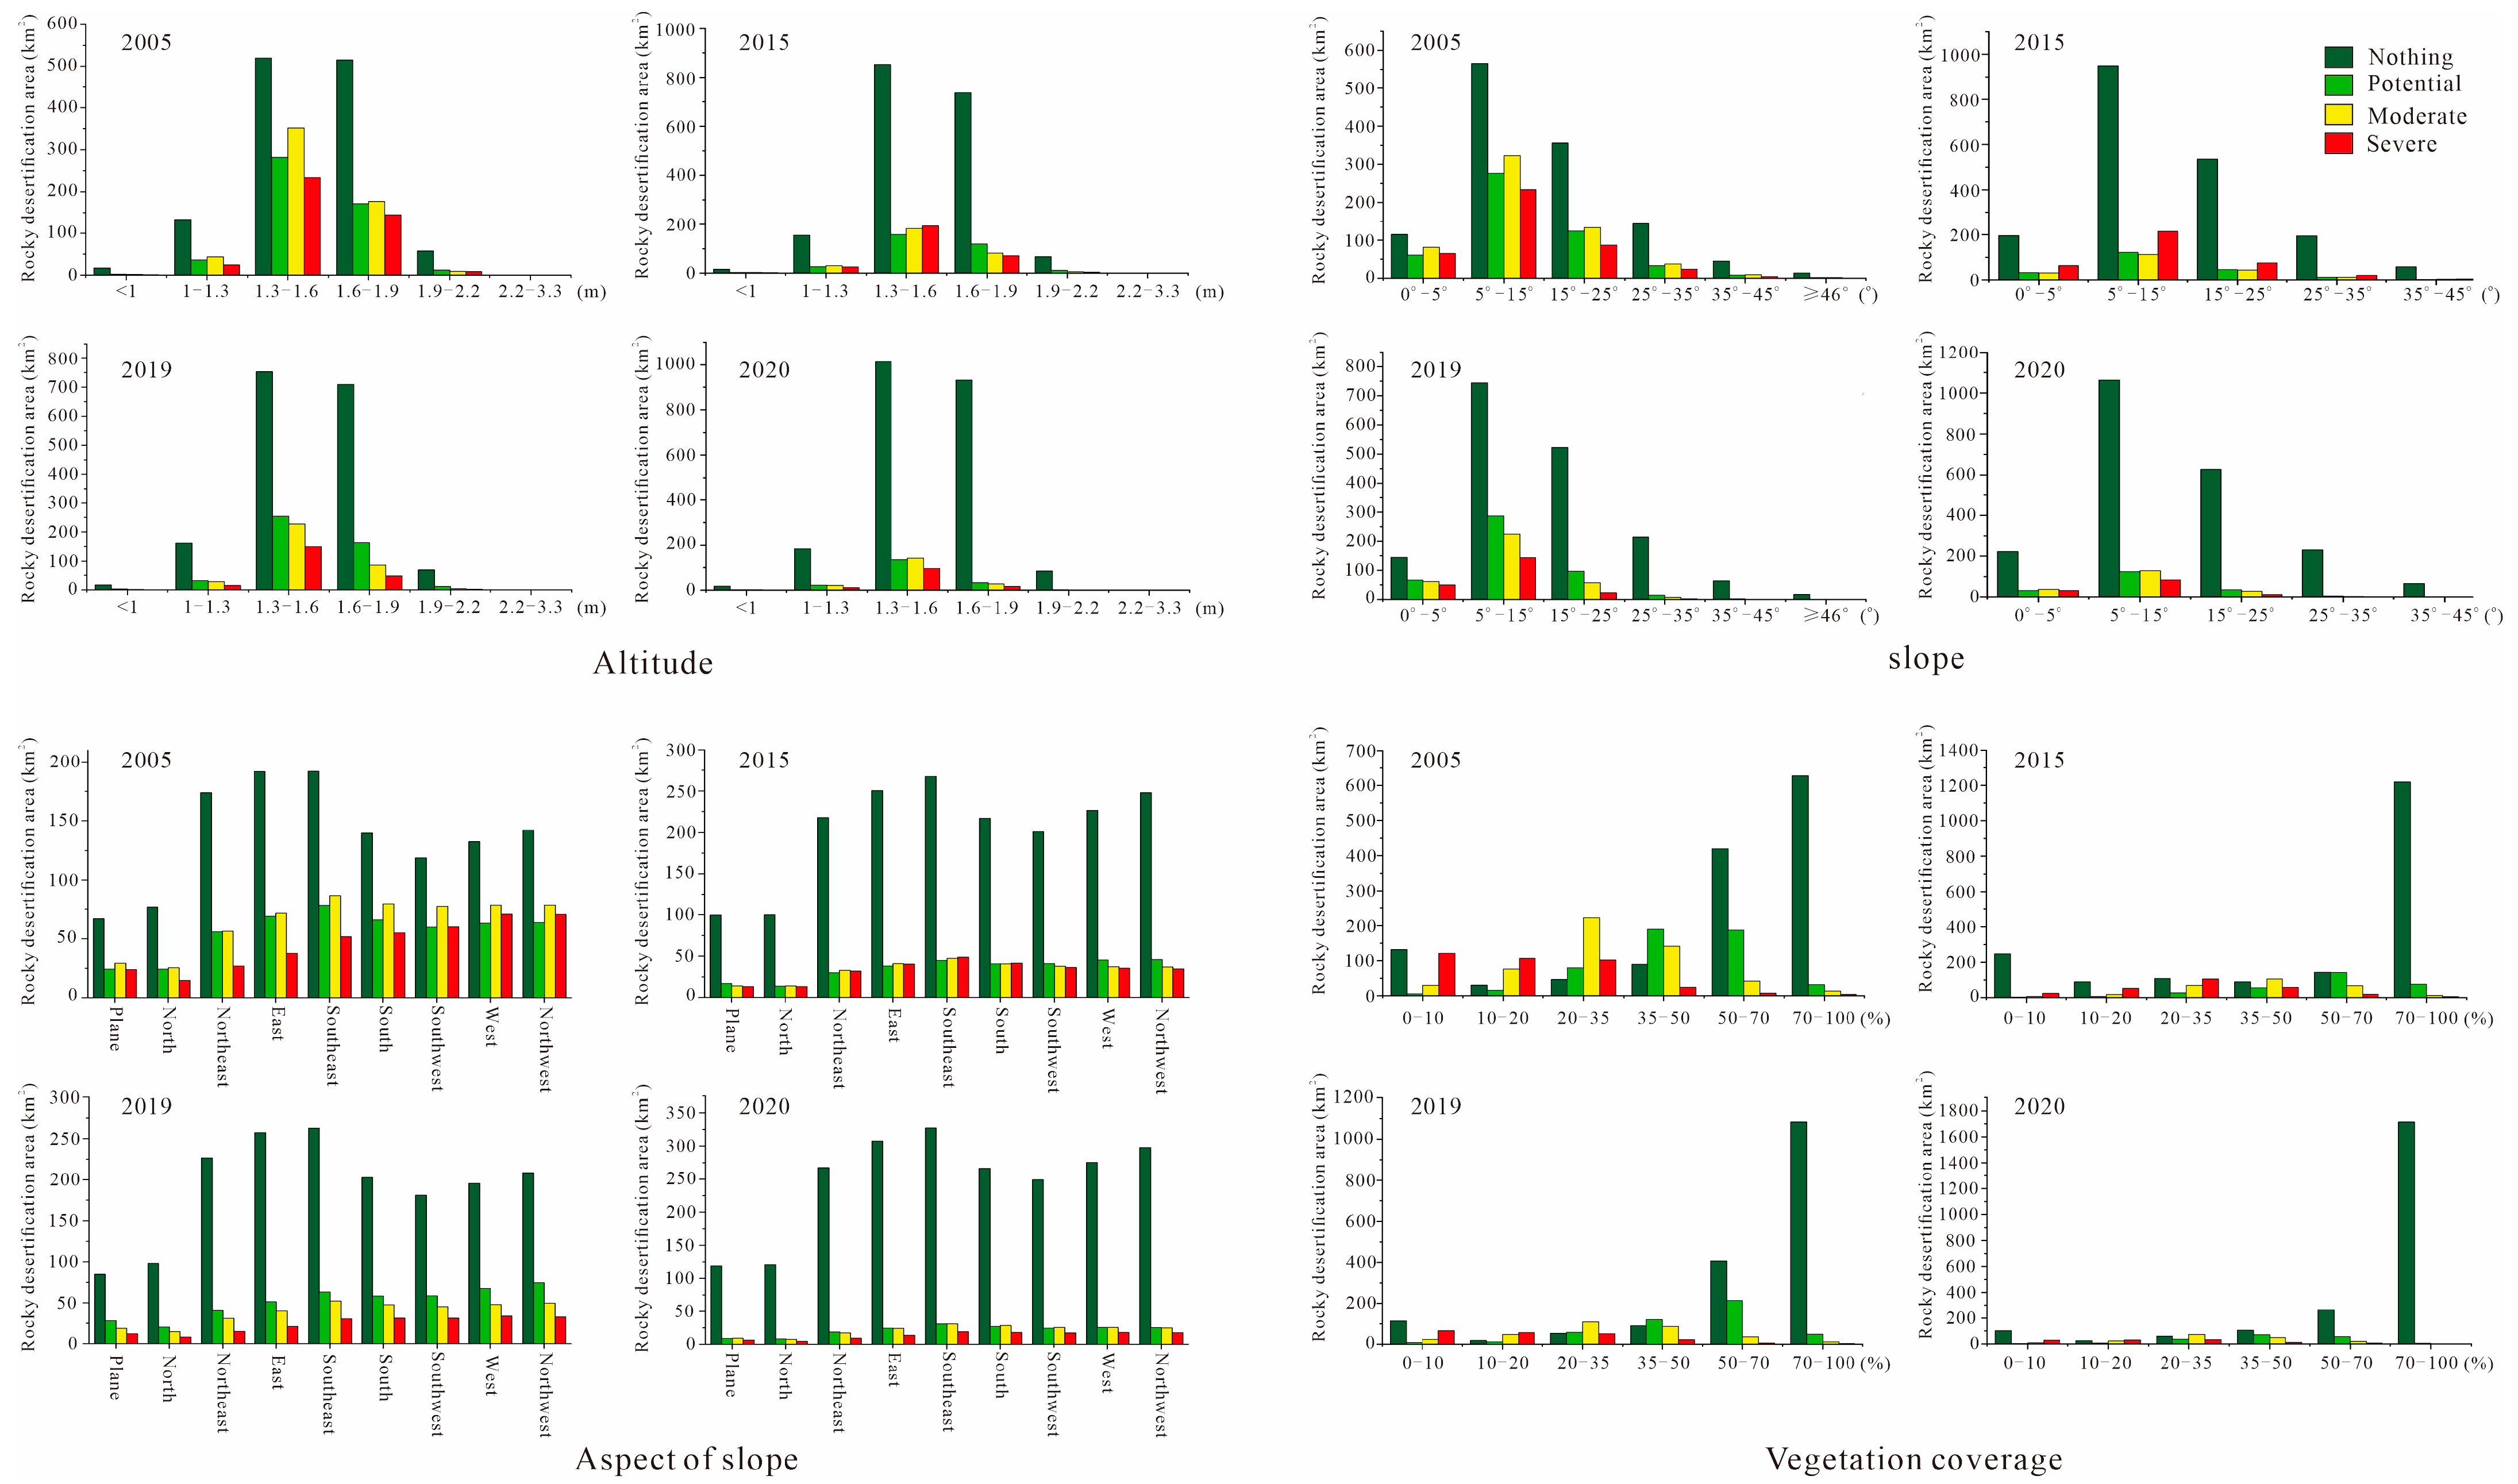
- (2)
- The distribution of rocky desertification is analyzed by superposition with terrain and vegetation factors. The results show that the rocky desertification of each grade has specific distribution characteristics under each slope, elevation, aspect and vegetation coverage. The slope is inversely proportional to rocky desertification, and the vegetation coverage is inversely proportional to rocky desertification. The Rocky Desertification in Dafang County is mainly distributed at an altitude of 1300 m~1900 m.
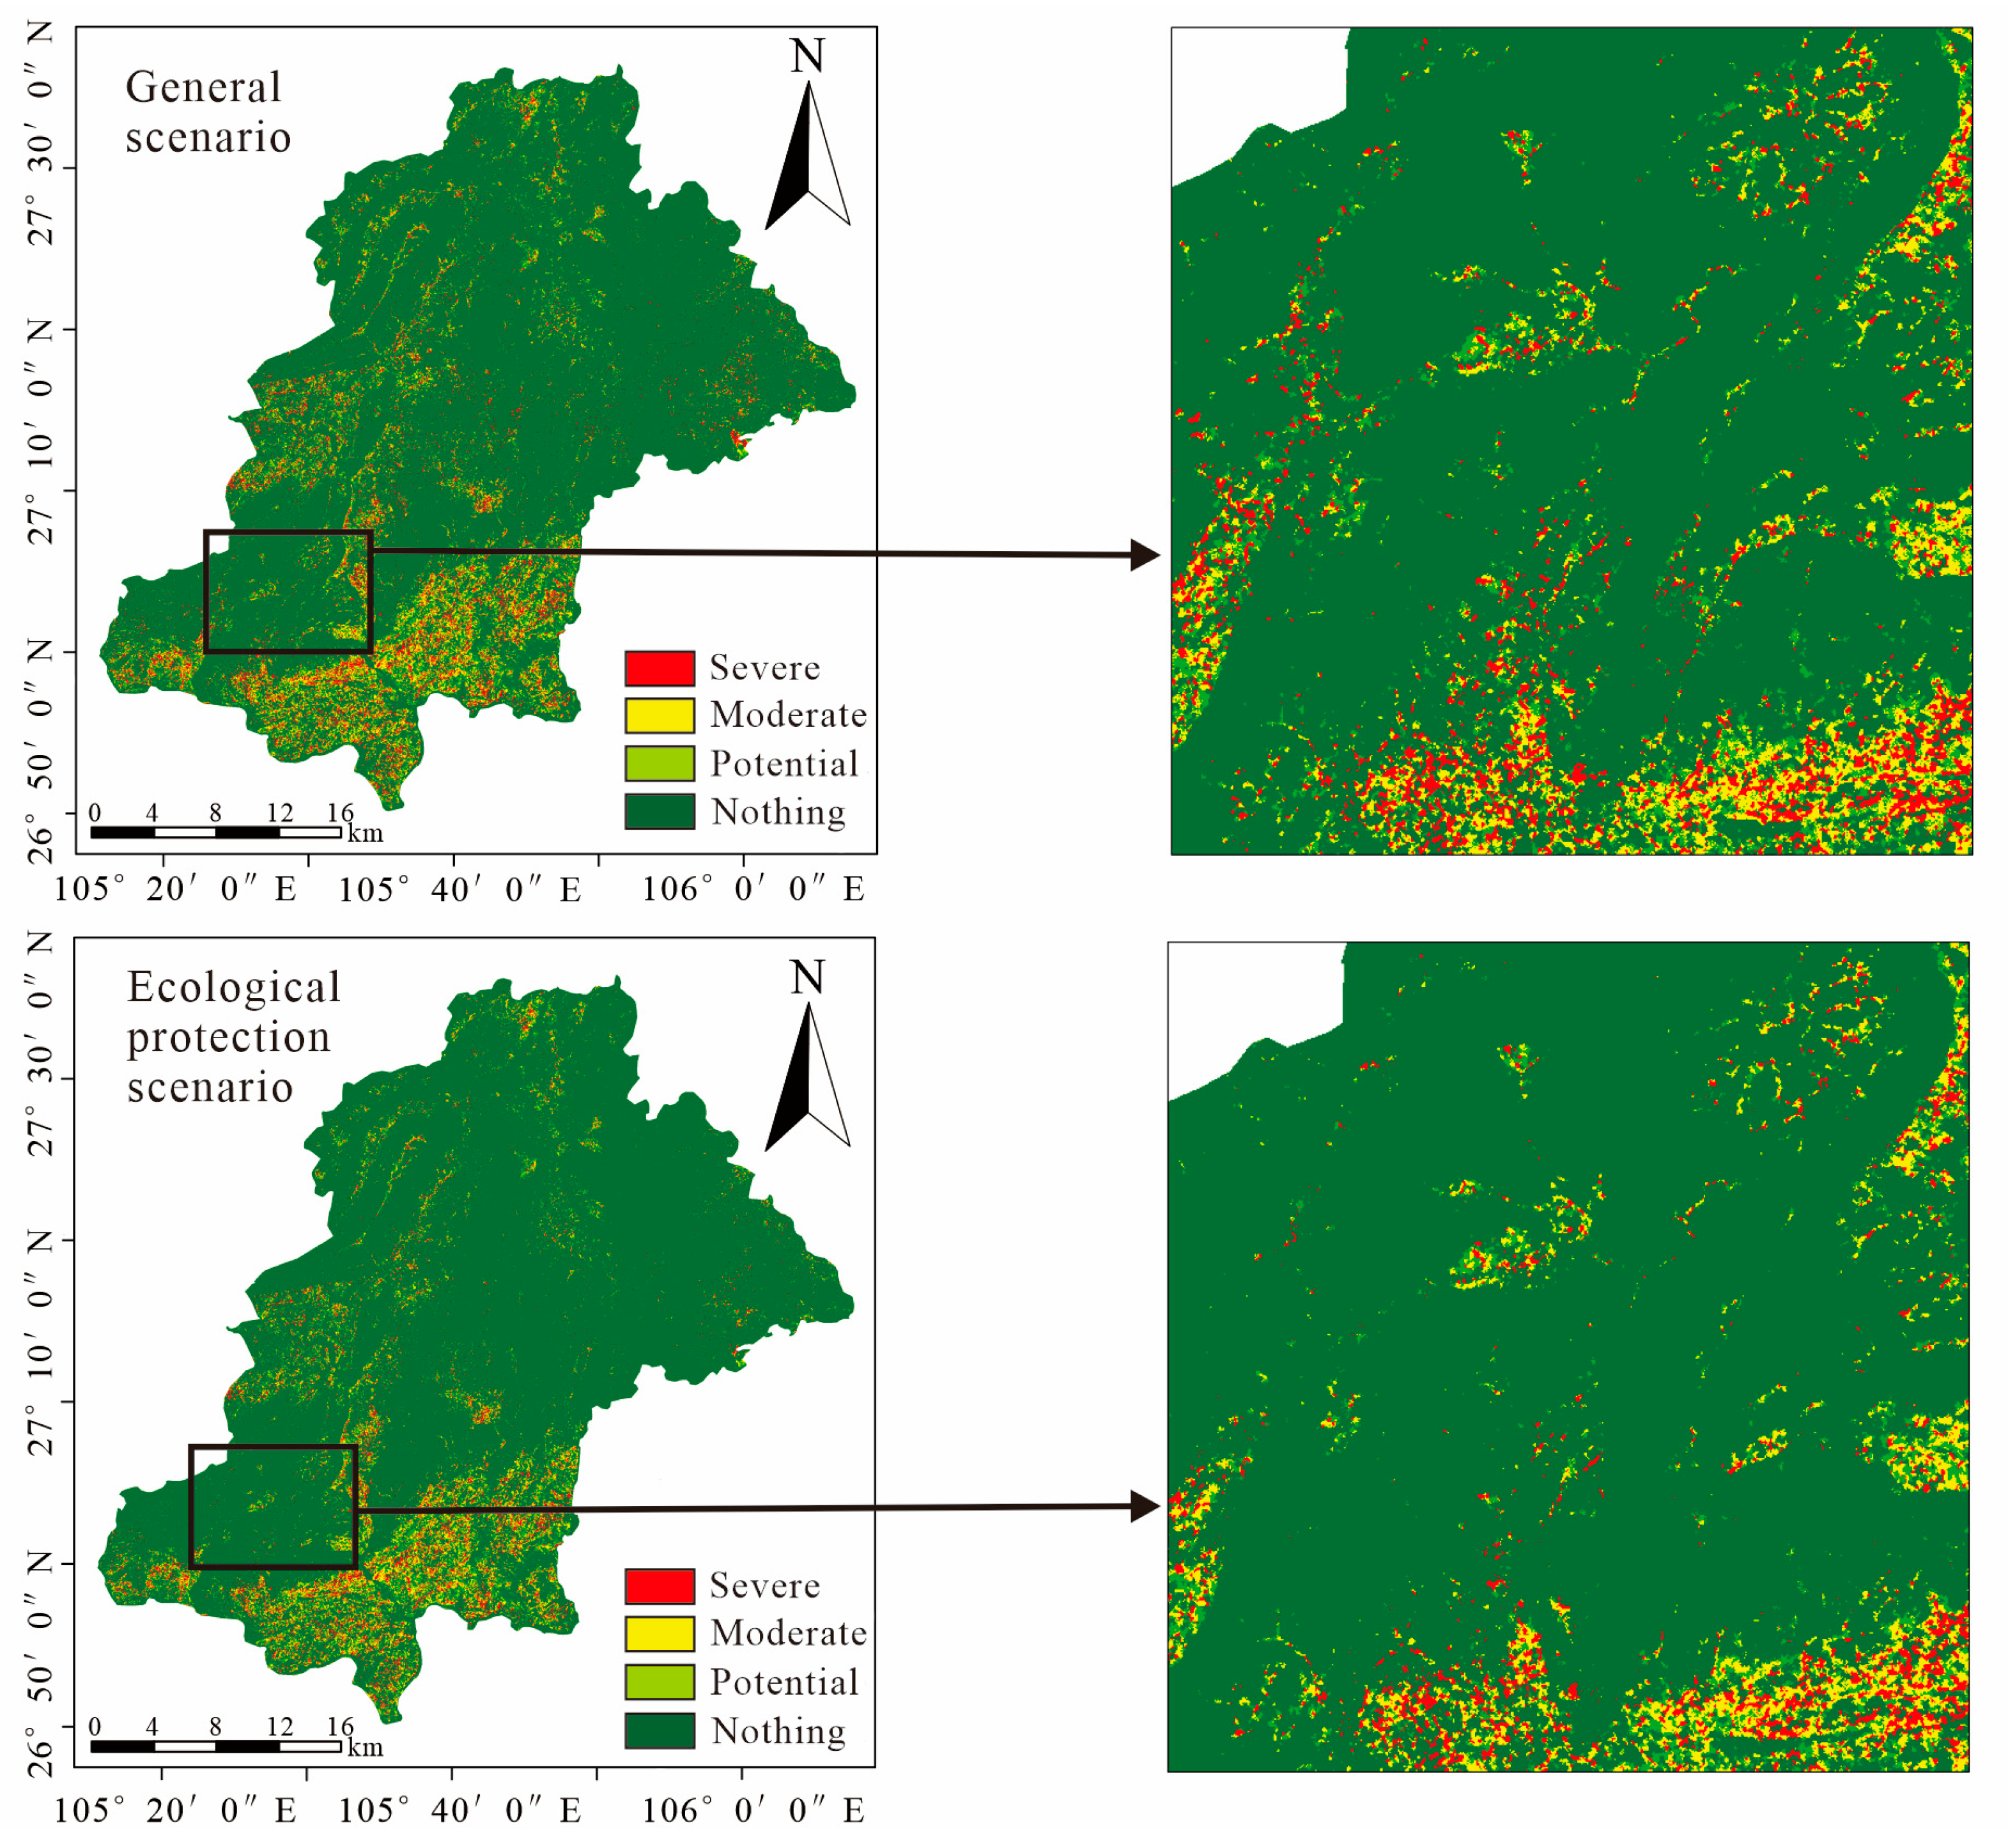
- (3)
- The FLUS model predicts that the area without rocky desertification will increase in 2035, and the area of severe, moderate and potential rocky desertification will decrease. Under the conventional scenario, the rocky desertification area is reduced from 12% to 11%. The area of rocky desertification under the ecological protection scenario is reduced from 12% to 8%, and the change rate of rocky desertification under the environmental protection scenario is greater.
5. Conclusions
- (1)
- Due to the low availability of Landsat data from 2000–2020 in Dafang County, only four-time phases of stone desertification monitoring data were collected in 2005, 2015, 2019 and 2020, with a time interval of 15 years, and additional periods are needed at a later stage with time to explore the succession pattern of stone desertification.
- (2)
- The FLUS model prediction only collects some driving factors and is closely related to human subjectivity and policy implementation; thus, more influencing factors can be considered in the follow-up to improve prediction accuracy.
Author Contributions
Funding
Data Availability Statement
Acknowledgments
Conflicts of Interest
References
- Lan, X.; Ding, G.; Dai, Q.; Yan, Y. Assessing the degree of soil erosion in karst mountainous areas by extenics. Catena 2022, 209, 105800. [Google Scholar] [CrossRef]
- Qi, X.; Zhang, C.; Wang, K. Comparing Remote Sensing Methods for Monitoring Karst Rocky Desertification at Sub-pixel Scales in a Highly Heterogeneous Karst Region. Sci. Rep. 2019, 9, 13368. [Google Scholar] [CrossRef] [PubMed] [Green Version]
- Li, S.; Yuan, L.; Yuan, X.; Wang, G. Comprehensive Atmosphere and Topographic Correction Model for Improve the Remote Sensing Data Inversion Precision of Rocky Desertification Area. J. Comput. Theor. Nanosci. 2016, 13, 2386–2394. [Google Scholar] [CrossRef]
- Shen, Y.; Wang, D.; Chen, Q.; Tang, Y.; Chen, F. Large heterogeneity of water and nutrient supply derived from runoff of nearby rock outcrops in karst ecosystems in SW China. Catena 2018, 172, 125–131. [Google Scholar] [CrossRef]
- Mo, C.; Mo, G.; Qin, J.; Zhou, M.; Yang, Q.; Huang, Y.; Yang, Y. Rainfall and runoff characteristics in a karstic basin of China. J. Water Clim. Chang. 2019, 10, 117–129. [Google Scholar] [CrossRef]
- Guo, C.; Li, Z.; Yang, J.; Tian, X.; Tian, Y.; Hu, J. Karst distribution and formation mechanism of a project construction site in Yunnan. Geol. Explor. 2015, 51, 984–992. [Google Scholar] [CrossRef]
- Lu, Y.; Liu, Q.; Zhang, F. Environmental characteristics of karst in China and their effect on engineering. Carbonates Evaporites 2013, 28, 251–258. [Google Scholar] [CrossRef] [Green Version]
- Zhang, Y.H.; Zhu, D.H. Spatial distribution and evolution of large karst caves in China. J. Guilin Univ. Technol. 2012, 32, 20–28. [Google Scholar] [CrossRef]
- Pan, S.; Liang, J.; Chen, W.; Li, J.; Liu, Z. Gray Forecast of Ecosystem Services Value and Its Driving Forces in Karst Areas of China: A Case Study in Guizhou Province, China. Int. J. Environ. Res. Public Health 2021, 18, 12404. [Google Scholar] [CrossRef]
- Li, Y.B.; Li, Q.Y.; Luo, G.J.; Bai, X.Y.; Wang, Y.Y.; Wang, S.J.; Xie, J.; Bin Yang, G. Discussing the genesis of karst rocky desertification research based on the correlations between cropland and settlements in typical peak-cluster depressions. Solid Earth 2016, 7, 741–750. [Google Scholar] [CrossRef]
- Pu, J.; Zhao, X.; Dong, P.; Wang, Q.; Yue, Q. Extracting Information on Rocky Desertification from Satellite Images: A Comparative Study. Remote Sens. 2021, 13, 2497. [Google Scholar] [CrossRef]
- Su, C.J.; Yue, T.; Jiang, L.; Li, X.M.; Wang, W.G. Karst rocky desertification information extraction based on the decision tree. ISPRS-Int. Arch. Photogramm. Remote Sens. Spat. Inf. Sci. 2020, XLII-3/W10, 367–373. [Google Scholar] [CrossRef] [Green Version]
- Wang, H.; Li, Q.; Du, X.; Zhao, L. Quantitative extraction of the bedrock exposure rate based on unmanned aerial vehicle data and Landsat-8 OLI image in a karst environment. Front. Earth Sci. 2017, 12, 481–490. [Google Scholar] [CrossRef]
- Chen, F.; Wang, S.; Bai, X.; Liu, F.; Tian, Y.; Luo, G.; Li, Q.; Wang, J.; Wu, L.; Cao, Y.; et al. Spatio-temporal evolution and future scenario prediction of karst rocky desertification based on CA–Markov model. Arab. J. Geosci. 2021, 14, 1–13. [Google Scholar] [CrossRef]
- Ren, J.; Meng, D.; Chen, H. Analysis of Temporal and Spatial Evolution of Rocky Desertification Sensitivity in Tongren, Guizhou Province. IOP Conf. Ser. Mater. Sci. Eng. 2020, 780, 042058. [Google Scholar] [CrossRef]
- Xi, H.; Wang, S.; Bai, X.; Tang, H.; Wu, L.; Chen, F.; Xiao, J.; Wang, M.; Li, H.; Cao, Y.; et al. Spatio-temporal characteristics of rocky desertification in typical Karst areas of Southwest China: A case study of Puding County, Guizhou Province. Acta Ecol. Sin. 2018, 38, 8919–8933. [Google Scholar] [CrossRef]
- Li, Q.; Song, A.; Yang, H.; Müller, W.E.G. Impact of Rocky Desertification Control on Soil Bacterial Community in Karst Graben Basin, Southwestern China. Front. Microbiol. 2021, 12, 636405. [Google Scholar] [CrossRef]
- Xie, J.; Yan, Z.; Wang, G.; Xue, W.; Li, C.; Chen, X.; Chen, D. A Bacterium Isolated From Soil in a Karst Rocky Desertification Region Has Efficient Phosphate-Solubilizing and Plant Growth-Promoting Ability. Front. Microbiol. 2021, 11, 625450. [Google Scholar] [CrossRef]
- Meng, W.; Dai, Q.; Ren, Q.; Tu, N.; Leng, T. Ecological stoichiometric characteristics of soil-moss C, N, and P in restoration stages of karst rocky desertification. PLoS ONE 2021, 16, e0252838. [Google Scholar] [CrossRef]
- Zhang, S.; Zhang, Y.; Xiong, K.; Yu, Y.; Min, X. Changes of leaf functional traits in karst rocky desertification ecological environment and the driving factors. Glob. Ecol. Conserv. 2020, 24, e01381. [Google Scholar] [CrossRef]
- Ma, T.; Deng, X.; Chen, L.; Xiang, W. The soil properties and their effects on plant diversity in different degrees of rocky desertification. Sci. Total Environ. 2020, 736, 139667. [Google Scholar] [CrossRef]
- Cao, W.; Xiong, Y.; Zhao, D.; Tan, H.; Qu, J. Bryophytes and the symbiotic microorganisms, the pioneers of vegetation restoration in karst rocky desertification areas in southwestern China. Appl. Microbiol. Biotechnol. 2019, 104, 873–891. [Google Scholar] [CrossRef] [Green Version]
- Ling, C.X.; Lin, H.; Xue, X.P. Rocky desertification information extraction based on vegetation index characteristics and spatial analysis. Res. Soil Water Conserv. 2009, 16, 167–171+273. [Google Scholar]
- Zu, Q.; Yuan, X.; Mo, Y. Feature information extraction from spot images based on object-oriented classification. Karst China 2011, 30, 227–232. [Google Scholar] [CrossRef] [Green Version]
- Wang, X.; Li, X.; Wu, X. Simulation of karst rocky desertification pattern based on cellular automata. J. Ecol. 2012, 32, 907–914. [Google Scholar] [CrossRef] [Green Version]
- Bao, Y.; Li, W.; Huang, Z.; Huang, C.; Tao, L.; Wei, H. Fuzzy Comprehensive Evaluation and Analytic Hierarchy Process for Performance Analysis and Appraisal of Land Consolidation Plan Project. Sens. Lett. 2014, 12, 944–952. [Google Scholar] [CrossRef]
- Liang, X.; Liu, X.; Li, D.; Zhao, H.; Chen, G. Urban growth simulation by incorporating planning policies into a CA-based future land-use simulation model. Int. J. Geogr. Inf. Sci. 2018, 32, 2294–2316. [Google Scholar] [CrossRef]
- Yang, J.; Zhou, Q.; Wei, X.; Yang, J. Analysis of soil erosion change in Dafang County from 1990 to 2015 based on USLE Model. Sci. Technol. Horiz. 2018, 2, 18–19+44. [Google Scholar] [CrossRef]
- Ma, L.; Wang, J.; Liu, G. Spatial variation of rock desertification in typical karst areas of southeast Yunnan. Soil Water Conserv. Bull. 2015, 35, 327–333+2. [Google Scholar] [CrossRef]
- Zhuo, T.A.; Diao, C.T.; Su, W.C.; Sun, X.F.; Yan, D.J. Temporal and spatial evolution process and evolution characteristics of rocky desertification in Bijie Experimental Area. J. Ecol. 2014, 34, 7067–7077. [Google Scholar]
- Wang, Z.; Zhang, T.; Pei, C.; Zhao, X.; Li, Y.; Hu, S.; Bu, C.; Zhang, Q. Multisource Remote Sensing Monitoring and Analysis of the Driving Forces of Vegetation Restoration in the Mu Us Sandy Land. Land 2022, 11, 1553. [Google Scholar] [CrossRef]


| Year | FVC Calculation Formula |
|---|---|
| 2005 | ] |
| 2015 | ] |
| 2019 | ] |
| 2020 | ] |
| Year | FR Calculation Formula |
|---|---|
| 2005 | |
| 2015 | |
| 2019 | |
| 2020 |
| Strength Grade | Rock Exposure Rate (%) | Vegetation Coverage (%) | Utilization Value |
|---|---|---|---|
| Nothing | 0–40 | 70–100 | Construction land, water body, forest land, grassland, etc. |
| Potential | 40–60 | 50–70 | Forest land, shrubland, grassland, etc. |
| Light | 60–70 | 35–50 | Sparse shrubbery, sloping farmland, grassland, unused land, etc |
| Moderate | 70–80 | 20–35 | Sparse shrubbery, sloping farmland, grassland, unused land, etc. |
| Severe | 80–90 | 10–20 | Stone-sloping farmland, grassland, unused land, etc. |
| Extremely severe | 90–100 | 0–10 | Stone-sloping farmland, grassland, unused land, etc. |
| Correlation Factor | Correlation Coefficient | Correlation Factor | Correlation Coefficient |
|---|---|---|---|
| NDVI | −0.820 | DEM | −0.475 |
| NDRI | −0.308 | Aspect | 0.057 |
| Slope | −0.327 | Rocky desertification grade | 1 |
| Image | Formula for Classification of Rocky Desertification Types | R2 |
|---|---|---|
| Landsat5 | 0.822 | |
| Landsat8 | 0.701 |
| Year | 2005 | 2015 | 2019 | 2020 | ||||
|---|---|---|---|---|---|---|---|---|
| Grade of Rocky Desertification | Proportion (%) | Area (km2) | Proportion (%) | Area (km2) | Proportion (%) | Area (km2) | Proportion (%) | Area (km2) |
| Nothing | 45.32 | 1244.42 | 66.56 | 1827.77 | 62.37 | 1712.72 | 81.25 | 2231.15 |
| Potential | 18.37 | 504.42 | 11.62 | 319.11 | 16.97 | 465.99 | 7.07 | 194.22 |
| Moderate | 21.27 | 584.06 | 11.03 | 302.77 | 12.73 | 349.54 | 7.08 | 194.55 |
| Severe | 15.04 | 413.09 | 10.79 | 296.36 | 7.93 | 217.76 | 4.59 | 126.07 |
| Total | 1 | 2746 | 1 | 2746 | 1 | 2746 | 1 | 2746 |
| Type | Rock Free Desertification | Potential Rocky Desertification | Moderate Rocky Desertification | Severe Rocky Desertification | ||||
|---|---|---|---|---|---|---|---|---|
| Area (km2) | Proportion (%) | Area (km2) | Proportion (%) | Area (km2) | Proportion (%) | Area (km2) | Proportion (%) | |
| General scenario | 2304.31 | 0.84 | 147.16 | 0.05 | 168.64 | 0.06 | 125.88 | 0.05 |
| Ecological protection scenario | 2399.06 | 0.87 | 119.24 | 0.04 | 141.02 | 0.05 | 86.68 | 0.03 |
| Variation | 94.75 | — | −27.92 | — | −27.62 | — | −39.20 | — |
Publisher’s Note: MDPI stays neutral with regard to jurisdictional claims in published maps and institutional affiliations. |
© 2022 by the authors. Licensee MDPI, Basel, Switzerland. This article is an open access article distributed under the terms and conditions of the Creative Commons Attribution (CC BY) license (https://creativecommons.org/licenses/by/4.0/).
Share and Cite
Cao, J.; Wen, X.; Zhang, M.; Luo, D.; Tan, Y. Information Extraction and Prediction of Rocky Desertification Based on Remote Sensing Data. Sustainability 2022, 14, 13385. https://doi.org/10.3390/su142013385
Cao J, Wen X, Zhang M, Luo D, Tan Y. Information Extraction and Prediction of Rocky Desertification Based on Remote Sensing Data. Sustainability. 2022; 14(20):13385. https://doi.org/10.3390/su142013385
Chicago/Turabian StyleCao, Jiaju, Xingping Wen, Meimei Zhang, Dayou Luo, and Yinlong Tan. 2022. "Information Extraction and Prediction of Rocky Desertification Based on Remote Sensing Data" Sustainability 14, no. 20: 13385. https://doi.org/10.3390/su142013385
APA StyleCao, J., Wen, X., Zhang, M., Luo, D., & Tan, Y. (2022). Information Extraction and Prediction of Rocky Desertification Based on Remote Sensing Data. Sustainability, 14(20), 13385. https://doi.org/10.3390/su142013385