1. Introduction
South Asia is one of the most densely populated regions in the world. It faces severe poverty-related problems, with around 21% of residents facing severe food insecurity and a very high rating on the global hunger index (26.1) [
1]. Most of these undernourished people reside in rural areas where agriculture is the largest employment sector, providing work to 42% of the working population [
2]. As the region occupies only 4.90% of the total land globally, it is dominated by smallholder farming. The FAO has broadly categorised the region into 11 farming systems and one-third of the agricultural population follows rice-wheat cropping as practiced on 19% of the land.
The Punjab state in India is agriculturally advanced with a predominance of rice-wheat farming and with the highest income of agricultural households among all states [
3]. The state has the highest availability and consumption of chemical fertilizers in the country and around 80% of its cropped area is under high yielding varieties [
4]. However, all this progress has little advantage for smaller farmers due to a lesser marketable surplus and general inflation, which have increased income inequality among agricultural households [
5,
6,
7,
8]. There is ample evidence of productivity constraints and non-viability of smallholders since the inception of modern agriculture in Punjab [
9,
10,
11,
12]. The economic reforms in the country have further worsened the situation due to insufficient income in the agricultural sector, which has alarmingly increased farmer indebtedness in the state [
13].
The agricultural household is a unique economic entity that optimises its welfare through engagement in agricultural and non-agricultural activities [
14]. The decision of the farm household to engage in pluri-activity or to quit agriculture depends upon many factors such as low income from agriculture, non-farm work opportunities and family composition. Where possible, pluri-activity is preferred over a single occupation as it provides higher security [
15]. Farm households’ choice of non-agricultural employment may depend on push and pull factors. Push factors play a more prominent role in income diversification than pull factors [
16,
17]. The most common push factors are low productivity, low income and high risk associated with agricultural enterprises [
16,
18]. Marginal and small farmers face these challenges more often than other farm-size categories [
19]. The schedule castes, who constitute about 31.94% of the population in the state, predominate among poor households, as more than 60% of the 0.5 million poverty-ridden families in the state belong to this community [
20]. The majority of scheduled castes in rural areas are employed in casual work and low paid activities. The factors leading to their poor economic conditions include illiteracy, a high dependency ratio, poor health and lack of productive assets [
21]. Being the most exploited class in the Indian society, there are high chances of class conflict if deprived of their legitimate welfare rights, which requires immediate redressal.
Given the current level of the population, small-sized farms will remain operational in the region in the coming decades. The ability of the Punjab economy to provide decent income to marginal and small farm households requires critical examination. Hence, formulating suitable policies to address these issues is highly desirable and presents the need of the hour. Thus, the present study attempts to evaluate income, consumption, income inequality and occupational participation of marginal and small farm households, to evaluate socially deprived castes’ economic situation among farm households and to suggest policy instruments and a future outlook for the region.
2. Materials and Methods
The present study is based on data obtained from the 70th round of the Situation Assessment Survey of Agricultural Households of the National Sample Survey Organization [
22]. The survey covered 558 farm households in Punjab and the outliers were removed to obtain reliable estimates by using the Inter Quartile Range approach [
23]. Hence, the final sample contains 553 farm households. Income estimates are computed using the appropriate weights. The equalised monetary value of household income is suggested for inequality studies [
24]. A square root equivalence scale is applied to per capita household income to obtain income inequality estimates [
25]. Households with a negative income are given a small positive value of e to facilitate computation (e = 10
−10) [
26]. In the present study, a farm household is considered as a household in which at least one of the members is engaged in crop production. The income of the farm household derives from crop cultivation, livestock, regular wages and salaries, casual wages and non-farm business. Crop income includes the income earned from crop cultivation, including the value of the by-products minus the paid-out expenses incurred in crop production. Livestock income comprises the income a household earns from the sale of various livestock products minus the maintenance cost for livestock. The income derived by any household member employed anywhere other than in their own household enterprises (agriculture, manufacturing and services sector) and receiving regular wages and salaries is categorised under the regular wage and salary groups. The income earned by any household member by casual employment outside the household enterprises is defined as income earned from casual wages in agriculture, construction and other miscellaneous sectors. Non-farm business income defines a situation in which any household member engages in non-farm business activities such as in hotels, restaurants, transport, construction and manufacturing. The consumption expenditure is also calculated, including the expenditure incurred for food and non-food items and services such as transport, electricity, education, medical, rent, telephone, etc.
Quintile groups are formed based on income to examine the distribution of farm households in different income quintiles. Averages and percentages are used to obtain estimates for income and consumption. Estimates of income inequality coefficients are obtained using the Gini coefficient, where the value of the Gini coefficient lies between 0 and 1. A higher value of the coefficient signifies high inequality. Vertical decomposition of income inequality by different income sources was obtained by the method suggested by [
27]. This broke down overall inequality among the inequality of each income source according to their contribution to the total. Theil index obtains a horizontal decomposition of income inequality by farm-size category. It is computed for each income source and the total income of the household. Theil index is the only measure that satisfies the desirable properties of an inequality measure and facilitates decomposability into within and between categories [
28]. It naturally decomposes the population by sub-groups; hence, total income inequality can be decomposed within and between sources and sub-groups of farm-size categories.
Theil inequality coefficient is defined as:
For the discrete income observations x
i where i varies from 1 to n with mean
.
where
where j equals the number of groups (farm categories in the present case), n and n
j are the total number of households and households in group j, respectively;
is the household’s income in group j and
is the mean income of all households. The first (TBG)and second (TWG) terms represent between-group and within-group inequality. It is important to note that the index does not weigh the individual groups. The Theil index is computed for all the household income sources and total income by differentiating the income by farm-size category groups. The value of the Theil index lies between zero and infinity, where a higher value of the index signifies higher inequality. Further, the correlation coefficient establishes the farm size and productivity relationship.
3. Results
The present section intends to briefly (
Section 3.1) discuss the socio-economic profile which includes social and demographic characteristics along with the income status of farm households, (
Section 3.2) provide evidence of farm households’ stress and (
Section 3.3) income inequality among farm households and finally, concludes with (
Section 3.4) suggestions on the future outlook for the distressed group among farm households.
3.1. Socio-Economic Profile of Farm Households
3.1.1. Social and Demographic Characteristics of Farm Households
The average family size of farm households in Punjab is 5.49 members (
Table 1). The average family size directly correlates with the farm size. The society is divided into several social groups in India, and Punjab is no exception. Most of the farm households in Punjab belong to the general category (84.41%), followed by Other Backward Class (OBC) (9.32%) and Schedule Caste (SC) (6.27%). Across different farm-size categories, the percentage share of the SC caste is the highest in the marginal category (12.04%). Similarly, the percentage of OBC farm households across different farm sizes is also the highest in the marginal farm-size category (15.76%). Education, which is considered a criterion by which to judge an individual’s intellect, provides a broader idea about the generally accepted intelligent quotient of the individual. Moreover, higher education has been identified as an essential factor affecting the probability of accessing a regular high paid job [
29]. It also positively affects the per capita household income of vulnerable sections in rural Punjab [
30]. Differences in the education of the household head among farm households was observed in Punjab. The household heads with graduation or higher education are the highest among large farm households (14.29%) and the lowest among marginal farm households (1.85%).
3.1.2. Income of Farm Households
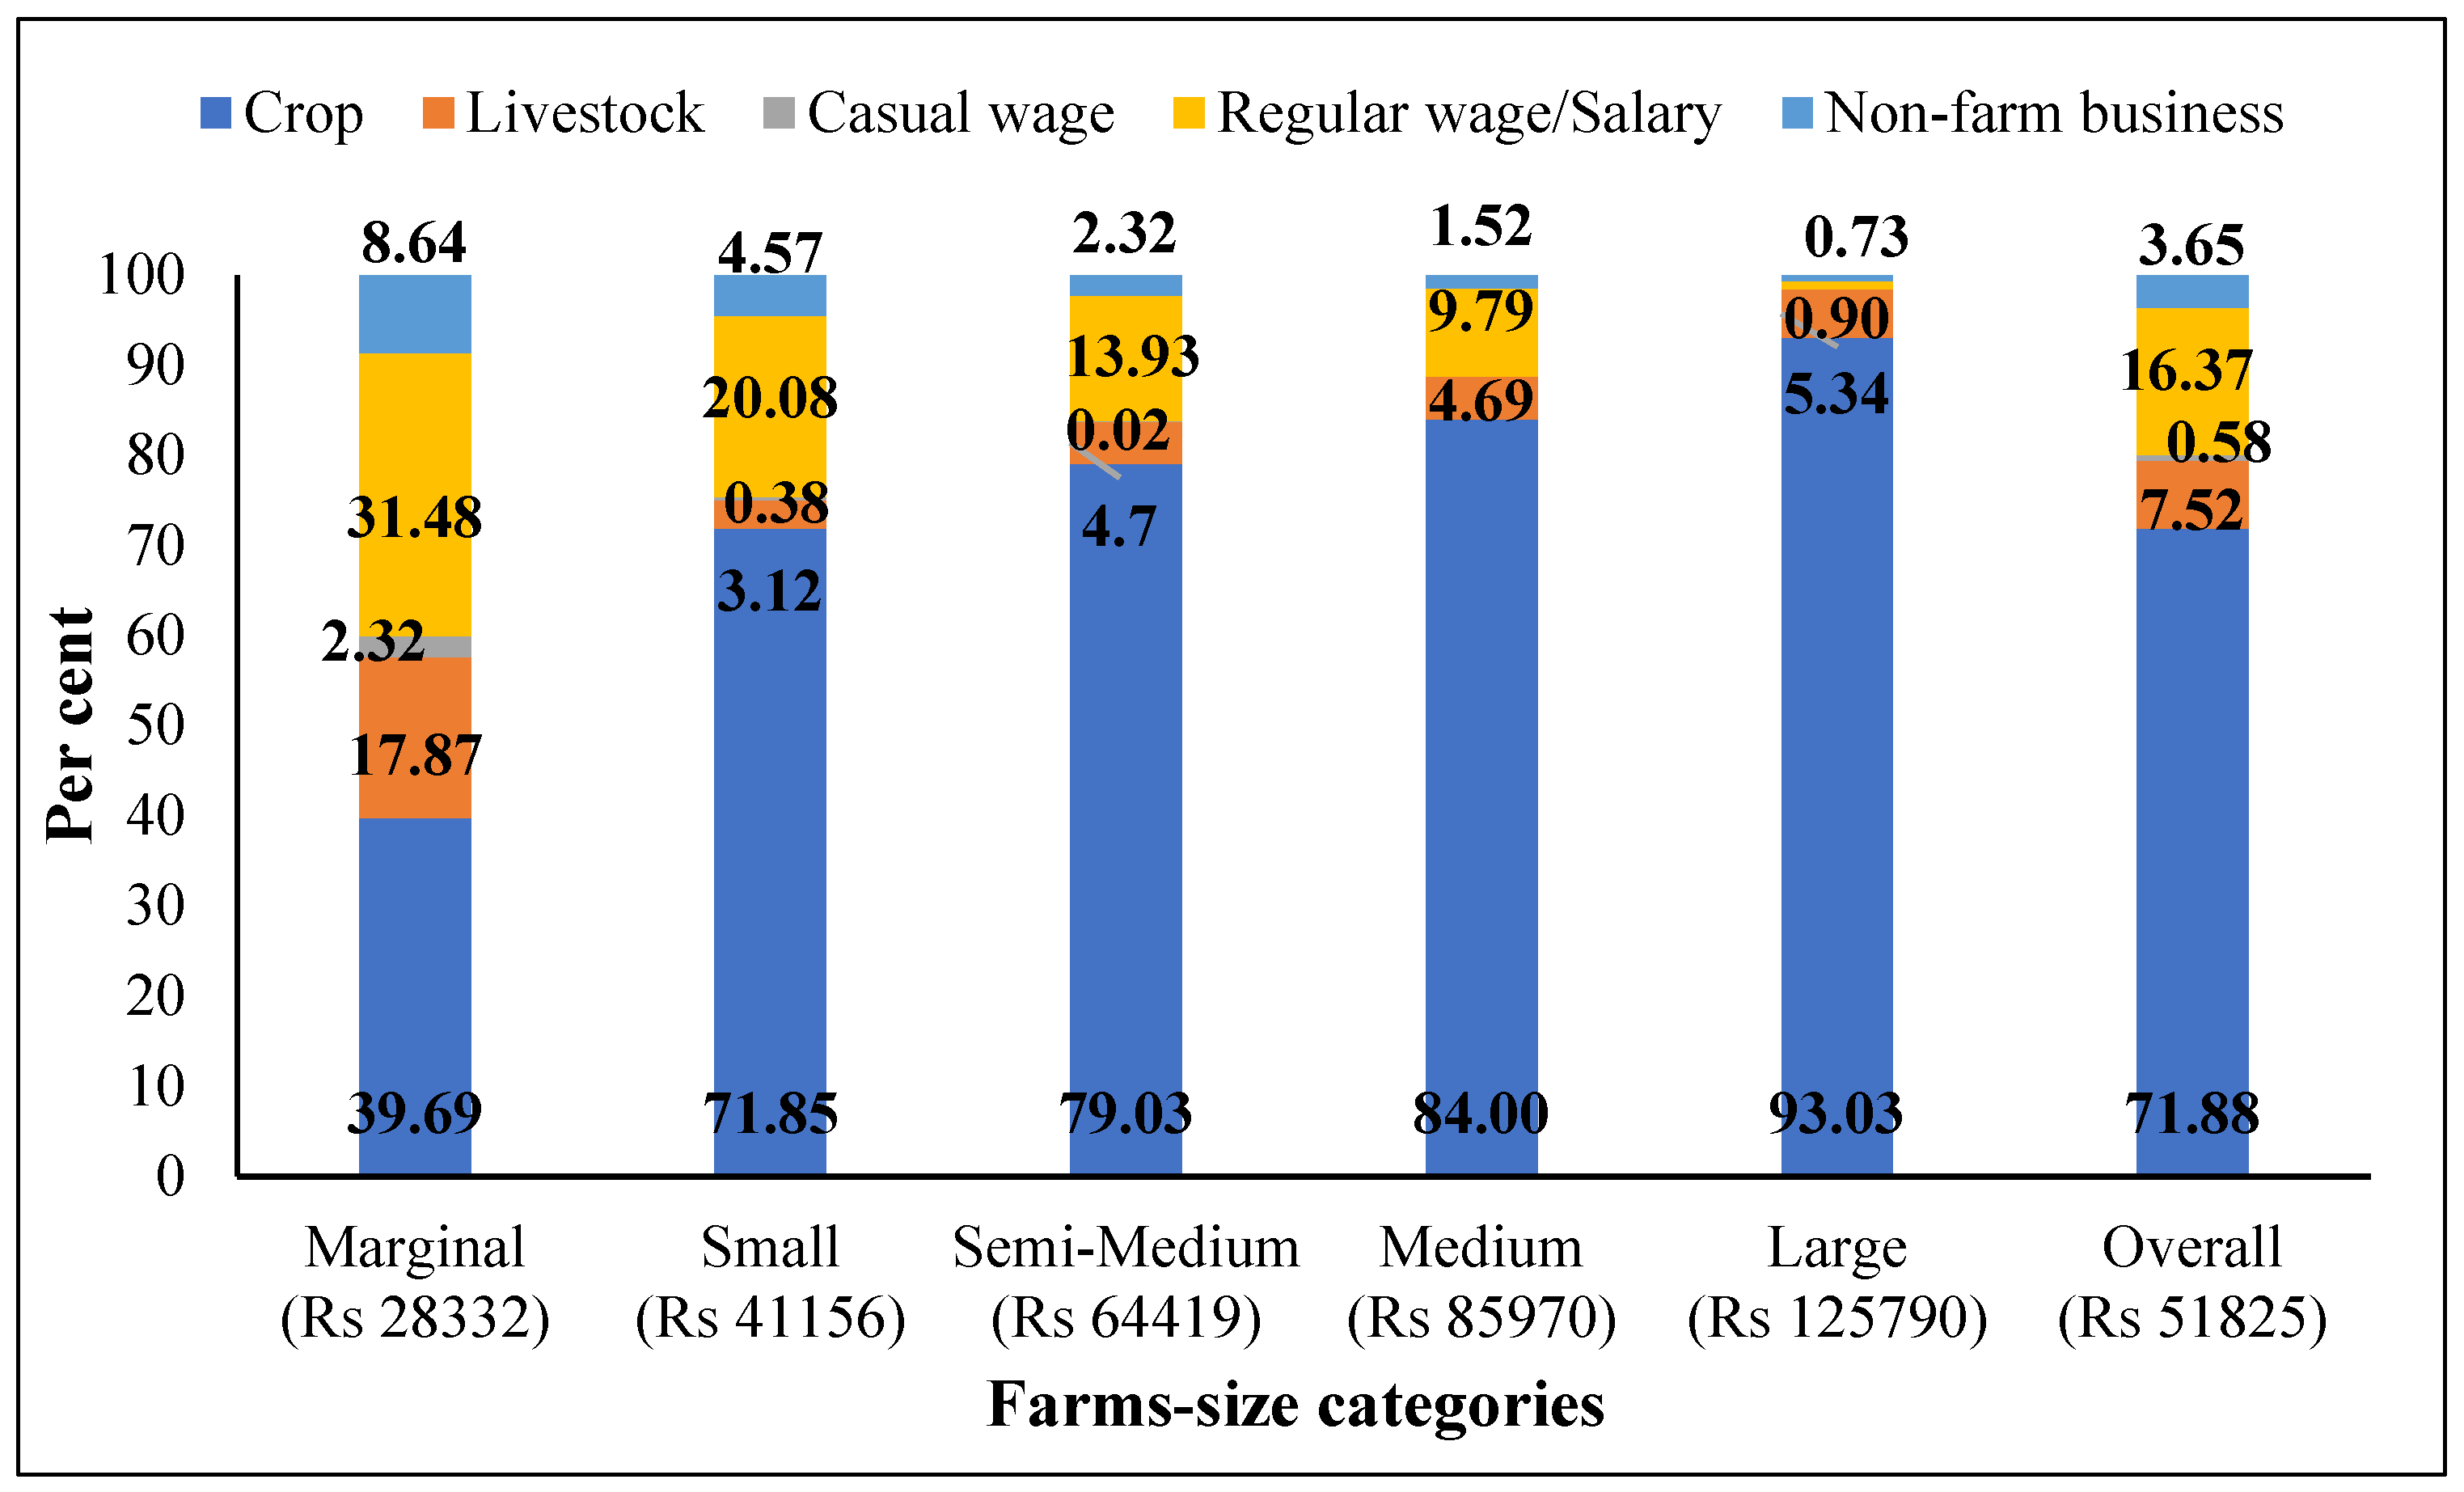
Rural Punjab has observed a significant increase in non-farming activity. Still, agriculture, particularly crop cultivation, remains the primary source of income of the farm households (71.88%), followed by regular wage and salary (16.37%), livestock (7.52%), non-farm business (3.66%) and casual wage (0.58%) (
Figure 1). The per capita annual income of the farm household was Rs 51825 and across different farm-size categories this was found to be Rs 28332, Rs 41156, Rs 64419, Rs 85970 and Rs 125790 for marginal, small, semi-medium, medium and large farm-size categories, respectively, in Punjab. The highest diversity of household income is observed in marginal farm households. The share of income from crop cultivation increased with increase in farm size, which is less than 50% for marginal farm households while more than 90% for large farm households. As reported in an earlier study [
31], the share of livestock income is the highest for marginal farm households across different farm-size categories. The percentage of casual wages, regular wage and salary and non-farm business income follow an inverse relationship with the farm size. Income generation through casual wages is negligible among farm households except for the marginal farm-size category, which earned 2.32% of income from this source.
3.2. Evidence of Economic Stress among Farm Households
3.2.1. Farm Productivity
Farm productivity, which is an important determinant of farm households’ income, is analysed for different farm-size categories using annual value productivity for various crops grown yearly (
Table 2). A productivity analysis revealed the prevalence of two productivity groups across different farm-size categories in Punjab agriculture. One group comprises marginal farm households with low productivity, while the other comprises larger farm households (>2 ha) with high productivity. The productivity of small farms is identical in both the productivity groups. Earlier studies also confirm that marginal farms have the lowest productivity [
10,
12,
32]. There was a positive correlation between farm size and productivity. Hence, the study reconfirms that the farm size and productivity relationship in Punjab is the opposite of the relationship reported for the country [
33]. It highlights the disadvantaged position of smallholders in achieving optimum yields which will be unsustainable in the long-run.
3.2.2. Livelihood Diversity
Various push and pull factors that lead to farm households’ engagement in non-farm employment can be identified through their revealed preference, i.e., employment choices of the household. The households which need to ensure their food security and viability may engage in all types of work, including casual work. In contrast, well-off households limit themselves to certain socially accepted employment opportunities. Crop production is a common income source for all farm households, while livestock production is practised by 94% of households (
Table 3). Income share from regular wage and salary and non-farm business is also significant at 22.17 and 10.67% share, respectively, while few households are earning income from casual wages (3.16%). Participation in agricultural activities, i.e., crops and livestock, have been somewhat uniform across different farm-size categories.
In contrast, participation in non-agricultural activities, i.e., casual wage, regular wage and salary and non-farm business, varied across different farm-size categories. Farm households’ engagement in non-agricultural activities was the highest for marginal farm households, followed by small farm households. However, larger farm households only restricted their engagement to regular wage & salary income sources. As observed earlier [
34], the sources of income are more diversified for marginal and small farm-households than all other farm-size categories.
3.2.3. Distribution of Farm Households across Income Quintiles
The farm households are arranged into quintile groups based on the total income of the household, where most of the marginal and small farm households fall in the lower-income quintiles, whereas medium and large farm households are concentrated in the higher income quintiles (
Table 4). Among marginal farm households, around 50% are concentrated in the bottom quintile and 35.27% are in the second quintile. Similarly, small farm households also followed the same trail with more than 80% of households in the bottom three income quintiles. On the contrary, large farm households are concentrated in the fourth (48.71%) and the top quintiles (51.29%). The distribution of medium farm households is somewhat similar to large farm households, with more than 85% of medium farm households in the top three quintiles.
3.2.4. Economic Surplus
The economic surplus reflects the financial position of the household as well as the ability to save and invest. It is calculated by deducting the consumption expenditure from the total income of the households. The farm household’s annual per capita consumption expenditure is Rs 35090, which increased with an increase in farm size (
Table 5). It provides crucial evidence highlighting the pauperization of marginal farm households, as the income earned is insufficient to meet consumption expenditure. Even the economic surplus of small farm households leaves little scope for investment or improvement. For other farm-size categories, post-consumption funds available with the farm households are 21.60, 35.80, 51.25 and 65.98% for small semi-medium, medium and large farm households, respectively. The inability of marginal and small farm households to fulfil consumption needs has also been reported earlier [
35]. This stress among marginal farmers in the agriculturally developed region highlights the severity of the economic crisis, i.e., the food and sustainability crisis for this section of farm households.
3.3. Income Inequality among Farm Households
3.3.1. Horizontal Decomposition of Income Inequality
Horizontal inequality is the forced inequality between social groups with no economic rationale but supported by culturally formed groups. These have been identified as a significant cause of social tensions and require special attention [
36]. In Punjab, any acclaim for the dignity of lower castes is considered as a challenge to other superior castes, which is often a cause of inter-caste tensions and conflict in rural Punjab [
37]. Farm households belonging to smaller farm-size categories in Punjab have heterogeneous caste compositions. Thus, it becomes important to see if income inequalities are related to caste groups. Before analysing this, income inequality is decomposed into within and between farm-size categories using the Theil index to check whether the source of inequality is mainly due to ‘between farm-size categories income inequality’ or ‘within farm-size categories income inequality’. A higher contribution is observed due to ‘within the farm-size categories’ (0.27) than ‘between the farm-size categories’ inequality (0.14) (
Table 6). In different income sources, the income inequality due to crop cultivation is equally contributed to by within and between groups. The coefficient of the Theil index for crop production for within and between farm-size categories is 0.28 and 0.23, respectively. On the contrary, income inequality in livestock is due more to inequality within categories (0.76) and there is an almost negligible contribution from between categories inequality (0.03). The same pattern is observed for regular wage and salary and non-farm business. The Theil index analysis findings must instigate a further inquiry into the inequality within the farm-size categories. A pertinent question remains as to which farm-size categories have high within farm-size category inequality and to identify reasons for this. Hence, the Gini coefficient for income inequality is separately calculated for each farm-size category.
3.3.2. Income Inequality Estimates within Each Farm-Size Category
The insights into the decomposition of income inequality within each farm-size category revealed high variation in income inequality for each farm-size category (
Table 7). The overall Gini coefficient for income inequality among the farm households in Punjab is around 0.48, depicting high-income inequality among these households. The income inequality estimates for marginal and small farm households contradict the earlier study [
38], where reported income inequality was very low for these farm-size categories. The coefficients are 0.50 and 0.45 for marginal and small farm households, respectively. Income inequality was lowest for the households belonging to semi-medium and medium farm-size categories while being moderate for large farm households.
3.4. Current Status and Future Outlook for the Distressed Group
3.4.1. Caste-Wise Income among Marginal Farm Households
There is a high proportion of socially disadvantaged caste groups among the marginal farm-size category. The farm households of the SC community have the lowest income (Rs 85877), followed by OBC (Rs 113415) and general caste (Rs 149380) (
Table 8). The share of income from crops to total household income is the highest for general caste at 44% and 19 and 23% for OBC and SC households each, respectively. Income share from casual wages is the highest among SC households (28.15%), while there is insignificant participation from general caste (0.52%). The share of livestock income is the lowest among SC households (8.22%), while the share of livestock and non-farm business is the highest for OBC households at 21.96 and 19.95%, respectively. Income from regular wages and salaries has an equal share among all caste groups. The observation becomes relatively important when low income has been identified as the reason for poverty among schedule castes in Punjab [
30].
3.4.2. Source-Wise Decomposition of Income Inequality for Marginal Farm Households in Punjab
The Gini coefficient of income inequality is decomposed into different sources of income to clarify the marginal contribution of each source to overall inequality. After decomposing the overall Gini coefficient of income inequality among marginal farm households, the share of regular wages and salary was found to be the highest (0.36), followed by crops (0.28) and livestock (0.27). In contrast, non-farm business (0.07) and casual wages (0.01) contributed very little to overall inequality (
Table 9). The marginal effect of income inequality is negative and significant for income from crop cultivation and casual wage, while positive and significant for regular wage and salary. The marginal effect of livestock and non-farm business income coefficient is non-significant.
3.4.3. Credit Availability
Increased credit access, education and specific training may help the poor to gain more in rural non-agricultural activities [
15,
17]. Capital availability is an important dimension that facilitates the improvement and expansion of the farm livelihood efforts, and its unavailability is a bottleneck in the development of marginal farm households. Our analysis reveals lower credit availability for marginal and small farm households than large ones (
Table 10). On the other hand, the share of non-institutional credit is relatively higher for marginal farm households than other farm-size categories.
4. Discussion
There is high variation in income of farm households across different farm-size categories in Punjab. The per capita annual income of the large farm households is almost four times higher than the marginal farm households and almost three time higher than the small farm households. The distribution is highly skewed, there is high income inequality, most of the marginal households lie in the bottom income quintile and most of the large farm households lie in the top income quintile. The economic stress faced by marginal and small farm households becomes evident when looking at economic surplus, which is found by deducting per capita annual consumption expenditure from income. The unavailability of institutional credit compounds such hardships as farmers have to rely on non-institutional credit which comes at a high rate of interest, making their existence unsustainable. This is the situation when these households are diversified and do not rely on agriculture income only. There is an inverse relationship between non-agricultural income and farm-size. Around 42% of the household income of marginal farm households and 24% of the income of small farm households is earned from non-agricultural sources, i.e., wages, salaries and non-farm business. These households have low farm productivity, a lower level of education and the highest income inequality within respective farm-size categories.
Caste-based classification adds another dimension to the study, where the schedule castes are considered to be the lowest in Indian society’s hierarchy. An analysis of horizontal inequalities across different farm-size categories highlighted the highest inequality within farm-size categories. As the highest percentage of SC farm households belong to the marginal farm-size category, the income of the marginal farm-size category is classified across different castes. SC farm households have the lowest income among marginal farm households, which is almost half the income of general households. Vertical decomposition of income inequality of marginal farm households among different income sources revealed that crop income and casual wages are inequality decreasing factors, regular salaries are an inequality increasing source and livestock and non-farm business are non-significant income sources.
The identified crisis is multidimensional. First, employment choices available to farm households develop the household’s economic condition, which, in turn, affects the future employment choices of their household members. Second, due to insufficient jobs in the formal sector, large farmers opt for overseas migration while marginal farmers seek informal jobs [
39]. Third, even if marginal households migrate, the place and nature of migration differ for marginal and large farm households [
39]. Marginal households migrate temporarily to gulf countries while large farm households seek permanent migration to developed countries [
39]. Fourth, local non-agricultural activities vary in returns to labour across different activities ranging from paid regular jobs to informal, casual wages. Finding high paid non-agricultural jobs in North India has been related to caste, schooling years and to links outside the village [
29]. There is higher prevalence of casual wages among the family members of households belonging to marginal farm-size category. Still, the present study provides further insight into the engagement of SC households in casual work among marginal households [
39]. Any unfair advantage should be discouraged and skill-based opportunities must be promoted.
5. Recommendations
New plans for higher crop income, long term casual work engagements and problems faced in obtaining regular wages and salaried jobs must be addressed to ensure food security and sustainability.
Recommendations to increase the crop income of these households are as follows.
There is little structural shift in employment structure as the employment growth rates are 2.93 and 2.89 for services and manufacturing sectors, respectively, between the years 2000 to 2012 [
40]. Hence, the focus should be to increase crop income. An integrated farming system specially designed for marginal farmers can be developed for Punjab using the recommended cropping system for an irrigated agro-ecosystem [
41]. This will lead to an optimum utilization of resources, time and family labour, ensuring a sustainable livelihood.
Price instability and irregular payments for high-value crops, i.e., potato, cotton and sugarcane, should be addressed. Price assurance and institutional support for these crops with special provisions for marginal farmers, would be an ideal cropping system for large-scale adoption in the region [
33,
42].
Given the import bill for oilseeds, a fixed price on oilseed crops with the upper cap on the quantity to be procured from each household would be a beneficial procurement policy. These crops have low inputs and irrigation requirements, which will help overcome resource constraints these farmers face.
Even the participation of these households in Farmer Producer Organisations (FPOs) can be promoted by suitable policy interventions and by providing training on value addition [
43].
Similarly, the importance of the rural non-farm enterprises [
44,
45,
46] as well as the livestock sector [
47,
48,
49,
50,
51] in ensuring secure and sustainable existence has been well established in the literature. Recommendations for these sectors include:
Casual wages may not substantially increase the household income but ensure survival at the lower tail of income distribution [
52,
53,
54,
55]. Thus, the study advocates the recommendations of the Punjab State Farmers’ Commission to provide income support and increase MGNREGA cover, more workdays per household and improvement in the monitoring mechanism to provide immediate relief to the distressed farmers.
The government may assist in establishing agro-processing units.
Skill enhancement centres should be established in the vicinity.
Improved cattle breeds and subsidised livestock insurance may increase livestock income.
6. Conclusions
In the current situation of the Indian economy, the livelihood of marginal and small farmers is unsustainable. The overall income distribution among farm households is highly skewed (Gini coefficient = 0.48), with socially exploited castes still lying at the lowest levels. The income of these households is insufficient to ensure food security. The present study provides empirical evidence of high economic stress among farm households belonging to marginal and small farm-size categories, especially among lower castes. The distress is visible in their occupational diversity, with a parallel engagement in non-agricultural activities with significant share of casual wages. Low education level and the lowest crop productivity is observed among marginal and small farm households. Moreover, the share of institutional credit is the lowest for marginal farm households and they have to rely on non-institutional sources to fulfil their credit requirements. Hence, suitable policy interventions to improve livelihood security and to ensure the sustainable development of this vulnerable section of the society are (i) developing labour-intensive high-value farming systems and crops along with price assurance and institutional support for potato, cotton, sugarcane and oilseeds, (ii) strengthening the dairy sector through breed development programmes and livestock insurance, (iii) establishing agro-processing units and skill development centres in the vicinity to enhance employment opportunities, (iv) providing employment through MGNREGA, (v) providing quality education through public schools and (vi) providing institutional credit at a low interest rate.
Author Contributions
Conceptualization, M.K. and R.S. (Rohit Saini); Methodology, D.S., R.S. (Rohit Saini) and G.S.; Software, K.A. and R.S. (Rohit Saini); Validation, M.K., R.S. (Rohit Saini) and K.A.; Formal analysis, K.A., A.S. and R.S. (Rohit Saini); Investigation, M.K., D.S. and R.S. (Rohit Saini); Writing—R.S. (Rohit Saini), G.S. and G.K.; Writing—review and editing, R.S. (Randeep Singh), S.S. and A.S.; Supervision, M.K. and R.S. (Randeep Singh). All authors have read and agreed to the published version of the manuscript.
Funding
A part of this research was funded by Indian Council of Agricultural Research in form of Senior Research Fellowship for Ph.D. research work grant no. F.no. EDN/1/25/2015/-Exam cell.
Institutional Review Board Statement
Not applicable.
Informed Consent Statement
Not applicable.
Data Availability Statement
Not applicable.
Acknowledgments
Authors are thankful to Kamal Vatta (Department of Economics and Sociology, Punjab Agricultural University, Ludhiana) for his guidance in improving a part of this research work.
Conflicts of Interest
The authors declare no conflict of interest.
References
- Grebmer, K.; Bernstein, J.; Wiemers, M.; Schiffer, T.; Hanano, A.; Towey, O.; Cheilleachair, R.; Foley, C.; Gitter, S.; Ekstrom, K.; et al. 2021 Global Hunger Index, Hunger and Food Systems in Conflict Settings; Concern Worldwide: Dublin, Ireland, 2021; Available online: https://www.globalhungerindex.org/pdf/en/2021.pdf (accessed on 2 February 2022).
- Liu, J.; Wang, M.; Yang, L.; Rahman, S.; Sriboonchitta, S. Agricultural Productivity Growth and Its Determinants in South and Southeast Asian Countries. Sustainability 2020, 12, 4981. [Google Scholar] [CrossRef]
- National Bank for Agricultural and Rural Development. NABARD All India Rural Financial Inclusion Survey 2016–17; National Bank for Agriculture and Rural Development: Mumbai, India, 2018; Available online: https://www.nabard.org/auth/writereaddata/tender/1608180417NABARD-Repo-16_Web_P.pdf (accessed on 11 September 2020).
- Government of India. Agricultural Statistics at A Glance; Department of Agriculture, Cooperation and Farmers Welfare, Government of India: New Delhi, India, 2018. Available online: https://agricoop.gov.in/sites/default/files/agristatglance2018.pdf (accessed on 25 January 2020).
- Pisani, E. Some socio-economic consequences of the green revolution. Land Reform. 2006, 2, 97–107. Available online: https://mpra.ub.uni-muenchen.de/24977/ (accessed on 19 March 2021).
- Dhanagare, D.N. The green revolution and social inequalities in rural India. Bull. Concerned Asian Sch. 1988, 20, 2–13. Available online: https://www.tandfonline.com/doi/abs/10.1080/14672715.1988.10404444 (accessed on 3 May 2020). [CrossRef]
- Saini, G.R. Green revolution and the distribution of farm income. Econ. Political Wkly. 1976, 11, A17–A22. Available online: https://www.epw.in/journal/1976/13/review-agriculture-uncategorised/green-revolution-and-distribution-farm-incomes.html (accessed on 20 June 2019).
- Indian Statistical Institiute. Structural causes of the economic crisis. Econ. Political Wkly. 1975, 10, 83–86. Available online: https://www.epw.in/journal/1975/3/special-articles/structural-causes-economic-crisis.html (accessed on 21 July 2019).
- Das, R. Farm size and agricultural debate in Indian agriculture, Five decades of green revolution. Econ. Political Wkly. 2021, 56, 57–65. [Google Scholar]
- Bhalla, G.S.; Chadha, G.K. Green Revolution and the Small Peasant: A Study of Income Distribution in Punjab Agriculture: I. Econ. Political Wkly. 1982, 17, 826–833. [Google Scholar]
- Ghose, A.K. Farm Size and Land Productivity in Indian Agriculture: A Reappraisal. J. Dev. Stud. 1979, 16, 27–49. [Google Scholar] [CrossRef]
- Chattopadhyay, M.; Rudra, A. Size-productivity revisited. Econ. Political Wkly. 1976, 11, A104–A116. [Google Scholar]
- Singh, S.; Bhogal, S.; Singh, R. Magnitude and determinants of indebtedness among farmers in Punjab. Indian J. Agric. Econ. 2014, 69, 244–256. Available online: https://www.epw.in/journal/2021/26-27/review-rural-affairs/indebtedness-among-farmers-punjab.html (accessed on 2 January 2019).
- Chayanov, A.V. Theory of Peasant Economy; Thorner, D., Kerblay, B., Smith, R.E.F., Eds.; The American Economic Association: Homewood, IL, USA, 1966. [Google Scholar]
- Hetland, P. Pluriactivity as a strategy for employment in rural Norway. Sociol. Rural. 1986, 26, 385–395. [Google Scholar] [CrossRef]
- Mosa, A.; Siddig, K.; Grethe, H. Opportunities and determinants of rural non-agricultural activities in Ethiopia. J. Dev. Agric. Econ. 2019, 11, 265–271. [Google Scholar]
- Reddy, D.N.; Reddy, A.A.; Nagaraj, N.; Bantilan, C. Rural Non-Farm Employment and Rural Transformation in India; Working Paper no. 57; ICRISAT: Telangana, India, 2014. [Google Scholar]
- Reardon, T. Rural Non-Farm Income in Developing Countries. World Bank Archives. 1999. Available online: https://web.worldbank.org/archive/website01066/WEB/IMAGES/RURALNON.PDF (accessed on 20 May 2019).
- Rudra, A.; Sen, A. Farm Size and Labour Use: Analysis and Policy. Econ. Political Wkly. 1980, 15, 391–394. Available online: http://www.jstor.org/stable/4368380 (accessed on 7 April 2020).
- Government of Punjab. Statistical Abstract of Punjab 2019; Economic and Statistical Organisation, Government of Punjab: Mohali, Punjab, 2019.
- Singh, S.; Thakur, D.S. Extent of absolute poverty among the different socio-economic groups in the urban areas of Himachal Pradesh: A nutrition plus approach. Res. J. Soc. Sci. 2005, 13, 26–43. [Google Scholar]
- NSSO. Income, Expenditure, Productive Assets and Indebtedness of Agricultural Households in India. In Proceedings of the NSS 70th Round, Ministry of Statistics and Programme Implementation, Government of India, New Delhi, India, 31 April 2016; Available online: http://mospi.nic.in/sites/default/files/publication_reports/nss_rep_576.pdf (accessed on 11 May 2019).
- Vinutha, H.P.; Poornima, B.; Sagar, B.M. Detection of Outliers Using Interquartile Range Technique from Intrusion Dataset. In Informatin and Decision Sciences; Satapathy, S.C., Tavares, J.M.R.S., Vikrant, B., Mohanty, J.R., Eds.; Springer: Singapore, 2018; pp. 1052–1059. [Google Scholar] [CrossRef]
- Buhmann, B.; Rainwater, L.; Schmaus, G.; Smeeding, T.M. Equivalence scales, well-being, inequality, and Poverty: Sensitivity estimates across ten countries using the Luxembourg Income Study (LIS) database. Rev. Income Wealth 1988, 34, 115–142. [Google Scholar] [CrossRef]
- Deaton, A. Health, Inequality, and Economic development. J. Econ. Lit. 2003, 41, 113–158. Available online: https://www.princeton.edu/~deaton/downloads/Health_Inequality_and_Economic_Development.pdf (accessed on 13 September 2019). [CrossRef]
- Bellu, L.G.; Liberati, P. Policy Impacts on Inequality: Decomposition of Income Inequality by Subgroups; EASYPol, Food and Agriculture Organization: Rome, Italy, 2006; Available online: http://www.fao.org/3/am342e/am342e.pdf (accessed on 15 October 2020).
- Lerman, R.I.; Yitzhaki, S. Income inequality effects by income sources: A new approach and applications to the United States. Rev. Econ. Stat. 1985, 67, 151–156. Available online: https://www.jstor.org/stable/1928447 (accessed on 16 December 2019). [CrossRef]
- Cowell, F. Theil, Inequality Indices and Decomposition; Working Paper 1; Society for the Study of Economic Inequality: London, UK, 2005; Available online: http://www.ecineq.org/milano/WP/ECINEQ2005-01.pdf (accessed on 19 November 2019).
- Lanjouw, P.; Stern, N. Economic Development in Palanpur over Five Decades; Oxford University Press: Oxford, UK, 1998. [Google Scholar] [CrossRef]
- Jain, N.; Singh, G.; Kaur, R. Analysis of incidence and determinants of poverty among schedule caste households in rural Punjab. Soc. Chang. 2018, 48, 542–557. [Google Scholar] [CrossRef]
- Singh, M. Challenges and Opportunities for Sustainable Viability of Marginal and Small Farmers in India. Agric. Situat. India 2012, 49, 134–164. [Google Scholar]
- Singh, K.; Grover, D.K.; Vatta, K.; Kumar, S. Changes in Structural Distribution of Land Holdings and Its Impact on Productivity of Major Crops in Punjab; Agro Economic Research Centre, Punjab Agricultural University: Ludhiana, India, 2000. [Google Scholar]
- Singh, S.; Park, J.; Litten-Brown, J. The economic sustainability of cropping systems in Indian Punjab: A farmers’ perspective. In Proceedings of the European Association of Agricultural Economists, Zurich, Switzerland, 30 August–2 September 2011; Available online: https://ageconsearch.umn.edu/record/116007 (accessed on 20 April 2021).
- Subramanian, S. Participation of Rural Households in Farm, Non-Farm and Pluri-Activity: Evidence from India; Working Paper 412; The Institute for Social and Economic Change: Banglore, India, 2018; Available online: http://www.isec.ac.in/WP%20412%20-%20S%20Subramanian%20-%20final.pdf (accessed on 20 March 2021).
- Dev, S.M. Small Farmers in India: Challenges and Opportunities; Working paper 2012-014; Indira Gandhi Institute of Development Research: Mumbai, India, 2012; Available online: http://www.igidr.ac.in/pdf/publication/WP-2012-014.pdf (accessed on 2 January 2019).
- UNCTAD. Income distribution and development. In High-Level Round Table on Trade and Development: Directions for the Twenty-First Century; UNCTAD X: Bangkok, Thailand, 2000. [Google Scholar]
- Jodhka, S.S. Caste and untouchability in rural Punjab. Econ. Political Wkly. 2002, 37, 1813–1823. [Google Scholar]
- Kaur, S.; Singh, G. Analysis of income distribution among marginal and small farmers in rural Punjab. Int. J. Sci. Res. 2014, 3, 755–759. Available online: https://www.ijsr.net/archive/v3i3/MDIwMTMxMTk5.pdf (accessed on 4 May 2019).
- Ohno, A.; Fujita, K.; Vatta, K. Agrarian structure of Punjab in the post-green revolution era: Household strategies for distress coping. Econ. Political Wkly. 2021, 56, 56–64. Available online: https://www.epw.in/journal/2021/40/special-articles/agrarian-structure-punjab-post-green-revolution.html (accessed on 2 February 2022).
- Majid, N. Structural Change and Employment in India; ILO/SIDA Partnership on Employment Working Papers; Inernational Labour Organization: Geneva, Switzerland, 2019. [Google Scholar]
- Behera, U.K.; France, J. Integrated farming systems and the Livelihood security of small and marginal farmers in India and other developing countries. Adv. Agron. 2016, 136, 235–282. Available online: https://www.elsevier.com/books/advances-in-agronomy/sparks/978-0-12-804774-3 (accessed on 16 March 2020).
- Shergill, H.S. Wheat and paddy cultivation and the question of optimal cropping pattern for Punjab. J. Punjab Stud. 2006, 12, 239–250. [Google Scholar]
- Rangarajan, C.; Dev, S.M. How FPOs Can Help Small and Marginal Farmers; The Indian Express: New Delhi, India, 2021; Available online: https://indianexpress.com/article/opinion/columns/nabard-agrarian-distress-farmers-protest-farm-laws-7222830/ (accessed on 5 January 2022).
- Birthal, P.S.; Negi, D.S.; Jha, A.K.; Singh, D. Income sources of farm households in India: Determinants, distributional consequences and policy implications. Agric. Econ. Res. Rev. 2014, 27, 37–48. Available online: https://ageconsearch.umn.edu/record/170255/?ln=en (accessed on 5 May 2020). [CrossRef] [Green Version]
- Himanshu Lanjouw, P.; Murgai, R.; Stern, N. Nonfarm diversification, poverty, economic mobility, and income inequality: A case study in village India. Agric. Econ. 2013, 44, 461–473. [Google Scholar] [CrossRef] [Green Version]
- Pavithra, S.; Vatta, K. Role of non-farm sector in sustaining rural livelihoods in Punjab. Agric. Econ. Res. Rev. 2013, 26, 257–265. Available online: https://ageconsearch.umn.edu/record/162146/files/11-Pavithra-final.pdf (accessed on 23 June 2019).
- Choudhary, B.B.; Singh, P. How unequal is rural Punjab? Empirical evidence from spatial income distribution. Curr. Sci. 2019, 117, 1855–1866. Available online: https://wwwops.currentscience.ac.in/Volumes/117/11/1855.pdf (accessed on 14 June 2020). [CrossRef]
- IEG. Farmers’ income in India: Evidence from secondary data. Agric. Situat. India 2015, 74, 30–70. Available online: http://iegindia.org/ardl/Farmer_Incomes_Thiagu_Ranganathan.pdf (accessed on 16 May 2019).
- Birthal, P.S.; Joshi, P.K.; Kumar, A. Assessment of Research Priorities for Livestock Sector in India; Policy Paper 15; National Centre for Agricultural Economic and Policy Research: New Delhi, India, 2002; Available online: http://citeseerx.ist.psu.edu/viewdoc/download?doi=10.1.1.615.4101&rep=rep1&type=pdf (accessed on 30 May 2020).
- Adams, R.H.; He, J.J. Sources of Income Inequality and Poverty in Rural Pakistan; Research Report 102; International Food Policy Research Institute: Washington, DC, USA, 1995; Available online: https://www.ifpri.org/publication/sources-income-inequality-and-poverty-rural-pakistan (accessed on 23 April 2020).
- Kashish, M.K.; Sekhon, M.K.; Dhawan, V. Impact of dairying on income and income distribution of small holder dairy farmers in Punjab. Indian J. Dairy Sci. 2017, 70, 781–788. Available online: https://www.researchgate.net/publication/322617594_Impact_of_dairying_on_income_and_income_distribution_of_small_holder_dairy_farmers_in_Punjab (accessed on 18 September 2020).
- Ranganathan, T.; Tripathi, A.; Rajoriya, B. Changing Sources of Income and Income Inequality among Indian Rural Households; National Seminar on Dynamics of Rural Labour Relations, National Institute of Rural Development and Panchayati Raj: Hyderabad, India, 2016; Available online: http://nirdpr.org.in/nird_docs/srsc/srsc-pub-090518-5.pdf (accessed on 26 May 2019).
- Shariff, A.; Azam, M. Income Inequality in Rural India: Decomposing the Gini by Income Sources. 2009. Available online: https://ssrn.com/abstract=1433105 (accessed on 30 May 2019).
- Lanjouw, P. Does the rural nonfarm economy contribute to poverty reduction? In Transforming the Rural Nonfarm Economy: Opportunities and Threats in the Developing World; Haggblade, S., Hazell, P.B.R., Reardon, T., Eds.; International Food Policy Research Institute: Washington, DC, USA, 2007; pp. 55–82. Available online: https://www.ifpri.org/publication/transforming-rural-nonfarm-economy-0 (accessed on 19 May 2020).
- Saini, R.; Manjeet, K. Income inequality and its decomposition among farm households in Punjab. Cogent Food Agric. 2022, 8, 2069314. [Google Scholar] [CrossRef]
| Publisher’s Note: MDPI stays neutral with regard to jurisdictional claims in published maps and institutional affiliations. |
© 2022 by the authors. Licensee MDPI, Basel, Switzerland. This article is an open access article distributed under the terms and conditions of the Creative Commons Attribution (CC BY) license (https://creativecommons.org/licenses/by/4.0/).

 ,
, 
