Article

Characteristics and Sources of Air Pollution in Southern Shanxi Province

1
Jincheng Meteorological Bureau of Shanxi Province, Jincheng 048000, China
2
China Environmental Research Institute, Beijing 101100, China
*
Author to whom correspondence should be addressed.
Sustainability 2022, 14(20), 13511; https://doi.org/10.3390/su142013511
Submission received: 5 September 2022 / Revised: 13 October 2022 / Accepted: 14 October 2022 / Published: 19 October 2022
(This article belongs to the Section Pollution Prevention, Mitigation and Sustainability)

Abstract

:
To study the characteristics and potential sources region of air pollution in Jincheng, Southern Shanxi Province, the potential source areas and transport routes of pollutants were investigated using AQI (air quality index) data from 2018 to 2020 and National Centers for Environmental (NCEP) reanalysis data, combined with cluster analysis, potential source contribution function (PSCF), and concentration weight trajectory (CWT). The results show that the AQI of Jincheng in wintertime from 2018 to 2020 showed a “gradual N-shaped decline” trend. The primary pollutants throughout the year were particulate pollutants PM10 and PM2.5, and the number of days in which O3 was the primary pollutant accounted for about 40%. The trajectory cluster analysis showed that there were eight types of transmission trajectories in winter. The northwest trajectories of categories 1, 2, 3, 4, and 7 accounted for 52.84%, the northerly trajectories of categories 5 and 6 accounted for 17.61%, and the southeast trajectories of category 8 accounted for 1.14%. The trajectory results were basically consistent with the geographical location and monsoon characteristics of Jincheng. The potential pollution source areas with great impact on AQI in Jincheng were mainly located in Northern Shanxi, Luliang and Linfen in Shanxi, and Xingtai and Handan in Hebei. Fenwei River Valley was another significant source of air pollution in Jincheng. Therefore, the pollution of Jincheng was affected by both pollution transmission and local exhaust sources. The impact of air pollution was mutual, and the findings from this research could be helpful for building an effective joint mechanism for environmental control in Jincheng.

1. Introduction

With the continuous acceleration of urbanization, atmospheric environmental problems have become an important factor affecting human health [1,2]. Air pollution has multiple characteristics of spatiotemporal transmission and forms multiscale distribution characteristics through photochemical action [3,4]. Its pollution degree is affected by both emission sources and atmospheric transportation, and the “plume effect” of pollutants constitutes a large-scale pollution diffusion between cities [5,6].At present, the hybrid single-particle Lagrangian integrated trajectory model (HYSPLIT) is a popular computing model [7,8,9]. PSCF and CWT can better reflect the source and distribution of atmospheric trajectories between source areas and judge the potential source region of air pollutants. Various research has been conducted on this topic. Park et al. [10], Anil et al. [11], and Fishman et al. [12] studied the long-distance transport characteristics of air pollutants in Asia, Turkey, and the United States, respectively. Chen Lin et al. [13] and Yang Yang et al. [14] respectively studied the sources of black carbon aerosol and dust aerosol pollutants in semi-arid areas. Shi et al. [15], Zhao et al. [16], Zhan et al. [17], and Gao et al. [18], using the cluster analysis method, studied the characteristics of air pollutant concentration and airflow trajectory in Hefei, Hong Kong, Beijing, and Nanjing. In addition, some researchers [19,20,21,22,23,24] also analyzed the air pollution transmission sources and pollution contribution source areas in Beijing Tianjin Hebei [25,26], Yangtze River Delta [27,28] and Pearl River Delta [29,30] using backward trajectory [31], cluster analysis [32], the PSCF method, and the CWT method. However, there are few studies on seasonality and a long timescale, especially regarding air pollution in coal chemical cities. As a coal chemical city, Jincheng is located at the southeast end of Shanxi Plateau at the south foot of Taihang Mountain and the southernmost end of the Beijing–Tianjin–Hebei pollution transmission channel. By selecting the air pollution data from 2018 to 2020, this paper studies and quantitatively simulates the transmission path and potential source area of air pollutants in autumn and winter in Jincheng, determines the potential source area with great impact on pollutants in Jincheng, and provides reasonable suggestions for the therapy of air pollution and the development of an energy industry base in Jincheng.

2. Data and Methods

2.1. Data Sources

The southern part of Shanxi in this study area is situated in North China and the southern end of the Loess Plateau. The climate has four distinct seasons and belongs to the mid-latitude region of the temperate zone. Data were collected from six state-controlled environmental monitoring stations in Jincheng of southern Shanxi Province (Technical College, Municipal Environmental Protection Bureau, Baiyun Commerce and Trade, Water Supply Company, and Zezhou No. 1 Middle School) and 10 general monitoring stations in the following counties or cities: Qinshui County (County Culture Bureau and County Environmental Protection Bureau), Yangcheng County (Experimental Primary School and County Environmental Protection Bureau), Lingchuan County (Nanguan primary School and Experimental Primary School), Zezhou County (Danhe Wetland and Technical Secondary School), and Gaoping (Gaoping No. 1 Middle School and Dongfanghong Primary School) (Figure 1). The pollutants monitored included SO2, NO2, CO, O3, PM2.5, and PM10. The air quality index (AQI) refers to the expression of air pollution degree and air quality. The meteorological field data were collected from the Global Data Assimilation System data provided by NCEP for the winter of 2018 to 2020, four times a day, i.e., 12:00 a.m., 6:00 a.m., 12:00 p.m., and 6:00 p.m. (UTC), with a horizontal resolution of 1° × 1°. These data included the wind speed and direction data of winter for all grades from 2018 to 2020.

2.2. Methodology

2.2.1. HYSPLIT_4 Model, PSCF and CWT

In this study, the HYSPLIT_4 model, PSCF [33], and CWT [34] were used for analysis. The HYSPLIT model is mainly used for backward trajectory calculations, to define the origin of the air mass, and to establish source–receptor relationships. It is also used to model the spread and diffusion of pollutants and hazardous substances in the atmosphere. The starting height of the reverse trajectory calculation in this study was 500 m, the running time was 72 h, and the time interval was 1 h.
The basic principle of PSCF is to create a rectangular grid (i, j) with a certain resolution according to the backward trajectory simulation results, and set the pollutant concentration threshold, which is marked as a pollution trajectory.
The PSCF calculation formula is as follows:
  P S C F i j = G i j K i j ,
where Gij is the number of contaminated trajectory ends passing through grid (i, j), and Kij is the number of all trajectory ends in grid (i, j).
Although PSCF can judge the pollution probability of different regions to a certain extent, so as to judge the pollution source, the result is mainly constrained by the threshold, which cannot effectively judge the pollution severity when the pollutant concentration is greater than the threshold. CWT can estimate the weighted consistence of the trajectory, thereby revealing its pollution degree.
The CWT calculation formula is as follows:
C W T i j = 1 k = 0 M T i j k k = 1 M C k T i j k ,
where K is the trajectory, M is the total number of trajectories, CK is the corresponding AQI value when trajectory K passes through grid (i, j), and Tijk is the time that the trajectory stays in grid (i, j).

2.2.2. Calculation Method of AQI

The AQI calculation formula is as follows:
I = I h i g h I l o w C h i g h C l o w ( C C l o w ) ,
where I represents the air quality subindex in pollutant items. The major air pollutants are O3, PM2.5, PM10, CO, SO2, and NO2. C is the mass concentration values of pollutant items, Clow is the low value of the pollutant concentration limit similar to C in Table 1, Chigh is the high value of the pollutant concentration limit similar to C in Table 1, Ilow represents the air quality subindices corresponding to Clow in Table 1, and Ihigh represents the air quality sub-indices corresponding to Chigh. This paper used 24 h averages for calculation. Corresponding pollutant concentration limits referred to China’s Ambient AQI standard specification (HJ633–2012).
AQI = MAX(I1,I2,I3,.....,I6).
The AQI is divided into six grades: excellent from 0 to 50, good from 50 to 100, mild pollution from 101 to 150, moderate pollution from 151 to 200, heavy pollution from 201 to 300, and serious pollution from 300 or more.

3. Results and Discussion

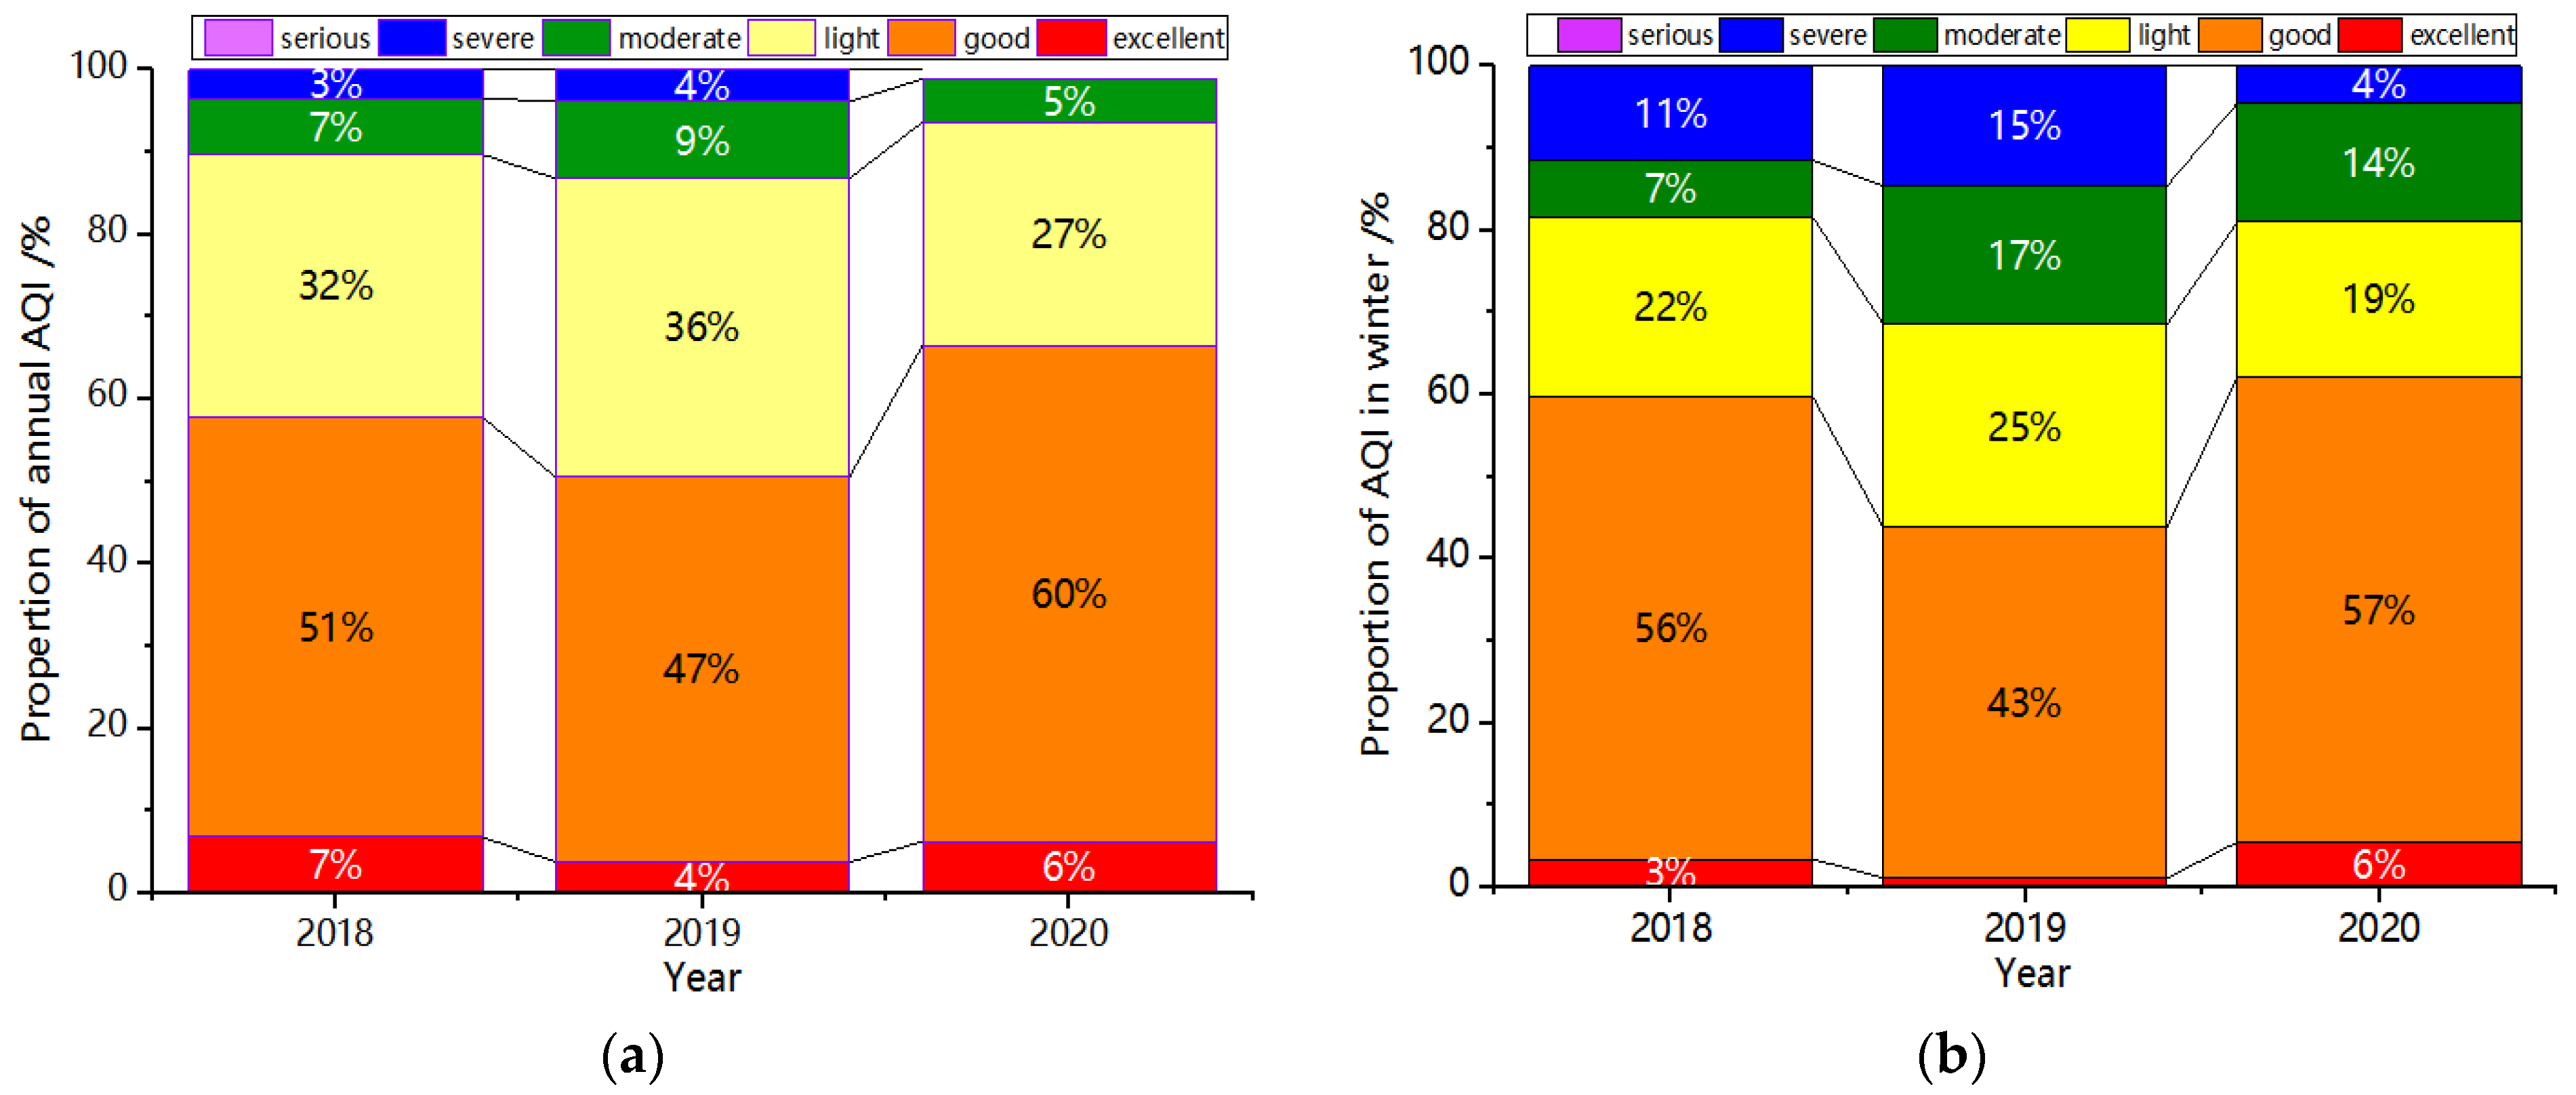
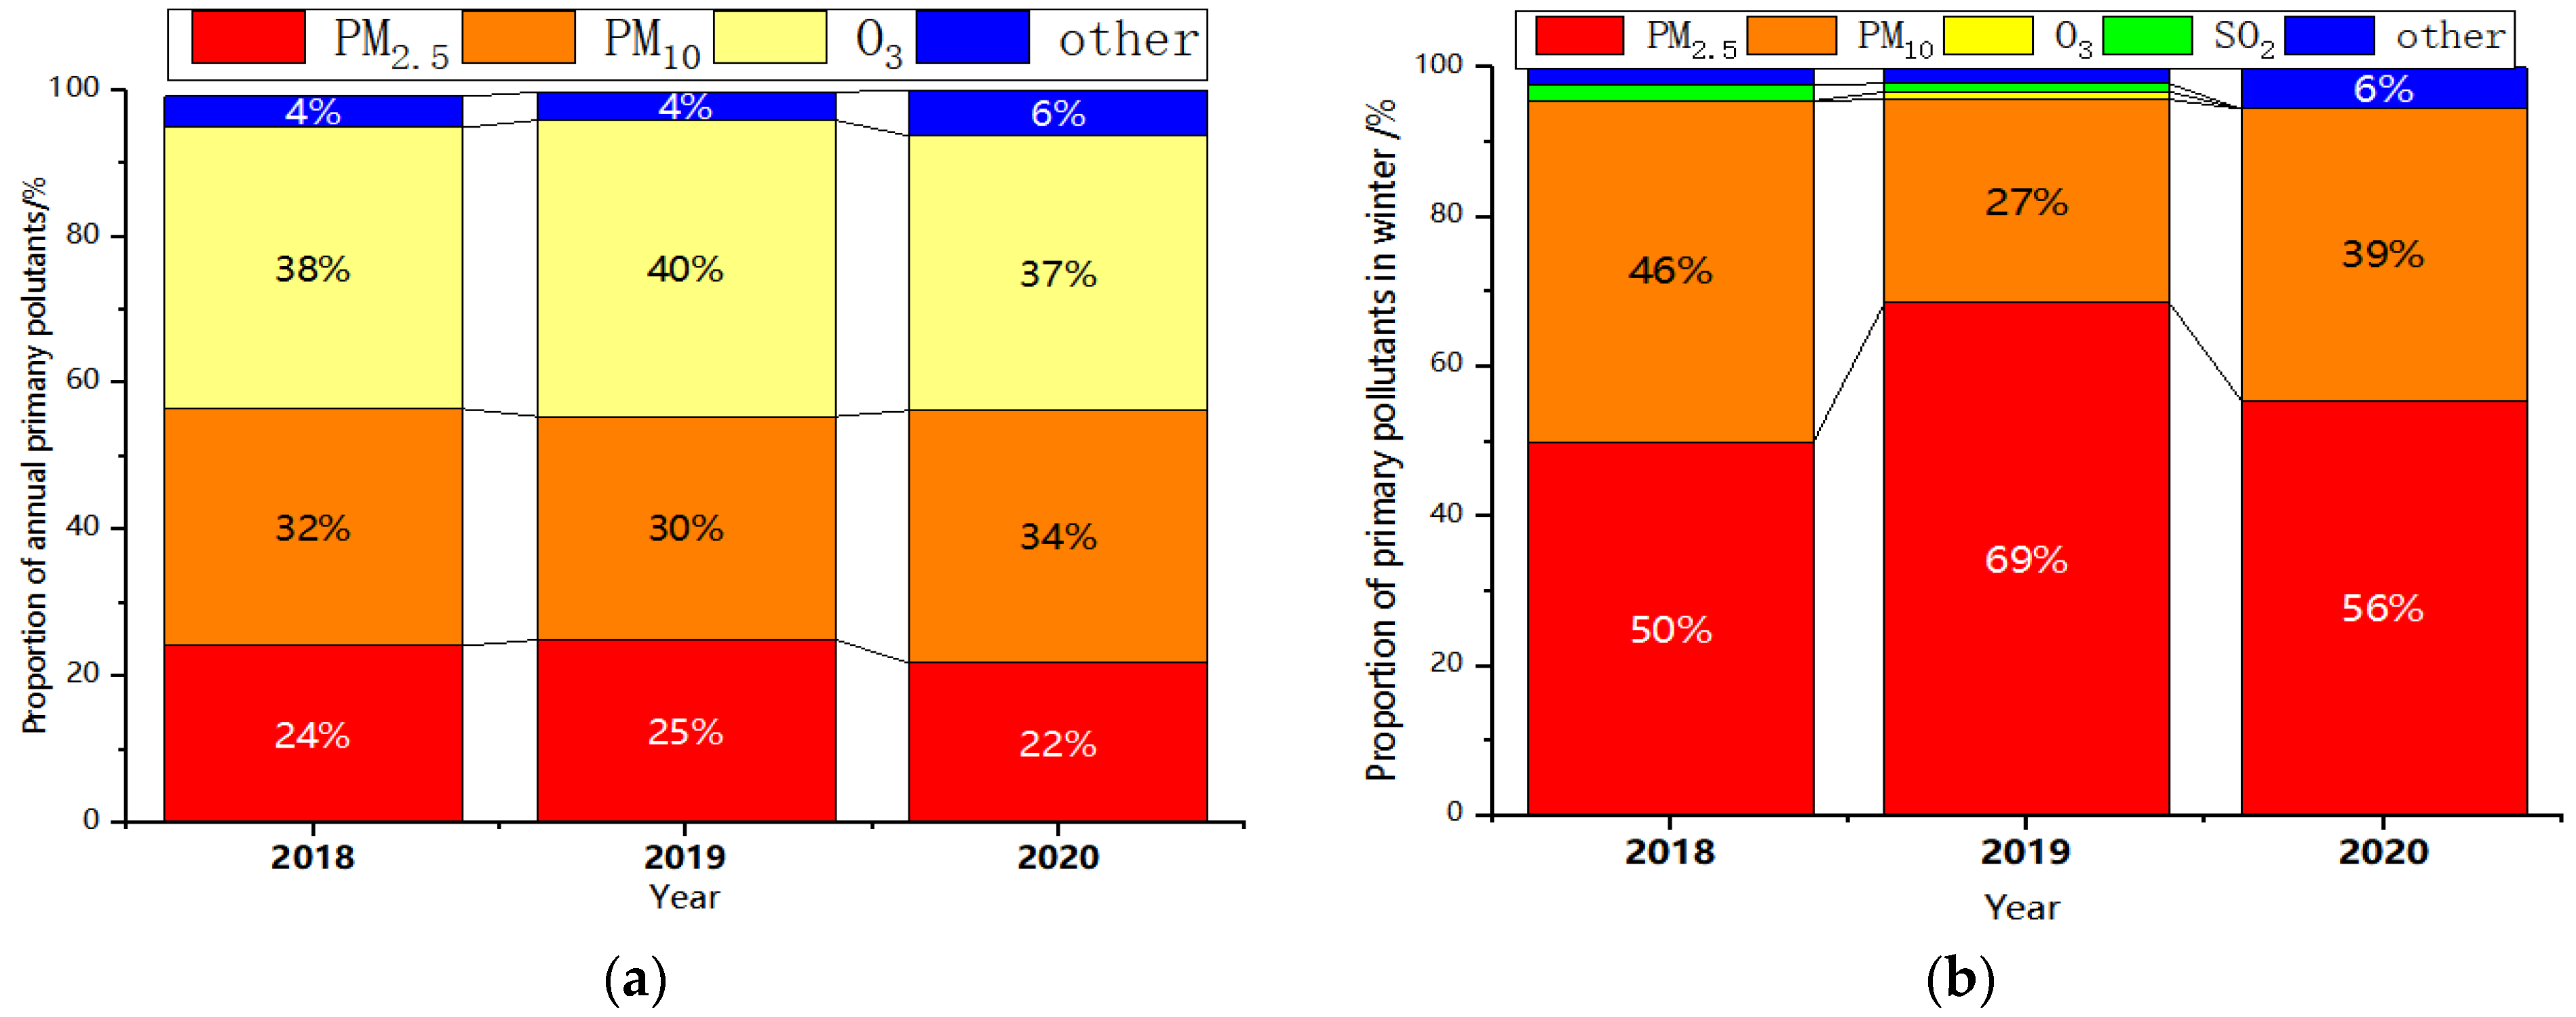
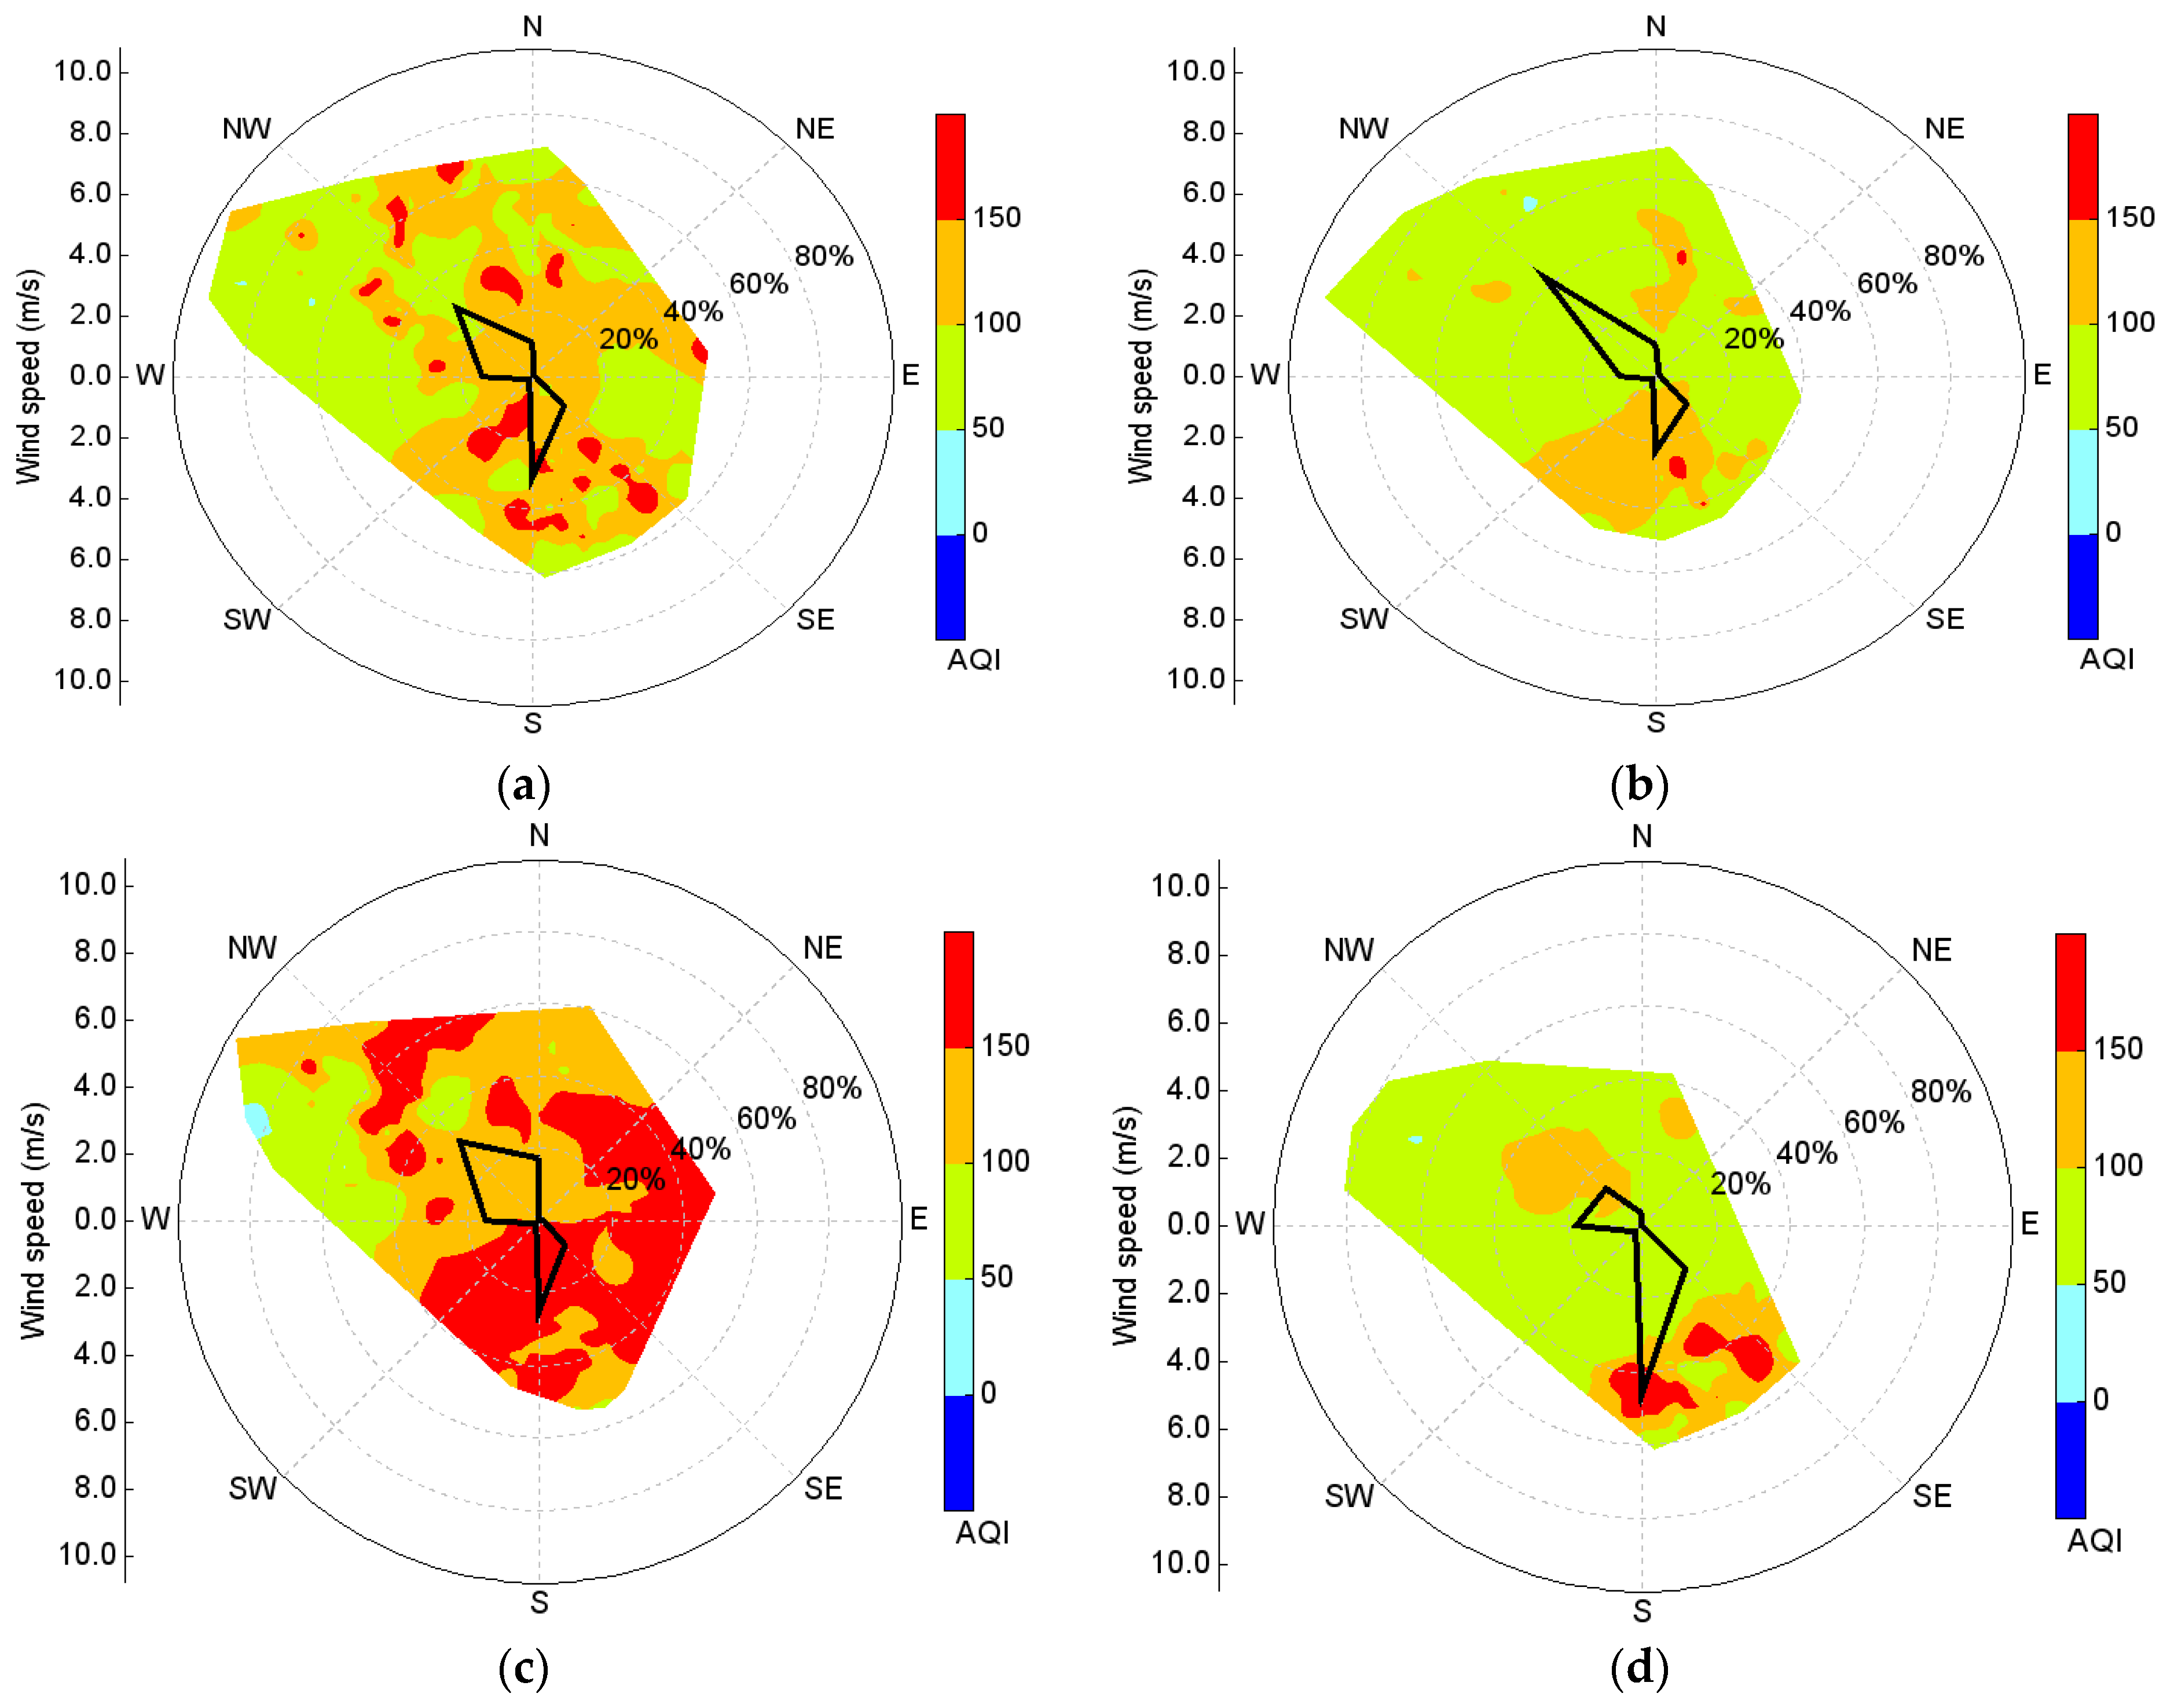
3.1. Analysis of Air Pollution Characteristics in Jincheng

According to the AQI data of China’s environmental situation from 2018 to 2020, Jincheng was in the bottom 20 among the 338 prefectures and prefecture-level cities in China, and the air pollution was very severe. Figure 2 shows the daily AQI changes in Jincheng from 2018 to 2020. Generally speaking, the highest value occurred in January (AQI index of 292 on 25 January 2020), and the lowest value occurred in September (AQI index of 29 on 12 September 2019). The numbers of compliance days of daily AQI in 2018, 2019, and 2020 were 209, 182, and 235, respectively. Apparently, the number of compliance days has fluctuated greatly in last 3 years, indicating that the environmental pollution situation in Jincheng is still severe.
Figure 3 shows the monthly change in AQI and the proportion of AQI at all levels in Jincheng from 2018 to 2020. As shown in Figure 3a, the AQI in Jincheng showed a “gradual N-shaped decline” trend. The month with the lowest AQI was October, while March and April placed second and third lowest, respectively. The AQI in October and April was below 100 for all three years, and the highest AQI was in January with values above 150. Figure 3b shows that the month with the highest number of good days was March, reaching 75%, while June and January had the lowest number of good days, reaching 30% and 22%, respectively.
Figure 4 shows the proportion of AQI at all levels throughout the year and in winter from 2018 to 2020. Figure 4a shows that the proportion of excellent or good days in 2018 was 58%, decreasing to 51% in 2019, and increasing to 66% in 2020, indicating a large interannual fluctuation of air quality conditions. As shown in Figure 4b, the proportion of excellent or good days in winter from 2018 to 2020 showed a similar pattern (59% in 2018, 44% in 2019, and 63% in 2020). In the winter of 2018–2020, Jincheng issued a serious air quality warning to control various measures, such as limiting production, shutting down polluting enterprises, and limiting the vehicle traffic. There were two main reasons. Firstly, there was no significant change in the dust in spring and autumn or in O3 pollution in summer in Jincheng; secondly, the transformation and development of the Jincheng coal chemical base had little effect.
Figure 5 shows the percentage of major pollutants in Jincheng in the whole year and winter from 2018 to 2020. Figure 5a shows that the primary pollutants throughout the year were particulate air pollutants PM10 and PM2.5, and the total proportion of the two reached 55–56% from 2018 to 2020, with little change year by year. In addition, the number of days when O3 was the abundant pollutant accounted for about 40%, with other pollutants accounting for less. It can be seen from Figure 5b that the overall change was different from that of the whole year. PM2.5 was the primary pollutant, reaching 50–69%, PM10 reached 27–46%, and there was no primary pollutant dominated by O3 in winter. The number of days with particulate matter as the primary pollutant in winter increased significantly, nearly double that of the whole year, mainly because there were almost no days with O3 as the primary pollutant in winter.
Due to the heating demand in winter, it is the main time for Jincheng to use coal, also highlighting the possible impact of pollution caused by coal burning on Beijing, Tianjin, and Hebei. According to the sources and spatial distribution of AQI (Figure 6), in wintertime (Figure 6a), high AQI values could be observed in the northwest, southeast, and southwest directions. The high values in the northwest were mainly distributed in the range of wind speed of 2–8 m/s, indicating that the high AQI values in the northwest wind direction mainly came from foreign pollution, while the high AQI values in the southwest and southeast were mainly concentrated in the range of wind speed of 0–6 m/s, mainly local pollution. In December (Figure 6b), high-AQI areas were observed in the north and southwest directions, and the wind speed was concentrated within 5 m/s, indicating local pollution emission. In January, the AQI (Figure 6c) was distributed within 2–10 m/s in the north direction, indicating foreign pollution, while the wind in other directions was within 6 m/s, indicating local pollution. In February, the AQI (Figure 6d) was distributed within 6 m/s in the southeast direction, indicating local pollution, with mild pollution in other directions. This shows that the pollution in Jincheng was affected by both pollution transmission and local emission sources.

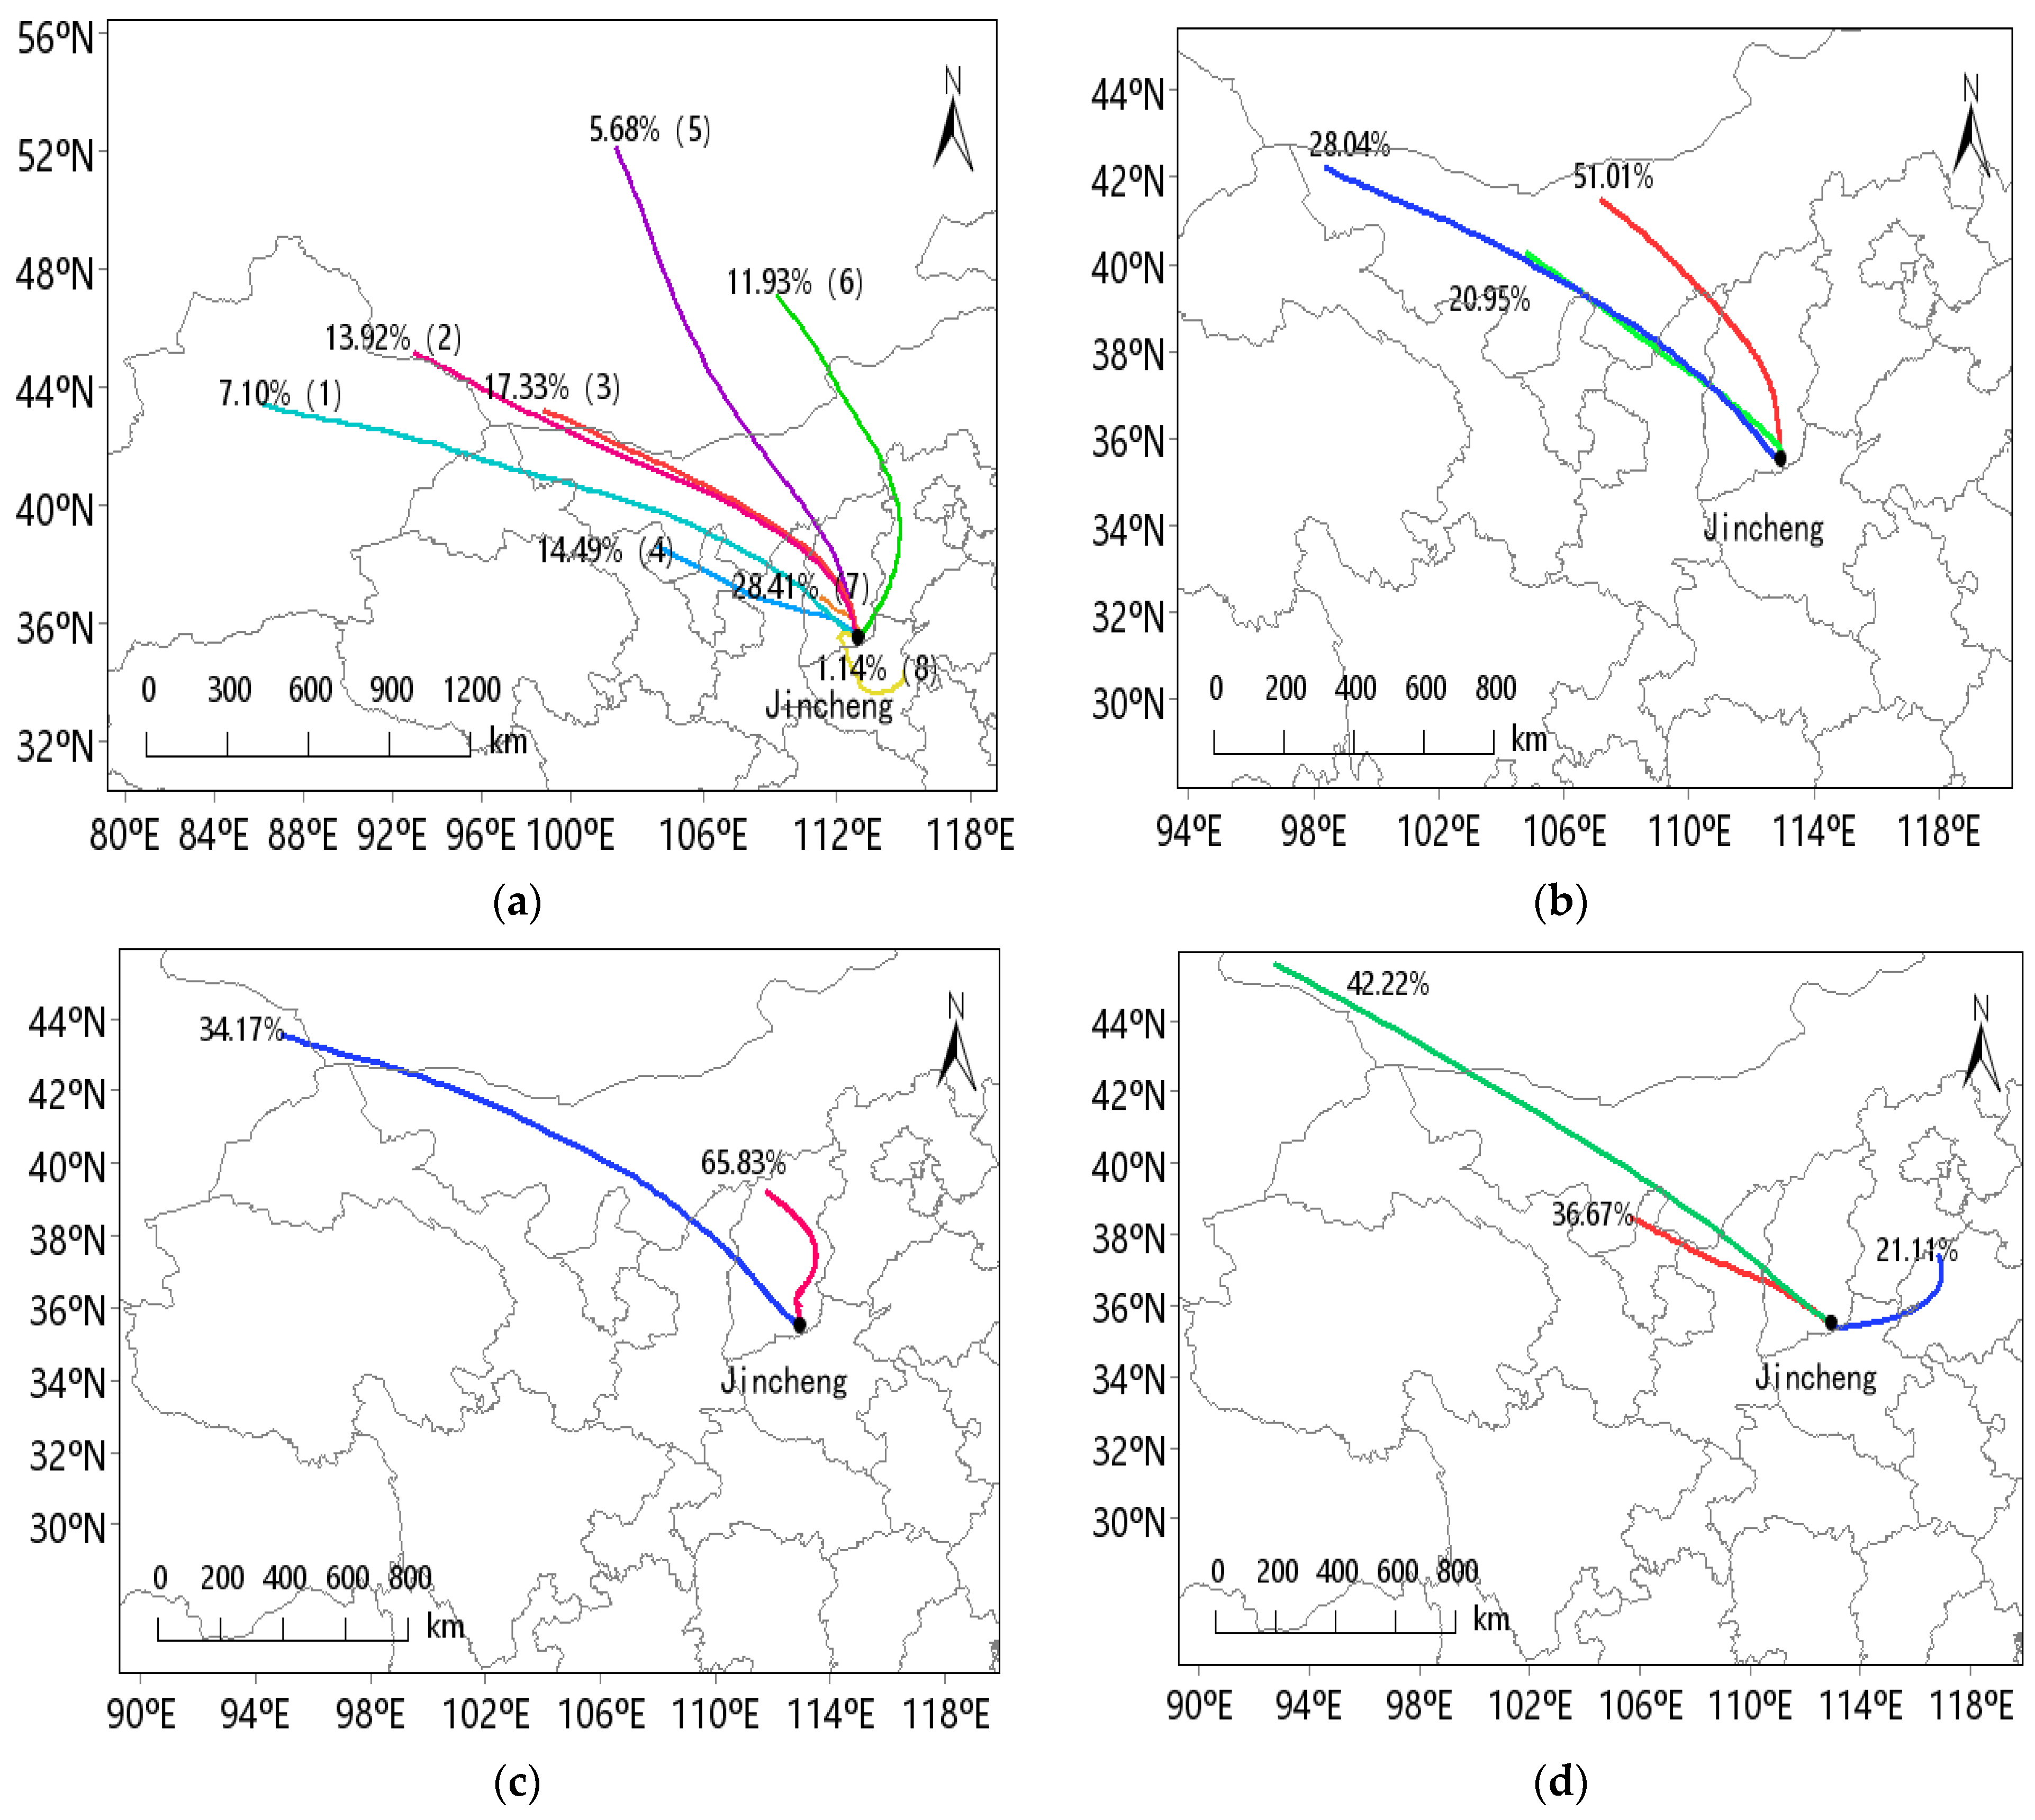
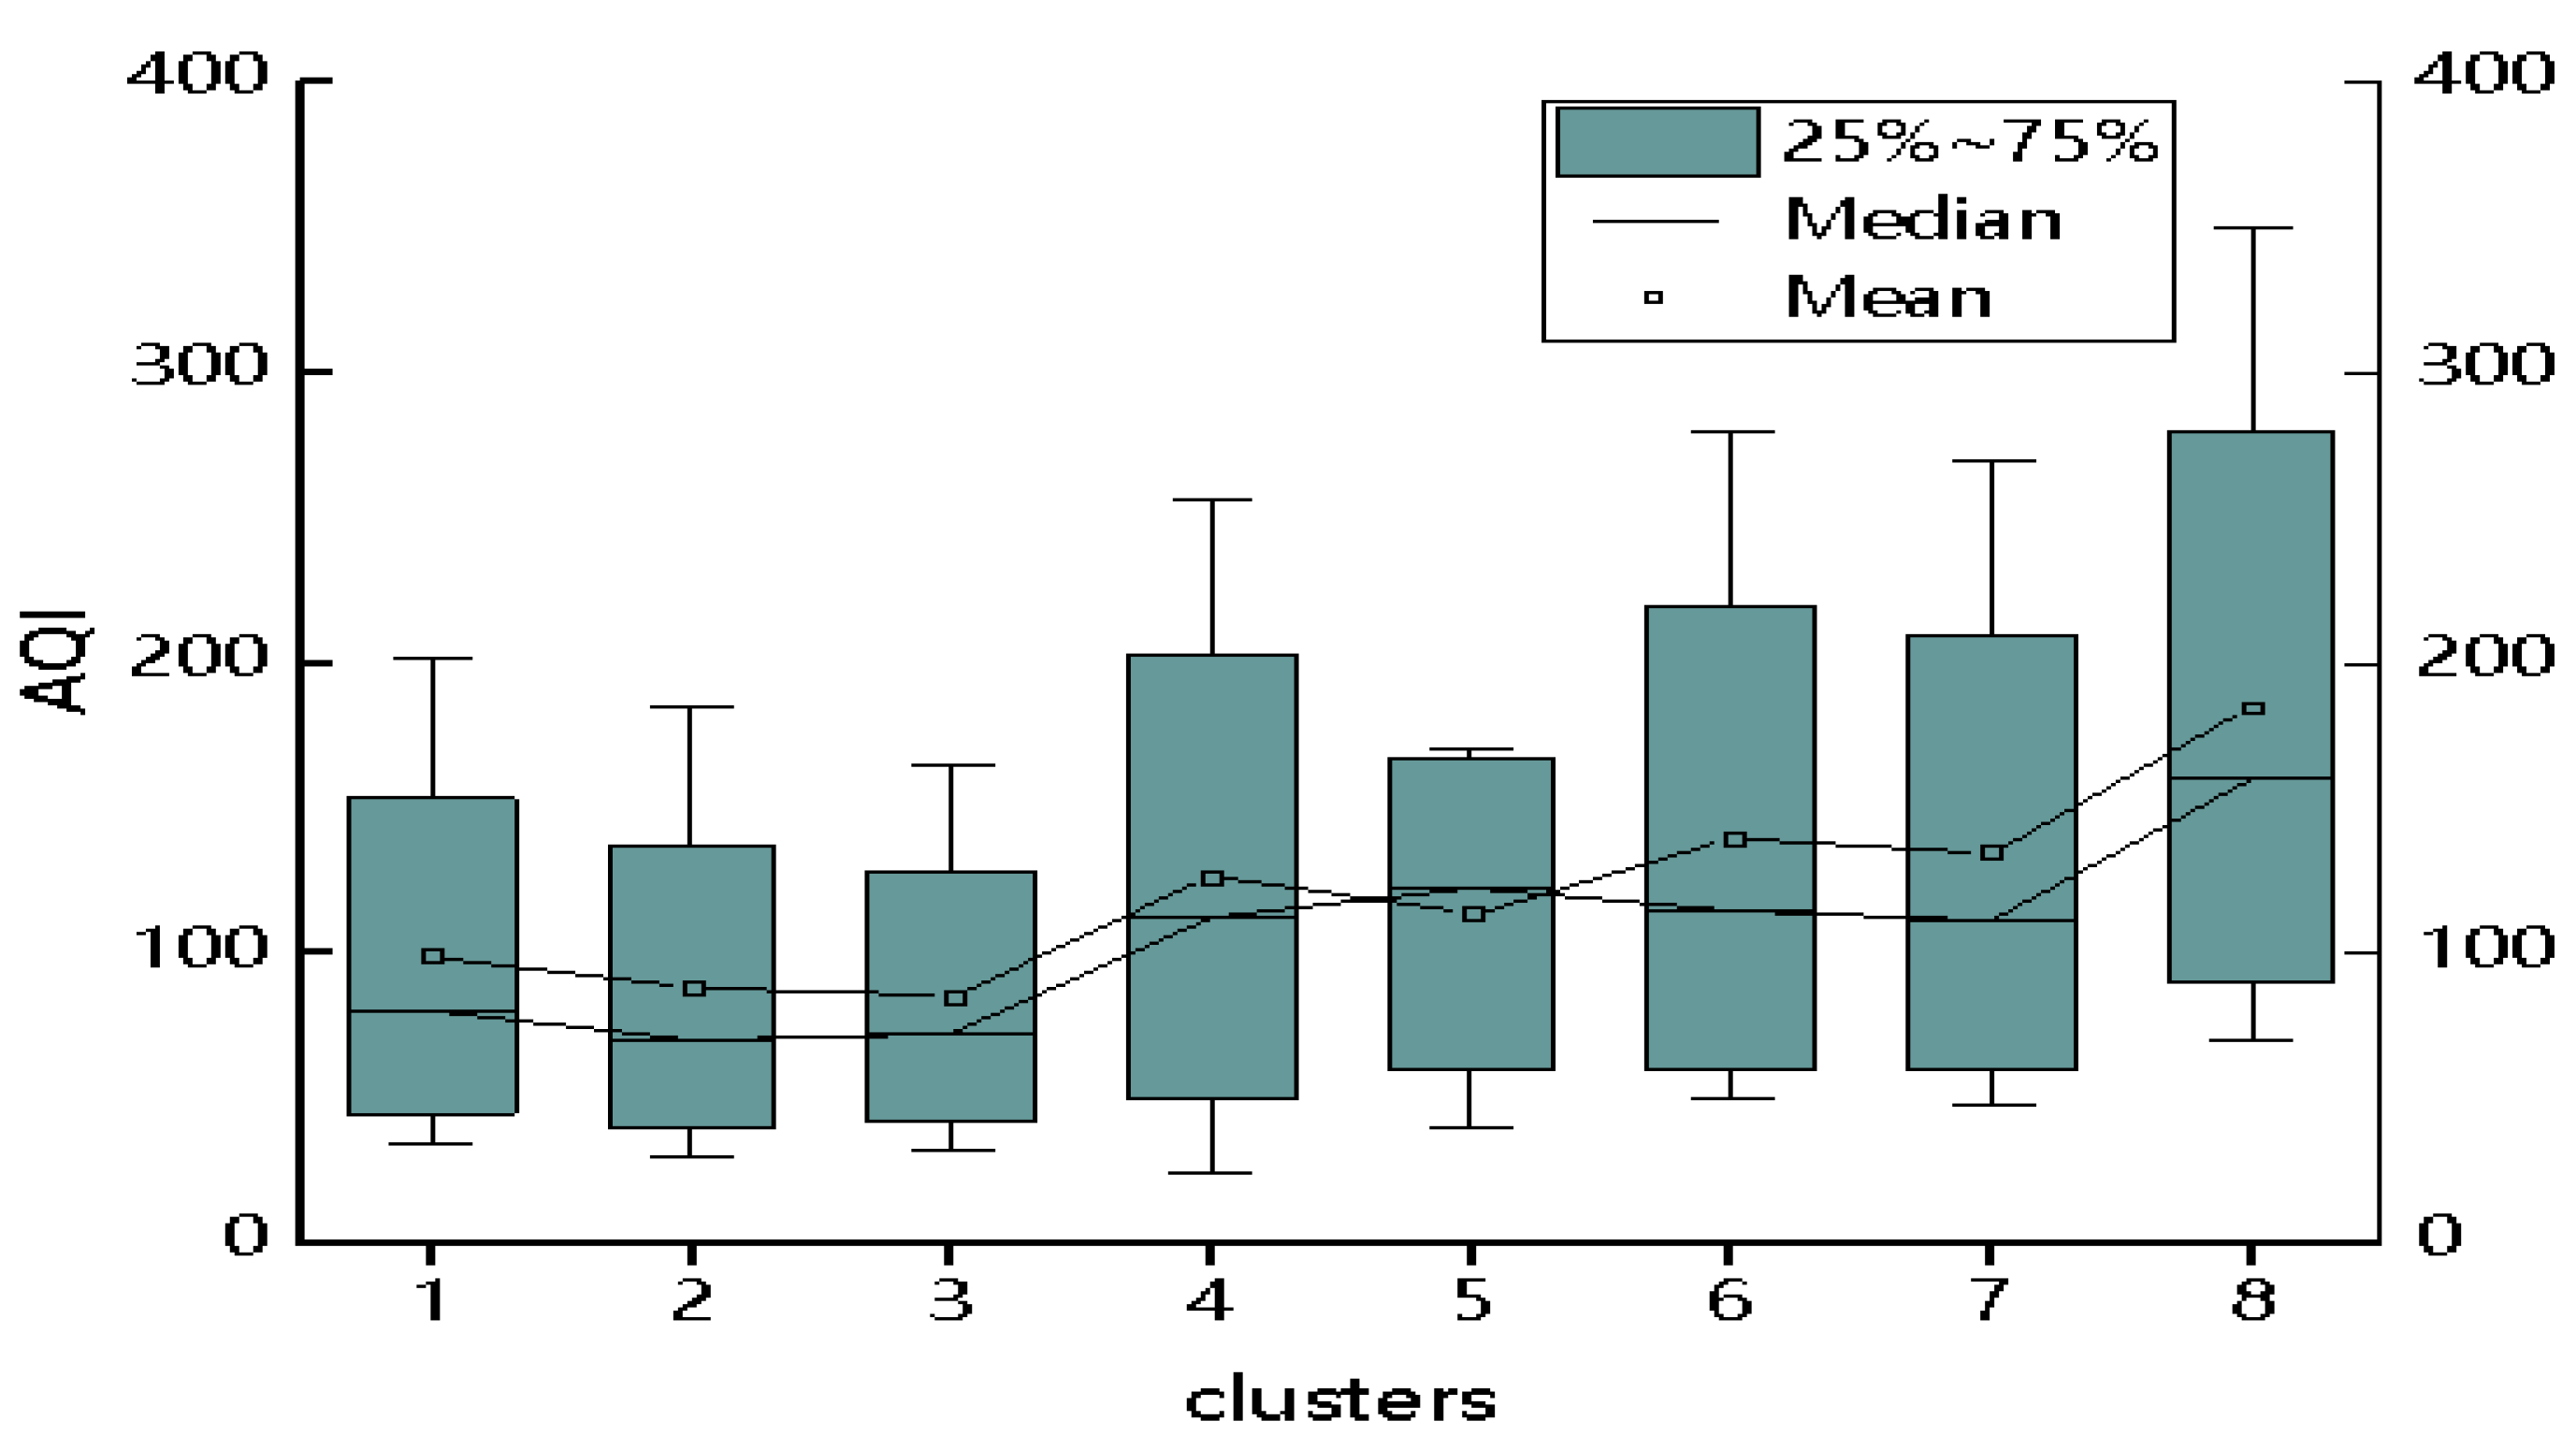
3.2. Analysis of Conveying Path

Using the backward trajectory calculation method and clustering method provided by trajstat software, the trajectory calculation was carried out on the AQI data of Jincheng (35.53° N, 112.52° E) from 2018 to 2020, and the pollutant transportation trajectories of Jincheng in winter and each month (December and January and February of the next year) were obtained (Figure 7). It can be seen from Figure 7a that there were eight transmission trajectories and five northwest trajectories in winter (categories 1, 2, 3, 4, and 7) accounting for 52.84%, two northerly trajectories accounting for 17.61% (categories 5 and 6), and a southeast trajectory accounting for 1.14% (category 8). Figure 7b–d show the trajectory results of each month in December, revealing three main trajectories in the northwest direction in Inner Mongolia. In January, the two trajectories were in the north and northwest directions respectively, accounting for 65.83% in west Inner Mongolia and at the junction of Xinjiang and Mongolia. In February, the three trajectories in the northwest direction accounted for 42.22% in Mongolia, 36.67% in Yan’an in Yulin and Ningxia in Shanxi, and 21.11% in Xinxiang and Hebi in Henan.
The average speeds of eight types of trajectories are shown in Table 2. The average moving speed of types 1, 2, and 5 trajectories exceeded 10 m·s−1, indicating long-distance transportation. The third type of trajectory exceeded 8 m·s−1 for medium-distance transportation. The trajectories of categories 4, 7, and 8 were transported in close range when the moving speed was less than 5 m·s−1. The trajectory results are consistent with the geographical location and monsoon characteristics of Jincheng. In addition, the blocking easterly air flow from Taihang Mountain had relatively little impact on this region.
Figure 8 shows the box diagram of AQI distribution of eight trajectories in winter in Jincheng. The average AQI of the eight trajectories was 68.8–149.6, with a minimum of 25 and a maximum of 350. The magnitude of the AQI variation of the type 3 trajectory was the smallest, 32–165, while that of the type 8 trajectory was the largest, 70–350.
Table 3 shows the statistics of days of excellent air quality under eight trajectories. The results show that there were significant differences in the average value of AQI in Jincheng for different trajectories. The excellent proportion of AQI in Jincheng under Category 1, 2, 3, 4, and 7 trajectories in the northwest was 57.2–78.3%, accounting for a relatively high proportion. Among them, the proportion of excellent air quality in Jincheng under the Category 2 transmission trajectory in the northwest was the highest, representing the cleanest transmission trajectory. The distribution of AQI under type 5 and 6 transmission trajectories in the northerly direction was quite different, and the proportion of good weather was 32.8–48.2%. Under these two transmission trajectories, the AQI in Jincheng was high. The proportion of air quality pollution in Jincheng under the type 5 transmission trajectory was 67.2%, which was higher than that under type 6. The initial height of air mass is higher, making it easier to transport pollutants downstream of the trajectory. The type 8 trajectory was the only one with a proportion of 1.1% to the east. Under the type 8 transmission trajectory, the proportion of excellent air quality in Jincheng was similar to that of the type 5 transmission trajectory, but the polluted weather was higher, reaching 73%. Under this trajectory, the number of excellent days in Jincheng was only 26%, and the pollution degree was the heaviest, but the proportion was small.
Table 4 shows the proportion of transmission trajectories under various AQI levels in Jincheng. Under slightly polluted conditions, the proportion of class 5 transmission trajectories was 30.8%, the proportion of class 6 transmission trajectories was 22.4%, and the proportion of class 4 and 8 transmission trajectories exceeded 10%. Under moderately polluted conditions, the pollution probability of class 5 and 6 transmission trajectories exceeded 20%, and the pollution probability of class 4, 7, and 8 trajectories was between 10% and 20%. Under severely polluted conditions, the type 5 transmission trajectory accounted for 30.7%, followed by the type 6 transmission trajectory, accounting for 21.3%. Under seriously polluted conditions, the transmission trajectories of categories 5, 6, and 8 exceeded 20%, followed by categories 4 and 6, accounting for 11–14.8%. According to the above statistics, the fifth type of transmission trajectory was the main trajectory for the transportation of foreign pollutants into Jincheng, accounting for a relatively high proportion. The sixth and eighth types of transmission trajectories were the major reasons for severe pollution in Jincheng.

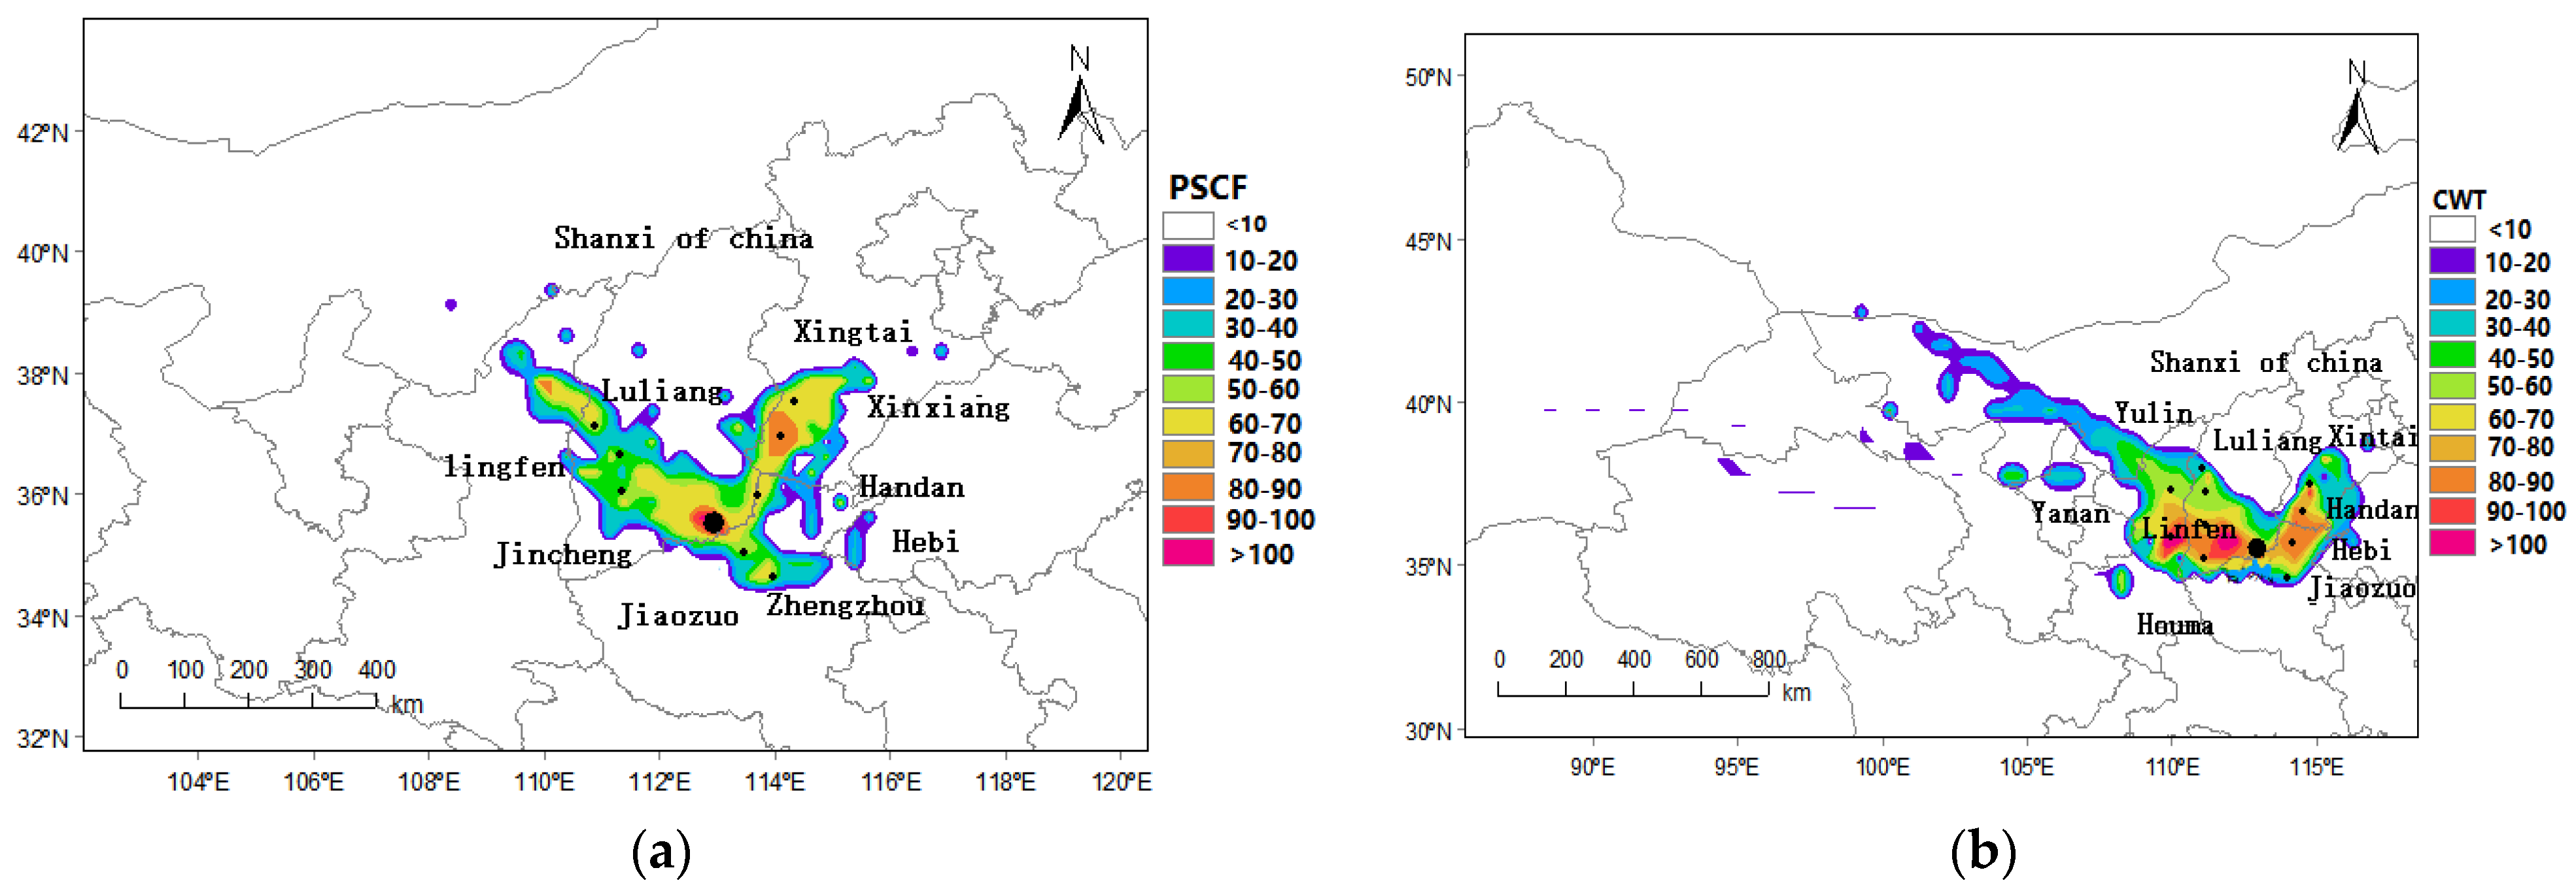
3.3. Analysis of Pollution Source Area

Trajectory cluster analysis can determine the rough direction and contribution of air pollution transmission affecting Jincheng. However, it struggles to reflect the specific location and intensity of potential pollution sources. The PSCF method and CWT method can solve this problem. These two methods use specific pollutant concentrations to analyze potential pollution sources. In Liu Na et al. [24], the pollution source areas of PM2.5 or PM10 were analyzed separately. As a comprehensive index reflecting the degree of air quality pollution, the AQI index data from 2018 to 2020 were analyzed using the PSCF method and CWT method to obtain the pollution source areas affecting the change in AQI in Jincheng. This is very helpful to the prevention and control of environmental pollution in Jincheng. The PSCF method judges the pollution source on the basis of a probability function. The potential pollution source area of Jincheng in winter from 2018 to 2020 was calculated as shown in Figure 9a. It can be seen that potential source regions with a great impact on the AQI in Jincheng were mainly located in Northern Shanxi in Luliang and Linfen in Shanxi, and Xingtai and Handan in Hebei. The air masses in these potential source areas were mainly transported to Jincheng over a medium distance along the first, second, third, and sixth trajectories, with a potential contribution of about 0.8. Those in Henan Jiaozuo, Zhengzhou, and Xinxiang were transported through the eighth trajectory. The potential contribution of Hebi was about 0.5.
CWT was used to estimate the weighted concentration of pollution source areas in winter 2018–2020, as shown in Figure 9b. The results show that the main pollution source areas with an impact of more than 100 on AQI in Jincheng were Linfen in Houma, Luliang in Shanxi Province, Yan’an and Yulin in Shanxi Province. The regions that contribute more than 50 to the AQI value of Jincheng are Handan and Xingtai in Hebei and Jiaozuo and Hebi in Henan Province.
Through the analysis of the transportation path and pollution source area of Jincheng in winter in the last 3 years, it can be seen that the type 5 transmission path in the north direction was the main path affecting the winter air quality pollution in Jincheng, and the potential pollution source areas were Wuhan in Inner Mongolia, Yulin and Yan’an in Shanxi Province, and Luliang, Linfen, and the north of Yuncheng in Fenhe Valley in Shanxi Province. Wang et al. [35] analyzed the transmission trajectory of PM2.5 in winter in Xi’an and Zhengzhou, respectively. The results highlighted Fen Wei River Valley as one of the important pollution sources. Therefore, the impact of air pollution is mutual, and an effective joint prevention mechanism is very important for air environment control. For example, government departments, all sectors of society, and enterprise management and control should cooperate to limit the emissions of some highly polluting enterprises, as well as increase pollution elimination equipment.

3.4. Discussion

In this study, trajstat software was mainly used for backward trajectory clustering, as well as PSCF and CWT analysis. Compared with Phuong et al. [36] who extracted air pollutant data from remote sensing images to evaluate the pollution levels of NO2 and SO2 in the air of Ho Chi Minh, Vietnam, the method used in this paper could also be used to evaluate air quality pollution. Zhang et al. [37] presented a quantitative assessment of PM2.5 using community multiscale air quality (CMAQ) model 5 to illustrate the combined effect of policy controls on pollution management. This study pointed out that air pollution control requires the government to take comprehensive measures, along with upstream and downstream linkage and regional linkage, in order to effectively solve the pollution problem. Sharma et al. [38] studied the variation characteristics of pollutants emitted by various vehicles and different types of fuels in Delhi, India. In China’s Jincheng area, local coal, chemicals, and cars are among the sources of air pollution. Wang G.C. et al. [1] studied winter PM2.5 in Beijing. The transport path and potential source area of the serious pollution process revealed that local and external air pollution sources are equally important, basically in line with the results of this study.
Yan et al. [39] analyzed the interannual and seasonal characteristics of air pollution in Taiyuan using the ambient AQI. The air pollution situation is not optimistic, and the air pollution in spring and summer may be more serious [40,41,42,43,44,45]. The AQI index showed the characteristics of a “gradual N-shaped decline”, which may be related to the local special climate and region. Wang G.C.; et al. [1] used NCEP and GDAS (Global Data Assimilation System) global meteorological element data, the HYSPLIT model, and the cluster analysis method to analyze the vertical characteristics of pollutant transport channels in Guangzhou. The proportion of trajectories with a height of more than 1000 m was 16.1%, while the proportion of trajectories with a height of less than 500 m was 73.1%. The transport of near-surface pollutants mainly occurred in the boundary layer. This paper mainly studied the AQI pollution situation and source area below 500 m. The pollution at more than 1000 m height has a slight impact on urban pollution.

4. Conclusions

Using the air pollution data from 2018 to 2020, the transmission path and potential source area of atmospheric pollutants in winter in Jincheng were studied and quantitatively analyzed. The study conclusions are drawn below.
The Jincheng AQI index showed a “gradual N-shaped decline” by year; the AQI was lowest in March, April, and October, with the October and April AQI exceeding 100 for three consecutive years. The highest number of good days was recorded in March, June, and January. The air quality fluctuated year by year, with the number of good days being 58% in 2018, dropping to 51% in 2019, and then rising to 66% in 2020, showing a very unstable proportion of days with moderate and severe pollution. In the most polluted season (winter), the proportion of good days fluctuated similarly to the whole year.
The primary pollutants throughout the year were atmospheric particulate pollutants PM10 and PM2.5, accounting for 55–56% from 2018 to 2020, with little change year by year. In addition, the number of days in which O3 was the primary pollutant accounted for about 40%, with other pollutants accounting for less. The overall change differed by year. PM2.5 was the primary pollutant, reaching 50–69%, while PM10 reached 27–46%. The number of days with particulate matter as the primary pollutant in winter increased significantly, nearly double that of the whole year, mainly because of the weaker O3 pollution in winter.
The cluster analysis of backward trajectories in winter in Jincheng from 2018 to 2020 revealed eight transmission trajectories categories in winter, of which five northwest trajectories (categories 1, 2, 3, 4, and 7) accounted for 52.84%, two northerly trajectories accounted for 17.61% (categories 5 and 6), and a southeast trajectory accounting for 1.14% (category 8). The monthly calculation showed that the three trajectories in December were mainly northwest, the two trajectories in January were northwest and north, and the three trajectories in February were northwest and east. The trajectory results were consistent with the geographical location and monsoon characteristics of Jincheng.
The potential pollution source areas with great AQI impact in Jincheng were mainly located in Northern Shanxi, Luliang and Linfen in Shanxi, and Xingtai and Handan in Hebei. The air masses in these potential pollution source areas were mainly transported to Jincheng over medium distance along the first, second, third, and sixth trajectories, with a potential contribution of about 0.8. The potential contribution of Jiaozuo, Zhengzhou, Xinxiang, Hebi, and other regions in Henan for short-distance transportation through the eighth trajectory was about 0.5. Fen Wei River Valley was also an important source of pollution. Therefore, the impact of air pollution was mutual. An effective joint prevention mechanism is very important for air environment control.

Author Contributions

Q.L. was responsible for writing the manuscript; S.L. was responsible for data processing; J.X. was responsible for drawing charts. All authors have read and agreed to the published version of the manuscript.

Funding

The APC was funded by grants from General Survey of Meteorological Disasters in Shanxi Province (Grant numbers: SXJZCGYY202204).

Institutional Review Board Statement

Not applicable.

Data Availability Statement

The datasets supporting the results of this article are included within the article and its additional files.

Acknowledgments

This work was financially supported by the Research Project of Shanxi Province (SXJZCGYY202204), with funding of 10,000 USD.

Conflicts of Interest

The authors declare no conflict of interest.

References

  1. Wang, G.C.; Wang, D.Q.; Chen, Z.L. Characteristics and transportation pathways and potential sources of a severe PM2.5 episodes during winter in Beijing. China Environ. Sci. 2016, 36, 1931–1937. [Google Scholar]
  2. Lv, X.; Guo, Q.B.; Jiang, C.L. Straw incineration monitoring and air pollution effect analysis in the three eastern provinces in the autumn of 2015–2017. Environ. Pollut. Prev. 2021, 43, 611–613, 663. [Google Scholar]
  3. Deng, X.J.; Huang, J.; Wu, D. Analyses on the typical atmospheric pollution processes in Shenzhen area. China Environ. Sci. 2006, 26, 7–11. [Google Scholar]
  4. Yan, C.X.; Zhou, X.; Zhang, H.M. Mingjun Study on temporal and spatial variation characteristics and influencing factors of ambient air pollution in Nanchang. Resour. Environ. Yangtze River Basin 2019, 28, 1446–1459. [Google Scholar]
  5. Xu, X.D.; Zhou, L.; Zhou, X.J. Influencing domain of peripheral sources in the urban heavy pollution process of Beijing. Sci. China Ser. D Earth Sci. 2005, 48, 565–575. [Google Scholar] [CrossRef]
  6. Ye, X.; He, T.; Xia, J. Analysis of a simultaneous pollution process of atypical particulate matter and ozone. Environ. Prot. Technol. 2017, 23, 7–14. [Google Scholar]
  7. Draxler, R.R.; Hess, G.D. Description of the HYSPLIT_4 Modeling System; NOAA Technical Memorandum ERL ARL-224; NOAA Air Resources Laboratory: Silver Spring, MA, USA, 1997.
  8. Draxler, R.R.; Hess, G.D. An overview of the HYSPLIT_4 modelling system for trajectories, dispersion, and deposition. Aust. Meteorol. Mag. 1998, 47, 295–308. [Google Scholar]
  9. Draxler, R.R. HYSPLIT_4 User’s Guide; US Department of Commerce, National Oceanic and Atmospheric Administration, Environmental Research Laboratories, Air Resources Laboratory: Silver Spring, MA, USA, 1999.
  10. Park, J.; Ryu, J.; Kim, D. Long-range transport of S02 from continental Asia to northeast Asia and the northwest Pacific Ocean: Flow rale estimation using OMI data surface insitudata, and the HYSPLIT model. Atmosphere 2016, 7, 53. [Google Scholar] [CrossRef] [Green Version]
  11. Anil, I.; Karaca, F.; Alagha, O. Investigation of long-range atmospheric transport effects on Istanbul “Inhalable particulate matter episodes”. Ekoloji 2009, 19, 86–97. [Google Scholar] [CrossRef]
  12. Fishman, J.; Balok, A.E. Calculation of daily tropospheric ozone residuals using TOMS and empirically improved SBUV measurements: Application to an ozone pollution episode over the eastern United States. J. Geophys. Res. Atmos. 1999, 104, 30319–30340. [Google Scholar] [CrossRef]
  13. Chen, L.; Zhang, L.; Zhang, L. Characteristics of black carbon aerosol and carbonaceous gases and their emission sources in semi-arid region. China Environ. Sci. 2012, 32, 1345–1352. [Google Scholar]
  14. Yang, Y.; Li, X.R.; Chen, X. Analysis of different particle sizes, pollution characteristics, and sources of atmospheric aerosols during the spring dust period in Beijing. Environ. Sci. 2018, 39, 5315–5322. [Google Scholar]
  15. Shi, G.E.; Yao, Y.Q.; Zhang, P. Transport trajectory classifying of PM10 in Hefei. Plateau Meteorol. 2008, 27, 1383–1391. [Google Scholar]
  16. Zhao, H.; Wang, T.J.; Jiang, F. Investigation into the source of air pollutants to Hong Kong by using backward trajectory method during the Trace-P campaign. J. Trop. Meteorol. 2009, 25, 181–186. [Google Scholar]
  17. Zhan, M.J.; Sun, J.Y.; Zhang, Y.M. The influence of air mass sources on the particle number concentration and the size distribution at Mt. Waliguan. J. Glaciol. Geocryol. 2009, 31, 659–663. [Google Scholar]
  18. Gao, J.H.; Zhu, B.; Wang, D.D. The variation of air pollutants and the impact of long-range transport in the northern suburb of Nanjing. Acta Sci. Circumslantiae 2012, 32, 1149–1159. [Google Scholar]
  19. Bao, M.Y.; Cao, F.; Liu, S.D.; Liu, X.Y.; Zhang, Y.Y.; Zhang, W.Q.; Tang, T.R.; Gao, Y.Q.; Zhang, Y.L. Study on evolution characteristics and influencing factors of main air pollutants in Suzhou suburbs. J. Ecol. Environ. 2017, 26, 119–128. [Google Scholar]
  20. Fu, C.B.; Dan, L.; Tong, J.H. Characteristics and cause analysis of a continuous air pollution process in Haikou in autumn 2017. Environ. Chem. 2021, 40, 1048–1058. [Google Scholar]
  21. Li, L.L.; Zhu, L.N.; Yan, Y.Z. Jiang Junqiu Analysis of primary air pollution process and potential source area in Suihua City. J. Environ. Sci. 2020, 40, 3785–3793. [Google Scholar]
  22. Li, Y.Y.; Yang, H.R.; Wang, N. Yao Jialin Cause analysis of a heavy pollution weather process in Taiyuan. J. Meteorol. Environ. 2018, 34, 11–18. [Google Scholar]
  23. Yang, X.C.; Du, M.M.; Wu, Q.Z. Analysis on meteorological condition and trajectory of a serious pollution weather in Xi’an of Shaanxi. J. Arid. Meteorol. 2016, 34, 547–552. [Google Scholar]
  24. Liu, N.; Yu, Y.; He, J.J.; Zhao, S. Analysis of air pollutant transport in winter in Lanzhou. Res. Environ. Sci. 2015, 28, 509–516. [Google Scholar]
  25. Liang, D.; Wang, B.; Wang, Y.Q.; Zhang, H. Distribution characteristics and sources of PM2.5 and gaseous pollutants in winter in Chongqing. Res. Environ. Sci. 2015, 28, 1039–1046. [Google Scholar]
  26. Zhao, Y.; Hu, G.R.; Yu, R.L. Concentrations and spatial-temporal characteristics and source analysis of PM2.5 in Nanchang City in 2013. Res. Environ. Sci. 2017, 30, 854–863. [Google Scholar]
  27. Zhou, M.; Qiao, L.P.; Zhu, S.H. Chemical characteristics of particulate matters and trajectory influence on air quality in Shanghai during the heavy haze episode in December, 2013. Environ. Sci. 2016, 37, 1179–1187. [Google Scholar]
  28. Duan, S.G.; Jiang, N.; Yang, L.M. Transport pathways and potential sources of PM2.5 during the winter in Zhengzhou. Environ. Sci. 2019, 40, 86–93. [Google Scholar]
  29. Wojcik, G.S.; Chang, J.S. A re-evaluation of sulfur budgets, lifetimes, and scavenging ratios for eastern North America. J. Atmos. Chem. 1997, 26, 109–145. [Google Scholar] [CrossRef]
  30. Wang, L.; Xu, C.L.; Xu, F.; Gao, Q. Temporal and spatial distribution characteristics and potential source analysis of original aerosol optical thickness in Beiping, China from 2011 to 2020. J. Earth Sci. Environ. 2021, 43, 1018–1032. [Google Scholar]
  31. Song, Y.F.; Huang, J.; Luo, D.T. Analysis on potential sources of atmospheric particulate matter in Hengyang City from 2019 to 2020. J. Xiangtan Univ. (Nat. Sci. Ed.) 2021, 43, 100–112. [Google Scholar]
  32. Cheng, Y.N.; Liu, D.W.; Wang, J. Simulation and characteristic analysis of air pollution process in Hohhot based on WRF Chem mode. J. Inn. Mong. Univ. (Nat. Sci. Ed.) 2021, 52, 371–380. [Google Scholar]
  33. Begum, B.A.; Kim, E.; Jeong, C.H. Evaluation of the potential source contribution function using the 2002 Quebec forest fire episode. Atmos. Environ. 2005, 395, 3719–3724. [Google Scholar] [CrossRef]
  34. Hsu, Y.K.; Holsen, T.M.; Hopke, P.K. Comparison of hybrid receptor models to locate PCB sources in Chicago. Atmos. Environ. 2003, 37, 545–562. [Google Scholar] [CrossRef]
  35. Wang, S.; Liao, T.T.; Wang, L.L. Atmospheric characteristics of a serious haze episode in Xi’an and the influence of meteorological conditions. Acta Sci. Circumslantiae 2015, 35, 3452–3462. [Google Scholar]
  36. Phuong, D.T.K.; Nhut, M.C.; Tri, N.D. Research on air pollution assessment in Ho Chi Minh City, Vietnam, 2015–2019 based on RS and GIS, earth and Environmental. Sciences 2018, 32, 1–6. [Google Scholar]
  37. Zhang, X.G.; Jimmy, C.H.; Zhang, Y.M. China 2020 PM2.5 Emission assessment: Impact of comprehensive emission reduction policies environmental pollution. China Environ. Sci. 2020, 263–293. [Google Scholar]
  38. Sharma, R.; Kumar, R.; Singh, P.K. A Systematic Study on the Analysis of the Emission of CO, CO2 and HC for Four-Wheelers and Its Impact on the Sustainable Ecosystem. Sustainability 2020, 12, 6707. [Google Scholar] [CrossRef]
  39. Yan, S.M.; Wang, Y.; Guo, W.; Li, Y. Study on air pollution characteristics, transportation, ways and potential pollution sources in autumn and winter in Taiyuan. Huanjing Discip. Environ. Sci. 2019, 40, 150–159. [Google Scholar]
  40. Wang, S.Q.; Li, W.B.; Deng, X.J. Characteristics of air pollutant transport channels in Guangzhou. China Environ. Sci. 2015, 35, 2883–2890. [Google Scholar]
  41. Pan, Y.Y.; Chen, D.H.; Ye, S.Q. Characteristics and influencing factors of typical cases of air pollution in Guangdong Province. Saf. Environ. Eng. 2017, 24, 58–66. [Google Scholar]
  42. Ren, C.B.; Wu, L.X.; Zhang, Y.Y. Analyze to the seasonal differences of transport pathways and potential source-zones of Beijing Urban PM2.5. China Environ. Sci. 2016, 36, 2591–2598. [Google Scholar]
  43. Wang, Y.Q.; Zhang, X.Y.; Draxler, R. TrajStat: GIS-based software that uses various trajectory statistical analysis methods to identify potential sources from long-term air pollution measurement data. Environ. Model. Softw. 2009, 24, 938–939. [Google Scholar] [CrossRef]
  44. Xiao, Y.; Tian, Y.Z.; Xu, W.X. Study on the spatiotemporal characteristics and socioeconomic driving factors of air pollution in China. Ecol. Environ. Sci. 2018, 27, 518–526. [Google Scholar]
  45. Xin, A.X.; He, C.; Peng, Y.X. Hong Song Temporal and spatial distribution and regional transmission contribution of air pollutants in Wuhan. Environ. Sci. Technol. 2020, 43, 170–181. [Google Scholar]
Figure 1. Distribution of selected meteorological stations.
Sustainability 14 13511 g001
Figure 2. Timeseries of ambient AQI in Jincheng from 2018 to 2020.
Sustainability 14 13511 g002
Figure 3. Monthly change in AQI from 2018 to 2020 (a) and monthly proportion of different AQI (b). The blue dotted line represents the 2 year average.
Sustainability 14 13511 g003
Figure 4. Proportion of annual AQI level (a) and winter AQI level (b) from 2018 to 2020.
Sustainability 14 13511 g004
Figure 5. Proportion of primary pollutants in whole year (a) and in winter (b) of Jincheng from 2018 to 2020.
Sustainability 14 13511 g005
Figure 6. Windrose with AQI concentrations in Jincheng: (a) winter; (b) December; (c) November; (d) February. The percentage values represent the proportion from the center point with wind speed of 0. The black delineated area represents the dominant wind direction, wind speed, and wind frequency.
Sustainability 14 13511 g006
Figure 7. Clustering trajectory of Jincheng in winter from 2018 to 2020: (a) winter; (b) December; (c) November; (d) February.
Sustainability 14 13511 g007
Figure 8. AQI of eight trajectory clusters to Jincheng in winter.
Sustainability 14 13511 g008
Figure 9. Analysis of winter PSCF (a) and CWT (b) in Jincheng from 2018 to 2020.
Sustainability 14 13511 g009
Table 1. Air quality pollutants project concentration index and the corresponding limit value.
Air Quality Sub-Index (I)Pollutant Project Concentration Limits
SO2SO2NO2NO2PM10COCOO3O3PM2.5
24 h Avg1 h Avg24 h Avg1 h Avg24 h Avg24 h Avg1 h Avg1 h Avg8 h Avg24 h Avg
05000000000
505015040100502516010035
1001505008020015041020016075
1504756501807002501435300215115
20080080028012003502460400265150
3001600 56523404203690800800250
4002100 7503090500481201000 350
5002620 9403840600601501200 500
Table 2. Average moving speed of air mass with eight clustering trajectories in winter in Jincheng (unit: m·s−1).
Trajectory Classification12345678
winter16.314.19.23.217.210.61.11.5
December 10.35.1 5.0
January13.2 2.7
February 14.5 4.62.1
Table 3. Statistics of days on eight trajectory clusters in Jincheng (unit: %).
Proportion of Air QualityTrajectory Classification
12345678
Excellent ratio (%)68.278.357.265.332.848.258.926.2
Pollution ratio (%)31.821.742.834.767.251.841.173.8
Remarks: The excellence ratio refers to the proportion of AQI less than 50 under each trajectory. The pollution ratio is the opposite.
Table 4. The proportion of trajectory clusters under different AQI levels (unit: %).
AQI GradeTrajectory Classification
12345678
Excellent8.0514.4519.4213.6719.5616.802.305.75
good6.6512.6415.599.5921.8623.708.061.92
Light5.462.056.6212.8930.7822.408.5211.27
Moderate2.314.604.7611.5222.1627.279.1817.23
Severe1.361.702.3712.8030.7421.3210.9818.80
Serious0.351.141.2511.2823.6123.1214.8324.42
Publisher’s Note: MDPI stays neutral with regard to jurisdictional claims in published maps and institutional affiliations.

