1. Introduction
According to recent scientific research on climate change, the social, economic and environmental consequences of climate change are evident in different ways for each country [
1]. Colombia, which is a tropical country, presents a particularly critical level of vulnerability. In [
2], the Global Climate Risk Index is presented, which is an indicator that establishes a ranking according to the fatalities, economic losses and slowdown in economic growth associated with the effects of climate change in each country. For the Latin American region, the countries with the highest risk are Bolivia, Peru and Colombia. In this ranking, Colombia ranks 28th globally among the countries with the worst consequences associated with climate change. On the other hand, Ref. [
3] shows the growing concern of the Colombian government regarding the effects of climate change in a multidimensional way in the territory, which has given rise to a regulatory and legislative framework for mitigation and adaptation to climate change. Among the main negative effects that have been identified are: increase in temperature, decrease in precipitation and extreme weather events that may cause consequences such as increased disaster risk, reduction in agricultural production and risk of energy supply. These last two are specifically critical for Colombia considering that agriculture is one of the main economic activities and the production of electricity in Colombia is based on hydraulic generation [
4], the latter being highly impacted by the El Niño phenomenon [
5].
Since 1990, governments in Colombia subject to public policy have implemented a series of measures that have guided the country’s energy management. In [
6], for example, strategies were proposed to: strengthen low carbon development at national and regional levels, reduce GHG (Greenhouse Gas) emissions, reduce deforestation and establish a disaster prevention plan. In addition to policy and regulatory measures, coverage and reliability criteria have influenced the way in which the Colombian electricity system is operated and managed. One way to evaluate the effects of different factors in a general way is through the use of indicators. For example, Ref. [
7] presents the climate change performance index, which monitors public policy efforts aimed at mitigating climate change for 60 countries and the European Union, which are responsible for about 92% of global emissions. This indicator includes issues such as: GHG emissions, renewable energy insertion, energy use and climate policy. In [
7] Colombia is placed in a global medium performance level in ranking 25. In detail, a high performance is observed in energy use, medium performance in GHG emissions and climate policy and a low performance in the insertion of renewable energies. The main aspects that stand out are the goal of contributing to a 51% reduction in GHG emissions by 2030 with respect to 2014; the need to increase the insertion of renewables taking into account the high potential available in wind and solar energy; the requirement of a plan to de-escalate the coal industry and the improvement in energy efficiency aspects in mobility and industry. In general, the challenges in public policy, management and operation of the power system in the country are evident.
A detailed report of GHG emissions in Colombia for the period 1990–2012 is presented in [
8], and the most recent report for the period 1990–2018 is shown in [
9]. According to [
9], in 2018, the energy sector contributed 31% of total GHG emissions, corresponding to 302,974 ktCO
2eq. In the period 1990 to 2018 the overall increase was 34.7%. Of the total GHG emissions, carbon dioxide CO
2 represents 72.4%. A detailed analysis of the energy and electricity sectors in Colombia is presented in [
10]. According to the International Energy Agency (IEA), in 2019, the Colombian power sector supplied 47% of electricity demand via hydraulic sources and 42% by fossil thermal sources (21% natural gas, 21% coal) 4% by bio-fuels, 6.6% by oil and its products and the remaining percentage by renewable energies (solar and wind).
It is evident that the energy policy in Colombia, especially the one related to the power sector, has gone through a transformation process. In this context, aspects such as: the growing risks associated with climate change, technological change in energy generation, reliability of energy supply, diversification of the energy mix and contributions to the reduction of CO2 emissions have been considered in this process. However, it is necessary to evaluate whether the energy policy is effectively contributing to produce energy with low CO2 emissions. This paper identifies the drivers of changes in the carbon intensity of the power sector in Colombia with their respective energy policy implications.
This paper is outlined as follows.
Section 2 presents the literature review.
Section 3 presents the methodology of the multi-temporal decomposition of the aggregate carbon intensity and the calculation of the contributions of identified drivers, together with a time series analysis of ACI.
Section 4 shows the results obtained for the ACI decomposition of the power sector over four-year periods from 1990 to 2020.
Section 5 presents the analysis, discussion and policy implications of the results obtained.
Section 6 presents the conclusions.
2. Literature Review
Considering the specific characteristics of Colombia, the vulnerability to climate change, the challenges in energy policy, the renewable potential and the operation of the electricity system with a high degree of diversification, this is a case of particular interest for analysis in the world. Different authors have used modeling, methodologies and strategies to analyze aspects related to the energy and power sector and their relationship with climate change.
Table 1 shows the review of papers recently reported specifically related to Colombia.
In [
13], a decomposition analysis of carbon dioxide emissions of the global energy sector, including significant sectors such as transportation, is performed. As a mathematical model, the Kaya identity is used, which includes a carbon intensity factor, energy intensity, GDP per capita and population. The latter is the main driver, followed by energy intensity and carbonization effect. In [
22], again, the emissions of the global energy sector are analyzed considering the total primary energy demanded by all sectors dependent or not on the power system. In this case, the decomposition considered drivers such as: carbonization, fossil fuel substitution, renewable energy penetration, energy intensity, wealth and population. These last two were the drivers identified as the most influential. In [
23], again, the decomposition analysis is used, but in this case, it is applied to energy demand including drivers such as population, sectoral growth and energy intensity, this being an economic analysis that does not include CO
2 emissions or carbon intensity.
2.1. LMDI Decomposition Methodologies for CO2 Emissions
One of the most widely used methods in energy analysis is the IDA-LMDI decomposition. The purpose of the method is to obtain the drivers that influence changes in a variable. The formulation of the technique can be found in [
26]. The analysis has been used at the level of regions and countries specifically. In [
27,
28] presents detailed literature reviews of this method. Different methodologies for the decomposition of CO
2 emissions or aggregate carbon intensity (ACI) have been reported in the literature. In general, two categories are identified.
2.1.1. Macroeconomic Based Contributions
This category of decomposition of CO2 emissions uses the Kaya identity for the identification of drivers. In the literature, it has been used to analyze the whole energy sector (total primary energy), the transport sector and the power sector. Variants of the Kaya identity have been reported. However, in most cases, macroeconomic drivers such as total gross domestic product GDP, GDP per capita and population are considered. Other drivers considered are: energy intensity, and emissions intensity.
2.1.2. Technical–Economic-Based Contributions
This category has been used to analyze the power sector specifically. This approach has been used to decompose CO2 emissions and aggregate carbon intensity (ACI). In this case, macroeconomic variables are not considered; economic drivers such as the carbon intensity effect and technical drivers such as thermal generation efficiency, fossil share of fossil fuel energy and fossil share to total electricity generated are mainly considered.
A difference between the macroeconomic and technical–economic methodologies is observed in [
29]. In this report, the International Energy Agency IEA uses the LMDI decomposition to analyze the energy sector (Macroeconomic) and the power sector (technical–economic). Appendix B of [
30] presents a detailed classification of the categories of decomposition reported according to the sector of analysis.
Table 2 presents recent contributions of decomposition analysis. The classification includes the temporal analysis, the application sector, the variable to be decomposed and the methodological approach.
According to
Table 1, the case of Colombia has been of interest. Different techniques and methodologies have been used to analyze aspects such as the effects of climate change on hydro generation, CO
2 emissions, energy end use and the insertion of renewable energies.
Table 2 shows a specific bibliographic review of the use of the IDA-LMDI decomposition technique used for the analysis of particular countries. In the case of temporal analysis, three categories were identified. The Multitemporal analysis (M.P) is characterized by having more than one period of analysis, which allows detailed and disaggregated identification of the drivers of influence depending on the number of periods selected. In the single period analysis (S.P), only a start and end year are considered; this analysis provides results that are easy to interpret and at a disaggregated level; however, over long periods of time, information and identification of inter-annual trends are lost. In the case of the year-to-year (YoY) analysis, this is highly detailed, but due to the volume of information obtained, it is usually limited to applications with aggregate variables.
Table 2 shows that YoY analysis is the most frequent. In the case of the application sector, it is observed that the most common is an analysis of the overall energy sector (E.S), followed by the power sector (P.S), and with some cases focused on the transportation sector (T.S). On the other hand, it is evident that the decomposition variable in most cases is carbon emissions (C.E), and only in a few cases have carbon intensity (C.I) analyses been reported. Regarding the methodologies used, it is observed that macroeconomic analysis is used for the cases of the whole energy sector, the transport sector and demand. In the case of the power sector, macroeconomic and technical–economic analyses have been reported in a balanced way. However, for the specific case of the carbon intensity of the power sector, a technical–economic approach has been used.
The study of Colombia is of great interest, since this is a country that combines critical aspects such as high vulnerability to climate change, high generation potentials with renewable energies, an electric energy matrix diversified in fossil and renewable energies and high variability without trend in the behavior of the carbon intensity of the power sector. This last aspect will be shown specifically below. For these reasons, it is necessary to analyze the carbon intensity of the power sector at a high level of detail and with a multi-temporal approach due to its high variability.
According to the literature review, it is evident that there have been no reports of a study with the multitemporal IDA-LMDI decomposition technique specifically focused on the power sector in Colombia and with a technical–economic approach from the carbon intensity. To fill this research gap, this paper performs the multitemporal IDA-LMDI decomposition analysis on the aggregate carbon intensity (ACI) of the power sector, analyzing the eight presidential periods from 1990 to 2020.
3. Methodology
3.1. Multi-Temporal LMDI Decomposition Analysis of ACI
In the case of Colombia, an analysis is made only of the power sector from the technical–economic approach of carbon intensity, without considering the disaggregation of demand sectors with an impact on macroeconomic indicators. For this reason, a decomposition of the aggregated carbon intensity ACI is considered (technical–economic). In this paper, we apply a methodology based on Ang’s proposal in [
55,
56], adding a multi-temporal approach to find the drivers that explain the changes in the aggregate carbon intensity (ACI) of the Colombian power sector in the period 1990–2020. Equation (
1) shows the aggregate carbon intensity (ACI) of the power sector as a function of five variables disaggregated into fossil fuel types.
where:
f is the size of the dataset and the number of fossil fuels under analysis.
i denoted the fossil fuel type. Three fuels are considered (f): coal (i = 1), natural gas (i = 2) and liquid fuels from oil products (i = 3).
C is the total power-related CO2 emissions from all fossil fuels in the country [ktCO2].
G is the total energy production in country (fossil + renewable). [TWh].
is the total power-related CO2 emissions from fossil fuel i in the country [ktCO2].
is the energy input from fossil fuel i in the country [TWh].
is the energy output from fossil fuel i in the country [TWh].
E is the total energy output from fossil all fuel in the country [TWh]
The drivers considered in the decomposition of Equation (
1) are defined as follows:
is the carbon intensity associated with fuel i in the country.
is the efficiency of thermal power generation (heat rate) associated with fuel i in the country.
is the share of all fossil fuel i in the fossil energy production in the country.
is the share of fossil fuel in the total energy production in the country.
is the intensity factors .
S is the structural factor .
The changes in aggregate carbon intensity ACI associated with each of the drivers considered in an analysis period are related by Equation (
2).
where:
= is the initial time in the analysis period [year].
= is the final time in the analysis period [year].
The calculation of the contributions of each driver to the change in ACI in the analysis period is obtained with Equations (
3)–(
6).
The operator
L calculated for the ACI values obtained in the periods considered for the analysis is calculated by using Equation (
7).
Equations (
1)–(
7) show the single period methodology. This methodology is suitable for variables with smooth behavior and defined trends. This type of analysis is not suitable for a time series with high variability and no clear trend. In this case, it is necessary to perform a multi-temporal analysis that captures inter-annual changes in the analysis period. For this, it is necessary to define sub-periods of time and run the single period methodology in each sub-period and perform the respective analysis.
3.2. Selection of Analysis Sub-Periods
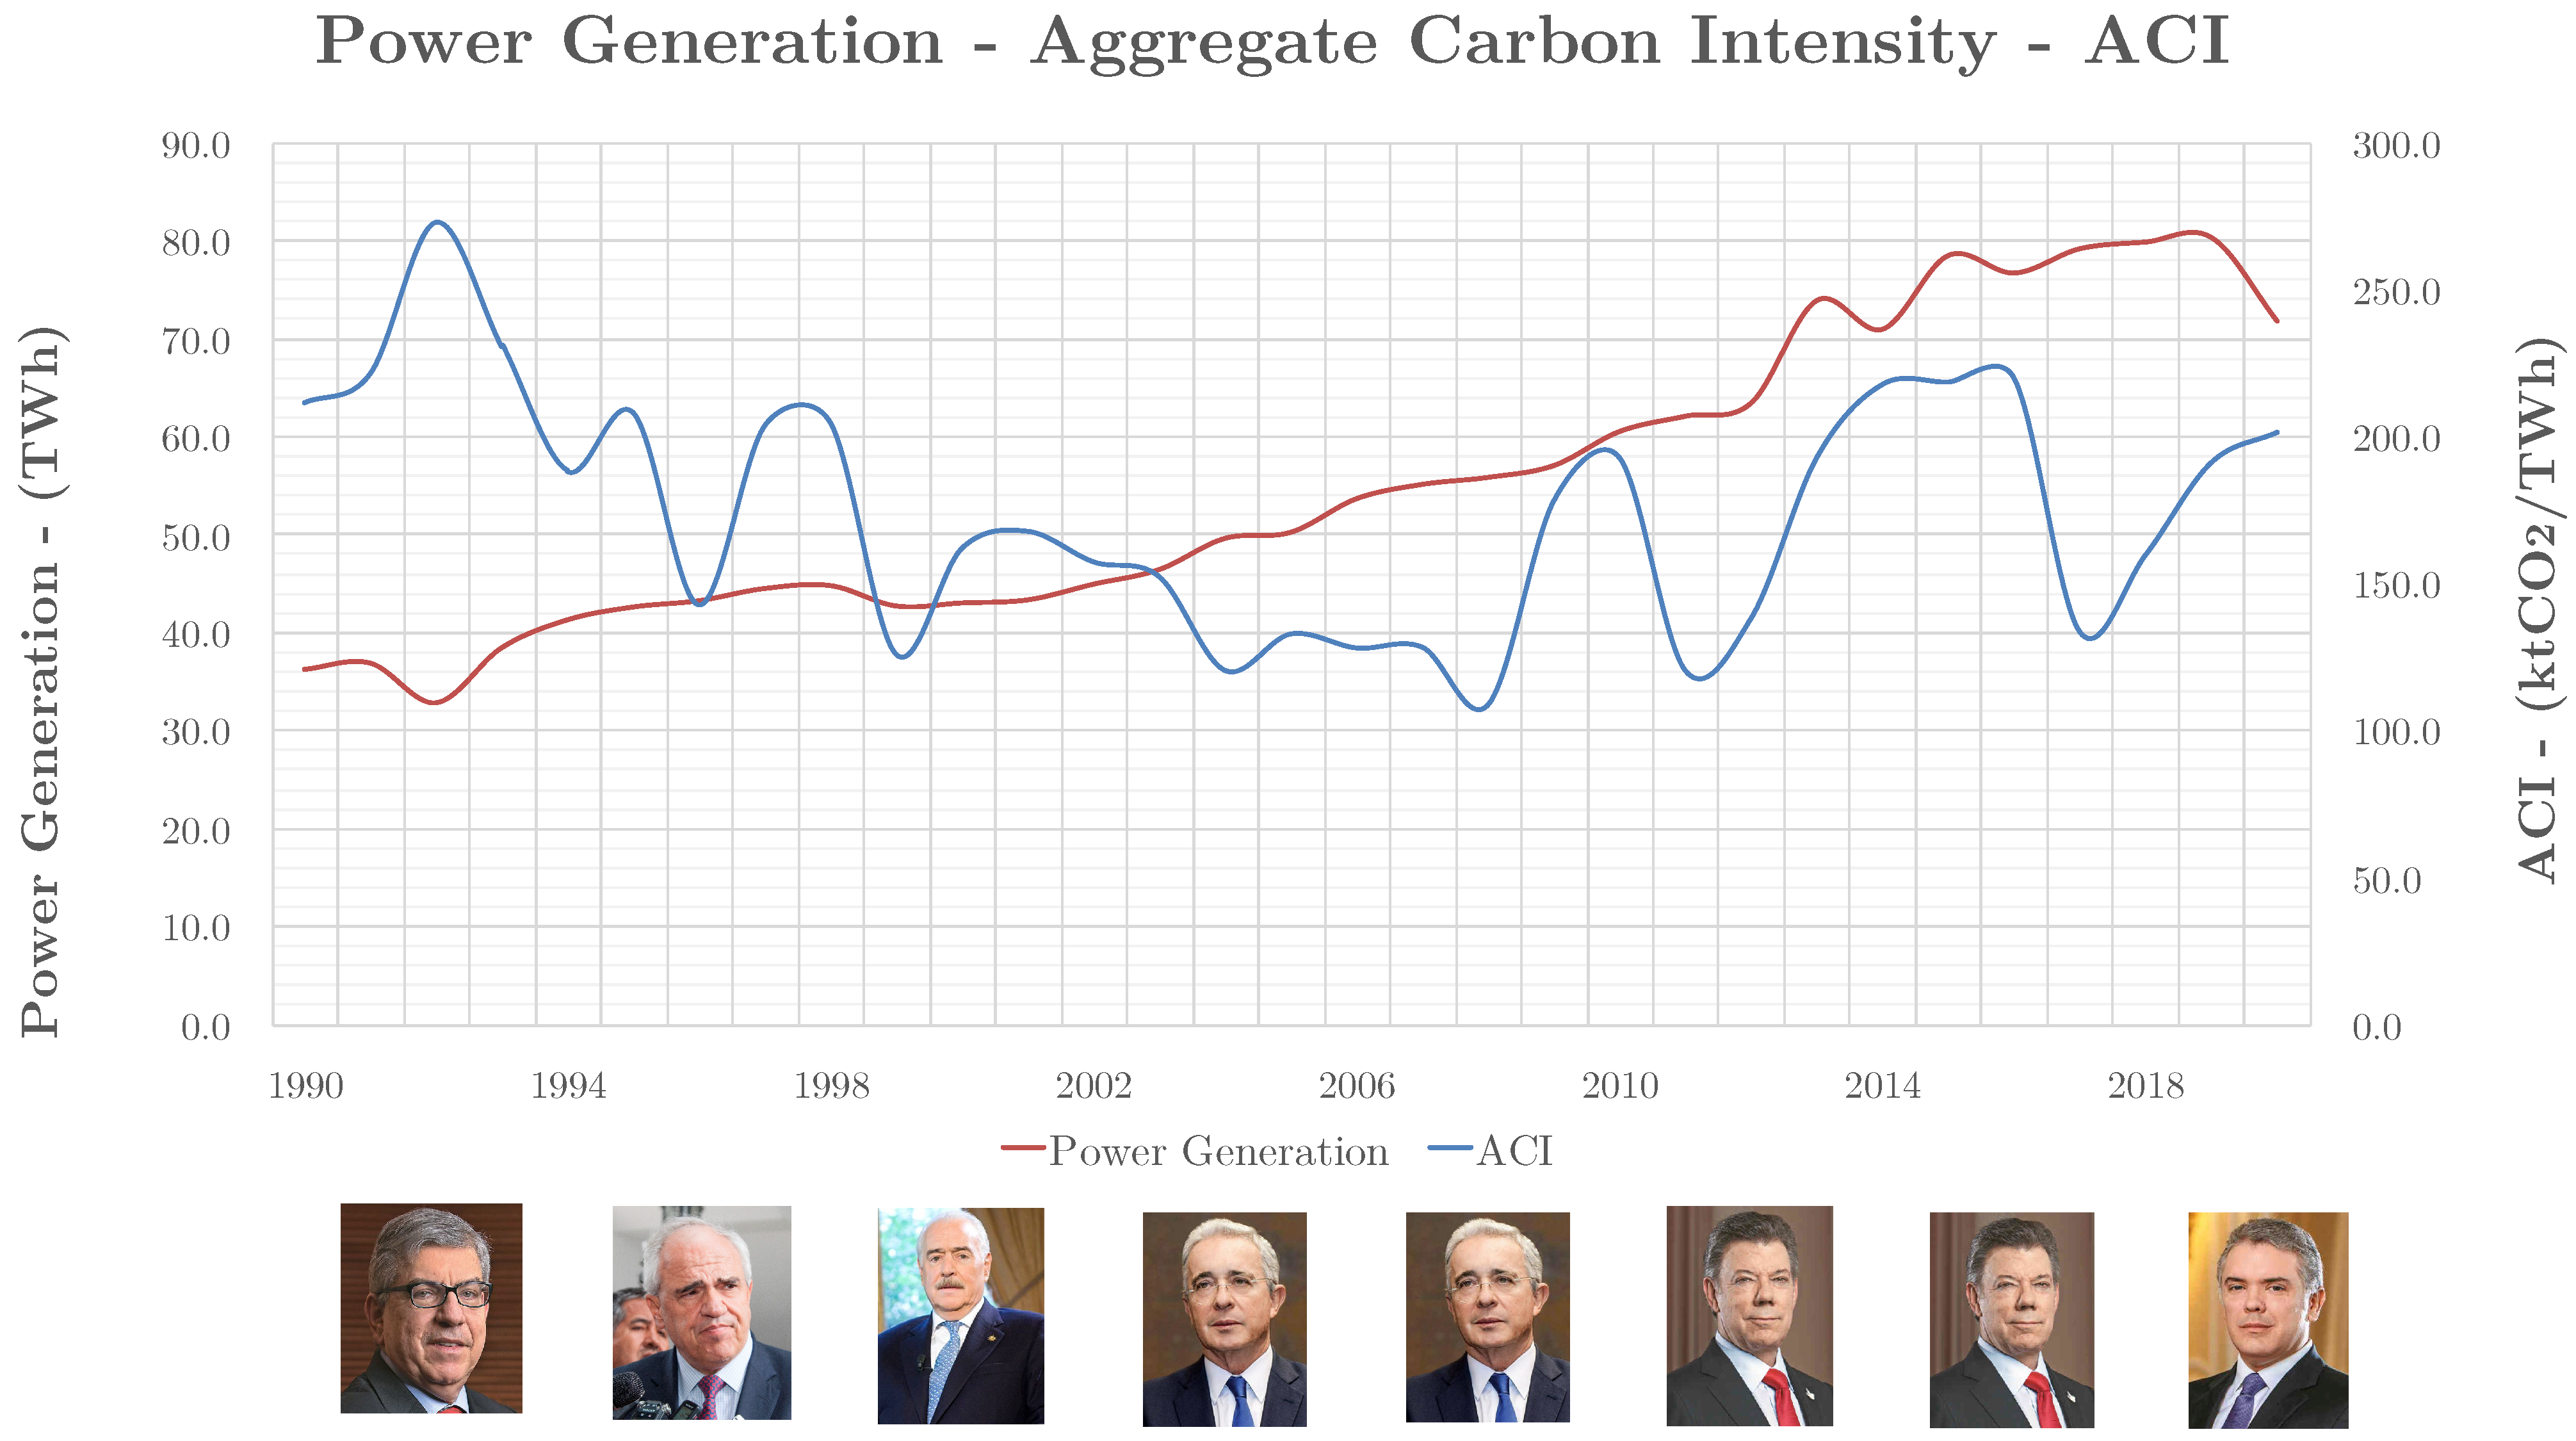
Figure 1 shows the temporal behavior of the carbon intensity variable and electric power generation during the analysis period.
Figure 1 shows the erratic behavior and no clear trend in the carbon intensity of the Colombian power sector. On the other hand, total energy generation shows a clear trend of sustained growth. The generation of electric energy increased from between 30 and 40 TWh at the beginning of the 1990s and almost doubled by the end of the analysis period. Aggregate ACI carbon intensity has behavior not directly related to generation. Due to the behavior shown by the ACI, it is necessary to implement a multi-temporal LMDI decomposition methodology to identify the drivers that influence the changes. A single period analysis would lead to a loss of inter-annual information and inaccurate identification of the drivers, influencing the change in ACI. For the selection of the decomposition evaluation periods, the four-year periods corresponding to the presidential administrations in the period 1990–2020 were taken, specified as follows:
1990–1994. Cesar Gaviria, reduction in ACI from 211.79 to 188.37 ktCO2/TWh.
1994–1998. Ernesto Samper, increase in ACI from 188.37 to 204.91 ktCO2/TWh.
1998–2002. Andrés Pastrana, reduction in ACI from 204.91 to 157.61 ktCO2/TWh.
2002–2006. Álvaro Uribe 1, reduction in ACI from 157.61 to 128.32 ktCO2/TWh.
2006–2010. Álvaro Uribe 2, increase in ACI from 128.32 to 192.98 ktCO2/TWh.
2010–2014. Juan M. Santos 1, increase in ACI from 192.98 to 218.09 ktCO2/TWh.
2014–2018. Juan M. Santos 2, reduction in ACI from 218.09 to 160.07 ktCO2/TWh.
2018–2020. Iván Duque, increase in ACI from 160.07 to 201.74 ktCO2/TWh.
3.3. Data Source and Assumptions
This study is limited to the decomposition analysis of the carbon intensity of the power sector in Colombia for the period 1990–2020. This study seeks to determine the drivers of carbonization, power generation efficiency, fossil energy mix and total energy mix. In addition, the respective policy, operational and management implications of the Colombian power sector are considered. The analysis does not include macroeconomic analysis or analysis of energy demand and end-use sectors. The source data for the analysis related to: CO
2 emissions, total and fossil fuel energy generated and primary energy input to generation plants are available at:
https://www.iea.org/data-and-statistics?type=statistics#data-tool-types, Data retrieved on 31 July 2022. In the Data–Statistics section, IEA have provided the Energy Statistics Data Browser module. In this module, in the Browse as chart section, the data on total CO
2 emissions and by source of the electricity sector can be found, as well as the data on electricity supply of the generation plants. The Browse as table section contains the total electricity production and the primary energy supply of the generation plants. With this available data, the time series of the variables of interest were constructed. With this available data, the time series of the variables of interest were constructed. The database is composed of time series with 31 annual data for the period 1990–2020 for the following variables: CO
2 emissions from electricity by source MtCO
2; total energy production GWh, electricity generated by source GWh and input to electricity plants by source Ktoe.
5. Discussion and Policy Implications
The analysis and discussion of the results for each period along with the policy implications are presented below:
5.1. 1990–1994—Cesar Gaviria Administration
This period presented an increase in demand from 36.4 TWh to 41.4 TWh, and a reduction in ACI from 211.79 ktCO2/TWh to 188.37 ktCO2/TWh. According to the results, this reduction was mainly driven by the Fossil Share of total energy produced (−18.67 ktCO2/TWh), the carbon intensity and the Fossil Share of fossil fuels and a slight increase in the Heat Rate (the efficiency of thermal power generation) of coal. From the analysis of fossil fuels, it is observed that the improvement associated with carbon intensity is mainly associated with coal (−3.704 ktCO2/TWh), but at the same time, there is an increase in the ACI associated with the Heat Rate of coal (1.133 ktCO2/TWh). In the Fossil Share of total energy, the coal share driver again contributes to the reduction in the ACI. In this period, there was a net drop in the ACI considering the major share of hydroelectric generation in energy production. In addition, in 1992, Colombia faced a major energy crisis caused by the deficient hydrological behavior triggered by the El Niño phenomenon of 1992. This caused severe energy rationing that reached 26% and a drop in demand of 9.3% with respect to 1991. As a consequence, there was a loss of confidence in the operation of the system. As a result, Laws 142 and 143 of 1994 were created, which respectively regulate public services, including electricity, and give rise to the creation of the electricity sector with its different sectors and organizations. This new energy policy paradigm prioritizes the reliability of the electric system and quality of service, which will have important effects in the following years.
5.2. 1994–1998—Ernesto Samper Administration
The increase in generation is maintained, reaching 44.9 TWh in 1998, and a net increase in ACI of 16.55 ktCO2/TWh. With a significant increase in the Fossil Share of total energy (66.3 ktCO2/TWh) and a significant reduction in the associated Fossil Share of fossil fuels (−37.7 ktCO2/TWh). According to the results the reduction in ACI is mainly associated to coal in fossil and the increase in ACI is associated to coal and natural gas with respect to the total electrical energy generated. This period shows the consequences of the new paradigm of energy policy focused on reliability. It is observed that most of the reliability support is due to the use of fuels such as coal and natural gas in the fossil share of total electricity production. However, a compensation is evidenced in the diversification of these fuels where natural gas generates a positive effect of reduction in the ACI. In addition, there is a significant contribution in thermal generation efficiency, probably associated with new thermal plants. Other political aspects highlighted in this period are the expansion and decentralization of energy generation and distribution. Private capital, the strengthening of a competitive market (CREG 199—1997) and the diversification of the electricity generation mix led to new regulations such as CREG Resolution 025 of 1995, which establishes the criteria for the planning and economic dispatch of the electricity system. Another important effect contributing to the increase of the ACI is the restructuring of the electrification of the Atlantic coast, which is mainly based on thermal generation.
5.3. 1998–2002—Andres Pastrana Administration
In this period, there is a very slight increase in electricity generation from 44.9 TWh to 45.05 TWh, with a significant net reduction in the ACI of −47.3 ktCO2/TWh. This reduction has a component associated with the Fossil Share of total electricity generation (−45.57 ktCO2/TWh), distributed in contributions from coal and natural gas with −18.21 ktCO2/TWh and −26.55 ktCO2/TWh, respectively. The results show the significant effects associated with the decarbonization of the energy mix in this period. The competitive market, expansion and economic dispatch policies of the previous period show effects during this period. The increase in installed hydraulic capacity and the management of the dispatch of thermal and hydraulic resources allow the reduction in the ACI. During this period, the energy policy emphasizes aspects such as the energization of non-interconnected areas, sustainability and environmental management. CREG Resolutions 026 and 054 of 2001 establish regulations to strengthen the wholesale electricity market. These transformations and new guidelines would present positive aspects in the following years.
5.4. 2002–2006—Álvaro Uribe Vélez Administration 1
The increase in electricity generation is kept going from 45.05 to 53.8 TWh, increasing by almost 10 TWh. However, the ACI carbon intensity maintains its reduction trend, in this case of −29.29 ktCO2/TWh. Again, we examine the Fossil Share contributions of total energy, with moderate benefits associated with carbon intensity and Heat Rate. According to the results, coal achieves improvements of −3.06 ktCO2/TWh and −5.72 ktCO2/TWh in carbon intensity and Heat Rate, respectively. In the case of the three fossil fuels, a reduction in the ACI associated with the carbon intensity effect is observed. In the case of generation efficiency, coal and natural gas show contributions to the reduction in the ACI. This improvement in transformation efficiency is the reflection of an energy policy of regulation in the transformation of primary energy sources. In this period, new elements begin to take part in energy regulation: the National Hydrocarbons Agency is created; electric grids and rural electrification are regularized; the commercial production of bio-diesel is promoted (Law 939 of 2004). It is observed that aspects such as the production of quality fuels, the diversification of liquid fuels and the efficiency in the transformation of these fuels can generate a reduction in the ACI, which are policies that should be strengthened.
5.5. 2006–2010—Álvaro Uribe Vélez Administration 2
Energy generation reached levels of 60.6 TWh in 2010. The trend of reduction in the ACI is reversed, and there is an increase of 64.66 ktCO2/TWh, with an increase of 64.14 ktCO2/TWh in the Fossil Share driver of the total electric energy produced. This increase is mainly due to the use of coal (27.78 ktCO2/TWh) and natural gas (32.881 ktCO2/TWh) with respect to total generation and an increase in the use of oil products (17.992 ktCO2/TWh) with respect to the use of fossil fuels. In this period, there is a clear disconnect between recent advances in energy policy and the operation and management of the electricity system in Colombia. It is evident that the increase in the ACI is clearly due to the use of fossil fuels, mainly coal and natural gas. No critical hydrological phenomena were experienced during this period, so the drastic increase in the ACI is not justified. Despite the performance of the system, for the first time, aspects such as the use of non-conventional renewable energy sources appear in the political panorama in the 2007 National Energy Plan. Resolution 18-1495 of 2009 refers to the maximization of hydrocarbon recovery, and Resolution 18-0919 of 2010 presents the indicative plan for efficient and rational use of energy.
5.6. 2010–2014—Juan Manuel Santos Administration 1
In this four-year period, the demand for electric energy increases by almost 10 TWh, and there is an increase in the ACI, but at a lower level with respect to the previous period, which is 25.11 ktCO2/TWh. It is again observed that the Fossil Share of total electric energy is one of the main drivers (9.18 ktCO2/TWh). However, a loss is evidenced in the Heat Rate (13.05 ktCO2/TWh) mainly associated with natural gas (16.08 ktCO2/TWh), which evidences a backward movement associated with the efficiency of transformation of primary energy into electricity. Despite the results, the energy regulation advances in issuance of the electricity coverage expansion plans (2012) and the generation and transmission expansion plan (2012, 2013) by the Ministry of Mines and Energy. Law 1715 (2014) is also issued, which seeks to promote the integration of non-conventional energy resources and energy efficiency, including renewable energies. On the other hand, through regulation, it also seeks to incentivize mechanisms such as demand response (Decree 2492—2014). This is a period in which the energy policy in the country is strengthened, with the main interest of decarbonizing the power sector. For example, the 2013 generation and transmission expansion plan projected for 15 years establishes an increase in installed capacity by 2028 in wind, geothermal and cogeneration technologies.
5.7. 2014–2018—Juan Manuel Santos Administration 2
In this period, power generation increases to about 80 TWh and the largest change in ACI is obtained corresponding to −58.02 ktCO2/TWh. This change is again driven by Fossil Share of total electricity generation (−52.55 ktCO2/TWh) and Heat Rate (−7.66 ktCO2/TWh). In the case of Fossil Share, the reductions are associated with coal (−18.9 ktCO2/TWh) and natural gas (−25.57 ktCO2/TWh). In the case of Heat Rate, it is observed that it is associated with coal (−6.18 ktCO2/TWh). In this period, the effectiveness in the medium term of the policies promoted in the previous period is evident, since the improvements are in the decarbonization of the energy mix and the improvement in energy efficiency. In this period, in relation to energy policy, the following factors stand out: expansion plans in generation and transmission in 2015, 2016 and 2017; the PROURE program (2016) for efficient and rational use of energy is established; the national energy plan for 2050 is defined (2016) and progress is made in the regulation of self-generation and small-scale distributed generation (CREG 030-2018), seeking to increase the integration of renewable energies in the country. In this period, the effectiveness of the implementation of policies focused on decarbonization is again observed, and a clear panorama of growth in energy policy can be observed. Since 2012, generation and transmission expansion plans have been updated annually. In the case of the 2017 plan for the period 2016–2030, the diversification of the energy mix is considered, including significant contributions from hydro, wind, geothermal, biomass and solar photovoltaic sources. On the other hand, the indicative plan for expansion and coverage of electric energy (2017) includes hybrid solutions for non-interconnected areas such as solar–diesel and wind–diesel. In addition, in Law 1844 of 2017, Colombia ratifies the sign of the commitments assumed in the Paris agreement (COP21). In this period, the results are positive both in power sector management and energy policy.
5.8. 2018–2020—Iván Duque Administration
This is a partial period of analysis. In this period, the growth of energy demand slows down from 79.9 TWh to 71.8 TWh with a significant increase in the ACI of 41.66 ktCO2/TWh. This increase is mostly associated with the Fossil Share of total power generation (41.66 ktCO2/TWh). This increase is largely associated with the use of coal (19.87 ktCO2/TWh) and natural gas (15.45 ktCO2/TWh). However, there is also a significant increase in the ACI associated with the coal Heat Rate (42.77 ktCO2/TWh). In this period, great difficulties are evidenced, since despite having a significant reduction in energy demand, the operation and management of the energy sector lead to a significant increase in emissions in the power sector and a strong backward movement in the decarbonization of the country’s energy matrix. At the end of this period, the global pandemic of COVID-19 began; as a response in energy policy, Decree 637 of 2020 was issued, reducing restrictions on the use of fuels such as natural gas and oil, which boosts the increase in the fossil share of these energy sources and therefore causes an increase in the ACI. Despite the performance shown, regulations such as decree 829 and the 2020 post-COVID recovery plan seek to incentivize and generate investment in non-conventional technologies such as wind, geothermal and photovoltaic generation.
The analysis allowed identification of the drivers that influence changes in the carbon intensity of the power sector in particular. Compared to other publications on Colombia, this analysis focused particularly on the power sector and with a technical–economic approach and with a multitemporal decomposition. In [
22], the decomposition analysis applied to Colombia is reported, but in the whole energy sector and with a macroeconomic analysis approach using drivers such as energy intensity, GDP per capita and population in the Kaya identity. The conclusions obtained are macroeconomic, where population and per capita income were identified as the drivers that mainly drive the change in total CO
2 emissions. In this study, it is not possible to identify characteristics of the operation and management of the electricity system. For the authors, the power sector’s own consumption is immersed in the analysis, but its drivers cannot be clearly identified. In [
13], the CO
2 emissions of the entire energy sector are again analyzed by adding a sectoral analysis of the final use of energy. Again, the analysis is of a macroeconomic type, and it concludes that the population is the main driver of the changes in emissions. Again, the analysis includes the energy demand of the power sector, but implicitly. The conclusions of these two papers are useful for decision makers in the national energy sector. The analysis reported in this paper focuses on the particular power sector, so that the identified drivers are of interest to operators, regulators and decision makers in the power sector. Unlike the other papers reported, this one considers carbon intensity and not total emissions. This allows a clearer visualization of how power management contributes to CO
2 emissions from the drivers analyzed. The identification of carbon intensity and generation efficiency effects is important for plant operators, and allows us to identify the use of investment to effectively contribute to the decarbonization of the power generation system. These analyses could not be obtained from the results of previous work. Finally, the multi-temporal approach made it possible to evaluate the effects and performance of the energy policy decisions implemented by each presidential administration. For these reasons, the study conducted is of high value for all actors interested in the energy transition, particularly in the power sector.
6. Conclusions
The LMDI decomposition analysis performed allowed us to perform detailed identification of the drivers that influence changes in the aggregate carbon intensity ACI in the period 1990–2020 in Colombia. The driver with the greatest impact was identified as the fossil share of total energy, since this was the factor that contributed most to the changes in the ACI. In addition, it was shown that this driver always maintained the same trend of change together with the aggregate carbon intensity in all the analysis periods considered.
The fossil fuel mix was key in the reduction in the ACI in the 1994–1998 period; however, it contributed significantly to the increase in the ACI in the last period of analysis (2018–2020). Generation efficiency has contributed positively in most cases, with the exception of the 2010–2014 period. For its part, the carbon intensity of fuels showed very small contributions in most cases, with the exception of the 2018–2020 period, in which it showed a valuable contribution to the reduction in the ACI. In the analysis of primary energies for electricity generation, the high impact of natural gas and coal in the fossil share of total energy was verified. In general, the highly variable trend of drivers and ACI shows that there are no operating regulations and policies oriented to contribute in a sustained way to the reduction in ACI, which is critical in a country with a high potential for renewable generation.
From the energy policy point of view, the decomposition analysis showed little effectiveness in the long term of the implementation of energy regulation and policies. This is observed in the temporal behavior of the ACI and the identified drivers. Changes in presidential administrations bring with them changes in energy policy that are inadequate. It is observed that each administration brings a new vision, but it seems that the progress made by the previous administration is not considered. This avoids the fact that effective results can be obtained in the medium and long term. This makes the energy policy framework short term, at least for the power sector. It is recommended that the performance of the power sector drivers be monitored; this will allow for effective and sustained reduction in the carbon intensity of the power sector. It is noted that the energy mix is the driver that mainly drives the ACI carbon intensity, either to increase or decrease. However, that energy mix should not only be based on thermal resources and hydro generation. While recent expansion plans consider diversification into non-conventional sources, including renewables, the inclusion of wind, solar, biomass, geothermal and cogeneration technologies needs to be accelerated and monitored over the next 20 years. Aspects such as thermal generation efficiency (heat rate) and the carbon intensity effect of each fuel have been shown to contribute, in some periods, to the reduction in the ACI. For this reason, long-term policies must be formulated to ensure the sustained contribution of these drivers to the reduction in the ACI. An updated and permanent information system on the drivers will facilitate decision making to accelerate the energy transition process and ensure the effectiveness of policies and regulations formulated for the power sector.

 ,
, 


