Abstract
Shared manufacturing provides a new development direction for the transformation and upgrading of the manufacturing industry. This paper took a manufacturing company that masters core technology and has strong knowledge creation and spillover capabilities as the core manufacturing company. The core manufacturing company led two resource-complementary manufacturing companies in participating in shared manufacturing, and the additional benefits of each company participating in shared manufacturing were realized. Due to the bounded rational behavior of the participating companies and the difficulty in maximizing each’s own interests, this paper used the evolutionary game method and MATLAB to analyze the influencing factors of shared manufacturing among manufacturing companies. The goal of this study is to understand the decision-making behavior of manufacturing companies in a shared manufacturing context. The research results show that: The initial willingness to share, default losses, and excess income realized by the core manufacturing company as a result of delivering high service levels all contributed to the companies’ willingness to engage in shared production. The companies’ ability to participate in shared manufacturing was negatively impacted by cost-to-income ratio and speculative income. The allocation of additional income had a significant influence on the non-core enterprises’ decision-making: when the distribution ratio of additional income from non-core companies was low, non-core companies would be less willing to share. Although the additional income distribution ratio of core companies were high at the time, the service level of core companies would also decrease due to the reduction of non-core companies’ willingness to share.
1. Introduction
Shared manufacturing is an innovation in the application of the sharing economy in the field of production and manufacturing. China’s manufacturing sector has faced new problems and development prospects as a result of the sharing economy, and shared manufacturing has offered a fresh approach to the modernization and transformation of the sector. Based on cloud computing and the industrial internet, the right to utilize idle manufacturing resources and capabilities in order to realize the successful integration and application of idle production capacity is shared. The size of China’s manufacturing capacity-sharing market exceeded 3.6 trillion yuan in 2021, and shared manufacturing is crucial to the country’s economic growth, according to a report by the National Information Center’s Sharing Economic Research Center.
Shared manufacturing is a new sustainable mode of social manufacturing based on the principles of a sharing economy. The concept of “shared manufacturing” was first proposed by Ellen [1] in 1990. Since the emergence of shared manufacturing, it has received extensive attention. He et al. [2] analyzed the differences between traditional shared manufacturing and modern shared manufacturing, as well as the advantages and disadvantages of Chinese shared manufacturing compared with foreign shared manufacturing. Jiang and Li [3] addressed a new shared factory model and provided theoretical architecture and some actual cases for manufacturing sharing. Yu et al. [4] proposed a dynamic shared manufacturing service scheduling method in support of complex network analysis technologies. Some scholars have also studied shared manufacturing combined with other technologies, such as blockchain-based shared manufacturing [5], a scalable framework for blockchain-based shared manufacturing [6], and enhanced agents in shared factories [7]. Xu et al. [8] investigated an online scheduling problem where one manufacturer owning two parallel identical machines may lease a number of external machines to satisfy its jobs via a manufacturing resource-sharing platform. Li et al. [9] discussed the optimal conditions for choosing different business models by comparing maximizing self-revenues and maximizing social welfare in the context of shared manufacturing. Wang et al. [10] presented a scalable framework for blockchain-based shared manufacturing that preserves the transparency and immutability characteristics of transaction records, which is critical to building trust between entities in blockchain-based systems. Yan et al. [11] analyzed real cases of shared manufacturing and summarized the typical characteristics and classifications from the perspective of a sharing economy and platform operation. Zhang et al. [12] analyzed the evolutionary game of shared manufacturing quality innovation’s synergetic behavior considering a subject’s heterogeneous emotions. Zhang et al. [13] constructed a co-evolutionary game model of shared manufacturing-quality synergistic improvement under the dynamic reward and punishment mechanism. Zhang et al. [14] proposed a hybrid sensing-based approach to perform the monitoring and maintenance of shared manufacturing resources. Ji et al. [15] developed a fully polynomial-time approximation scheme to solve the problem when the number of machines is fixed. Wei and Wu [16] studied two two-machine hybrid flow-shop problems with fixed processing sequences. Chen and Tang [17] constructed a high-quality development efficiency index system of shared manufacturing companies in China. Richard et al. [18] described a model for aiding a large enterprise in decisions regarding the consolidation and reconfiguration of its facilities to shared manufacturing facilities. Lujak et al. [19] proposed a computationally efficient decentralized approach to solving multi-robot production planning in open shared factories. Manufacturing companies participate in shared manufacturing in an environment where idle manufacturing capacity is shared and companies are willing to achieve long-term sharing. As a result, these companies frequently have an impact on the shared manufacturing decision-making of other companies and are unable to maximize their own interests, which is consistent with evolutionary game’s “bounded rationality” hypothesis. In order to investigate the evolution of manufacturing companies’ decision-making in shared manufacturing and realize the sustainable development of shared manufacturing, this research uses the evolutionary game method. It also examines the impact of various elements on the equilibrium strategy under various conditions.
The evolutionary game itself is a continuous feedback activity in a dynamic system that exhibits mutual constraint, mutual dependency, win–win situations, and reciprocal income among game participants. To evaluate the issues with evolutionary games in their profession, some academics have employed the evolutionary game. Ji et al. [20] proposed a new game model that intensively studies trade behavior, which can be realized as strategies and payoff functions of suppliers and manufacturers. Luo et al. [21] established an unsymmetrical evolutionary game model between manufacturing enterprises, producer service providers, and customers. Wu et al. [22,23] constructed a tripartite evolutionary game model of government, industry, and university to analyze the strategic choices of the tripartite government, industry, university, and provide theoretical guidance for tripartite collaboration. Zhu and Rong [24] constructed a three-party evolutionary game model among drug manufacturers, third-party drug testing institutions and government regulatory agencies to discuss the influence relationship between various elements of drug safety and quality supervision. Cui [25] analyzed tripartite main bodies under the background of cooperative governance by constructing an evolutionary game model involving enterprise, public and regulatory bodies. Wang [26] constructed an evolutionary game to solve the problem of urban parking difficulty and provided feasible suggestions for government, enterprise, and parking-space owners through numerical simulation analysis. Wang et al. [27] developed an evolutionary game model from the population’s perspective to observe the allocation tendency of different manufacturing services. Manufacturing service allocation with evolutionary game theory can provide fairness among users. Qi et al. [28] constructed the evolutionary game model of manufacturing resource-sharing to reveal the behaviors between two types of enterprise and analyzed the equilibrium in model and local stability in the state of uniform mixed and non-uniform mixed populations. Hao and Zhao [29] established an evolutionary game model composed of three game players of “capacity sharing platforms-enterprises with manufacturing capacity-enterprises demanding manufacturing Capacity” based on the assumptions of the network externality of capacity sharing platforms and presented the economic and management significance of evolutionary stability strategy. Based on the construction of the income function of manufacturing enterprises and service providers, Feng and Ma [30] established a two-party asymmetric evolution game model, exploring the rules of manufacturing enterprises and service providers to implement servitization. Zhao and Meng [31] used evolutionary game theory to study the decisions between original product manufacturers and third-party remanufacturers, and analyzed the influence of remanufacturing license fees on the system’s evolutionary equilibrium strategies. Bo et al. [32] built an evolutionary game model for platforms, demanders and suppliers. It drew the progressive path of the model, and combined with the maturity evaluation method, the governmental incentive mechanism was optimized. Zhu et al. [33] built a game model for the transaction strategy of the supplier and the demander by executing the platform’s smart contract to further guarantee the platform’s transaction reliability. Hosseini-Motlagh et al. [34] proposed an evolutionary game theory-based model to investigate how long-term behaviors of the members in supply chain systems would affect coordination decisions and their share of coordination profit surplus. Biancardi et al. [35] studied how to counter the illegal exploitation of common groundwater resources using an evolutionary game approach. The numerous academics mentioned above have confirmed the veracity of evolutionary games in various scientific domains.
This paper carried out the following three tasks listed below:
First, there are currently only a handful of studies on resource-sharing in the field of shared manufacturing that are based on evolutionary games, and the majority of the studies are predicated on the assumption that the sharing parties are wholly rational when, in reality, the participating sharers modify their own strategies and exhibit “bounded rational” behaviors. As a result, this work employed the evolutionary game method to investigate the influence trend of manufacturing businesses’ sharing strategies.
Second, very few studies have looked into establishing a deposit, sometimes known as liquidated damages, to lessen manufacturing companies’ losses when other shared manufacturing companies stop sharing. In order to build an evolutionary game model, the factors mentioned above were taken into account in this work.
Third, while some researchers have thought about creating a shared manufacturing platform and a three-way evolutionary game between the supply and demand sides, no one has thought about core companies taking part in shared manufacturing and acting as a shared manufacturing platform. The core company serves as a shared platform that connects manufacturing companies to participate in shared manufacturing, in addition to being manufacturing companies that can participate in shared manufacturing. The core company’s shared manufacturing platform is superior to other shared manufacturing platforms in terms of professionalism and depth of manufacturing knowledge.
This paper takes manufacturing company that masters core technology and has strong knowledge creation and spillover capabilities as the core manufacturing company. Through the core manufacturing company leading two resource-complementary manufacturing companies to participate in the shared manufacturing, the additional benefits of each company participating in the shared manufacturing can be realized. Due to the influence of factors such as environment and educational level, the behaviors of companies participating in shared manufacturing often have bounded rationality, which makes it difficult to achieve the goal of maximizing their own interests in the process of shared manufacturing. Therefore, this paper uses the method of evolutionary game to study the influence of factors such as default loss and speculative cost on the willingness of manufacturing companies to participate in shared manufacturing. It provides new ideas for the shared manufacturing of manufacturing companies under the leadership of core manufacturing company.
The rest of this article is organized as follows. Section 2 introduces the problem formulation and model construction. We examine the evolutionary stable strategy in Section 3. The simulation analysis of numerical example is given in Section 4. Section 5 includes the conclusions and managerial implications.
2. Evolutionary Game Model Construction
2.1. Model Description and Assumptions
The worldwide upgrading and transformation of China’s manufacturing sector now have new potential thanks to shared manufacturing. In contrast to the conventional outsourcing and OEM models, shared manufacturing is characterized by the sharing of the right to utilize idle resources and capabilities. It does this by constructing a sharing platform for production capacity using advanced industrial Internet of Things and intelligent manufacturing technology to achieve efficient integration of idle production capacity. The “Hai Chuanghui” of the Haier Group and the “Mei Chuang Platform” of Midea have currently had some preliminary success. Therefore, this paper uses the method of evolutionary game to study the decision-making problem of taking the core company as the leading company to drive other non-core companies to participate in shared manufacturing. By constructing an evolutionary game model, the relevant factors affecting the decision-making behavior of each company are analyzed in the process of non-core companies participating in shared manufacturing under the leadership of core company.
2.1.1. The Game’s Central Premise
The major players in the game are a core manufacturing company with shared manufacturing resources and two non-core manufacturing companies with shared manufacturing, denoted by the letters core manufacturing company C, non-core manufacturing company A, and non-core manufacturing company B, respectively.
2.1.2. Set of Game Strategies
The strategic space of non-core manufacturing companies A and B is (sharing, not sharing). The willingness of non-core manufacturing company A to participate in sharing is x (0 ≤ x ≤ 1), and the willingness not to participate in sharing is (1 − x); the willingness of non-core manufacturing company B to participate in sharing is y (0 ≤ y ≤ 1), and the willingness of not to participate in sharing is (1 − y); core manufacturing company C participates in shared manufacturing while providing integrated services of shared manufacturing resources. Therefore, the strategic space of core company C is (provide high service levels, provide low service levels). The willingness of core manufacturing company C to provide high service levels is z (0 ≤ z ≤ 1), and the willingness to provide low service levels is (1 − z). Each game group is “bounded rationality”, and they choose their own strategy with a certain probability.
2.1.3. Parameter Hypothesis
(1) The cost of independent operation of three companies is Ni, and the income is Wi (i = 1, 2, 3 represent three shared manufacturing companies of A, B, and C, respectively).
(2) All non-core manufacturing companies participate in shared manufacturing. The additional costs of non-core manufacturing companies A and B participating in shared manufacturing are C1 and C2,,respectively. At this point, the core manufacturing company C can provide high service levels or provide low service levels. If the core manufacturing company C provides high service levels, then the additional cost it needs to pay is C3, corresponding to the overall additional benefit from shared manufacturing obtained is R1; on the contrary, the additional cost it needs to pay for providing low service levels is C4 (C3 > C4), corresponding to the overall additional benefit from shared manufacturing is R2 (R1 > R2). Whether or not the core manufacturing company provides high service levels, the additional income distribution ratio of three companies is αi (i = 1, 2, 3 represent company A, B, and C, respectively and α1 + α2 + α3 = 1). When non-core manufacturing companies participate in shared manufacturing, core manufacturing company can improve resource integration capabilities, enhance the competitiveness and obtain excess returns V by providing high service levels.
(3) When non-core manufacturing companies do not engage in shared manufacturing for opportunistic or other reasons, the party that does not participate in shared manufacturing will earn speculative income Di. Non-core manufacturing companies will lose their deposits Si (S1 > D1, S2 > D2), which is more than they can obtain speculative income in the event of default. If only one non-core manufacturing company does not participate in shared manufacturing, the additional income of core manufacturing company C providing high service levels and low service levels are L1 and L2 (L1 > L2), respectively. At this time, the income distribution ratio of core manufacturing company and the non-core company who participate in shared manufacturing is 1:1. If all non-core manufacturing companies do not participate in shared manufacturing, core manufacturing company will not refund the deposits.
The model parameters are summarized as shown in Table 1.

Table 1.
The model parameters.
2.2. Payoff Matrix and Replicator Dynamic Equation
According to the above assumptions, the evolutionary game profit matrix of core manufacturing company and non-core companies is constructed as shown in Table 2.
Table 2.
The payoff matrix.
The expected payoffs U1S of non-core company A participating in the sharing and the expected payoffs U1N of non-core company A not participating in the sharing are:
U1N = D1 + W1 − N1 − S1
The expected payoffs U2S of non-core company B participating in the sharing and the expected payoffs U2N of non-core company B not participating in the sharing are:
U2N = D2 + W2 − N2 − S2
The expected payoffs U3S of the core company C provides high service levels and the expected payoffs U3N of the core company C provides low service levels are:
Therefore, the replicator dynamic equation formed by the non-core manufacturing companies and core manufacturing company is:
3. Evolutionary Stable Strategy Analysis
F(x) = 0, F(y) = 0, F(z) = 0 can acquire local equilibrium points: E1(0, 0, 0), E2(0, 0, 1), E3 (0, 1, 0), E4 (0, 1, 1), E5 (1, 0, 0), E6 (1, 0, 1), E7 (1, 1, 0) and E8 (1, 1, 1). In an asymmetric game, the evolutionary game equilibrium must be a strict Nash equilibrium, that is, a pure strategy equilibrium. Mixed strategy must not be an evolutionary stable equilibrium. Therefore, we only discuss the stability conditions of the above eight strategies. The Jacobian matrix of this system is obtained as follows:
where
(1 − 2x) [yzα1R1(1 − y)zL1 + y(1 − z)α1R2(1 − y)(1 − z)L2 − D1 − C1 + S1]
x (1 − x) [zα1R1zL1 + (1 − z)α1R2(1 − z)L2]
x (1 − x) [yα1R1(1 − y)L1 − yα1R2(1 − y)L2]
y (1 − y) [zα2R1zL1 + (1 − z)α2R2(1 − z)L2]
(1 − 2y) [xzα2R1(1 − x)zL1 + x(1 − z)α2R2(1 − x)(1 − z)L2 − D2 − C2 + S2]
y (1 − y) [xα2R1(1 − x)L1 − xα2R2(1 − x)L2]
z (1 − z) [yα3(R1 − R2)(1 − 2y)(L1 − L2) + yV]
z (1 − z) [xα3(R1 − R2)(1 − 2x)(L1 − L2) + xV]
(1 − 2z) [xyα3(R1 − R2)(x − 2xy + y)(L1 − L2) + xyV + C4 − C3]
According to the actual circumstances, when all non-core companies participate in shared manufacturing, and the additional profit of the core manufacturing company providing high service levels is greater than providing low service levels, it is possible for the core manufacturing company to provide high service levels. Therefore, we assume that α3(R1 − R2) + V − C3 + C4 > 0. Due to the leading role of core companies, the additional profits earned by non-core companies when they all participate in shared manufacturing are greater than zero, that is, αiR1 − Ci > 0 (i = 1, 2) and αiR2 − Ci > 0 (i = 1, 2). Utilizing Lyapunov’s indirect method, the stability analysis of the aforementioned eight equilibrium points is performed:
(1) The profits of non-core company participating in shared manufacturing are greater than that of not participating in shared manufacturing, no matter whether other non-core company participate in shared manufacturing. Therefore, we can acquire that (L2 + Wi − Ci − Ni) > (Wi + Di − Ni − Si) (i = 1, 2). Table 3 displays the stability analysis of the equilibrium point. (1, 1, 1) is a stable point, as shown in Table 3, and Figure 1 depicts the phase diagram. Currently, the decisions of other companies have no bearing on those of non-core manufacturing companies. As a result, this article does not take them into account.
Table 3.
Analysis of local stability of equilibrium point of case (1).
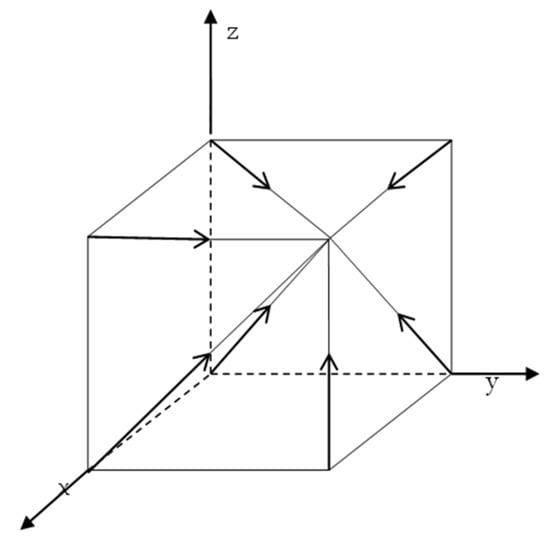
Figure 1.
Strategy evolution phase diagram of case (1).
(2) When a non-core manufacturing company does not participate in shared manufacturing, and at the same time, the core manufacturing company provides low service levels, the profit of another non-core manufacturing company participating in shared manufacturing is less than that of not participating in shared manufacturing, that is, (L2 + Wi − Ci − Ni) < (Wi + Di − Ni − Si) (i = 1, 2). Table 4 displays the stability analysis of the equilibrium point. (0, 0, 0) and (1, 1, 1) are stable points, as shown in Table 4, and Figure 2 depicts the phase diagram. In this case, the decision of any participating shared manufacturing company will have an impact on other participating shared manufacturing companies. Analyzing this situation is the main goal of this paper.
Table 4.
Analysis of local stability of equilibrium point of case (2).
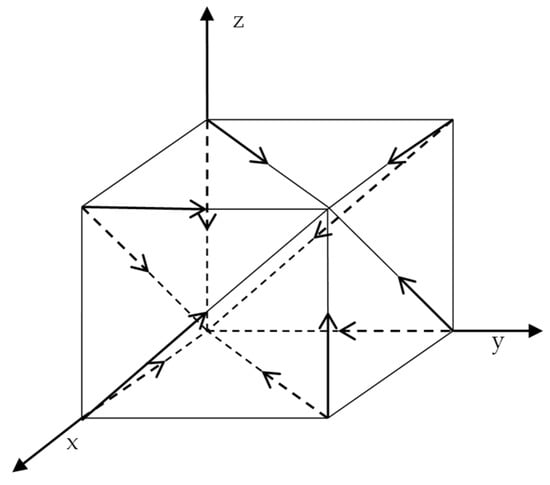
Figure 2.
Strategy evolution phase diagram of case (2).
4. Numerical Simulations
In this paper, MATLAB is used to simulate and analyze the impact of different parameters on the strategy evolution results. Referring to Qi et al. [28], the following parameter values of the simulation are set: x = 0.5, y = 0.5, z = 0.5, C1 = 10, C2 = 8, C3 = 13, C4 = 10, D1 = 2, D2 = 1.5, S1 = 2.2, S2 = 1.7, L1 = 10, L2 = 7.5, R1 = 50, R2 = 40, α1 = 0.34, α2 = 0.25, α3 = 0.41, V = 5. Matlab software is used for numerical simulation to analyze the changing trend of company’s evolutionary strategies.
4.1. Impact of Initial Willingness to Share
The initial willingness to share of one party increases or lowers by 0.05 on the assumption that the initial willingness to share is (0.5, 0.5, 0.5). Observe how each manufacturing company has evolved strategically. Figure 3 displays the system’s evolution’s outcomes.
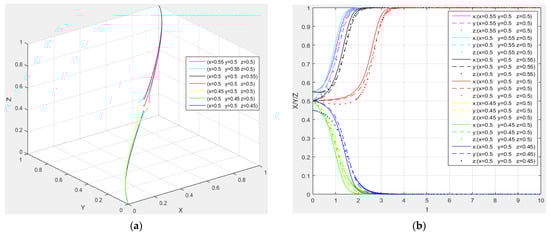
Figure 3.
Numerical simulation diagram of the initial willingness to share: (a) 3D stereogram; (b) 2D floor plan.
According to the research in Figure 3, as the initial willingness of core manufacturing company to provide high-level services increases, the willingness of non-core companies to participate in shared manufacturing also increases, and the higher the willingness of core company to provide high resource levels, the faster the willingness of non-core companies to participate in shared manufacturing increases. Similarly, if the initial willingness of non-core companies to participate in shared manufacturing increases, the willingness of core company to provide a high level of resource integration will also increase. On the contrary, the less initially willing core company was to offer high-quality services or less initially willing non-core companies were to engage in sharing, the more convergent the core company was to offer low-quality services, and the more convergent non-core companies were to not engage in shared manufacturing.
4.2. Impact of the Additional Sharing Costs
The additional sharing costs increase or decrease depending on the additional sharing costs (C1 = 10, C2 = 8, C3 = 13, C4 = 10). Observe how each manufacturing company has evolved strategically. Figure 4 displays the end outcomes of the system’s evolution.
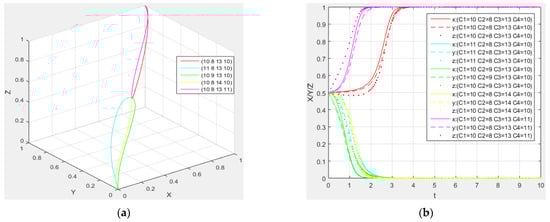
Figure 4.
Numerical simulation diagram of the additional sharing costs: (a) 3D stereogram; (b) 2D floor plan.
By analyzing Figure 4, it can be seen that: as the additional costs of core manufacturing company delivering high service levels rise, their willingness to engage in shared manufacturing will decline until they both reach zero. The willingness of core manufacturing company to provide high service levels will rise along with the higher sharing costs of core company providing low service levels, and the willingness of non-core manufacturing companies to participate in shared manufacturing will rise along with it until it converges to 1. The willingness of non-core manufacturing companies to participate in shared manufacturing will decline as the additional costs rise, and the willingness of core company to provide a high level of services will also decline until it converges to zero.
4.3. Impact of the Speculative Income
We boost or decrease a non-core company’s speculative income based on (D1 = 2, D2 = 1.5) speculative income and track the strategic evolution of each manufacturing organization. Figure 5 displays the system’s evolution’s outcomes.
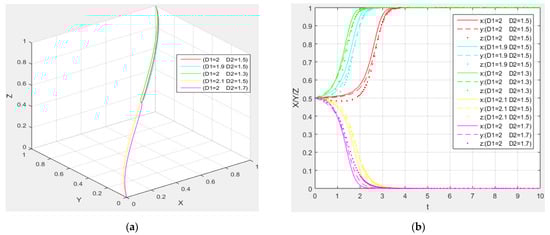
Figure 5.
Numerical simulation diagram of the speculative income: (a) 3D stereogram; (b) 2D floor plan.
By analyzing Figure 5, it can be seen that: with the reduction of speculative income, manufacturing companies are more inclined to participate in shared manufacturing, and other companies are also inclined to participate in shared manufacturing. Additionally, core company will be more inclined to offer good service standards at the same time. In the end, the willingness of core companies to deliver high service levels and that of non-core companies to participate in sharing will converge to 1. The less speculative income received by non-core companies, the sooner non-core companies are willing to join in sharing, and core company is willing to offer high service levels, the quicker the convergence speed will be.
4.4. Impact of the Default Losses
We increase or decrease the default losses of non-core manufacturing companies and track the strategic evolution of each manufacturing company based on the assumption that the default losses of non-core manufacturing companies are (S1 = 2.2, S2 = 1.7). Figure 6 displays the system’s evolution outcomes.
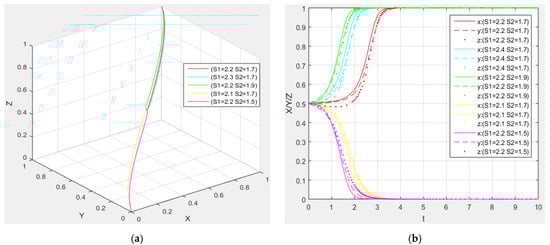
Figure 6.
Numerical simulation of the default losses: (a) 3D stereogram; (b) 2D floor plan.
By analyzing Figure 6, it can be seen that: when default losses rise, manufacturing companies’ desire to share will also rise, as will the willingness of other non-core manufacturing companies to do the same. Additionally, the core manufacturing company will be more inclined to offer good service standards at the same time. In the end, the core manufacturing company will offer high levels of service thanks to non-core manufacturing companies’ willingness to share. The greater the default losses suffered by non-core manufacturing companies, the more non-core manufacturing companies will be willing to share, and the more core manufacturing company will be willing to offer high-quality services.
4.5. Impact of the Additional Income when Only One Non-Core Manufacturing Company Defaults
We adjust the additional income now based on the assumption that the additional income is (L1 = 10, L2 = 7.5) when only one non-core manufacturing company defaults, and we track the strategic development of each manufacturing company. Figure 7 displays the system’s evolution’s outcomes.
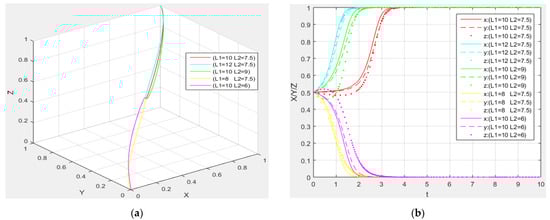
Figure 7.
Numerical simulation of the additional income when only one non-core manufacturing company defaults: (a) 3D stereogram; (b) 2D floor plan.
Through the analysis of Figure 7, when only one non-core manufacturing company defaults, with the increase of additional income, it will increase the willingness of the core company to provide high service levels and non-core companies to participate in sharing. The more additional income, the faster the willingness increases of core companies to provide a high level of service and the faster the willingness increases of non-core companies to participate in sharing.
4.6. Impact of the Additional Income when All Non-Core Companies Participate in the Sharing
On the basis that the additional income when all non-core manufacturing companies participate in sharing is (R1 = 50, R2 = 40), we increase or decrease the additional income at this time and observe the strategic evolution path of each manufacturing company. The system evolution results are shown in Figure 8.
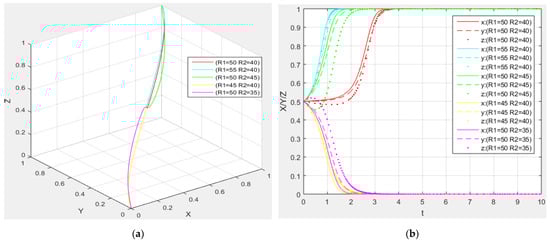
Figure 8.
Numerical simulation diagram of the additional income when all non-core manufacturing companies participate in the sharing: (a) 3D stereogram; (b) 2D floor plan.
By analyzing Figure 8, it is clear that the increased additional income that results from all non-core manufacturing companies sharing will encourage both their willingness to share and the willingness of core manufacturing company to offer high level of services. In addition, the more additional income when non-core companies participate in sharing, the faster the willingness increase of non-core companies to participate in sharing and the willingness increase of core company to provide high level of services.
4.7. Impact of the Additional Income Distribution Ratio
Adjust the additional income distribution ratio based on the initial value (α1 = 0.34, α2 = 0.25, α3 = 0.41). According to the real situation, the overall income of core company should not be less than zero when non-core companies participate in shared manufacturing, and core company offers high levels of service. See Figure 9 for the outcomes of the system evolution as it relates to each manufacturing company’s strategic evolution path.
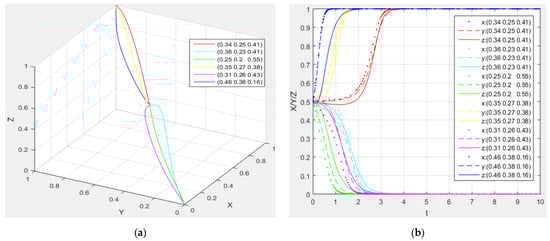
Figure 9.
Numerical simulation diagram of the additional income distribution ratio: (a) 3D stereogram; (b) 2D floor plan.
According to the analysis of Figure 9, the willingness of non-core companies to share is proportional to the proportion of additional income distribution when the proportion of additional income distribution for core companies stays the same. Within a reasonable range, non-core companies with higher income distribution ratio can more effectively encourage other companies to share. The non-core companies with a decrease in the proportion of income distribution can more strongly influence other companies to not participate in sharing when the proportion of income distribution exceeds a reasonable range. The proportion of additional income distribution among non-core companies rises as the proportion of additional income distribution among core companies declines, and non-core companies are more willing to share as a result. Although core company’s willingness to offer high service levels initially declines as the additional income distribution ratio decreases, eventually core company is still willing to provide service at high service levels due to the increased willingness of non-core companies to participate in shared manufacturing. The smaller the proportion of additional income distribution of core manufacturing company, the faster the willingness increase of non-core companies to participate in sharing, and the willingness increase of core company to consolidate high resources.
4.8. Impact of the Excess Income by Core Manufacturing Company Providing High Service Level
The excess income obtained by the core manufacturing company providing a high service level either increases or decreases based on the assumption that V = 5 (V represents the excess income obtained by the core company providing a high service level). We track the leadership that each manufacturing company is taking in terms of strategy. Figure 10 displays the system’s evolution’s outcomes.
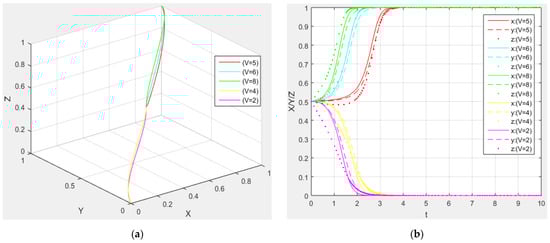
Figure 10.
Numerical simulation diagram of the excess income by core manufacturing company providing high service levels: (a) 3D stereogram; (b) 2D floor plan.
Through the analysis of Figure 10, when the excess income obtained by core manufacturing company in providing high service levels increases, the willingness of the core company to provide high service levels will also increase, and the willingness of non-core manufacturing companies to participate in sharing will also increase. The more excess returns obtained by core manufacturing company to provide high service levels, the faster the willingness increase of the core company to provide high service levels and the willingness increase of non-core companies to participate in sharing.
5. Conclusions
This work has developed an evolutionary game model of shared manufacturing under the leadership of core manufacturing company in order to thoroughly investigate the influencing elements of shared manufacturing companies. Following a comparative analysis of the impact of various factors on evolutionary outcomes, the conclusions and managerial implications are as follows:
First, the system’s evolutionary approach is influenced by the companies’ initial willingness to share. Core manufacturing company is increasingly willing to deliver high service standards, and non-core companies are increasingly eager to participate in shared manufacturing as the initial readiness of companies to share increases. Therefore, core company should actively seek out high-quality manufacturing companies to join in shared manufacturing in order to increase their own profits, while manufacturing companies can also encourage other high-quality core manufacturing company to do the same.
Second, the cost-to-income ratio has an impact on how the system evolves. When the additional expenses that must be incurred are higher, or the additional income harvest is lower, core manufacturing company is reluctant to offer high-quality services and non-core companies are reluctant to take part in shared manufacturing. In order to decrease costs and increase returns, core company makes every effort to invite non-core companies with complementary resources to participate in shared manufacturing; conversely, non-core companies should make every effort to find core companies with complementary resources to participate in shared manufacturing in order to minimize costs.
Third, whereas default losses have a positive effect, speculative income has a detrimental effect on non-core manufacturing companies’ decisions to join in shared manufacturing. If the speculative income increases, non-core companies are less eager to join in shared manufacturing although they must incur bigger default losses. In order to achieve sustainable development of shared manufacturing, companies should protect their core information as much as possible. Alternatively, core companies could collect a deposit that is far greater than speculative income at the beginning of the contract’s signing to compel non-core companies to participate in shared manufacturing.
Fourth, how much additional income distribution ratio is distributed also influences whether or not companies decide to take part in shared manufacturing. Non-core manufacturing companies will be hesitant to participate in shared manufacturing when the additional income distribution ratio is low, even though, at this point, core manufacturing company is more willing to provide a high level of services due to a higher share of the income distribution, and ultimately non-core companies will not participate in shared manufacturing. Non-core companies are more eager to share if they earn a higher proportion of additional income, and at this point, core manufacturing company is encouraged to deliver a high level of services although core company receives a low proportion of additional revenue distribution. It is clear that core company can suitably lower their own additional income distribution ratio while still protecting their own interests in order to entice top-notch non-core companies to join in shared manufacturing. Non-core manufacturing company might work to distribute as much extra income as they can.
Fifth, the excess income obtained by core manufacturing company from providing high service levels also has a positive impact on companies’ participation in shared manufacturing. The increase in the excess income obtained by core company from providing high service levels will promote the willingness of core company to provide high service levels. As the willingness of core company to provide high service levels increases, the willingness of non-core companies to participate in shared manufacturing will also increase. The faster the excess income obtained by core company to provide high service levels increases, and the faster the willingness of companies to participate in shared manufacturing converges to 1. It is clear that the more excess income can be realized, the more inclined the core company is to offer high-quality services. Therefore, non-core manufacturing companies should hunt for core company that can generate more excess income while searching for core manufacturing company to participate in shared manufacturing.
There is still some potential for improvement in the research of this paper because this article only takes into account the influencing elements between core manufacturing company and non-core manufacturing companies while engaging in shared manufacturing. On the one hand, a variety of variables, such as shared manufacturing product quality, product evaluation, and market feedback, influence the game’s decision-making. On the other hand, when taking part in shared production, it is also vital to take into account the evolutionary game strategy of various company groups.
Author Contributions
P.L. and X.W. developed the methodology and drafted the manuscript; X.W. performed the numerical simulations and wrote the original draft. All authors have read and agreed to the published version of the manuscript.
Funding
This work was supported by the Key Program of Social Science Planning Foundation of Liaoning Province under Grant L21AGL017.
Institutional Review Board Statement
Not applicable.
Informed Consent Statement
Not applicable.
Data Availability Statement
Not applicable.
Acknowledgments
We are grateful to the editor and the anonymous referees for their helpful comments and suggestions. The authors wish to acknowledge the contribution of Liaoning Key Lab of Equipment Manufacturing Engineering Management, Liaoning Research Base of Equipment Manufacturing Development, Liaoning Key Research Base of Humanities and Social Sciences: Research Center of Micro-management Theory of SUT.
Conflicts of Interest
The authors declare no conflict of interest.
References
- Ellen, B. A vision for shared manufacturing. Mech. Eng. 1990, 112, 52–55. [Google Scholar]
- He, J.; Zhang, J.; Gu, X. Research on sharing manufacturing in Chinese manufacturing industry. Int. J. Adv. Manuf. Technol. 2019, 104, 463–476. [Google Scholar] [CrossRef]
- Jiang, P.; Li, P. Shared factory: A new production node for social manufacturing in the context of sharing economy. Proc. Inst. Mech. Eng. Part B J. Eng. Manuf. 2020, 234, 285–294. [Google Scholar] [CrossRef]
- Yu, C.; Xu, X.; Yu, S.; Sang, Z.; Yang, C.; Jiang, X. Shared manufacturing in the sharing economy: Concept, definition and service operations. Comput. Ind. Eng. 2020, 146, 106602. [Google Scholar] [CrossRef]
- Yu, C.; Jiang, X.; Yu, S.; Yang, C. Blockchain-based shared manufacturing in support of cyber physical systems: Concept, framework and operation. Robot. Comput.-Integr. Manuf. 2020, 64, 101931. [Google Scholar] [CrossRef]
- Rozman, N.; Diaci, J.; Corn, M. Scalable framework for blockchain-based shared manufacturing. Robot. Comput.-Integr. Manuf. 2021, 71, 102139. [Google Scholar] [CrossRef]
- Li, P.; Jiang, P. Enhanced agents in shared factory: Enabling high-efficiency self-organization and sustainability of the shared manufacturing resources. J. Clean. Prod. 2021, 292, 126020. [Google Scholar] [CrossRef]
- Xu, Y.; Zhi, R.; Zheng, F.; Liu, M. Online strategy and competitive analysis of production order scheduling problem with rental cost of shared machines. Chin. J. Manag. Sci. 2021, 54, 466–476. [Google Scholar] [CrossRef]
- Li, K.; Xiao, W.; Zhu, X. Pricing strategies for sharing manufacturing model based on the cloud platform. Control. Decis. 2022, 37, 1056–1066. [Google Scholar]
- Wang, G.; Zhang, G.; Guo, X.; Zhang, Y. Digital twin-driven service model and optimal allocation of manufacturing resources in shared manufacturing. J. Manuf. Syst. 2021, 59, 165–179. [Google Scholar] [CrossRef]
- Yan, P.; Yang, L.; Che, A. Review of supply-demand matching and scheduling in shared manufacturing. Syst. Eng.-Theory Pract. 2022, 42, 811–832. [Google Scholar]
- Zhang, Z.; Wang, X.; Su, C.; Sun, L. Evolutionary Game Analysis of Shared Manufacturing Quality Innovation Synergetic Behavior Considering a Subject’s Heterogeneous Emotions. Processes 2022, 10, 1233. [Google Scholar] [CrossRef]
- Zhang, Z.; Wang, X.; Su, C.; Sun, L. Evolutionary Game Analysis of Shared Manufacturing Quality Synergy under Dynamic Reward and Punishment Mechanism. Appl. Sci. 2022, 12, 6792. [Google Scholar] [CrossRef]
- Zhang, G.; Chen, C.; Liu, B.; Li, X.; Wang, Z. Hybrid sensing-based approach for the monitoring and maintenance of shared manufacturing resources. Int. J. Prod. Res. 2021, 1–19. [Google Scholar] [CrossRef]
- Ji, M.; Ye, X.; Qian, F. Parallel-machine scheduling in shared manufacturing. J. Ind. Manag. Optim. 2022, 18, 681–691. [Google Scholar] [CrossRef]
- Wei, Q.; Wu, Y. Two-machine hybrid flow-shop problems in shared manufacturing. Comput. Model. Eng. Sci. 2022, 131, 1125–1146. [Google Scholar] [CrossRef]
- Chen, J.; Tang, Q. Research on the efficiency measurement of high-quality development of sharing manufacturing in China based on three-stage DEA-malmquist method. J. Ind. Technol. Econ. 2022, 341, 106–115. [Google Scholar]
- Richard, E.B.; Fred, D.; Cody, J.H.; Gary, E.S.; Edward, S.; Steven, S. A group technology model to assess consolidation and reconfiguration of multiple industrial operations—A shared manufacturing solution. Int. J. Comput. Integr. Manuf. 1993, 6, 311–322. [Google Scholar]
- Lujak, M.; Fernandez, A.; Onaindia, E. Spillover algorithm: A decentralised coordination approach for multi robot production planning in open shared factories. Robot. Comput.-Integr. Manuf. 2021, 70, 102110. [Google Scholar] [CrossRef]
- Ji, P.; Ma, X.; Li, G. Developing green purchasing relationships for the manufacturing industry: An evolutionary game theory perspective. Int. J. Prod. Econ. 2015, 166, 155–162. [Google Scholar] [CrossRef]
- Luo, J.; Li, W.; Zhao, Y. Stability analysis of manufacturing enterprise service derivative based on evolutionary game theory. J. Syst. Eng. 2016, 31, 761–771. [Google Scholar]
- Wu, J.; Che, X.; Sheng, Y.; Chen, L.; Shi, Q. Study on government-industry-university-institute collaborative innovation based on tripartite evolutionary game. Chin. J. Manag. Sci. 2019, 27, 162–173. [Google Scholar]
- Wu, J.; Tang, X.; Sheng, Y.; Wei, X.; Mao, X. Research on the collaborative innovation mechanism among the government, enterprises and universities in the post-subsidy era of new energy automobiles based on tripartite evolutionary game theory. Oper. Res. Manag. Sci. 2021, 30, 96–102. [Google Scholar]
- Zhu, L.; Rong, J. Three-party evolutionary game and simulation analysis of drug quality supervision under the government reward and punishment mechanism. Chin. J. Manag. Sci. 2021, 29, 55–67. [Google Scholar]
- Cui, M. Tripartite evolutionary game analysis for environmental credit supervision under the background of collaborative governance. Syst. Eng.-Theory Pract. 2021, 41, 713–726. [Google Scholar]
- Wang, H. Study on shared parking industry promotion based on tripartite evolutionary game. Shanghai Manag. Sci. 2020, 42, 107–112. [Google Scholar]
- Wang, T.; Li, C.; Yuan, Y.; Liu, J.; Adeleke, I.B. An evolutionary game approach for manufacturing service allocation management in cloud manufacturing. Comput. Ind. Eng. 2019, 133, 231–240. [Google Scholar] [CrossRef]
- Qi, E.; Li, T.; Liu, L.; Zhao, Y.; Qiao, G. The evolutionary game analysis of the sharing of manufacturing resource in the environment of cloud manufacturing. Oper. Res. Manag. Sci. 2017, 26, 25–34. [Google Scholar]
- Hao, J.; Zhao, D. Tripartite-players evolutionary game analysis of the manufacturing capacity sharing in the environment of sharing economy. Oper. Res. Manag. Sci. 2021, 30, 1–7. [Google Scholar]
- Feng, C.; Ma, R. Analysis of evolutionary game between manufacturing enterprises and service providers based on servitization. Chin. J. Manag. Sci. 2022, 30, 263–274. [Google Scholar]
- Zhao, X.; Meng, X. Evolutionary game decision between manufacturer and remanufacturer in the authorization mode. Chin. J. Manag. Sci. 2021, 29, 129–136. [Google Scholar]
- Bo, H.; Wang, X.; Li, H.; Qi, L. Research on Evolution of Service-Oriented Capacity Sharing Platform Model Considering Maturity Incentive. Ind. Eng. Manag. 2021, 26, 123–131. [Google Scholar]
- Zhu, H.; Ren, N.; Wang, N. Evolutionary game analysis on transaction of cloud manufacturing service plat form based on block chain. Comput. Integr. Manuf. Syst. 2022, 28, 629–642. [Google Scholar]
- Hosseini-Motlagh, S.M.; Choi, T.M.; Johari, M.; Nouri-Harzvili, M. A profit surplus distribution mechanism for supply chain coordination: An evolutionary game-theoretic analysis. Eur. J. Oper. Res. 2022, 301, 561–575. [Google Scholar] [CrossRef]
- Biancardi, M.; Iannucci, G.; Villani, G. An evolutionary game on compliant and non-compliant firms in groundwater exploitation. Ann. Oper. Res. 2022. [Google Scholar] [CrossRef]


Publisher’s Note: MDPI stays neutral with regard to jurisdictional claims in published maps and institutional affiliations. |
© 2022 by the authors. Licensee MDPI, Basel, Switzerland. This article is an open access article distributed under the terms and conditions of the Creative Commons Attribution (CC BY) license (https://creativecommons.org/licenses/by/4.0/).