Abstract
The socio-cultural value of urban parks has rarely been studied, and this could be why they are undervalued and not given significant attention in city planning. This study presents the socio-cultural valuation (SCV) of the ecosystem services (ES) and disservices (EDS) of the Jose Rizal Plaza in Calamba City, The Philippines. Stakeholders were interviewed to assemble a list of the park’s ES and EDS. An online survey was then conducted to examine how stakeholders assign values to the park ES and EDS. Finally, the configuration of conditions leading to the assigned values was analysed. The results suggest that respondents value the park’s ES more than they worry about its EDS. They value cultural ES the highest, while they are most concerned with psychological EDS. The Fuzzy-set Qualitative Comparative Analysis (fsQCA) revealed that visiting the park is necessary for a high valuation to ES. For EDS, these are: not knowing the previous land use in the area and visiting the park. Overall, the paper concludes that SCV is an effective way to assess the value of urban parks, and fsQCA could aid in determining the combination of conditions leading to these values.
1. Introduction
Urban parks are semi-natural or human-made ecosystems comprised of a network of public open and green spaces in cities. They are known to provide a range of environmental, social, and economic benefits [1,2]. One way in which these benefits have been conceptualised is the concept of Ecosystem Services (ES) [3,4]. The ES concept became widely recognised as a tool for socio-ecological assessment of ecosystems after the Millennium Ecosystem Assessment (MEA) in 2005. The MEA suggested four categories of ES—provisioning, regulating, supporting, and cultural. Provisioning ES are direct ecosystem products such as food, timber, and water while regulating ES are the benefits that we get from the regulation of ecosystem processes such as climate regulation, natural hazard regulation, water purification, and pollination. Supporting (or Habitat) ES highlight the importance of ecosystems to provide habitat and to maintain genetic diversity. Cultural ES are the non-material benefits that people obtain from ecosystems through spiritual enrichment, cognitive development, reflection, recreation, and aesthetic experiences [5,6]. While considered a breakthrough in the study of the human–nature relationship, one of the critiques of the ES concept is that it gives the impression that nature only produces benefits [7]. It does not seem to acknowledge the presence of ecosystem disservices (EDS) or the ecosystem functions that are perceived to have a negative impact on human well-being [8]. These EDS can be ecological, economic, health, or psychological disbenefits. Ecological EDS negatively affect ecosystem structure, processes, or services (e.g., bio-emissions, invasive species), while economic EDS adversely affect socio-economic structure and processes (e.g., maintenance costs, lower property values). Negative health impacts include allergies caused by plants and diseases spread by fauna. In contrast, psychological effects are anything that causes anxiety or discomfort to human beings (e.g., disgust from animal excrement, fear because of dark areas) [9,10].
The valuation of ES and EDS requires an understanding of the notion of “values”, a social construction from the cultural contexts of a time and place. According to Brown (1984) [11], these values can be categorised as “held” or “assigned”. “Held values” are modes of conduct (e.g., generosity, courage, obedience) or end-states and qualities (e.g., wisdom, happiness, freedom) which serve as the basis for evaluative judgment [11]. “Assigned values” express the importance of an object relative to other objects [11,12]. For example, one can prefer one type over another type of a pen, sandwich, or perfume and could rate it higher in some form of a scale. Three types of valuation are applied to ES. Ecological valuation assesses the functional integrity, health or resilience of an ecosystem to sustain life, done through the measurement of biophysical indicators such as diversity or carbon stock [6]. By contrast, economic valuation appraises the importance of ES in monetary terms [13]. Socio-cultural valuation (SCV) considers how ES values are culturally constructed [14]. It measures the assigned value expressed in non-monetary terms while incorporating a person’s perception of the ES, their held values, and associated preferences [15].
SCV has rarely been applied to urban parks. This could be why the value of these urban resources has not been articulated adequately, and thus they suffer from the pressure of being converted into other more economically productive land uses [16]. They are also not given priority in city-planning [17]. For example, the Arroceros Park, dubbed as the “last lung” of Manila, the capital of the Philippines, has been continually being reduced due to the construction of offices and commercial buildings within it [18]. Numerous park valuation studies have used economic and ecological techniques [19,20,21,22], but these under-represent the intangible ES and often disregard the EDS of parks. Perceived, non-market importance that people ascribe to cultural services (e.g., aesthetics and recreation) are often missed by economic and ecological valuation [23]. This is also the case in the Philippines, where, of very few studies on urban parks [24,25,26,27], no one had studied EDS, and only one had tackled the social valuation of ES [28].
This study aims to apply SCV in assessing how stakeholders value the ES and EDS that they associate with urban parks through a case study in the Philippines. Specifically, it seeks to examine the non-monetary values that stakeholders assign to the park ES and EDS and identify the configuration of conditions leading to such values. This research will help reveal the value of urban parks to people and, therefore, help cities assess the need and demand for public open and green spaces. This research will also contribute to the development of methods for the emerging field of socio-cultural valuation of ES and EDS.
This paper is structured as follows. After the Introduction, the Methods section illustrates the study area, conceptual framework, and the survey structure and analysis. The Results section then describes the summary of the valuation survey and the conditions leading to the high valuation of ES and EDS. Finally, a general discussion of the results is presented before the paper concludes with the value of its findings.
2. Materials and Methods
2.1. Study Area: The Jose Rizal Plaza in Calamba City
Calamba is one of the six component cities of Laguna Province in the Philippines. The city has an area of 144.80 km2 and is the second-largest city in the province. According to the latest census (2015), it has a population of 454,486. The city is about 45 km away from the Metro Manila Region and is located on the southwest side of Laguna de Bay, the biggest lake in the country (Figure 1). The city is politically subdivided into 54 “barangays” (villages) [29].
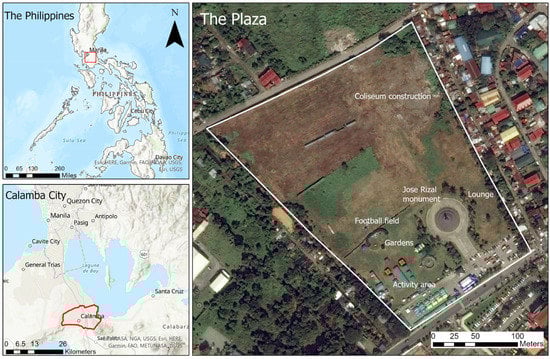
Figure 1.
Calamba City and the Jose Rizal Plaza.
The Jose Rizal Plaza is a 7 ha park located at Barangay Real in Calamba City. It was built in 2011 and houses one of the tallest monuments of Dr Jose Rizal, the Philippines’ national hero. As of January 2020, the park has the following amenities: football field, gardens, lounge (which has not been opened yet to the public), and activity area (used for Zumba classes, jogging, and different events) (Figure 1 and Figure 2). A coliseum, shaped like a clay pot or “banga” (where the city derived its name), is also being constructed in the area.
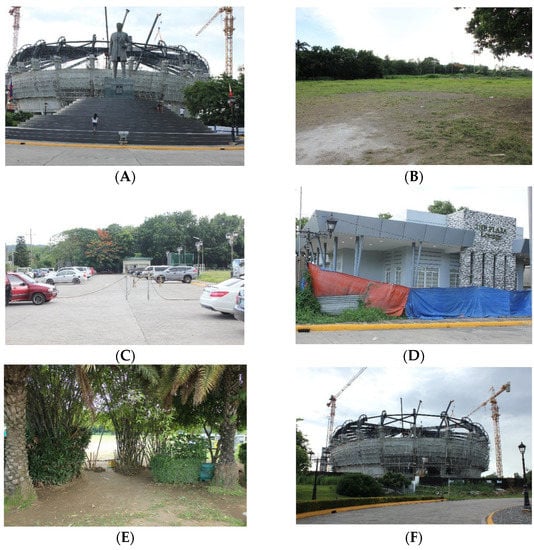
Figure 2.
The amenities of Jose Rizal Plaza: (A) Jose Rizal monument; (B) open field; (C) activity area; (D) lounge; (E) gardens; and (F) coliseum being constructed.
2.2. Conceptual Framework
Brown’s (1984) work on the concept of value was chosen as the conceptual framework as it is arguably the basis of the idea of SCV (Figure 3) [11]. He proposed that held values lead to the expression of assigned values through preferences and the relationship between the individual and the object being valued [11]. Socio-economic variables were assessed in the study since individuals perceive and therefore value ES differently according to their socio-cultural backgrounds [5,15,30]. Since urban parks are common resources, the respondents’ social value orientation (SVO) was also measured to represent their concern for others when making decisions about allocating resources [31]. Environmental knowledge, awareness, perception, and behaviour were assumed to influence people’s preferences and their relationship to nature.
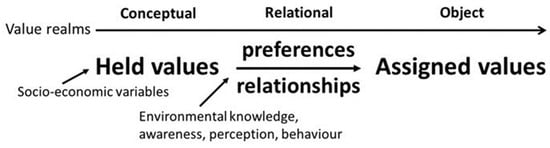
Figure 3.
The conceptual framework of the study, modified from Brown (1984) [11].
2.3. Online Survey Structure and Administration
An online survey was utilised to undertake the SCV. The questionnaire consisted of five sections: (1) park use; (2) environmental knowledge, perception, and behaviour; (3) social value orientation; (4) valuation of ecosystem services (ES) and disservices (EDS); and (5) socio-economic characteristics (Table 1). A copy of the questionnaire is in the Supplementary Materials.

Table 1.
Questionnaire sections and the information gathered.
The first section asked the respondents how they utilise the park–if they had visited it before and the frequency and purpose of their visits. In the second section, environmental knowledge was measured through common environmental concepts and the environmental laws in the Philippines. Respondents were asked to choose from a group of words, the environmental concepts described in seven statements [32,33]. The total number of correct answers was used to represent the respondents’ knowledge of environmental concepts. They were then asked to gauge how much they knew about the three primary environmental laws in the Philippines through a Likert scale from 0 (practically no knowledge) to 3 (a lot). The respondents’ environmental perception was assessed by asking them how they think local environmental issues have become since they have lived in Calamba City [34,35]. They were asked to choose from a Likert scale from 1 (much worse) to 5 (much better). They were also given a choice to answer 0 if they thought they did not have enough knowledge to provide a rating. Finally, environmental behaviour was measured by asking the respondents how frequent they practised nine positive environmental behaviours [36,37]. They were asked to rate each action from 1 (never) to 5 (always). They were allowed to answer 0 if they wanted to skip a number. The scales used to measure the knowledge of environmental laws, environmental perception, and environmental behaviour had high levels of internal consistency (Cronbach’s alpha of 0.878, 0.829, and 0.813, respectively).
To represent held values, the respondents’ social value orientation (SVO) (i.e., the magnitude of their concern to others when it comes to allocating resources) was measured in the third section using a tool developed by Murphy and Ackermann (2013) [31]. Respondents were asked to imagine being paired with another person unrelated to them. They were then asked to choose one resource (cash) allocation between them and the other person out of nine options six times. The responses were then transformed into a degree score determining the respondents’ SVO. A competitive individual is someone who aims to maximise the difference between what they have and what the other person has. Individualists aim to maximise resources for themselves. A prosocial values the equality of resource distribution, while an altruist endeavours to maximise others’ resources or benefits [31].
In the fourth section, the respondents were asked to rate the importance of the ES and the worry they have for the EDS of the park using a continuous scale slider from 0–10 (with one decimal place) [38,39]. The ES and EDS that were included in the survey came from the benefits and disbenefits cited by the respondents during key informant interviews that were carried out in the initial stages of the research. The ES were categorised based on the Millennium Ecosystem Assessment classification [3]—provisioning, regulating, supporting, and cultural, while the EDS from Lyytimäki and Sipilä (2009) [8], Liu et al. (2018) [9], and Von Döhren and Haase (2015) [10]. Additional ES types, namely, economic, security, and non-use (an aggregation of existence, option, and bequest ES), were added based on the ES categorisation by Forest Foundation Philippines et al. (2019) [40] and Kati and Jari (2016) [41]. The values that the respondents assigned to ES (statements 1 to 36) and EDS (statements 37 to 44) were averaged. The fifth section summarises the respondents’ socio-economic characteristics.
The survey was administered online through the Qualtrics Core XM Survey Tool from April to July 2020. The link to the survey was distributed using social media posts and emails. The survey data from Qualtrics was exported as an SPSS data set for analysis.
2.4. Data Analysis
Answers to the fifth section of the questionnaire (socio-economic characteristics) were analysed using descriptive statistics first to summarise the demographics of the respondents and to categorise them according to the stakeholder groups that were identified through key informant interviews with relevant city office departments: the city office and its employees; the businesses around the park (specifically in Barangays Real and Halang); students; and the residents from all barangays (near and far from the park). As suggested by key informants, residents living within a 4 km radius from the park were considered near, while those beyond were considered far. The first four sections were then subsequently analysed. The mean values given to ES and EDS were not normally distributed according to a Shapiro–Wilk’s test [42] (p < 0.05) so a Mann–Whitney U test [43] was used to determine if there were significant differences between the two. The mean values assigned to the different types of ES and EDS were also not normally distributed so Kruskal–Wallis tests [44] were performed to compare them. Finally, except for the ES values from businesses, Kruskal–Wallis tests were also used to investigate if there were significant differences in the values assigned by each stakeholder group to the different types of ES and EDS. One-way analysis of variance (ANOVA) was applied to the values given by businesses, since the data follow a normal distribution (p > 0.05). All the analyses were accomplished through IBM SPSS Statistics for Windows, Version 26.0, New York, NY, USA except for the Fuzzy-set Qualitative Analysis, which was run through the fs/QCA software Version 3.1b, Irvine, CA, USA [45] (details provided in the Supplementary Materials).
3. Results
3.1. Socio-Economic Characteristics
A total of 1234 opened the questionnaire through the Qualtrics link, but only 675 completed the survey. More than half of the respondents (55.85%) found out about the survey from a colleague, friend, or a relative, and 30.07% found it through social media posts. The rest were informed by a city or a village office employee and the author. The socio-economic characteristics of the respondents are in Table 2. In general, the respondents were prosocial (78.37%) and individualistic (19.41%). Few were altruistic and competitive (2.22%). A considerable percentage of the respondents are college students (42.67%), residents from barangays near the park (28.30%), and residents far from the park (12%). Less than 15% are owners or employees of businesses in Calamba City, barangays closest to the park, and city office employees.
Table 2.
Socio-economic characteristics of the focus group participants.
3.2. Park Use
Almost all the respondents (96.4%) have visited the Jose Rizal Plaza. When asked how frequently they visited the park in the previous year, the majority of the respondents reported their visits per year (53.3%), while 32.7% and 14% reported their visits per month and per week, respectively. Those who reported their visits per year came to the park from 0 to 20 times, with a mean of 3 (SD = 2.5) and a mode of 1. Those who reported their visits per month visited from 1 to 10 times, with a mean of 2.4 (SD = 1.6) and a mode of 1 and 2, and those who reported their visits per week came there from 1 to 7 times, with a mean of 3 (SD = 1.8) and a mode of 2.
A little more than half of the respondents visit the park to watch or participate in events (50.7%) or to relax or unwind (48.7%) (Table 3). Other reasons mentioned by the respondents include going to the Christmas carnival, eating, family bonding, attending meetings, school activities, and strolling. The majority of the respondents (60.74%) do not know the previous land use in the area where the park is built. Out of the 265 who said they knew the previous land use, only 177 (66.79%) answered correctly—an idle or vacant lot, grassland, or plant stalls.
Table 3.
Respondents’ purpose when visiting the Jose Rizal Plaza (n = 651).
3.3. Environmental Knowledge, Perception, and Behaviour
For environmental concepts, the respondents had an overall mean score of 4.28 (SD = 1.72). The respondents got more correct answers for concepts such as climate change (88.15%) and green spaces (81.04%), while they got the least correct answers for urban sprawl (33.78%). The respondents shared that they have “little” to a “fair” amount of knowledge about the three major environmental laws in the Philippines. According to the respondents, environmental conditions in Calamba City have gotten “worse”, except for water shortage and the quality of public, green, and open spaces, which has “stayed the same” and has gotten “better”, respectively. Overall, the respondents encourage people to protect the environment “often”, while they “never” join or donate money or time to environmental or conservation organisations.
3.4. Valuation of Ecosystem Services (ES) and Disservices (EDS)
The respondents assigned a mean value of 7.25 (N = 675, SD = 2.1) to ES and a mean value of 5.85 (N = 675, SD = 2.4) to EDS. A Mann–Whitney U test [43] confirmed that the median of ES means (7.78) was statistically significantly higher than the median of EDS means (5.95), U = 150765.5, z = −10.76, p < 0.001.
3.4.1. Ecosystem Services (ES)
The ability of the park to provide a place for enjoyment and spending free time had the highest mean out of all the ES (N = 675, M = 8.32, SD = 2.23), while the ability of the park to serve as a water recharge area had the lowest (N = 675, M = 6.16, SD = 3.08).
In terms of ES types, cultural had the highest mean (N = 675, M = 7.69, SD = 2.7). It was followed by non-use (N = 675, M = 7.43, SD = 2.38); economic (N = 675, M = 7.2, SD = 2.15); security (N = 675, M = 6.68, SD = 2.6); and regulating (N = 675, M = 6.54, SD = 2.7). A Kruskal–Wallis test [44] confirmed that the median ES values scores were statistically significantly different among the ES types, χ2(4) = 92.283, p = < 0.001. Post hoc analysis (Dunn’s (1964) procedure with a Bonferroni correction, [46]) revealed statistically significant differences in median values between regulating (6.88) and economic ES (7.57) (p = 0.003), non-use ES (8.00) (p < 0.001), and cultural (8.31) ES (p < 0.001), security (7.07) and non-use ES (8.00) (p < 0.001) and cultural ES (8.31) (p < 0.001), and economic (7.57) and non-use ES (8.00) (p < 0.001) and cultural ES (8.31) (p < 0.001).
A comparison of how each stakeholder group values the different types of ES is in Figure 4. All the stakeholder groups except for city office employees assigned the highest values to cultural ES, followed by non-use, economic, security, and regulating ES. City office employees assigned higher values to non-use than cultural ES, followed by economic, security, and regulating ES. Based on Kruskal–Wallis H tests, there was no significant difference in how barangays closest to the park value the different types of ES, χ2(4) = 1.345, p = 0.854. It was the same for city office employees, χ2(4) = 4.809, p = 0.307. However, there was a significant difference in how the barangays far from the park valued the different types of ES, χ2(4) = 17.420, p = 0.002). Pairwise comparisons using Dunn’s (1964) procedure with a Bonferroni correction for multiple comparisons revealed statistically significant differences in the values given by barangays far from the park to security (mean rank = 178.59) and cultural ES (244.65) (p = 0.003) and regulating (181.27) and cultural ES (244.65) (p = 0.006).
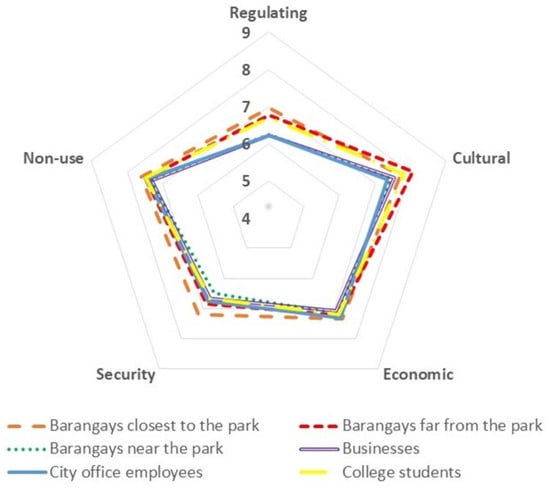
Figure 4.
Comparison of the mean values assigned by stakeholder groups to the five types of ES.
There was also a significant difference in how the barangays near the park value the different types of ES, χ2(4) = 24.753, p < 0.001. Pairwise comparisons using Dunn’s (1964) procedure with a Bonferroni correction for multiple comparisons revealed statistically significant differences in the values given to regulating (mean rank = 418.88) and cultural ES (523.11) (p = 0.002) and non-use ES (527.13) (p = 0.001) and security (435.20) and cultural ES (523.11) (p = 0.018) and non-use ES (527.13) (p = 0.011). College students also value the different types of ES differently, χ2(4) = 43.740, p < 0.001. There were statistically significant differences in the values given by college students to regulating (mean rank = 639.98) and economic ES (705.87) (p < 0.001) and cultural ES (832.40) (p < 0.001), security (649.96) and non-use ES (783.28) (p = 0.001) and cultural ES (823.40) (p < 0.001), and economic (705.87) and cultural ES (823.40) (p = 0.007).
One-way analysis of variance (ANOVA) was applied to the values given by businesses, since the data follow a normal distribution. Values increased from regulating (n = 46, M = 6.22, SD = 2.53) to security (n = 46, M = 6.68, SD = 2.37), economic (n = 46, M = 7.09, SD = 2.08), non-use (n = 46, M = 7.31, SD = 2.17) to cultural (n = 46, M = 7.54, SD = 1.91). There was a homogeneity of variances, as assessed by Levene’s test for equality of variances (p = 0.277). The values given by businesses to the different ES were statistically significantly different F(4, 225) = 2.575, p = 0.039, ω2 = 0.027. However, only the difference between the values for cultural and regulating ES of 1.32 (95% CI, 0.04 to 0.59) was significant (p = 0.038).
3.4.2. Ecosystem Disservices (EDS)
In terms of individual EDS, the risk of the park providing space for anti-social behaviour, crime, and other illegal things had the highest mean (N = 675, M = 6.41, SD = 3.12), while the idea that the park is wasting the land that could have been used for other purposes had the lowest (N = 675, M = 5.18, SD = 3.29).
Psychological EDS had the highest mean (N = 675, M = 5.98, SD = 2.45). It was followed by health EDS (N = 675, M = 5.74, SD = 3.09) and economic EDS (N = 675, M = 5.18, SD = 3.29). A Kruskal–Wallis test revealed that the mean ranks of the EDS values were statistically significantly different among the different types, χ2(2) = 18.309, p = < 0.001. Post hoc analysis (Dunn’s (1964) procedure with a Bonferroni correction) confirmed statistically significant differences between economic (mean rank = 936.62) and health (1035.28) (p = 0.006) and psychological EDS (1067.11) (p < 0.001).
A comparison of how each stakeholder group values the different types of EDS is in Figure 5. All the stakeholder groups assigned higher values to psychological EDS, followed by economic and health EDS. Kruskal–Wallis H tests revealed that there was no significant difference in how barangays closest to the park value the different types of EDS, χ2(4) = 0.408, p = 0.816. It was the same for barangays near the park, χ2(2) = 4.161, p = 0.125; businesses, χ2(2) = 1.051, p = 0.591; and city office employees, χ2(2) = 4.164, p = 0.125. In contrast, there was a significant difference in how the barangays far from the park valued the different types of ES, χ2(2) = 6.086, p = 0.048. There was also a significant difference in how college students value the different types of ES, χ2(2) = 7.021, p = 0.030. Pairwise comparisons using Dunn’s (1964) procedure with a Bonferroni correction revealed a statistically significant difference in the values assigned by college students to economic (mean rank = 401.90) and health ES (440.31) (p = 0.031).
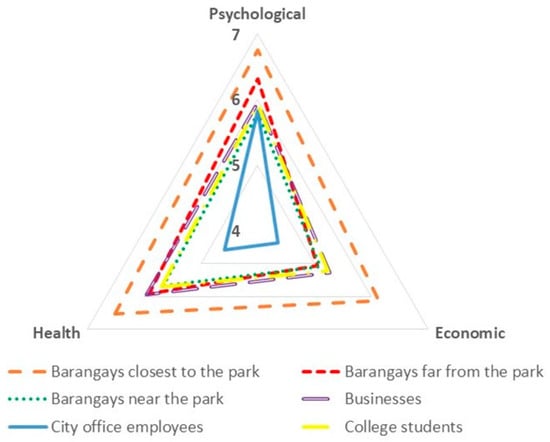
Figure 5.
Comparison of the mean values assigned by stakeholder groups to the three types of EDS.
3.5. Conditions Leading to the High Valuation of ES and EDS
Table 4 and Table 5 present the results of the fsQCA for the conditions leading to a high valuation of ES and EDS, respectively. The truth tables generated by the software are in the Supplementary Materials.
Table 4.
The conditions leading to the high valuation of the parks ES based on the fsQCA.
Table 5.
The conditions leading to the high valuation of the parks EDS based on the fsQCA.
4. Discussion
4.1. Valuation of ES and EDS
Results suggest that respondents value the park’s ES more than they worry about its EDS. Overall, respondents value cultural ES the highest and the regulating ES the lowest. Zhang et al. (2020) [47] and Schmidt et al. (2016) [48] also found that cultural ES are the most valued services in urban green spaces in China and Scotland, respectively. Regulating ES might have been valued the least because respondents understand the park experientially and not functionally [49]. In a study by Zagarola et al. (2014) [50], they found that cultural ES of watersheds were the most understood, while the regulating ES were the least understood by people.
While there were no statistically significant differences in how each stakeholder group valued a specific type of ES, it is worth mentioning that all ES types, except for cultural ES, were valued the highest by barangays closest to the park. These findings suggest that people’s appreciation of the park’s ES is related to their proximity to the area. A similar point is made by Bogdan et al. (2019) [23], Johnson et al. (2019) [51], and Swapan et al. (2017) [52]. Cultural ES were valued the highest by barangays far from the park, suggesting that the appreciation of this type of ES extends beyond the proximity to the park. Unexpectedly, economic ES were valued the lowest by businesses. It might have been because the economic ES that were included in the survey were not directly related to a possible increase in the revenue of the businesses. It is important to note that businesses were not able to contribute to the list of ES and EDS of the park since they refused interviews during the early stages of the research. It was an advantage that at the initial stages of the research, two methods were used to create the list of park ES and EDS. First, the key informants were asked directly what benefits and disbenefits they think the park has. To ensure not to miss any ES and EDS, common park ES and EDS from the literature were compiled, and respondents were asked if they think the park has them. These findings highlight the importance of involving the different stakeholder groups in developing a list of ES and EDS for a valuation survey [53,54]. All the stakeholder groups, except for city office employees, assigned the highest value to the cultural ES. The city office employees assigned the highest value to non-use ES. All the stakeholder groups assigned the least value to the regulating ES. Based on the results, barangays closest to the park and city office employees value each ES type equally, while other stakeholder groups favour cultural ES over regulating ES and other ES types.
For the EDS, the respondents were most concerned with psychological EDS and least worried about economic EDS. Psychological EDS can be considered very similar to cultural ES as they are also intangible and sometimes abstract. There were also no statistically significant differences in how each stakeholder group value a specific type of EDS. Still, it was found that all the types of EDS were valued the highest by barangays closest to the park. This result suggests that, similar to ES, people’s concern about the park’s ES is related to their proximity to the area. All the stakeholder groups assigned the highest value to the psychological EDS and the least value to health EDS. Based on the results, all the stakeholder groups, except for barangays far from the park, value each EDS type equally.
4.2. Conditions Leading to High ES and EDS Values
The top two configurations of socio-economic characteristics with the highest consistencies in causing a high valuation to ES and EDS were the same–not having a prosocial orientation and being a local resident and not having a prosocial orientation, living near the park, and not owning a house. These findings demonstrate that while exposure to green areas could influence the adoption of prosocial behaviours [55,56], this prosocial orientation does not, in turn, lead to the high valuation of the park’s ES or even deep concern about its EDS. A person does not need to have a prosocial orientation to appreciate the park’s ES highly and worry much about its EDS. Moreover, the presence of conditions such as being a local resident and living near the park suggests the influence of place attachment on how respondents gauge the importance of ES and their concern for EDS. Place attachment is a person’s unique connection with nature or a certain area, which develops when the place can supply or support their demands or intentional use and activities. Studies have shown that place attachment increases people’s concern about ecological values [41]. Not owning a house appears to be sufficient in causing a high valuation to ES and EDS when combined with a non-prosocial orientation and living near the park. A related study by Gashu et al. (2020) [57] found the opposite—owning a house positively influences the perception of the presence or absence of green infrastructure ES. However, it did not discuss how it can combine with other socio-economic characteristics. Another condition appearing in both solutions for high ES and EDS is the high educational level. Several studies support that people with higher educational attainment tend to value ES more [53,58,59]. They are also more willing to use green infrastructure and participate in urban green infrastructure development [57].
Results from the fsQCA indicated that visiting the park is necessary to cause a respondent to value the ES of Jose Rizal Plaza highly. This result suggests that a person needs to have a direct experience with the park to appreciate its ES. Visiting the park can also combine with not visiting other parks, not frequently visiting the park, and knowing or not knowing the previous land use in the area to cause the outcome. When it comes to the high valuation to EDS, two conditions were necessary—not knowing the previous land use in the area where the park is built and visiting the park. This result suggests that direct experience is also necessary to assign worries to the park EDS and that knowledge about the previous land use does not influence the high valuation to park EDS. There are no previous studies to directly compare these results with as this study pioneers the use of fsQCA in determining the configuration of conditions that lead to a high valuation to ES and EDS. However, in a study by Zhang et al. (2016) [60], they also concluded that a direct experience with a land use could result in high recognition of its ES. Swapan et al. (2017) [52], on the other hand, found that the frequency of visits to an urban park influences users’ perception of the importance of its ES.
The configurations of environmental knowledge, perception, and behaviour leading to the high valuation of ES were the same as that of the EDS. In other words, the same combinations of conditions lead to an increased appreciation for the park’s benefits and a deep concern for its EDS. Results suggest that those who believe that environmental conditions in the city are getting worse and admit that they have not been practising pro-environmental activities cause them to appreciate the current park ES and worry that park EDS will worsen. Duan et al. (2018) [61] also found that negative perceptions about how environmental issues are progressing could lead to an appreciation of the benefits of green infrastructure. The combination of strong knowledge about environmental concepts and the belief that the city’s environmental conditions are getting worse also caused high values to ES and EDS. Studies by Miller and Montalto (2019) [59] and Ruiz-Frau et al. (2018) [14] also asserted that environmental knowledge increases the importance value that the public assigns to ES. The other two configurations suggest that the power of knowing environmental concepts in causing a high valuation to ES and EDS is equivalent to having knowledge of environmental laws and practising pro-environmental activities.
4.3. Limitations and Future Studies
While the survey has outstanding value, it also has several limitations. First, since it was only administered online because of the pandemic, the respondents were limited to those who can use mobile phones, tablets, laptops, or computers and those who have access to the internet. Thus, it might not have been able to capture a representative sample of the stakeholders of the park. Second, because the survey was conducted when the residents of the city were restricted to visit parks due to the pandemic, their opinions about ES and EDS and their willingness to contribute might have been skewed. The third set of limitations is typical of self-administered surveys–questions could be misinterpreted, and answers could exclusively be stated preferences and not how they are in real life. Future SCV studies should always aim to represent as many stakeholder groups as possible and involve them in identifying ES and EDS in the ecosystem under study. Deliberative forms of value elicitation could also be explored to gain insight into how interaction could impact assigned values to ES and EDS.
5. Survey Value
The academic value of the survey comes from filling in the gaps of previous socio-cultural valuation studies and the novel way of analysing conditions that cause a high valuation to ES and EDS. It provides in-depth insights about a large number of stakeholders who engage with the park—findings that could then be compared with other studies in the literature. The survey involved as many types of stakeholder groups as possible, a characteristic that is usually missing in previous socio-cultural valuation studies [23,62]. EDS, which are typically overlooked in valuation studies [30], were included in the assessment. Additionally, stakeholder groups were involved in creating the list of the park ES and EDS through key informant interviews that were undertaken at the initial stages of the study. Some studies in the past only used predetermined lists from literature [23,51]. For the analysis, it was the first time that fsQCA was used to analyse conditions affecting the valuation to ES and EDS. It proved useful as it highlights that the assigned values to ES and EDS are not caused by individual factors, but a complex combination of conditions. Another value of the survey is that it was able to capture the values assigned to the ES and EDS of an urban park during a global pandemic, which limited people’s ability to visit such important urban resources.
For the city, the survey results provided baseline information on how residents utilise the park and which ES and EDS they value most. The survey provided insights as to which amenities they could maintain and enhance and which to improve. Results of the survey also inform the city about the importance of making sure that the park is accessible to residents, as a direct experience with the park enhances the residents’ appreciation of its ES and EDS. The survey also provides information on the combination of conditions leading to a high valuation of ES and EDS. This information could help the city develop strategies to improve residents’ appreciation of parks and even their participation in initiatives related to green spaces or urban green infrastructure.
Supplementary Materials
The following supporting information can be downloaded at: https://www.mdpi.com/article/10.3390/su142113711/s1. References [63,64,65,66,67,68,69,70,71,72,73,74,75] are cited in the supplementary materials.
Author Contributions
Conceptualisation, methodology, project administration, and resources, all authors; investigation, writing—original draft preparation, and visualisation, D.E.B.; writing—review and editing, supervision, funding acquisition, M.D.B., J.L., R.S. and A.T. All authors have read and agreed to the published version of the manuscript.
Funding
The study was funded by the School of Animal, Rural, and Environmental Sciences at Nottingham Trent University.
Institutional Review Board Statement
The study was approved by the Nottingham Trent University Ethical Review Committee under project number ARE917 (16 December 2019).
Informed Consent Statement
Informed consent was obtained from all individual participants involved in the study.
Data Availability Statement
The datasets generated during and/or analysed during the current study are available from the corresponding author on reasonable request.
Acknowledgments
The authors would like to thank the city office of Calamba for their permission to conduct the study and the respondents of the survey.
Conflicts of Interest
The authors declare no conflict of interest.
References
- Ives, C.D.; Oke, C.; Hehir, A.; Gordon, A.; Wang, Y.; Bekessy, S.A. Capturing residents’ values for urban green space: Mapping, analysis and guidance for practice. Landsc. Urban Plan. 2017, 161, 32–43. [Google Scholar] [CrossRef]
- Olbińska, K. The Value of Urban Parks in Lodz. Real Estate Manag. Valuat. 2018, 26, 73–86. [Google Scholar] [CrossRef]
- MEA. Ecosystems and Human Well-being Millennium Ecosystem Assessment Ecosystems and Human Well-being, Washington. 2005. Available online: www.islandpress.org (accessed on 21 May 2019).
- TEEB. The Economics of Ecosystems and Biodiversity: Mainstreaming the Economics of Nature: A Synthesis of the Approach, Conclusions and Recommendations of TEEB; UNEP: Geneva, Switzerland, 2010. [Google Scholar]
- Hirons, M.; Comberti, C.; Dunford, R. Valuing Cultural Ecosystem Services. Annu. Rev. Environ. Resour. 2016, 41, 545–574. [Google Scholar] [CrossRef]
- Small, N.; Munday, M.; Durance, I. The challenge of valuing ecosystem services that have no material benefits. Glob. Environ. Chang. 2017, 44, 57–67. [Google Scholar] [CrossRef]
- Schröter, M.; van der Zanden, E.H.; van Oudenhoven, A.P.E.; Remme, R.P.; Serna-Chavez, H.M.; de Groot, R.S.; Opdam, P. Ecosystem Services as a Contested Concept: A Synthesis of Critique and Counter-Arguments. Conserv. Lett. 2014, 7, 514–523. [Google Scholar] [CrossRef]
- Lyytimäki, J.; Sipilä, M. Hopping on one leg—The challenge of ecosystem disservices for urban green management. Urban For. Urban Green. 2009, 8, 309–315. [Google Scholar] [CrossRef]
- Liu, H.; Hu, Y.; Li, F.; Yuan, L. Associations of multiple ecosystem services and disservices of urban park ecological infrastructure and the linkages with socioeconomic factors. J. Clean. Prod. 2018, 174, 868–879. [Google Scholar] [CrossRef]
- Von Döhren, P.; Haase, D. Ecosystem disservices research: A review of the state of the art with a focus on cities. Ecol. Indic. 2015, 52, 490–497. [Google Scholar] [CrossRef]
- Brown, T.C. The Concept of Value in Resource Allocation. Land Econ. 1984, 60, 231. [Google Scholar] [CrossRef]
- Sánchez-Fernández, R.; Iniesta-Bonillo, M.Á. The concept of perceived value: A systematic review of the research. Mark. Theory 2007, 7, 427–451. [Google Scholar] [CrossRef]
- Hodgson, S.M.; Maltby, L.; Paetzold, A.; Phillips, D. Getting a measure of nature: Cultures and values in an ecosystem services approach. Interdiscip. Sci. Rev. 2012, 32, 249–262. [Google Scholar] [CrossRef]
- Ruiz-Frau, A.; Krause, T.; Marbà, N. The use of sociocultural valuation in sustainable environmental management. Ecosyst. Serv. 2018, 29, 158–167. [Google Scholar] [CrossRef]
- Iniesta-Arandia, I.; García-Llorente, M.; Aguilera, P.A.; Montes, C.; Martín-López, B. Socio-cultural valuation of ecosystem services: Uncovering the links between values, drivers of change, and human well-being. Ecol. Econ. 2014, 108, 36–48. [Google Scholar] [CrossRef]
- Engström, G.; Gren, A. Capturing the value of green space in urban parks in a sustainable urban planning and design context: Pros and cons of hedonic pricing. Ecol. Soc. 2017, 22. [Google Scholar] [CrossRef]
- Chiesura, A. The role of urban parks for the sustainable city. Landsc. Urban Plan. 2004, 68, 129–138. [Google Scholar] [CrossRef]
- Mariejo Ramos. A paved forest? ‘Redevelopment’ of Arroceros Park Questioned | Inquirer News. 21 November 2021. Available online: https://newsinfo.inquirer.net/1517819/a-paved-forest-arroceros-parks-redevelopment-questioned (accessed on 21 August 2022).
- Chen, B.; Qi, X. Protest response and contingent valuation of an urban forest park in Fuzhou City, China. Urban For. Urban Green. 2018, 29, 68–76. [Google Scholar] [CrossRef]
- Cornelis, J.; Hermy, M. Biodiversity relationships in urban and suburban parks in Flanders. Landsc. Urban Plan. 2004, 69, 385–401. [Google Scholar] [CrossRef]
- Prather, H.M.; Eppley, S.M.; Rosenstiel, T.N. Urban forested parks and tall tree canopies contribute to macrolichen epiphyte biodiversity in urban landscapes. Urban For. Urban Green. 2018, 32, 133–142. [Google Scholar] [CrossRef]
- Sutton, P.C.; Anderson, S.J. Holistic valuation of urban ecosystem services in New York City’s Central Park. Ecosyst. Serv. 2016, 19, 87–91. [Google Scholar] [CrossRef]
- Bogdan, S.M.; Stupariu, I.; Andra-Topârceanu, A.; Năstase, I.I. Mapping social values for cultural ecosystem services in a mountain landscape in the Romanian Carpathians. Carpathian J. Earth Environ. Sci. 2019, 14, 199–208. [Google Scholar] [CrossRef]
- Gonzales, L.P.; Magnaye, D.C. Measuring the Urban Biodiversity of Green Spaces in a Highly Urbanizing Environment and Its Implications for Human Settlement Resiliency Planning: The Case of Manila City, Philippines. Procedia Environ. Sci. 2017, 37, 83–100. [Google Scholar] [CrossRef]
- Gonzales, L.; Magnaye, D. Challenges to the Multi-Functional Uses and Multifarious Benefits of Urban Green Spaces: Basis of Urban Biodiversity Planning and Management in the City of Manila, Philippines. Int. J. Environ. Sci. Sustain. Dev. 2016, 1, 69. [Google Scholar] [CrossRef]
- Membrebe, Z.O.; Santos, A.J.G.; Valeroso, J.C.C.; Ancheta, A.A. Urban Forest Park As Eco-Space for Liveable City: Arroceros forest park, Manila, Philippines. Int. J. Real Estate Stud. 2017, 11, 2017. [Google Scholar]
- Abuan, M.V.; Galingan, Z.D. Converging social classes through humanized urban edges. IOP Conf. Ser. Earth Environ. Sci. 2017, 91, 12013. [Google Scholar] [CrossRef]
- Lagbas, A.J. Social valuation of regulating and cultural ecosystem services of Arroceros Forest Park: A man-made forest in the city of Manila, Philippines. J. Urban Manag. 2019, 8, 159–177. [Google Scholar] [CrossRef]
- Calamba City. Comprehensive Land Use Plan (2017–2026); Calamba City: Calamba, Philippines, 2017. [Google Scholar]
- Oteros-Rozas, E.; Martín-López, B.; González, J.A.; Plieninger, T.; López, C.A.; Montes, C. Socio-cultural valuation of ecosystem services in a transhumance social-ecological network. Reg. Environ. Chang. 2014, 14, 1269–1289. [Google Scholar] [CrossRef]
- Murphy, R.O.; Ackermann, K.A. Social Value Orientation. Personal. Soc. Psychol. Rev. 2013, 18, 13–41. [Google Scholar] [CrossRef]
- Frick, J.; Kaiser, F.G.; Wilson, M. Environmental knowledge and conservation behavior: Exploring prevalence and structure in a representative sample. Pers. Individ. Dif. 2004, 37, 1597–1613. [Google Scholar] [CrossRef]
- Zsóka, Á.; Szerényi, Z.M.; Széchy, A.; Kocsis, T. Greening due to environmental education? Environmental knowledge, attitudes, consumer behavior and everyday pro-environmental activities of Hungarian high school and university students. J. Clean. Prod. 2013, 48, 126–138. [Google Scholar] [CrossRef]
- Carlsen, L.; Bruggemann, R. Environmental perception in 33 European countries: An analysis based on partial order. Environ. Dev. Sustain. 2020, 22, 1873–1896. [Google Scholar] [CrossRef]
- Dlamini, S.; Tesfamichael, S.G.; Shiferaw, Y.; Mokhele, T. Determinants of environmental perceptions and attitudes in a socio-demographically diverse urban setup: The case of Gauteng province, South Africa. Sustainability 2020, 12, 3613. [Google Scholar] [CrossRef]
- Liang, S.W.; Fang, W.T.; Yeh, S.C.; Liu, S.Y.; Tsai, H.M.; Chou, J.Y.; Ng, E. A nationwide survey evaluating the environmental literacy of undergraduate students in Taiwan. Sustainability 2018, 10, 1730. [Google Scholar] [CrossRef]
- Murphy, T.; Fredin, T. Minnesota Report Card on Environmental Literacy knowledge, Attitudes and Behavior; Minnesota Pollution Control Agency: St. Paul, MN, USA, 2004; pp. 1–53. [Google Scholar]
- Langemeyer, J.; Baró, F.; Roebeling, P.; Gómez-Baggethun, E. Contrasting values of cultural ecosystem services in urban areas: The case of park Montjuïc in Barcelona. Ecosyst. Serv. 2015, 12, 178–186. [Google Scholar] [CrossRef]
- Schmidt, K.; Walz, A.; Martín-López, B.; Sachse, R. Testing socio-cultural valuation methods of ecosystem services to explain land use preferences. Ecosyst. Serv. 2017, 26, 270–288. [Google Scholar] [CrossRef]
- Forest Foundation Philippines; Alliance for Safe, Sustainable and Resilient Environments, Inc.; Philippine Association of Landscape Architects; Philippine Institute of Environmental Planners. Public Parks, Open and Green Spaces: A Planning and Development Guide; Alliance for Safe, Sustainable, and Resilient Environments Inc.: Makati City, Philippines, 2019; ISBN 9786219608008. [Google Scholar]
- Kati, V.; Jari, N. Bottom-up thinking-Identifying socio-cultural values of ecosystem services in local blue-green infrastructure planning in Helsinki, Finland. Land Use Policy 2016, 50, 537–547. [Google Scholar] [CrossRef]
- Shapiro, S.S.; Wilk, M.B. An analysis of variance test for normality (complete samples). Biometrika 1965, 54, 591–611. [Google Scholar] [CrossRef]
- Mann, H.B.; Whitney, D.R. On a test of whether one of two-random variables is stochastically larger than the other. Annu. Math. Stat. 1947, 181, 50–60. [Google Scholar] [CrossRef]
- Kruskal, W.H.; Wallis, W.A. Use of ranks in one-criterion variance analysis. J. Am. Stat. Assoc. 1952, 47, 583–621. [Google Scholar] [CrossRef]
- Ragin, C.; Davey, S. fs/QCA Software Version 3.1b. 2019. Available online: http://www.socsci.uci.edu/~cragin/fsQCA/software.shtml (accessed on 28 November 2020).
- Dunn, O.J. Multiple comparisons using rank sums. Technometrics 1964, 6, 241–252. [Google Scholar] [CrossRef]
- Zhang, X.; Ni, Z.; Wang, Y.; Chen, S.; Xia, B. Public perception and preferences of small urban green infrastructures: A case study in Guangzhou, China. Urban For. Urban Green. 2020, 53, 126700. [Google Scholar] [CrossRef]
- Schmidt, K.; Walz, A.; Jones, I.; Metzger, M.J. The Sociocultural Value of Upland Regions in the Vicinity of Cities in Comparison with Urban Green Spaces. Mt. Res. Dev. 2016, 36, 465–474. [Google Scholar] [CrossRef]
- van Vliet, K.; Hammond, C. Residents’ perceptions of green infrastructure in the contemporary residential context: A study of Kingswood, Kingston-upon-Hull, England. J. Environ. Plan. Manag. 2020, 64, 145–163. [Google Scholar] [CrossRef]
- Zagarola, J.P.A.; Anderson, C.B.; Veteto, J.R. Perceiving patagonia: An assessment of social values and perspectives regarding watershed ecosystem services and management in Southern South America. Environ. Manag. 2014, 53, 769–782. [Google Scholar] [CrossRef] [PubMed]
- Johnson, D.N.; van Riper, C.J.; Chu, M.; Winkler-Schor, S. Comparing the social values of ecosystem services in US and Australian marine protected areas. Ecosyst. Serv. 2019, 37, 100919. [Google Scholar] [CrossRef]
- Swapan, M.S.H.; Iftekhar, M.S.; Li, X. Contextual variations in perceived social values of ecosystem services of urban parks: A comparative study of China and Australia. Cities 2017, 61, 17–26. [Google Scholar] [CrossRef]
- Maestre-Andrés, S.; Calvet-Mir, L.; van den Bergh, J.C.J.M. Sociocultural valuation of ecosystem services to improve protected area management: A multi-method approach applied to Catalonia, Spain. Reg. Environ. Chang. 2016, 16, 717–731. [Google Scholar] [CrossRef]
- Sun, X.; Li, S.; Yu, J.; Fang, Y.; Zhang, Y.; Cao, M. Evaluation of ecosystem service value based on land use scenarios: A case study of qianjiangyuan national park pilot. Biodivers. Sci. 2019, 27, 51–63. [Google Scholar] [CrossRef]
- Putra, G.N.E.; Astell-Burt, T.; Cliff, D.P.; Vella, S.A.; John, E.E.; Feng, X. The relationship between green space and prosocial behaviour among children and adolescents: A systematic review. Front. Psychol. 2020, 11, 859. [Google Scholar] [CrossRef]
- Van Aart, C.J.C.; Michels, N.; Sioen, I.; De Decker, A.; Bijnens, E.M.; Janssen, B.G.; De Henauw, S.; Nawrot, T.S. Residential landscape as a predictor of psychosocial stress in the life course from childhood to adolescence. Environ. Int. 2018, 120, 456–463. [Google Scholar] [CrossRef]
- Gashu, K.; Gebre-Egziabher, T.; Wubneh, M. Local communities’ perceptions and use of urban green infrastructure in two Ethiopian cities: Bahir Dar and Hawassa. J. Environ. Plan. Manag. 2020, 63, 287–316. [Google Scholar] [CrossRef]
- Chen, Y.; Ke, X.; Min, M.; Cheng, P. Disparity in Perceptions of Social Values for Ecosystem Services of Urban Green Space: A Case Study in the East Lake Scenic Area, Wuhan. Front. Public Health 2020, 8, 370. [Google Scholar] [CrossRef]
- Miller, S.M.; Montalto, F.A. Stakeholder perceptions of the ecosystem services provided by Green Infrastructure in New York City. Ecosyst. Serv. 2019, 37, 100928. [Google Scholar] [CrossRef]
- Zhang, W.; Kato, E.; Bhandary, P.; Nkonya, E.; Ibrahim, H.I.; Agbonlahor, M.; Ibrahim, H.Y.; Cox, C. Awareness and perceptions of ecosystem services in relation to land use types: Evidence from rural communities in Nigeria. Ecosyst. Serv. 2016, 22, 150–160. [Google Scholar] [CrossRef]
- Duan, J.; Wang, Y.; Fan, C.; Xia, B.; de Groot, R. Perception of Urban Environmental Risks and the Effects of Urban Green Infrastructures (UGIs) on Human Well-being in Four Public Green Spaces of Guangzhou, China. Environ. Manag. 2018, 62, 500–517. [Google Scholar] [CrossRef]
- Bullock, C.; Joyce, D.; Collier, M. An exploration of the relationships between cultural ecosystem services, socio-cultural values and well-being. Ecosyst. Serv. 2018, 31, 142–152. [Google Scholar] [CrossRef]
- Rihoux, B.; Ragin, C. Configurational Comparative Methods: Qualitative Comparative Analysis (QCA) and Related Techniques; SAGE Publications, Inc.: Thousand Oaks, CA, USA, 2009; ISBN 9781412942355. [Google Scholar]
- Ragin, C. Redesigning Social Inquiry; University of Chicago Press: Chicago, IL, USA, 2008; ISBN 9780226702759. [Google Scholar]
- Ragin, C.; Drass, K.; Davey, S. User’s Guide to Fuzzy-Set/Qualitative Comparative Analysis; University of Arizona: Tucson, AZ, USA, 2008; pp. 1–87. [Google Scholar]
- Schneider, C.Q.; Wagemann, C. Standards of good practice in qualitative comparative analysis (QCA) and fuzzy-sets. Comp. Sociol. 2010, 9, 397–418. [Google Scholar] [CrossRef]
- Paykani, T.; Rafiey, H.; Sajjadi, H. A fuzzy set qualitative comparative analysis of 131 countries: Which configuration of the structural conditions can explain health better? Int. J. Equity Health 2018, 17, 10. [Google Scholar] [CrossRef]
- Ragin, C. Qualitative Comparative Analysis Using Fuzzy Sets. In Configurational Comparative Methods: Qualitative Comparative Analysis (QCA) and Related Techniques; Sage: Thousand Oaks, CA, USA, 2008; Volume 7, pp. 87–121. [Google Scholar]
- Grahn, P.; Stigsdotter, U.A. Landscape planning and stress. Urban For. Urban Green. 2003, 2, 1–18. [Google Scholar] [CrossRef]
- Schipperijn, J.; Stigsdotter, U.K.; Randrup, T.B.; Troelsen, J. Influences on the use of urban green space—A case study in Odense, Denmark. Urban For. Urban Green. 2010, 9, 25–32. [Google Scholar] [CrossRef]
- Baptiste, A.K.; Foley, C.; Smardon, R. Understanding urban neighborhood differences in willingness to implement green infrastructure measures: A case study of Syracuse, NY. Landsc. Urban Plan. 2015, 136, 1–12. [Google Scholar] [CrossRef]
- Wright Wendel, H.E.; Zarger, R.K.; Mihelcic, J.R. Accessibility and usability: Green space preferences, perceptions, and barriers in a rapidly urbanizing city in Latin America. Landsc. Urban Plan. 2012, 107, 272–282. [Google Scholar] [CrossRef]
- Lafortezza, R.; Carrus, G.; Sanesi, G.; Davies, C. Benefits and well-being perceived by people visiting green spaces in periods of heat stress. Urban For. Urban Green. 2009, 8, 97–108. [Google Scholar] [CrossRef]
- Lo, A.Y.; Jim, C.Y. Willingness of residents to pay and motives for conservation of urban green spaces in the compact city of Hong Kong. Urban For. Urban Green. 2010, 9, 113–120. [Google Scholar] [CrossRef]
- Ragin, C. Fuzzy-Set Social Science; University of Chicago Press: Chicago, IL, USA, 2000. [Google Scholar]
Publisher’s Note: MDPI stays neutral with regard to jurisdictional claims in published maps and institutional affiliations. |
© 2022 by the authors. Licensee MDPI, Basel, Switzerland. This article is an open access article distributed under the terms and conditions of the Creative Commons Attribution (CC BY) license (https://creativecommons.org/licenses/by/4.0/).