Article

Solar PV-Based Electric Vehicle Charging Station for Security Bikes: A Techno-Economic and Environmental Analysis

1
Department of Electrical Engineering, University of Azad Jammu and Kashmir, Muzaffarabad 13100, Pakistan
2
College of Energy and Electrical Engineering, Hohai University, Nanjing 211100, China
3
Department of Electrical Engineering, Balochistan University of Information Technology, Engineering and Management Sciences (BUITEMS), Quetta 87300, Pakistan
4
Electrical Engineering Department, Faculty of Engineering, Aswan University, Aswan 81542, Egypt
5
Department of Electrical Engineering, College of Engineering, Jouf University, Sakaka 72388, Saudi Arabia
6
AWCRC, Faculty of Engineering, Aswan University, Aswan 81542, Egypt
*
Authors to whom correspondence should be addressed.
Sustainability 2022, 14(21), 13767; https://doi.org/10.3390/su142113767
Submission received: 6 September 2022 / Revised: 11 October 2022 / Accepted: 18 October 2022 / Published: 24 October 2022
(This article belongs to the Special Issue Renewable Energy Conversion and Management)

Abstract

:
Electric vehicles (EVs) are becoming more attractive for a variety of reasons. One of the major advantages of EVs is that they emit fewer polluted gases. Other factors that must be addressed include an increase in fuel prices and a decline in energy resources such as fossil fuels. These characteristics have a greater impact on Pakistan’s clean and green image. Electric vehicles are becoming an attractive option for reducing global fossil fuel usage, as well as CO2 emissions, from road transportation. The electricity required to charge an EV’s battery is commonly sourced from the power grid. When EVs are charged by the electrical grid, there are significant power constraints in the system. To promote renewable energy consumption and reduce CO2 emissions, specific solar system-based charging stations should be designed. Other benefits of renewable energy generation include increased grid flexibility and reduced grid congestion. Moreover, the State of Azad Jammu and Kashmir, Pakistan, has a huge potential for solar energy. This article investigates the possibility of designing a solar photovoltaic-based EV charging station for security bikes located in the State of Azad Jammu and Kashmir, Pakistan. Before installing a PV charging station, the charging station’s feasibility must be studied. The proposed study also analyzes the power reliability, energy cost, and CO2 emissions of a PV-powered charging station. The proposed system’s outcomes are compared to grid-based charging stations. In comparison to other existing approaches, there is a significant reduction in greenhouse gas (GHG) emissions, including CO2, CO, SO2, and NOX. The proposed study anticipates the economic and environmental benefits of EV charging stations powered by renewable energy resources.

1. Introduction

1.1. General

The demand for energy increases with different technological advancements. The energy generation system that relies on fossil fuels (coal, gas, and oil) generates enough electricity to meet demand, but fossil fuel shortage is becoming a constraint [1,2]. Furthermore, the use of fossil fuels leads to the emission of greenhouse gases (GHGs), which are responsible for acid rain, global warming, and other long-term environmental issues [3,4]. As a result, scientists are attempting to develop alternative power sources that are both inexpensive and environmentally friendly in order to fulfill energy demand [5,6]. The combination of renewable energy sources (RESs) with conventional energy sources allows the power system to manage peak demand. Electric vehicles (EVs) are considered the wave of the future, since they emit no polluted gases, create very little noise, and have higher propulsion efficiency. EV technology’s environmentally beneficial features and efficient energy management have made it a feasible solution for the present global transportation system [7]. Many countries have already begun to deploy EV transportation systems in order to obtain the best energy solution. Compared to 2020, worldwide EV usage increased to 160 percent in 2021, with 2.6 million EVs sold [8]. Pakistan also started using EV technology to shift to a carbon-free transportation system [9]. Electric vehicles (EVs) are becoming increasingly popular in Pakistan due to their environmentally friendly and cost-effective characteristics. There are essentially two types of EVs in Pakistan: auto rickshaws and simple bikes [10].
Low maintenance costs and sustainability characterize the solar photovoltaic (PV) system. During the load-shedding period, an individual in metropolitan areas uses the PV system to supply their electrical loads [11]. Pakistan has a huge potential for renewable energy, especially solar energy. The government of Pakistan (GOP) has made the net metering scheme available to the general civic population in response to the rising level of use of the PV system, allowing for the PV system’s contribution to the national grid. Therefore, the most likely method for charging EVs is solar PV power [12,13]. To create photovoltaic EV charging stations, extensive research has been done [14,15]. An EV charging model that examines the impact and capacity outline for various degrees of EV penetration using both conservative sources and solar PV are proposed in [16,17]. According to the analysis, the load is increased by 2% when 15 EVs are integrated, but by 7% when 50 EVs are used [18]. The optimization method that reduces the time and money spent on charging has been studied in [19]. A 24 kW PV array has been integrated into a DC bus via a unidirectional DC/DC converter with a maximum power point tracking (MPPT) controller [20]. The power of an EV charging station for solar PV and battery energy storage systems (BESS) was designed and managed in [21]. A solar charging station with battery reserve that has a solar PV module with a rated power of 280 W, a 12 V battery, and a 130 Ah capacity is discussed in [22]. The goal of the project is to offer an effective, zero-emission EV charging station in metropolitan areas [23]. A 48 V battery set and two 200 W solar panels are used to power an automated switching system-based solar battery charging station [24]. The goal of the project is to provide renewable energy to both urban and rural areas [25]. When there is doubt about RESs, the automated switching system can switch the power connection from RESs to battery backup. In [26], which focuses on forming multiple RES-based EV charging stations to provide a resourceful energy system, the viability of another solar-based EV charging station is demonstrated using HOMER Pro 3.14 software [27]. Numerous studies have been carried out to improve renewable resource-based EV charging productivity in light of the study above [28,29,30,31]. A deep reinforcement learning-based fast charging constraint is proposed by the author for the fast charging of EVs. In another manuscript, an artificial intelligence-based scheme is suggested by the author for the management and manufacturing strategies for the long life of batteries [32,33]. The paper discusses the technical and financial impact of the PV system. The PV system produces electricity and hydrogen at five different locations in India. The paper also finds the optimal configuration of the system at various locations [34].

1.2. Research Contribution

Despite major contributions in previous studies, no similar work has been done for the charging station in the Azad Jammu and Kashmir (AJK) region. This section depicts the viability of solar-powered charging stations for electric vehicles and security bikes. The case study for this exploratory research focuses mostly on King Abdullah Campus at the University of Azad Jammu and Kashmir (UAJ&K). Even though the system has electric bikes for security, there is no charging station for these bikes. The deployment of PV-powered EV charging stations can alleviate the problem. Solar photovoltaic systems are anticipated to provide a solution to the world’s power shortage concerns, particularly in developing countries whose electricity infrastructure is not sufficiently resilient. The power quality and economic implications of the system’s development take center stage in this scenario, along with system sizing and optimal operation. Before studying the sociotechnical effects of the hybrid system on the community, the main objective is to develop an economically feasible system.
Solar PV systems assist to alleviate the power deficit problem by providing a continuous source of electricity for EV charging. This study optimizes the performance of solar PV charging stations in the actual world. In addition, studies show how to design solar PV charging stations for EVs, electric bikes, and other commercial facilities in the region. The outcomes show an energy-efficient, sustainable, and inexpensive method of using renewables, paving the way for increased usage of EVs and E-bikes. The proposed system also assesses solar energy’s economic and environmental impacts. A thorough study was carried out to find the best cost-effective and low-emission model design. The following are the major contributions of the proposed system.
The proposed system addresses the financial and technical parameters and provides solar PV-based energy solutions for EV charging.
  • The proposed system addresses economic and technological aspects, while also offering solar PV-based energy solutions for EV charging.
  • In the targeted location, it also recommends hybrid EV charging stations that are profitable.
  • The proposed system investigates the performance of unknown variance using sensitivity analysis.
  • The illustrated study also compares the environmental benefits of the new system to the old system in terms of GHG (CO2, CO, SO2, and NOX) emissions.
  • The suggested scheme addresses the policy implications of the proposed standalone hybrid charging model.

2. Methodology

This section explains the methodology in detail.

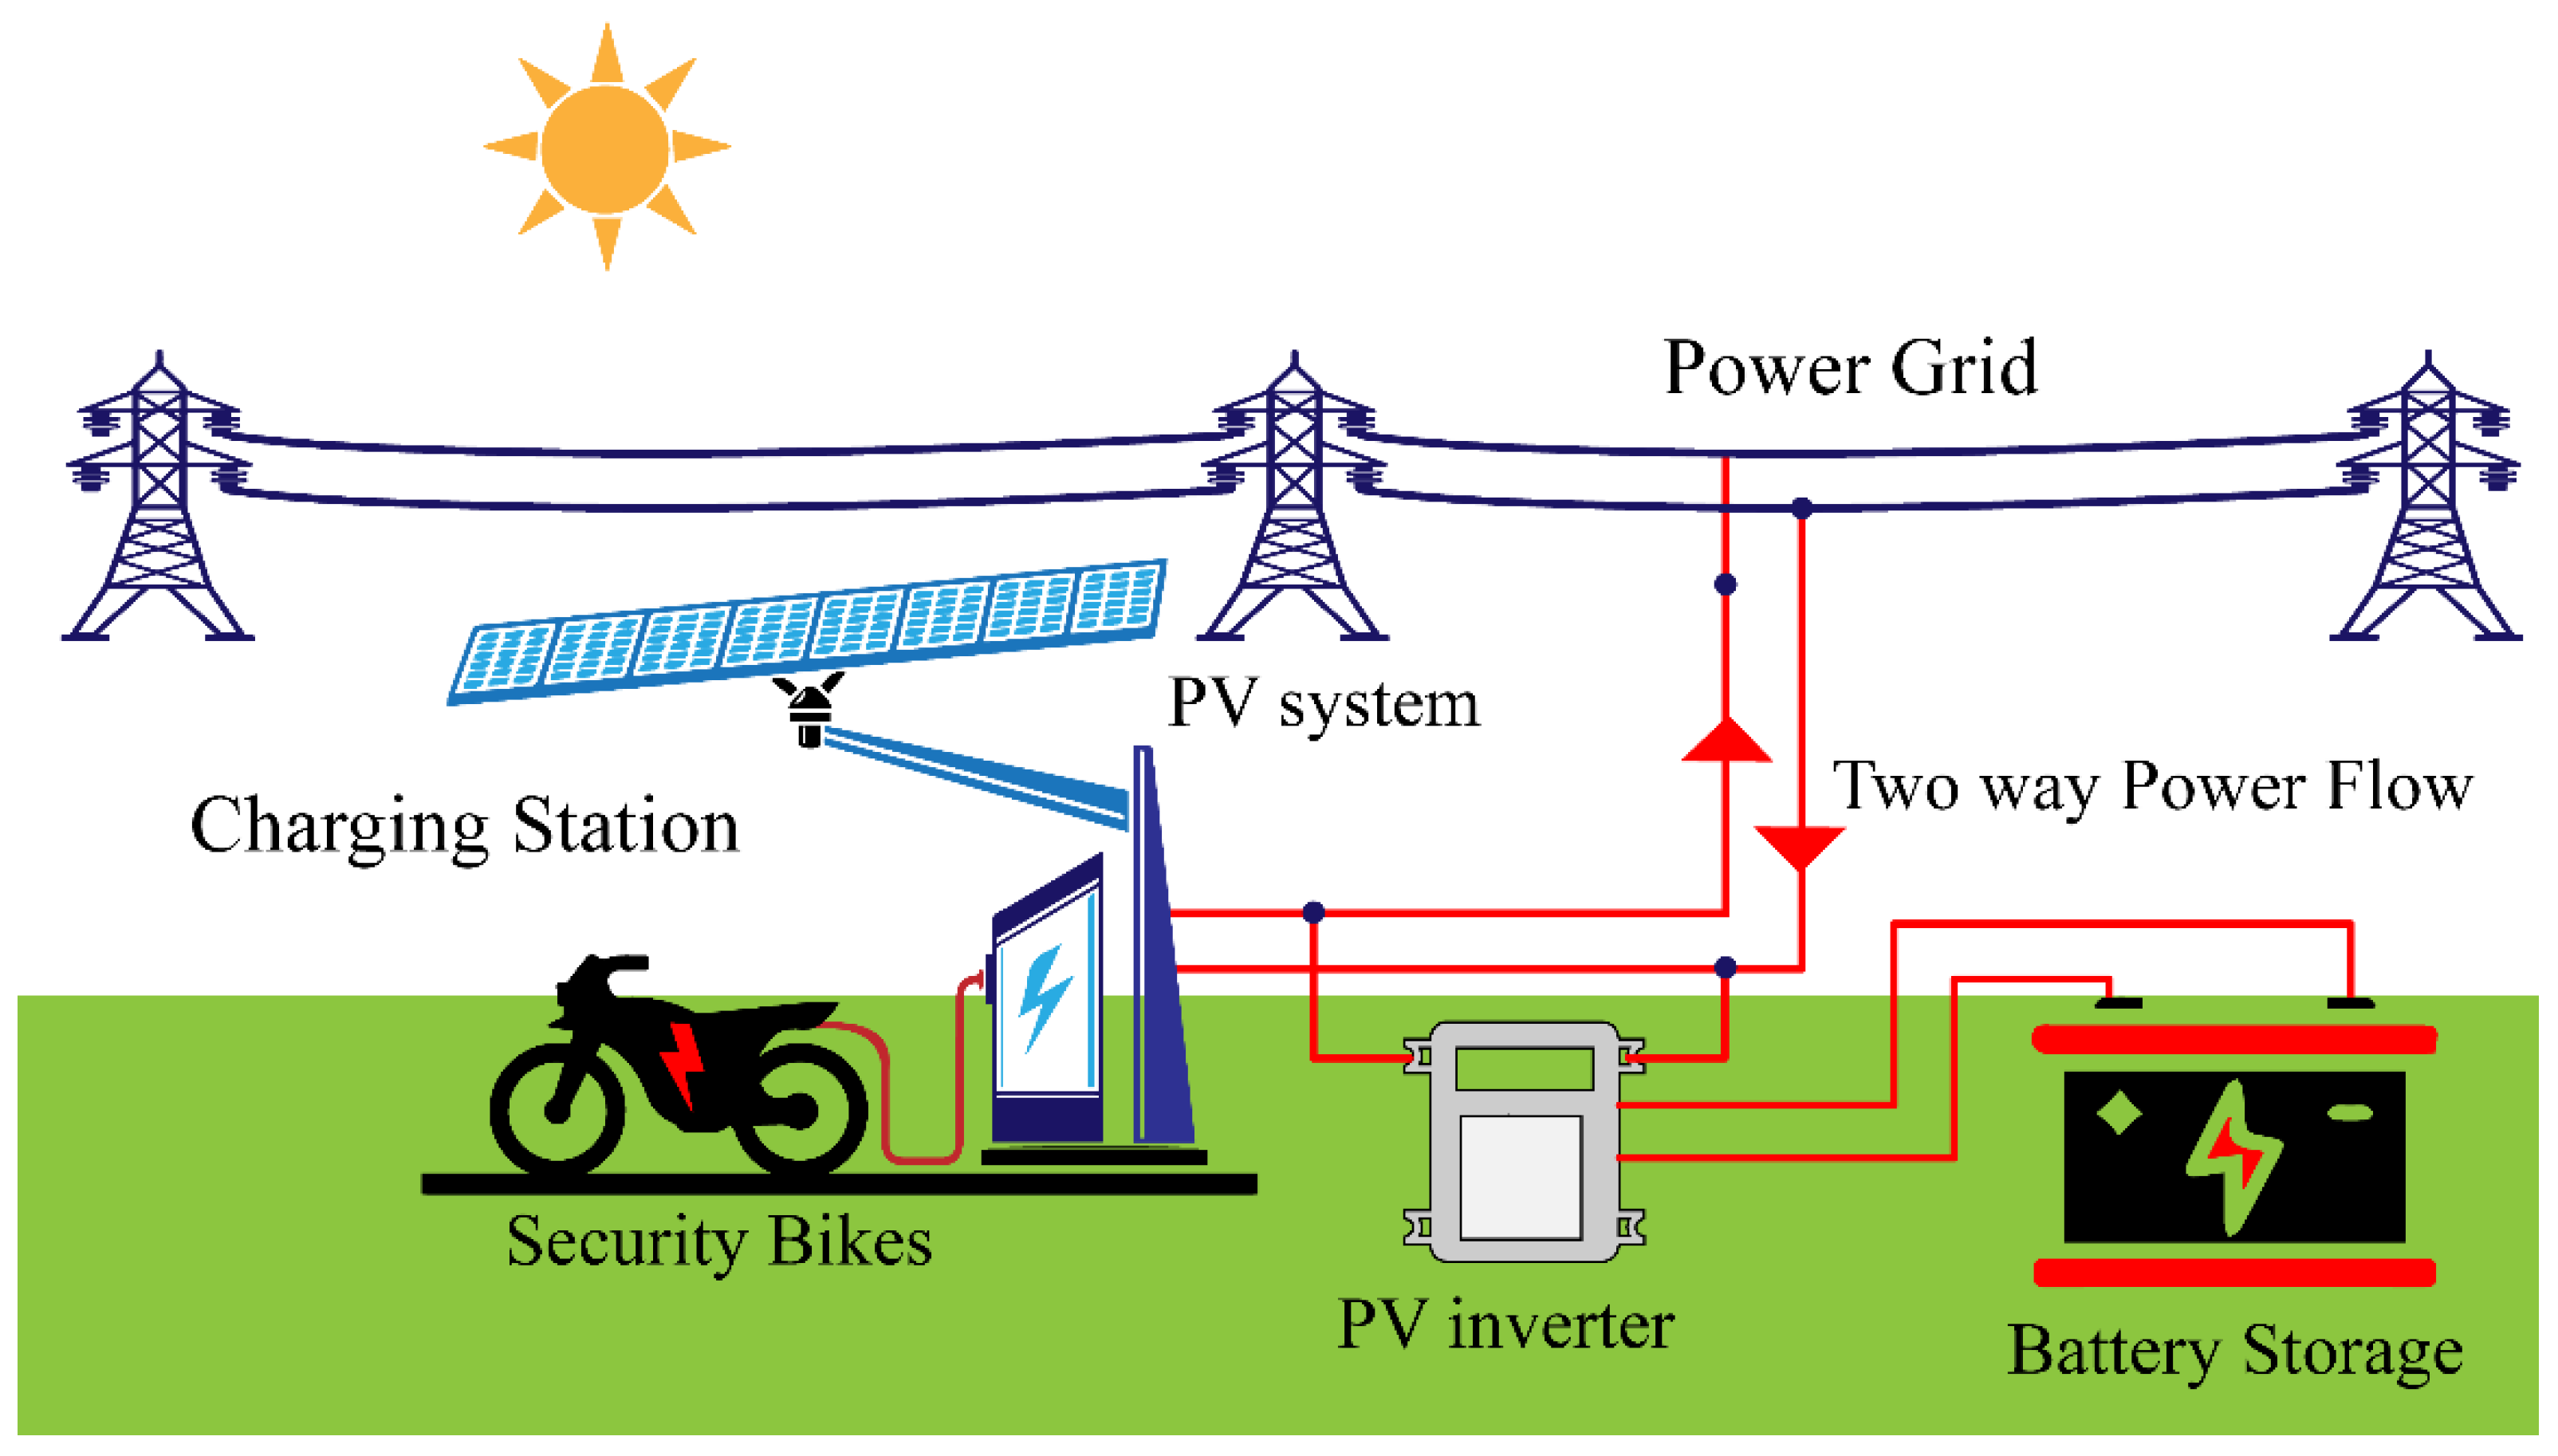
2.1. Site Description and System Model

The King Abdullah Campus University of Azad Jammu and Kashmir, Muzaffarabad, Pakistan, is considered in the proposed work. The location of the Campus is shown in Figure 1. On-grid and off-grid are the two primary site scenarios. Muzaffarabad’s latitude and longitude are 34° N and 73° E, respectively, with Islamabad’s time zone (UTC + 05.00).
Figure 2 explains the system model of the grid-connected solar charging station. The model has a grid-connected charging station with a battery backup and PV inverter. Two-way power occurs in the system, as the system takes electricity from the grid and sells back the excess energy to the grid as well.

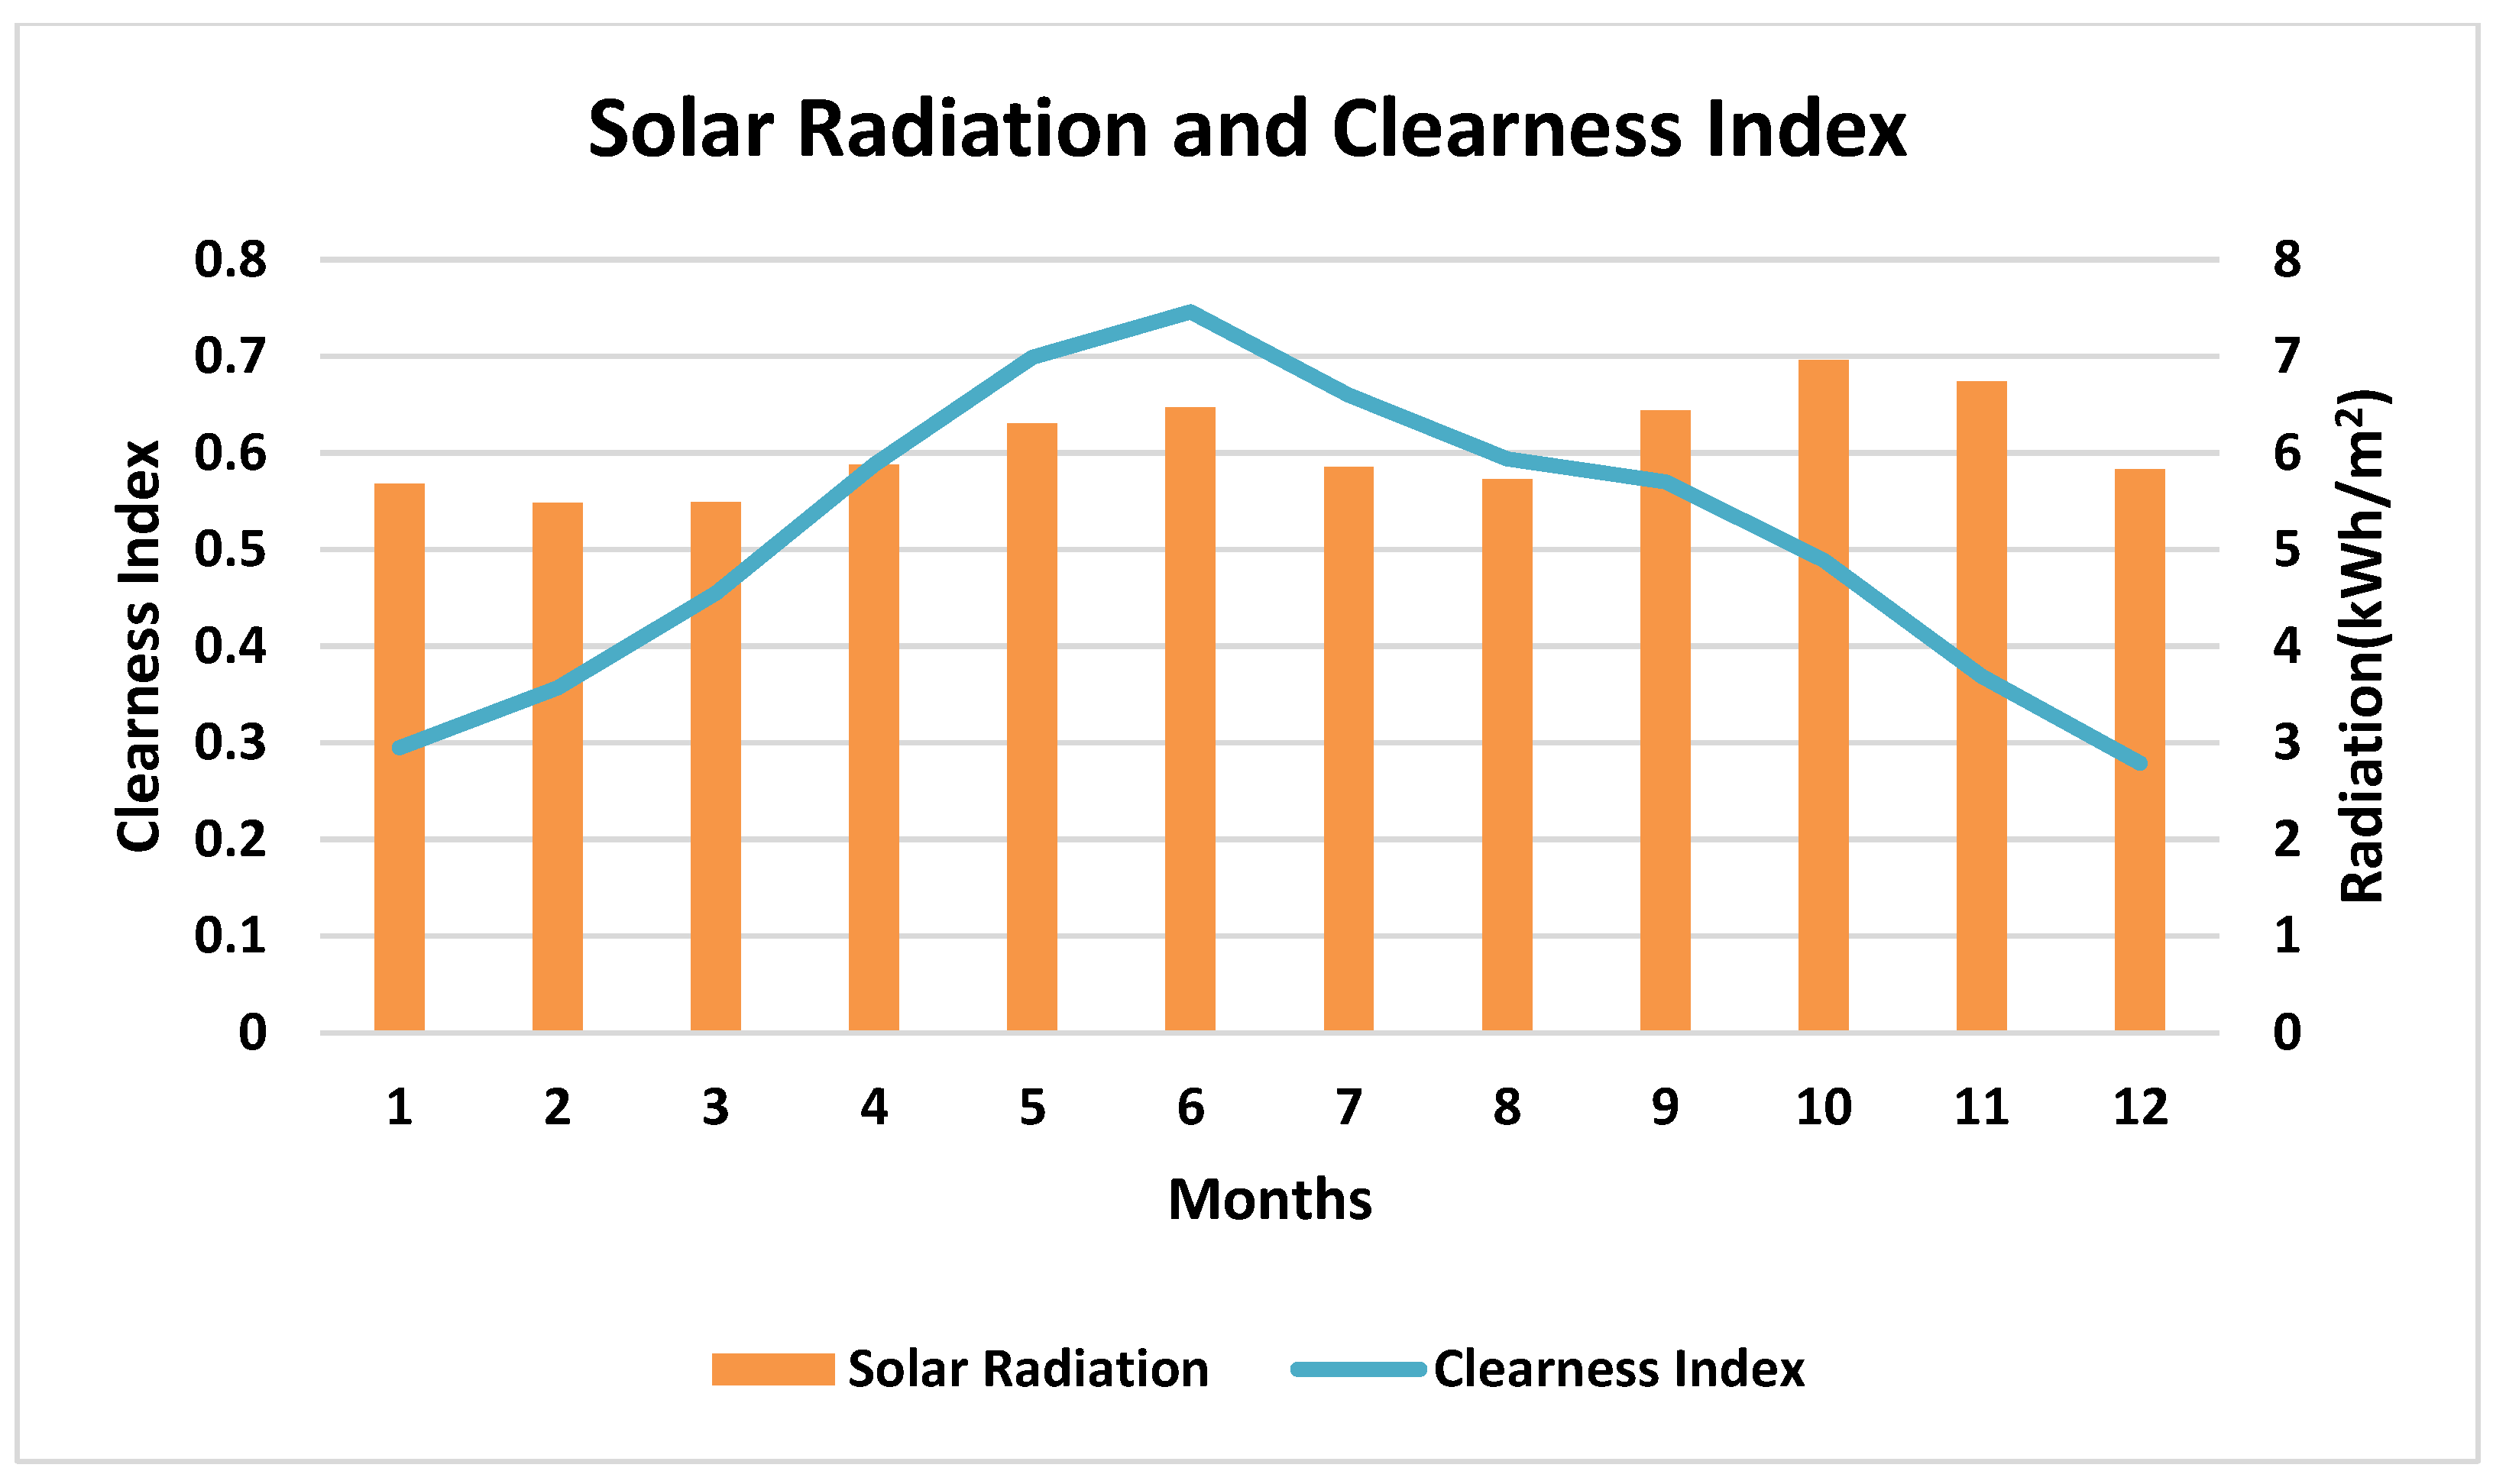
2.2. Solar Resources

To check the solar resources of the exact location data, HOMER collects all the relevant information from the NASA site (July 1983–June 2005). The three main elements of solar resources are radiation data, temperature, and the clearance index. Figure 3 displays the clearing index, as well as the monthly average horizontal irradiance, for the mentioned site. Table 1 displays the clearness index and monthly average PV radiation. Table 1 shows that the amount of solar radiation has the lowest value in December, at 2.790 kWh/m2, and its maximum value is in June, at 7.460 kWh/m2. A solar radiation value of 5.08 kWh/m2 is ideal for PV system design.
The amount of sunlight that reaches the surface of the earth is measured for the feasibility study. The cleanliness of the atmosphere is also studied before the installation of the charging station. To compare sunny days with overcast days, the clearness index and solar irradiance value can be seen in Figure 3.

2.3. Initial Assessment
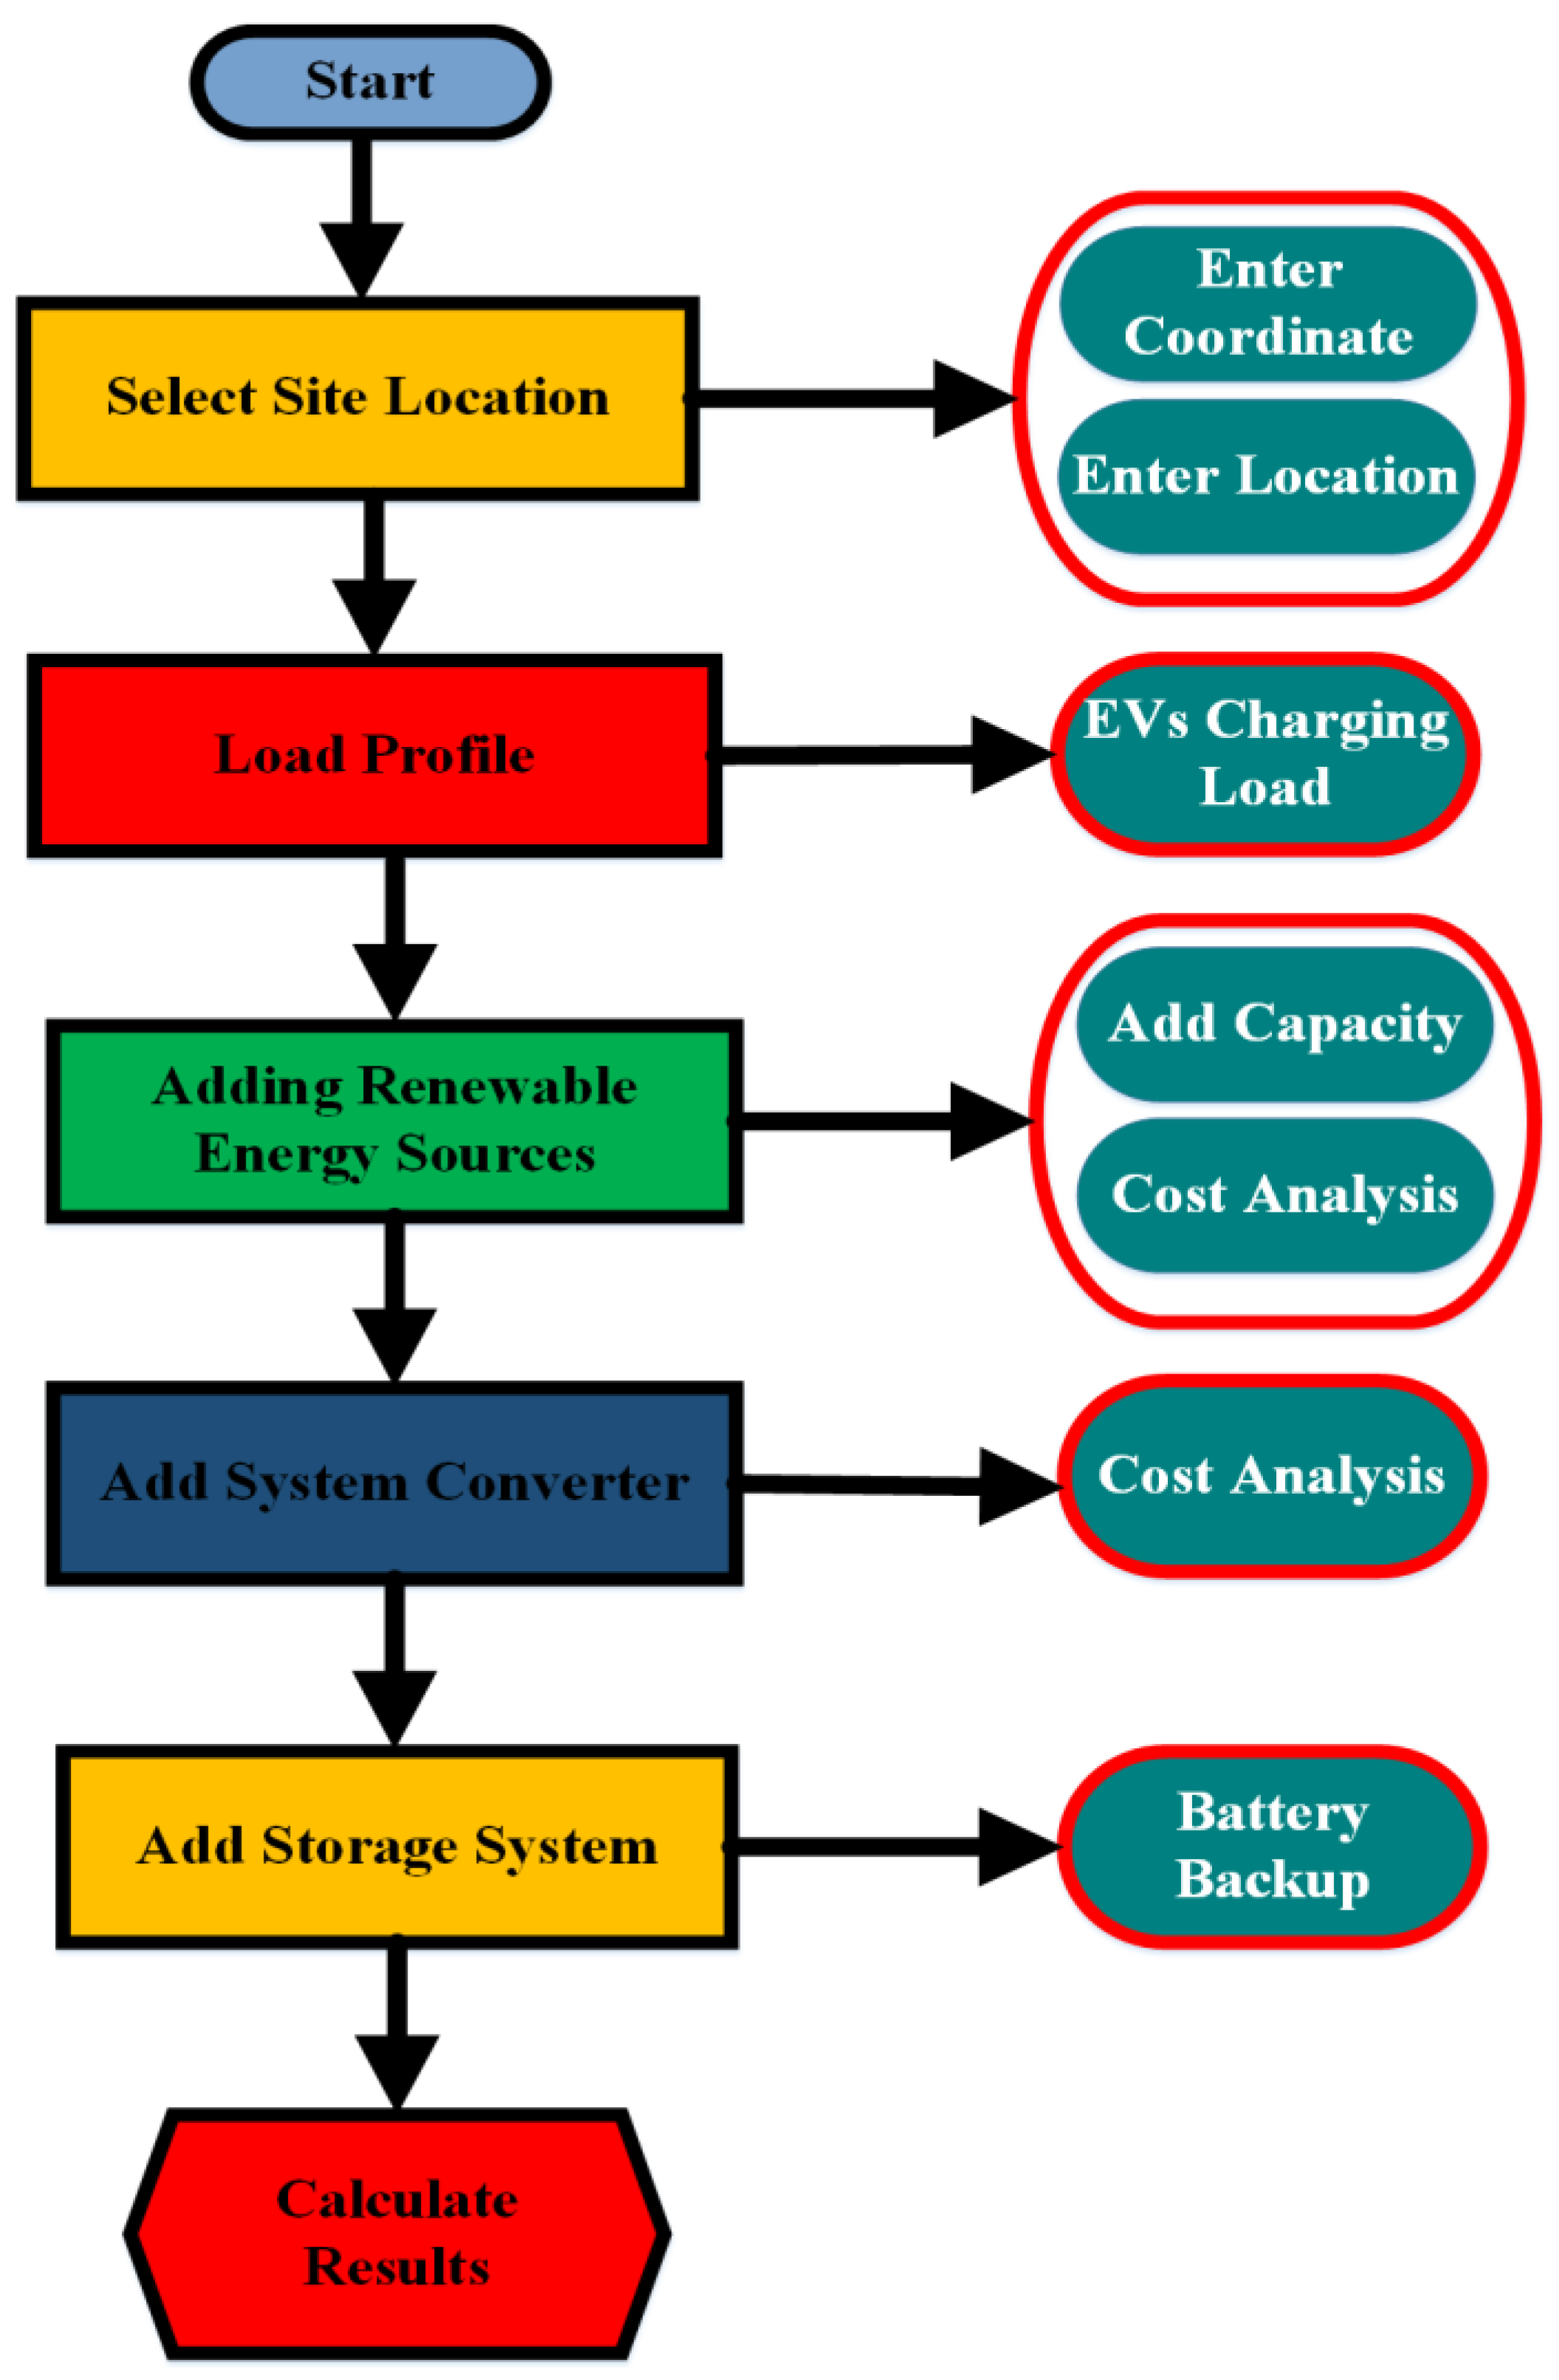
Initial evaluations of the power system are examined by correct operation, efficiency, and cost scenario. The charging station has a battery storage area and the storage system is connected to a solar photovoltaic system. Action must be taken to lower the cost of the energy of the on-load charging station. The project’s capital cost (CC), replacement cost (RC), net present cost (NPC), cost of electricity (COE), operation and maintenance cost (OMC), and salvage value (SV) are all determined using HOMER. These expenses can be used to assess the proposed model’s economic viability. The following equation can be used to formulate the system’s NPC.

2.4. Flow Chart

The current location’s resource data are uploaded to the program. The system incorporates the primary and EV loads. The system’s NPC, COE, CC, and carbon emissions are all examined. Figure 4 depicts the steps of the proposed system. The proposed work begins with resource and load integration. The capacity of the PV system and battery storage are determined next. After integrating resources and optimizing load, the outcomes of the optimal charging infrastructure are determined.

3. Results and Discussions

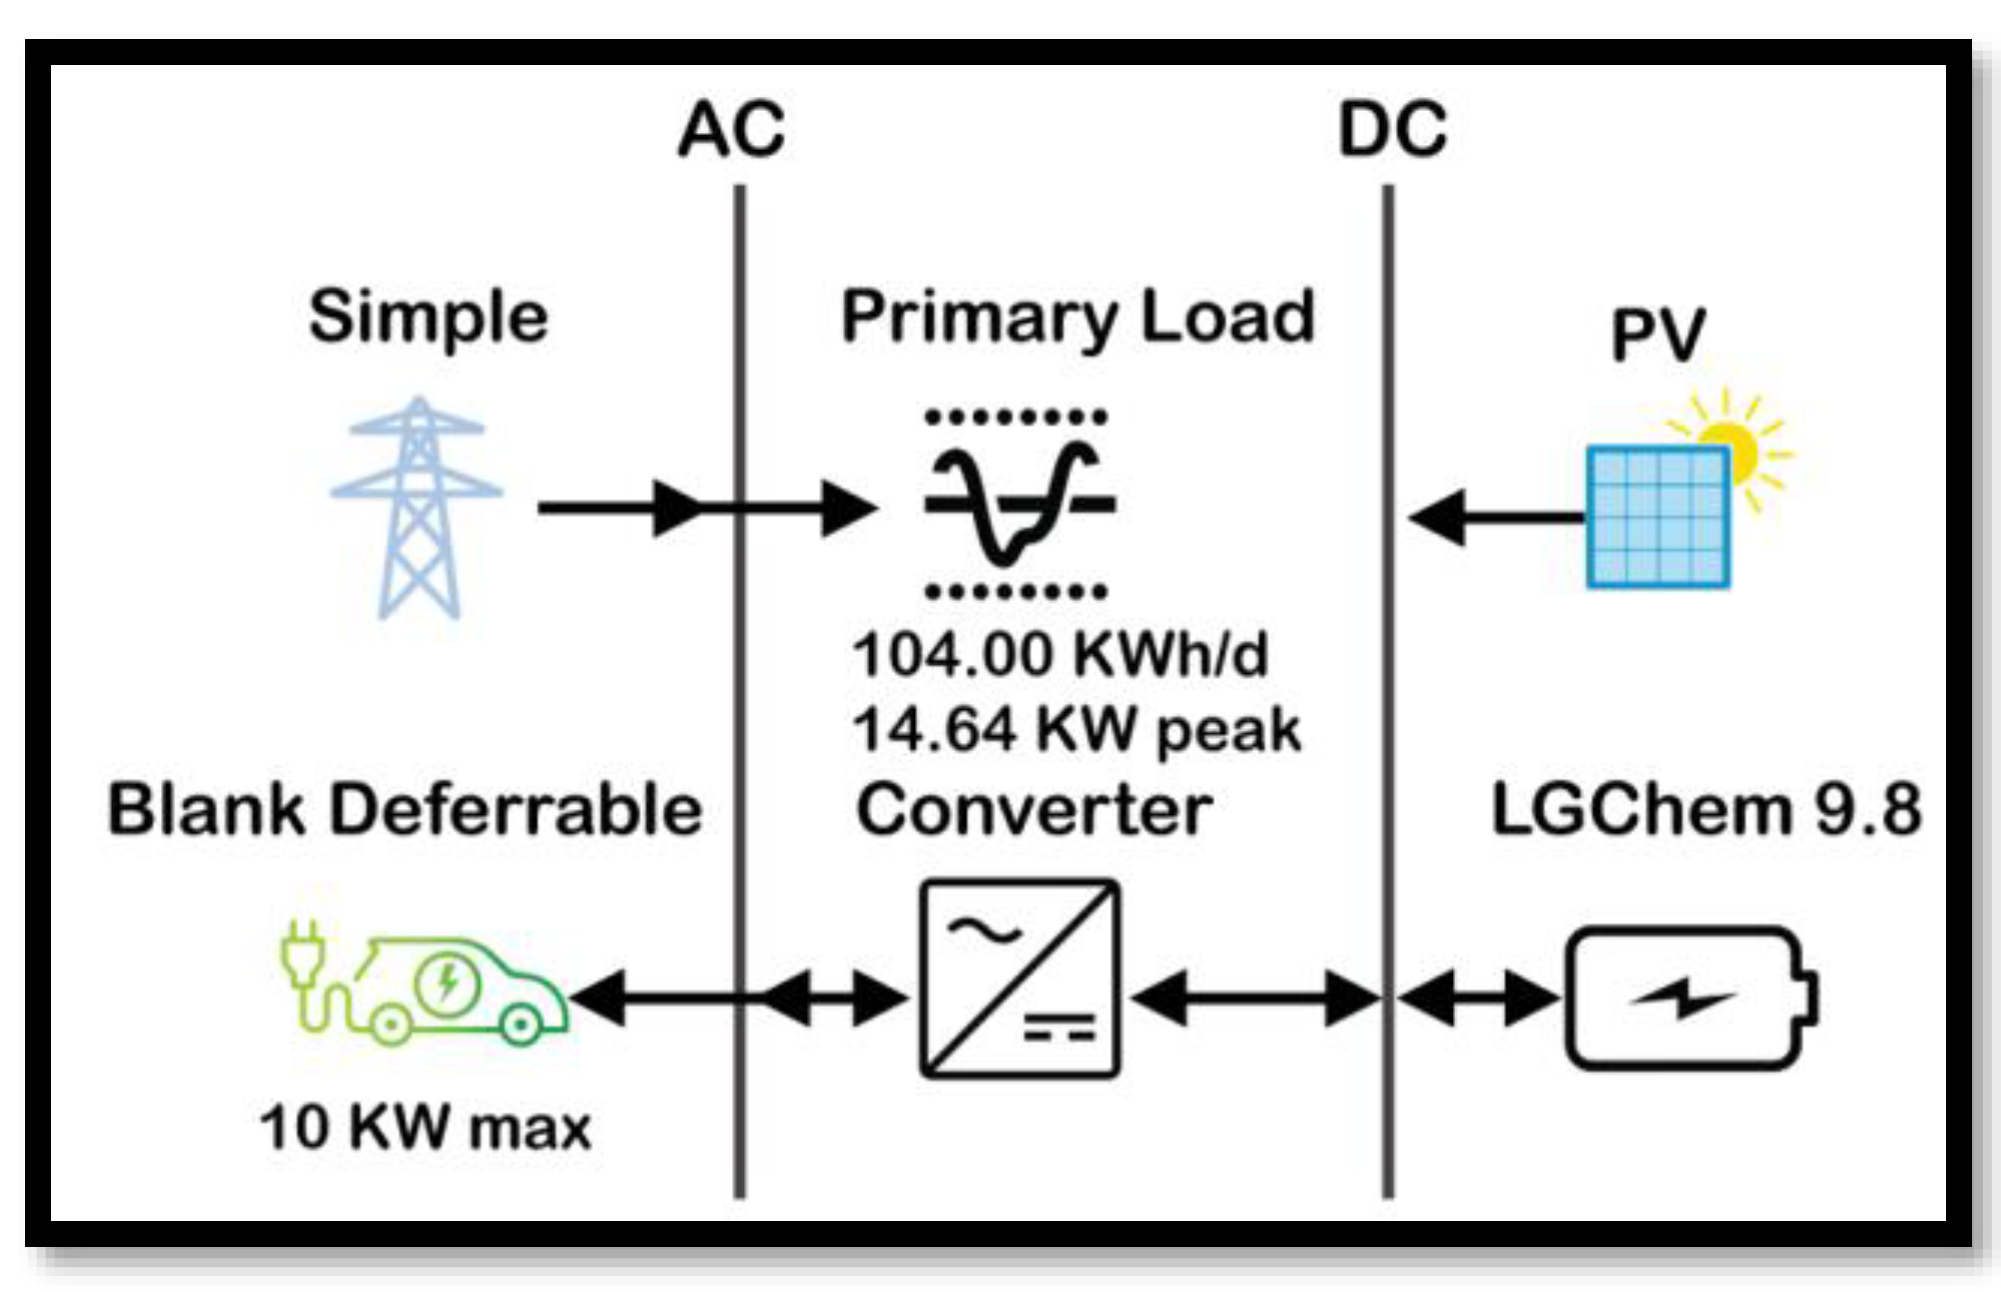
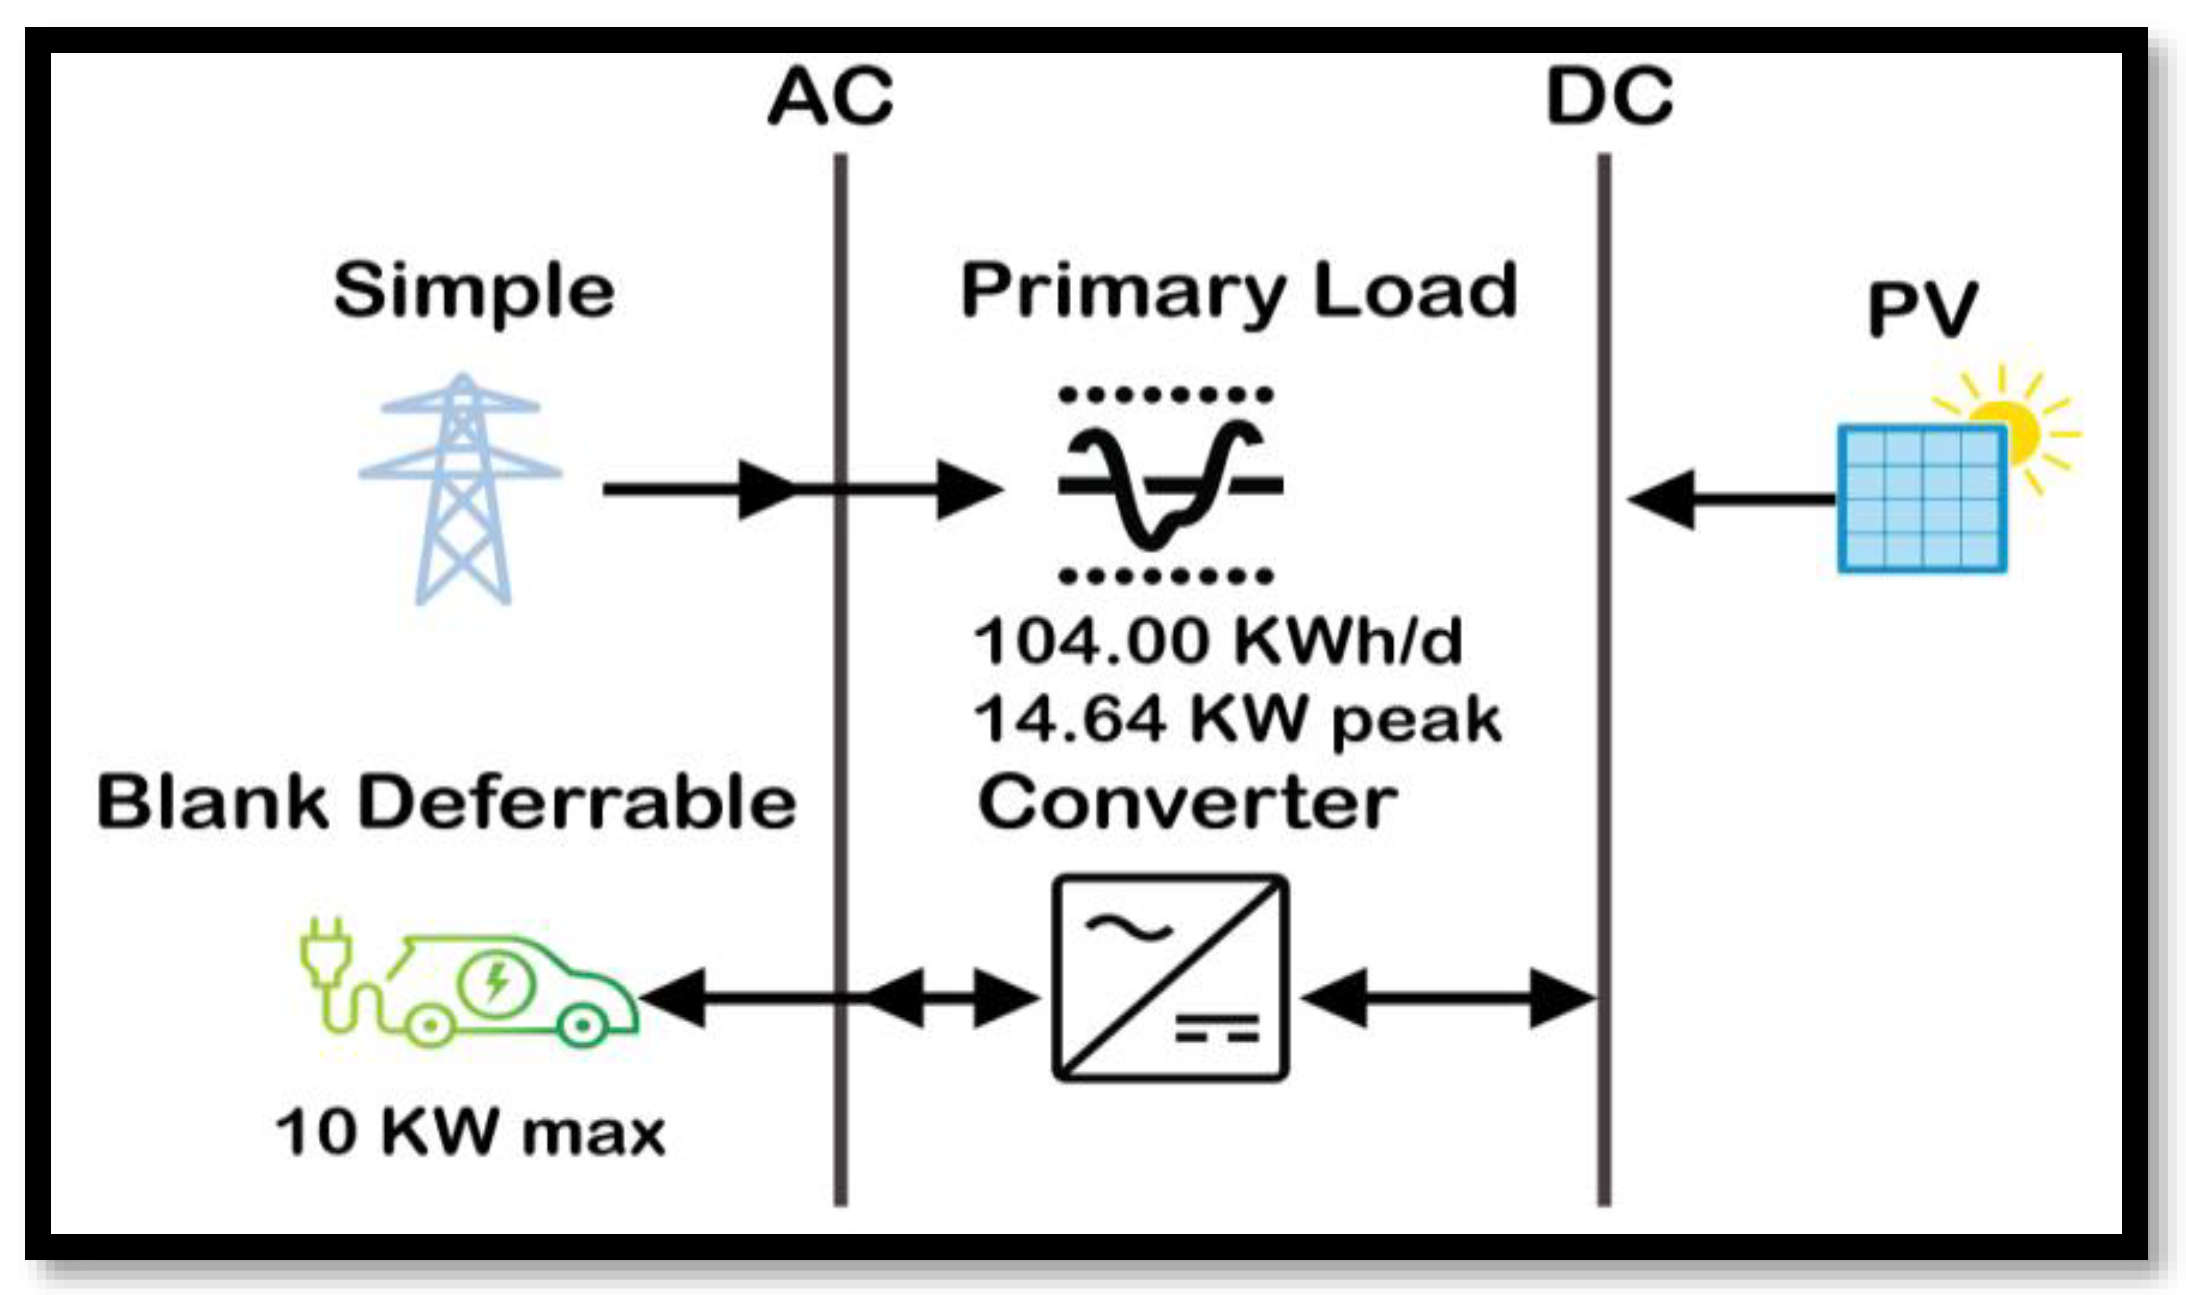
3.1. System Architecture

3.1.1. With Storage

A storage system has two components: PV, which is a generic flat-plate PV module, with a size/rating of 19.8 KW, and storage, which is an LGChem RESU10, with a size of one string. The system also includes a 10.0 kW system converter. Table 2 shows the system architecture in association with the storage system.
Figure 5 depicts the model of the proposed system. The PV system and battery storage are shown connected to the DC bus in the model. As it converts AC to DC and vice versa, the converter is interconnected to both the AC and DC buses.

3.1.2. Without Storage

The system without battery backup has two components: a PV system, with a size of 20 KW, and a system converter, with a rating of 10 KW. Table 3 explains the configuration of the system briefly.
The system model without battery backup is depicted in Figure 6. The system shows the PV system is connected to the DC. The grid supply is also connected to the system and during the nighttime, the load is run by the grid supply.

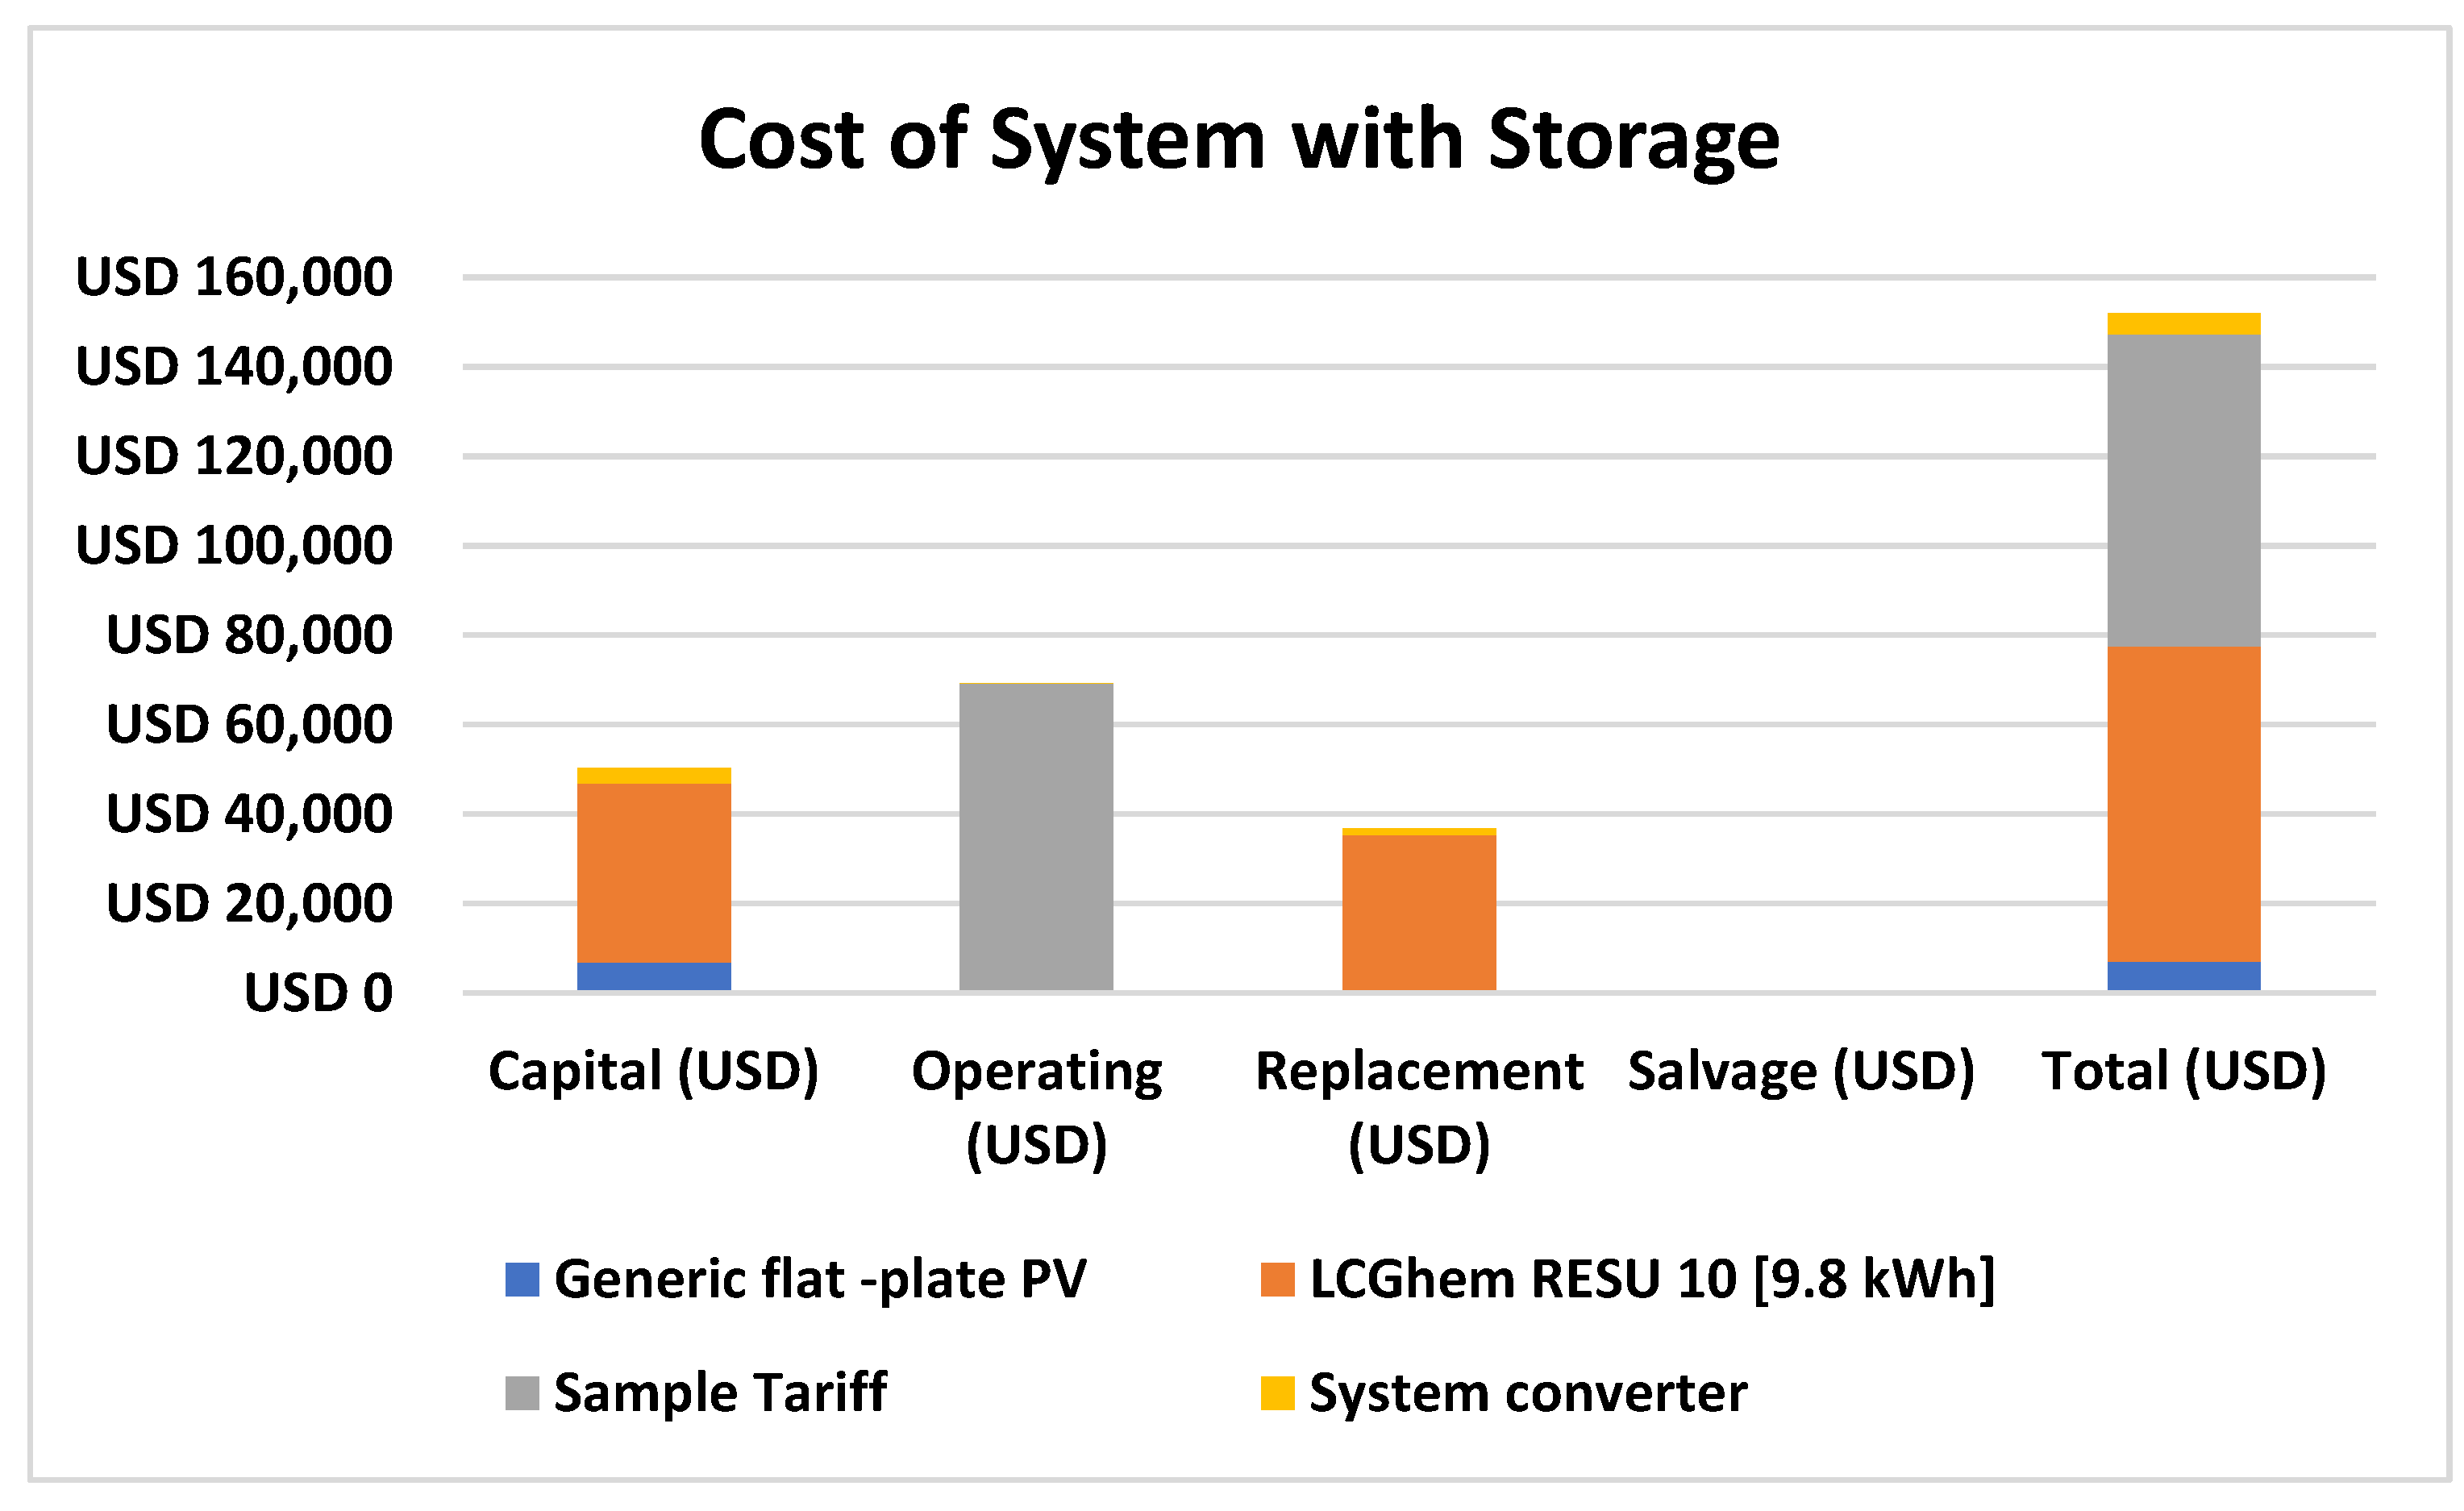
3.2. Net Present Cost

3.2.1. With Storage

For the generic flat-plate PV module, the capital cost is USD 6916 and the operational cost is around about USD 25.54. The system does not have any replacement cost. The total cost of the PV system is USD 6942.
The capital cost for the storage system is USD 40,000, and the system has an operational cost of USD 64.64. Moreover, the system has a replacement cost of USD 35,338, and the salvage is −USD 4791. The total cost of the storage system reaches USD 70,611. The total cost of the simple tariff is USD 69,095. The system converter has a capital cost of USD 3500, with an operating cost of USD 12.93 and a replacement cost of USD 1485. The salvage cost is negative USD 279.48 for the converter, which is why the total cost of the converter is USD 4718. Collectively, the system has a capital cost of USD 50,416 and an operating cost of USD 69,198. The replacement cost of the system is USD 36,822, and the negative salvage cost is USD 5071. The overall cost of the system is USD 151,366. Figure 7 shows the cost analysis of the system with storage. The costs for the system are further explained in Table 4.
Furthermore, as seen in Figure 7, the basic tariff has a large operating cost rather than a capital cost. When compared to a battery storage system, a PV system has a lower capital cost.

3.2.2. Without Storage

The capital cost for the Generic Flat-Plate PV system is USD 7000, with an operational cost of USD 25.89. The total cost of the PV system is USD 7026. For a simple tariff, the capital cost USD 0, but the operational cost is huge at USD 69,633. The capital and operational costs for the system converter are USD 3500 and USD 12.93, respectively. Moreover, the system has a replacement cost of USD 1485 and a negative salvage cost of USD 279.48. The total cost for the converter reaches USD 4718. The total capital cost of the system is USD 10,000, with an operational cost of USD 69,672. The replacement and salvage costs are USD 1485 and USD 279, respectively. The system has a total cost of value USD 81,378. The results are briefly explained in Table 5.
Figure 8 shows the cost analysis in more detail. The majority of the electricity is produced by the grid, as seen in the Figure 8, which explains why the system has high running expenses. The system has a low cost of replacement because there is no battery storage system.

3.3. Annualized Cost

3.3.1. With Storage

The annualized cost for the system with storage backup is discussed in Table 6. The capital annualized cost of the PV system is USD 534.98, with an operational cost of USD 1.98. The total annualized capital cost for the system reaches USD 536.96. The storage system has annualized capital and operational costs of USD 3094 and USD 5, respectively. The replacement cost of the storage system reaches USD 2734, with a salvage cost of − USD 370.62. The total cost of the storage system is USD 5462. The value of the simple tariff is USD 5345. The annualized capital cost for the converter is USD 270.74, with an operating cost of USD 1. The replacement and salvage costs reach USD 114.87 and USD 21.62, respectively. The total annualized cost of the system converter is USD 364.99. The system has a total annualized capital cost of USD 3900, with an operating cost of USD 5353 and a replacement cost of USD 2848. The salvage for the system is USD 392.24, so the system reaches the total amount of USD 11,709.

3.3.2. Without Storage

The annualized cost of the system without storage is briefly explained in Table 7. The annualized capital cost and operating cost of the PV system are USD 541.48 and USD 2, respectively. The PV system has a total cost of USD 543.48. The cost for the simple tariff is USD 5.386.

3.4. Production Summary

3.4.1. With Storage

The system with a storage system has a total power production of 67,139 kWh. 49.8% of the power is produced by the PV system, while 50.2% is purchased from the grid. The PV system and grid have a power production of 33,448 kWh and 33,690 kWh, respectively. Table 8 explains the power production of the system with storage in detail.

3.4.2. Without Storage

For the system without storage, the total power production of the PV system is 33,855 kWh, which is 47.1% of the total power production. The amount of energy purchased from the grid is 52.9 %, with a value of 33,055 kWh. The system has a total power production of 71,910 kWh. Table 9 explains the power production without a storage system in detail.

3.5. Consumption Summary

3.5.1. With Storage

The system with storage has an AC load of 62% and consumes 37,960 kWh of energy. Table 10 depicts that 20.1% of the energy is sold back to the grid, which has the value of 12,311 kWh. 17.9% of the total energy is used for charging EVs, which consume 10,950 kWh of energy. The total power consumption of the system with storage is 61,221 kWh.

3.5.2. Without Storage

The system without storage backup has a 58.0% AC load consumption; 25.2% is sold to the grid and 16.2% is used for EV charging. The AC load consumption is 37,960 kWh, the Grid Sale is 16,510 kWh, and 10,950 kWh of energy are used for EV charging. The results are briefly explained in Table 11.

3.6. EV Charging

The system has 3650 charging sessions per year. The annualized amount of energy saved is 10,950 kWh, while 3.00 kWh of energy are used per session. The number of charging sessions per day is 10.0. Table 12 depicts charging results in detail.

3.7. Economic Comparison

EVs provide economic benefits to the state by reducing fuel costs and shifting consumption away from imported oil to more locally produced electricity sources. These fuel savings become additional disposable income that is spent mostly in the local economy, creating additional jobs in the state.
Net Present Costs
Here is the comparison of the system with storage backup. The results for the base system and proposed system are discussed in detail. Table 13 explains the comparison of both systems. The net present costs for the base system are much higher at USD 158,071compared to those of the proposed system of USD 51,366. The capital cost for the base system is zero compared to that of the proposed system of USD 50,416. Next, OPEX is USD 12,228 for the base system and USD 7809 for the proposed system. For annual energy change, the base system costs an amount of USD 12,228 compared to that of the proposed system of USD 5345. LCDE iper is USD 0.250 for the base system and USD 0.191 for the proposed system. Lastly, CO2 emissions are 30,911 kg/yr for the base system and 21,292 kg/yr for the processed system.
a 
Base Case Electric bill
For the base case, Table 14 depicts the energy charge and energy purchased amount for the whole year. It shows that the energy charge is at a maximum in May, which is USD 1109 and a minimum in February at USD 919. The annualized amount of energy charge is USD 12,227. For energy purchases, the maximum value in January is 4177 kWh and the minimum in February is kWh 3678. The annualized price for energy purchases is 49,541 kWh.
b 
Predicted Electric bill
A brief detail of the predicted electric bill when there is no storage in the system is given in Table 15. It can be observed that energy charge is at a minimum in May at USD 363.15. The maximum energy charge that occurs in January has a value of USD 574.26 and an annual value of USD 5345. Energy purchases have a minimum value in February of 2613 kWh and a maximum in January, with a value of 3055 kWh. The annual value for the energy charge is 33,690 kWh. For energy sold, the maximum value occurs in October, with an amount of 1286 kWh, and the minimum in February, with a value of 724 kWh. The annual value for the energy sold is 12,311 kWh. The total shows that the minimum amount is in May, with 363.15 kWh, and the maximum in January, with 574.26 kWh, which annually gives us 5345 kWh.
c 
Annualized Cost
Comparatively, in the system without storage, the net present costs of the base system are USD 158,071, and for the proposed system, they are USD 151,366. Similarly, when it comes to CAPEX, the base case has zero value, while the proposed system has a cost of USD 50,416. Table 16 depicts that OPEX has a value of USD 12,228 for the base system and a value of USD 7809 for the proposed system. The energy charge for the base system is USD 12,228, while for the proposed system, its value is USD 5345. For the base and proposed system, LCDE is USD 0.250 and USD 0.191, respectively. Carbon emissions for the base system are 30,911 kg/yr much higher than those of the proposed system.
d 
Base Case Electric Bill
The base case electric bill for the system without storage is given in Table 17. The table shows that the value of energy charge for August is the minimum, with a value of USD 919. The maximum amount of energy is for December, with a value USD 12,222. The value of energy purchased is at a minimum for February, with a value of 3678 kWh, while the value is at a maximum for August, with a value of 4244 kWh.
e 
Predicted Case Electric Bill
The predicted case electric bill for the system without storage is briefly explained in Table 18. The amount of energy is the lowest for May, with a value of USD 363.89, and the highest for January, with a Value of USD 579.88. The annual value for energy charge is USD 5386. The value for the energy purchase is at a minimum in February, with a value of 2613 kWh, and a maximum in January, with a value of 3372 kWh. The annual value of energy purchases is 33,600 kWh. The amount of energy sales is at a maximum in October, with a value of 1638 kWh, while the minimum is in February, with a value of 1010 kWh.

3.8. Economic Comparison

3.8.1. Without Storage

When the system is without a battery, the minimum energy purchased is in February, with a value 2921 and the maximum in August of 3391. The total amount of energy purchased is 38,055 KWh. The minimum energy sold February is USD 1.010, and the maximum sold in October is 1638. Therefore, net energy purchased is at a minimum amount in May, with an amount of 1454 kWh, and a maximum in January, with an amount 2320 kWh. The load detail shows the peak load is at a maximum in January, with a value of 13.9 kW, and a minimum in October, with a value of 12.2 kW. It can be observed that energy charges are at a minimum in May, with the value of USD 363.58. The value of energy charge is at a maximum in January, with a value of USD 579.88. The total shows that the minimum amount is in May, with USD 363.58, and the maximum in January, with the value of USD 579.88, which annually gives USD 562.90 (see Table 19).

3.8.2. With Storage

Annualized cost for the system with storage is given in Table 20. It can be observed that energy charge is at a minimum in May, at USD 363.15, while it is at a maximum in January, with a value of USD 574.20. Energy purchase is at a minimum in December, with a value of 2008 kWh, and a maximum in March, with a value of 2055 kWh. The total shows that the minimum amount occurs in May, with USD 363.15, and the maximum in January, with USD 574.26, which annually gives USD 5345.

3.9. Polluting Gas Emissions

The polluting gas emissions for the system with storage is explained in Table 21. The amount of carbon dioxide is 24,051 kg/yr, while the sulfur dioxide emissions are 104 kg/yr. Nitrogen dioxide is also emitted in the amount of 51 kg/yr with the infrastructure of the system.

3.10. Comparison with Existing Work

The proposed system is compared here with existing work. Existing studies proposed the techno-economic impact at different locations. Those papers discussed the locations in India, China, and Vietnam. The comparison of the proposed work with existing work is shown in Table 22.

4. Conclusions

The University of Azad Jammu and Kashmir lacks the facility of a charging station for EVs. According to the solar resource data, the location has a significant potential for solar energy. Two types of system models have been designed to demonstrate the viability of solar energy. The first is a grid-connected system with a storage backup, whereas the second does not have storage. In the case of the system without storage, the cost of energy is reduced to USD 0.0962. The energy cost of the storage system is USD 0.191 compared to USD 0.20 for the existing system. The renewable fraction for the system with battery backup is 45.0%, whereas the renewable fraction for the system without backup is 41.8%. The simple payback period for the system with storage is 7.3 years and 1.5 years, respectively. The utility bill savings for a system without backup are USD 6841 and USD 6883 for a system with backup. Total bill savings of USD 88,438 are obtained for the system without storage. The overall bill savings of the system with storage are USD 88,976. The proposed system has a storage backup time of 3.14 h. The total quantity of energy purchased and sold for the system without backup is 38,055 kWh and 16,510 kWh. The storage system consumes 33,690 kWh of grid energy, while selling 12.311 kWh to the grid.

Author Contributions

Conceptualization, A.S. (Aqib Shafiq), S.I. and S.H.; methodology, S.I., A.S. (Aqib Shafiq) and S.H.; software, S.I., A.S. (Aqib Shafiq) and S.H.; validation, S.H., A.u.R. (Atiq ur Rehman) and A.u.R. (Anis ur Rehman); S.K.; formal analysis, A.u.R. (Atiq ur Rehman) and A.u.R. (Anis ur Rehman); investigation, S.H. and A.S. (Aqib Shafiq); resources, S.H., S.K. and A.S. (Ali Selim); data curation, E.M.A., A.S. (Aqib Shafiq) and A.u.R. (Anis ur Rehman); writing—original draft preparation, A.S. (Aqib Shafiq) and S.I.; writing—review and editing, S.I. and S.H.; visualization, S.H., S.I., E.M.A. and S.K.; supervision, S.I.; project administration, S.I., S.H., E.M.A., S.K. and A.u.R. (Atiq ur Rehman); funding acquisition, A.S. (Ali Selim). All authors have read and agreed to the published version of the manuscript.

Funding

This research was funded by the Science, Technology & Innovation Funding Authority (STDF) under grant (43180).

Institutional Review Board Statement

Not applicable.

Informed Consent Statement

Not applicable.

Data Availability Statement

Not applicable.

Conflicts of Interest

The authors declare no conflict of interest.

References

  1. ReferencesNanaki, E.A.; Xydis, G.A. Deployment of Renewable Energy Systems: Barriers, Challenges, and Opportunities. In Advances in Renewable Energies and Power Technologies; Elsevier: Amsterdam, The Netherlands, 2018; pp. 207–229. [Google Scholar]
  2. Podder, A.K.; Supti, S.A.; Islam, S.; Malvoni, M.; Jayakumar, A.; Deb, S.; Kumar, N.M. Feasibility Assessment of Hybrid Solar Photovoltaic-Biogas Generator Based Charging Station: A Case of Easy Bike and Auto Rickshaw Scenario in a Developing Nation. Sustainability 2021, 14, 166. [Google Scholar] [CrossRef]
  3. Zhang, Y.; Zhang, Q.; Farnoosh, A.; Chen, S.; Li, Y. GIS-Based Multi-Objective Particle Swarm Optimization of charging stations for electric vehicles. Energy 2019, 169, 844–853. [Google Scholar] [CrossRef]
  4. Iqbal, S.; Jan, M.U.; Rehman, A.U.; Shafique, A.; Rehman, H.U.; Aurangzeb, M. Feasibility Study and Deployment of Solar Photovoltaic System to Enhance Energy Economics of King Abdullah Campus, University of Azad Jammu and Kashmir Muzaffarabad, AJK Pakistan. IEEE Access 2022, 10, 5440–5455. [Google Scholar] [CrossRef]
  5. Halabi, L.M.; Mekhilef, S.; Olatomiwa, L.; Hazelton, J. Performance analysis of hybrid PV/diesel/battery system using HOMER: A case study Sabah, Malaysia. Energy Convers. Management 2017, 144, 322–339. [Google Scholar] [CrossRef]
  6. Miceli, R.; Viola, F. Designing a Sustainable University Recharge Area for Electric Vehicles: Technical and Economic Analysis. Energies 2017, 10, 1604. [Google Scholar] [CrossRef] [Green Version]
  7. Habib, S.; Khan, M.M.; Abbas, F.; Ali, A.; Hashmi, K.; Shahid, M.U.; Bo, Q.; Tang, H. Risk Evaluation of Distribution Networks Considering Residential Load Forecasting with Stochastic Modeling of Electric Vehicles. Energy Technol. 2019, 7, 1900191. [Google Scholar] [CrossRef]
  8. Iqbal, S.; Habib, S.; Khan, N.H.; Ali, M.; Aurangzeb, M.; Ahmed, E.M. Electric Vehicles Aggregation for Frequency Control of Microgrid under Various Operation Conditions Using an Optimal Coordinated Strategy. Sustainability 2022, 14, 3108. [Google Scholar] [CrossRef]
  9. Dai, Q.; Liu, J.; Wei, Q. Optimal Photovoltaic/Battery Energy Storage/Electric Vehicle Charging Station Design Based on Multi-Agent Particle Swarm Optimization Algorithm. Sustainability 2019, 11, 1973. [Google Scholar] [CrossRef] [Green Version]
  10. Ilieva, L.M.; Iliev, S.P. Feasibility assessment of a solar-powered charging station for electric vehicles in the North Central region of Bulgaria. Renew. Energy Environ. Sustain. 2016, 1, 12. [Google Scholar] [CrossRef]
  11. Pan, A.; Zhao, T.; Yu, H.; Zhang, Y. Deploying Public Charging Stations for Electric Taxis: A Charging Demand Simulation Embedded Approach. IEEE Access 2019, 7, 17412–17424. [Google Scholar] [CrossRef]
  12. John, S.; Vincent, G. PV fed Electric Vehicle Charging Station with Power Backup. In Proceedings of the 2021 13th IEEE PES Asia Pacific Power & Energy Engineering Conference (APPEEC), Karela, India, 21–23 November 2021; pp. 1–6. [Google Scholar] [CrossRef]
  13. Filote, C.; Felseghi, R.; Raboaca, M.S.; Aşchilean, I. Environmental impact assessment of green energy systems for power supply of electric vehicle charging station. Int. J. Energy Res. 2020, 44, 10471–10494. [Google Scholar] [CrossRef]
  14. Ahmad, F.; Khalid, M.; Panigrahi, B.K. An enhanced approach to optimally place the solar powered electric vehicle charging station in distribution network. J. Energy Storage 2021, 42, 103090. [Google Scholar] [CrossRef]
  15. Niccolai, A.; Bettini, L.; Zich, R. Optimization of electric vehicles charging station deployment by means of evolutionary algorithms. Int. J. Intell. Syst. 2021, 36, 5359–5383. [Google Scholar] [CrossRef]
  16. Khan, W.; Ahmad, F.; Alam, M.S. Fast EV charging station integration with grid ensuring optimal and quality power exchange. Eng. Sci. Technol. Int. J. 2019, 22, 143–152. [Google Scholar] [CrossRef]
  17. ur Rehman, A.; Ali, M.; Iqbal, S.; Shafiq, A.; Ullah, N.; Otaibi, S.A. Artificial Intelligence-Based Control and Coordina-tion of Multiple PV Inverters for Reactive Power/Voltage Control of Power Distribution Networks. Energies 2022, 15, 6297. [Google Scholar] [CrossRef]
  18. Xu, M.; Meng, Q. Optimal deployment of charging stations considering path deviation and nonlinear elastic demand. Transp. Res. Part B Methodol. 2020, 135, 120–142. [Google Scholar] [CrossRef]
  19. Yan, D.; Ma, C. Stochastic planning of electric vehicle charging station integrated with photovoltaic and battery systems. IET Gener. Transm. Distrib. 2020, 14, 4217–4224. [Google Scholar] [CrossRef]
  20. Wang, W.; Huang, S.; Zhang, G.; Liu, J.; Chen, Z. Optimal Operation of an Integrated Electricity-heat Energy System Considering Flexible Resources Dispatch for Renewable Integration. J. Mod. Power Syst. Clean Energy 2021, 9, 699–710. [Google Scholar] [CrossRef]
  21. Bhatti, A.R.; Salam, Z.; Sultana, B.; Rasheed, N.; Awan, A.B.; Sultana, U.; Younas, M. Optimized sizing of photovoltaic grid-connected electric vehicle charging system using particle swarm optimization. Int. J. Energy Res. 2019, 43, 500–522. [Google Scholar] [CrossRef] [Green Version]
  22. Nishanthy, J.; Raja, S.C.; Praveen, T.; Nesamalar, J.J.D.; Venkatesh, P. Techno-economic analysis of a hybrid solar wind electric vehicle charging station in highway roads. Int. J. Energy Res. 2022, 46, 7883–7903. [Google Scholar] [CrossRef]
  23. Hafez, O.; Bhattacharya, K. Optimal design of electric vehicle charging stations considering various energy resources. Renew. Energy 2017, 107, 576–589. [Google Scholar] [CrossRef]
  24. Iqbal, S.; Xin, A.; Jan, M.U.; Salman, S.; Zaki, A.U.M.; Rehman, H.U.; Shinwari, M.F.; Abdelbaky, M.A. V2G Strategy for Primary Frequency Control of an Industrial Microgrid Considering the Charging Station Operator. Electronics 2020, 9, 549. [Google Scholar] [CrossRef] [Green Version]
  25. Mouli, G.R.C.; Bauer, P.; Zeman, M. System design for a solar powered electric vehicle charging station for workplaces. Appl. Energy 2016, 168, 434–443. [Google Scholar] [CrossRef] [Green Version]
  26. Iqbal, S.; Xin, A.; Jan, M.U.; Abdelbaky, M.A.; Rehman, H.U.; Salman, S.; Aurangzeb, M.; Rizvi, S.A.A.; Shah, N.A. Improvement of Power Converters Performance by an Efficient Use of Dead Time Compensation Technique. Appl. Sci. 2020, 10, 3121. [Google Scholar] [CrossRef]
  27. Lee, D.; Park, J.; Shin, H.; Choi, Y.; Lee, H.; Choi, J. Microgrid Village Design with Renewable Energy Resources and Its Economic Feasibility Evaluation. In Proceedings of the 2009 Transmission & Distribution Conference & Exposition: Asia and Pacific, Seoul, Korea, 26–30 October 2009; pp. 1–4. [Google Scholar] [CrossRef]
  28. Biya, T.S.; Sindhu, M.R. Design and Power Management of Solar Powered Electric Vehicle Charging Station with Energy Storage System. In Proceedings of the 2019 3rd International Conference on Electronics, Communication and Aerospace Technology (ICE-CA), Coimbatore, India, 12–14 June 2019; pp. 815–820. [Google Scholar] [CrossRef]
  29. Biswas, S.; Kabir, M.A.; Rabby, M.F.; Nazmi, N.N.; Faiz, R. Solar Powered Tea Harvester with Isolated Charging Station in Sylhet, Bangladesh. In Proceedings of the 2021 2nd International Conference on Robotics, Electrical and Signal Processing Techniques (ICREST), 5–7 January 2021; pp. 259–262. [Google Scholar] [CrossRef]
  30. Habib, S.; Khan, M.M.; Abbas, F.; Numan, M.; Ali, Y.; Tang, H.; Yan, X. A framework for stochastic estimation of electric vehicle charging behavior for risk assessment of distribution networks. Front. Energy 2020, 14, 298–317. [Google Scholar] [CrossRef]
  31. Hu, J.; Liu, X.; Shahidehpour, M.; Xia, S. Optimal Operation of Energy Hubs with Large-Scale Distributed Energy Resources for Distribution Network Congestion Management. IEEE Trans. Sustain. Energy 2021, 12, 1755–1765. [Google Scholar] [CrossRef]
  32. Wei, Z.; Quan, Z.; Wu, J.; Li, Y.; Pou, J.; Zhong, H. Deep Deterministic Policy Gradient-DRL Enabled Multiphysics-Constrained Fast Charging of Lithium-Ion Battery. IEEE Trans. Ind. Electr. 2022, 69, 2588–2598. [Google Scholar] [CrossRef]
  33. Liu, K.; Wei, Z.; Zhang, C.; Shang, Y.; Teodorescu, R.; Han, Q.-L. Towards Long Lifetime Battery: AI-Based Manufactur-ing and Management. IEEE/CAA J. Autom. Sin. 2022, 9, 1139–1165. [Google Scholar] [CrossRef]
  34. Jaganath, M.M.; Ray, S.; Choudhury, N.B.D. Techno-enviro-economic optimization of renewable energy potential in North Eastern India. Int. J. Ambient Energy 2022. [Google Scholar] [CrossRef]
  35. Praveenkumar, S.; Agyekum, E.B.; Ampah, J.D.; Afrane, S.; Velkin, V.I.; Mehmood, U.; Awosusi, A.A. Techno-economic optimization of PV system for hydrogen production and electric vehicle charging stations under five different climatic conditions in India. Int. J. Hydrogen Energy 2022. [Google Scholar] [CrossRef]
  36. Li, C.; Shan, Y.; Zhang, L.; Zhang, L.; Fu, R. Techno-economic evaluation of electric vehicle charging stations based on hybrid renewable energy in China. Energy Strategy Rev. 2022, 41, 100850. [Google Scholar] [CrossRef]
  37. Minh, P.V.; Quang, S.L.; Pham, M.-H. Technical Economic Analysis of Photovoltaic-Powered Electric Vehicle Charging Stations under Different Solar Irradiation Conditions in Vietnam. Sustainability 2021, 13, 3528. [Google Scholar] [CrossRef]
  38. Lin, Y.; Fu, L. A Study for a Hybrid Wind-Solar-Battery System for Hydrogen Production in an Islanded MVDC Network. IEEE Access 2022, 10, 85355–85367. [Google Scholar] [CrossRef]
  39. Zhang, J.; Zhang, Y.; Li, T.; Jiang, L.; Li, K.; Yin, H.; Ma, C.L. A Hierarchical Distributed Energy Management for Multiple PV-Based EV Charging Stations. In Proceedings of the IECON 2018-44th Annual Conference of the IEEE Industrial Electronics Society, Washington, DC, USA, 21–23 October 2018; pp. 1603–1608. [Google Scholar] [CrossRef]
  40. Jahangiri, M.; Nematollahi, O.; Haghani, A.; Raiesi, H.A.; Shamsabadi, A.A. An optimization of energy cost of clean hybrid solar-wind power plants in Iran. Int. J. Green Energy 2019, 16, 1422–1435. [Google Scholar] [CrossRef]
  41. Yoomak, S.; Ngaopitakkul, A. Development of Sustainable Nanogrid Road Lighting Systems. IEEE Trans. Intell. Transp. Syst. 2021, 22, 6682–6699. [Google Scholar] [CrossRef]
  42. Xie, Z.; Qi, W.; Huang, C.; Li, H. Effect Analysis of EV Optimal Charging on DG Integration in Distribution Network. In Proceedings of the 2019 IEEE 8th International Conference on Advanced Power System Automation and Protection (APAP), Xi’an, China, 21–24 October 2019; pp. 525–528. [Google Scholar] [CrossRef]
  43. Almehizia, A.A.; Al-Masri, H.M.K.; Ehsani, M. Feasibility Study of Sustainable Energy Sources in a Fossil Fuel Rich Country. IEEE Trans. Ind. Appl. 2019, 55, 4433–4440. [Google Scholar] [CrossRef] [Green Version]
  44. Wu, M.; Li, Z.; Fan, J. Selection of new energy vehicles using hybrid approach: A case study of China. IFS 2021, 40, 11967–11980. [Google Scholar] [CrossRef]
Figure 1. King Abdullah Campus University of Azad Jammu and Kashmir.
Sustainability 14 13767 g001
Figure 2. Grid-Connected Solar Charging Station.
Sustainability 14 13767 g002
Figure 3. Solar Radiation and Clearness Index.
Sustainability 14 13767 g003
Figure 4. Flow Chart for the Design of EV Charging Station.
Sustainability 14 13767 g004
Figure 5. System Model with Battery Backup.
Sustainability 14 13767 g005
Figure 6. System Model without Battery Backup.
Sustainability 14 13767 g006
Figure 7. Cost analysis with Storage system.
Sustainability 14 13767 g007
Figure 8. Cost Analysis of the System without Storage.
Sustainability 14 13767 g008
Table 1. Clearness Index, Solar Irradiance, and Temperature of the Location.
MonthClearness IndexRadiation (kWh/m2)Temp (°C)
January0.5682.9505.450
February0.5483.5707.030
March0.5494.55012.040
April0.5885.88017.700
May0.6306.99023.630
June0.6477.46027.430
July0.5856.60026.430
August0.5735.94024.460
September0.6445.70022.030
October0.6964.89017.270
November0.6743.69012.150
December0.5832.7907.840
Average0.6075.0816.96
Table 2. System Architecture with Storage.
ComponentsNameSizeUnit
PVGeneric flat-plate PV module19.8kW
StorageLGChem RESU10 [9.8 kWh]1Strings
System converterSystem converter10.0kW
Table 3. System Architecture without Storage.
ComponentNameSizeUnit
PVGeneric flat-plate PV module20.0kW
System converterSystem Converter10.0kW
Table 4. Cost Analysis of the System with Storage.
NameCapital (USD)Operating (USD)Replacement (USD)Salvage (USD)Total (USD)
Generic flat-plate PV
LCGhem RESU 10 [9.8 kWh]
6916
40,000
25.89
64.64
0.00
35,338
0.00
−4791
7026
70,611
Sample Tariff0.0069,0950.000.0069,633
System converter350012.931485279.484718
System50,41669,19836,822279.48151,366
Table 5. Cost Analysis of the System without Storage.
NameCapital (USD)Operating (USD)Replacement (USD)Salvage (USD)Total (USD)
Generic flat-plate PV700025.860.000.007026
Simple Tariff0.0069,6330.000.0069,633
System Converter350012.931485−279.484718
System10,50069,6721485−279.4881,378
Table 6. Annualized Cost of the System with Storage.
NameCapital (USD)Operating (USD)Replacement (USD)Savage (USD)Total (USD)
Generic flat-plate PV534.981.980.000.00536.96
LCGhem RESU 10 [9.8 kWh]30945.002734−370.625462
System converter270.741.0114.87−21.62364.99
Simple tariff0.0053450.000.005345
System390053532848−392.2411,709
Table 7. Annualized Cost for the System without Storage.
NameCapital (USD)Operating (USD)Replacement (USD)Salvage (USD)Total (USD)
Generic flat-plate PV541.482.000.000.00543.48
Sample tariff0.005.3860.000.005386
System Converter270.741.00114.87−21.62364.99
System812.225389114.87−1.626295
Table 8. Power Production of the System with Storage Backup.
ComponentProduction (kWh)Percent
Generic flat-plate PV33,44849.8
Grid purchases33,69050.2
Total67,139100
Table 9. Power Production of the System without Storage Backup.
ComponentProduction (kWh)Percent
Generic flat-plate PV33,85547.1
Grid purchases33,05552.9
Total71,910100
Table 10. Power Consumption of the System with Storage.
ConsumptionConsumption (kWh)Percent
AC primary load37,96062.0
Grid purchases12,31120.1
EV charger served10,95017.9
Total61,221100
Table 11. Power Consumption of the System without Storage.
ComponentConsumption (kWh)Percent
AC primary load37,96058.0
Grid sales16,51025.2
EV charger served10,95016.2
Total65,420100
Table 12. EV Charging Session details.
Charging StationSession per YearAnnual Energy Saved (kWh)Energy per SessionSession per Day
Blank deferrable EV charger365010,9503.0010.0
Table 13. Comparison of Base system and Predicted System with Storage Backup.
CostsBase SystemPredicted System
CAPEXUSD 0.00USD 50,416
OPEXUSD 12,228USD 7809
Annual energy changeUSD 12,228USD 5345
LCDE iperUSD 0.250USD 0.191
CO2 emailed30,911 kg/yr21,292 kg/yr
Net present costUSD 158,071USD 151,366
Table 14. Base Case Electric Bill.
JanuaryFebruaryMarchAprilMayJuneJulyAugustSeptemberOctoberNovemberDecemberAnnual
Energy charge (USD)1044919.4210511014110910141031106110071032992.42104212,227
Energy purchased (USD)417736784203405547084056412442444029412939704168USD 49,541
Table 15. Month-wise Predicted Electricity Bill for the Proposed System.
JanuaryFebruaryMarchAprilMayJuneJulyAugustSeptemberOctoberNovemberDecemberAnnual
Energy charge (USD)574.26472.44508.12416.11363.15375.13405.82400.43471.67373.20438.32559.725345
Energy purchased (kWh)30552613295527562697270827362918273927282778300833,690
Energy sold (kWh)7587249231091124412211113103111371286104276912,311
Table 16. Characteristics of the Base System.
Base SystemProcessed System
Net present CostUSD 158,071USD 51,378
CAPEXUSD 0.00USD 10,500
OPEXUSD 12,228USD 5483
Annual energy chargeUSD 12,228USD 5386
LCOE per kWhUSD 0.250USD 0.0962
CO2 emitted30,911 kg/yr24,051 kg/yr
Table 17. Base Case Electric Bill for the system without Storage.
JanuaryFebruaryMarchAprilMayJuneJulyAugustSeptemberOctoberNovemberDecember
Energy
Charge (USD)
1044919,42105110191014103110611007$1031992.44104212,222
Energy
purchased (kWh)
417736784203405540784056412442444029412939704168
Total (USD)1044919.4210511014101911,0141031106110071032992.441042
Table 18. Predicted Electricity Bill for the system without Storage.
JanuaryFebruaryMarchAprilMayJuneJulyAugustSeptemberOctoberNovemberDecemberAnnual
Energy
Charge (USD)
579.88477.54511.49418.28363.89369.89405.47471.01405.63382.79437.18562.905386
Energy
Purchased (kWh)
33722613295527562697270727362918273927782728300833,600
Energy
Sold (kWh)
10531010127714561628160015071404145816381354109516,510
Table 19. Annualized Cost Without Storage.
MonthsEnergy
Purchased (kWh)
Energy
Sold (kWh)
Net Energy
Purchased (kWh)
Peak Load (kW)Energy Charge (USD)Total (USD)
January33721053232013.9579.88579.88
February29211010191013.7477.54477.54
March33231277204614.6511.49511.49
April31291456167313.6418.28418.28
May30831628145412.8363.58363.58
June30801600148012.9363.89369.89
July31281507162212.9405.47405.47
August33911404188712.8471.81471.81
September31101488162312.3405.63405.63
October31701638153112.2382.79471.81
November31031354174913.5437.18405.63
December33461095225213.2562.90382.79
Annual38,05516,51021,54614.65386562.90
Table 20. Annualized Cost with Storage.
MonthsEnergy
Purchased (kWh)
Energy
Sold (kWh)
Net Energy
Purchased (kWh)
Peak Load (kW)Energy Charge (USD)Total (USD)
January2055758229713.9574.20574.26
February2613724189013.7472.44472.44
March2955923203214.6508.12508.12
April27561091166412.6416.11416.11
May26971244145312.8363.15363.15
June27071221148612.9371.53371.53
July27361113162312.9405.82405.82
August20181031188712.8471.67471.67
September27391137160212.3400.43400.43
October27781286149312.2373.20373.20
November27281014171313.5428.32428.32
December2008769223913.2559.72559.72
Annual33,69012,31121,37914.653455345
Table 21. Polluting Gas Emissions of System.
QuantityValueUnits
Carbon Dioxide24,051kg/yr
Sulfur dioxide104kg/yr
Nitrogen oxides51kg/yr
Table 22. Comparison of Existing and Proposed Work.
ReferenceExisting WorkProposed Work
[35]PV system for hydrogen production and EV charging in IndiaPV system for EV charging with different storage backup
[36]Techno-economic analysis for EV charging station in ChinaTechno-economic and environmental impact of EV charging stations in Pakistan
[37]Technical and environmental impact of EVs charging stations with different solar irradianceImpact study with the same irradiance condition
[38]Hydrogen production by means of solar, wind, and storage based systemsSystem discusses the power production instead of hydrogen production
[39]Energy management of the distributed charging stationsEnergy management based on production
[40]Clean energy production in IranEnergy production in Pakistan utilizing clean energy resources
[41]Road lightening system based on PV systemCharging station based on PV system
[42]Technical effects of EV charging stationTechnical and economical effects
[43]Feasibility study for the countries which are rich in fossil fuelFeasibility study for a country that lacks fossil fuel resources
[44]Effect of EV charging in China.EV-based charging stations in Pakistan.
Publisher’s Note: MDPI stays neutral with regard to jurisdictional claims in published maps and institutional affiliations.

