Abstract
Under the new development pattern, promoting urban green transformation efficiently addresses resource and environmental restrictions and is the foundation of high-quality development. However, the development of green transformation in Chinese cities faces constraints in three dimensions, production, life, and ecology, and it is not clear whether the digital economy, as a key driver of green development, can empower urban green transformation. Therefore, this paper measures the level of urban green transformation from the three dimensions of production, life, and ecological space and empirically tests the impact of the digital economy on urban green transformation from 2011 to 2020 by using panel data from 41 cities in the Yangtze River Delta urban agglomeration. The results indicate: (1) The development of the green transformation level in the Yangtze River Delta urban agglomeration demonstrates a constant upward trend, but the absolute difference fluctuates and declines; (2) the development of the digital economy has a positive impact on urban green transformation, as well as changes in urban production, living, and ecological space; (3) the digital economy helps the green transformation of cities by supporting the growth of an advanced and rationalized industrial structure. Nevertheless, the indirect influence of an advanced and rational industrial structure on urban green transformation is quite different.
1. Introduction
With the transformation of China’s economy from high growth to high-quality development, urban transformation plays a crucial role. Moreover, since carbon neutrality goals have become a worldwide concern [1], the urban shift has taken on new significance: urban green transformation. Promoting the green transformation of cities helps build a multi-level green and low-carbon economic system, which is needed to reach carbon emissions peak and carbon neutrality. However, the rapid expansion of urbanization, especially as concerns the irrational production structures, the chaotic living spaces, and the deterioration of the ecological environment, hinders the green transformation of cities [2].
With the influence of COVID 19, the digital economy is rising against the trend as a new dawn of recovery. The digital economy enhances carbon efficiency and production through the integration of energy, electricity, industry, and transportation [3]. The digital economy squeezes the traditional development paradigm, which relies heavily on inputs and emissions [4]. That the development of digital technology can promote steady socio-economic development has become the general consensus of scholars around the world [5,6,7]; scholars from various countries have effectively verified that the digital economy can effectively remedy ecological and environmental problems, reduce greenhouse gas effects, and improve energy efficiency, thereby accelerating sustainable development, through research and analysis of relevant data from many developing and emerging countries [8,9]. In the post-pandemic era, it will promote a green economic recovery and hasten the green transformation of cities [10]. Various studies demonstrate that information technology is a cornerstone of social change and progress [11] and enhances social planning, construction, management, and services [12]. However, most studies have focused on the country or province as the object of study. Although the impact effects of the digital economy can be analyzed from a macro perspective, they cannot reflect the changes in resource allocation and talent flow brought about by the digital economy in each region within each country. Studies that are less likely to use cities as objects tend to ignore the differences between city clusters and the linkages within city clusters. In addition, related studies mostly focus on one of the dimensions of production, life, and ecology, and seldom put all three into the same research dimension, ignoring the impact and connection of the digital economy development process on the three dimensions of production, life, and ecology.
In reality, as environmental issues become more apparent throughout the globe, cities, as the economic and social hubs of the nation, are compelled to undergo a green development transformation. According to the <Digital Economy Report 2021> released by the United Nations Conference on Trade and Development, China has become one of the key drivers of the world’s digital economy. The rapid development of China’s digital economy has effectively driven China’s social development to a high-quality development stage and achieved initial results in green transformation [13]. It is worth noting that the Yangtze River Delta city cluster is the only world-class city cluster in China. It is a metropolitan area covering 41 cities, with a GDP of $427 million, an area of 350,000 square kilometers and a population of 235 million, and is a model and leader in the development of China’s digital economy. Although the Yangtze River Delta city cluster is closely connected internally, there are still obvious differences among cities [14], and the unbalanced distribution of resource endowment differences and development stages also hinder the green transformation of the Yangtze River Delta city cluster. Currently, the Yangtze River Delta urban agglomeration is currently facing the historical opportunity of implementing the “East Digital West Computing” project in China, which can further accelerate the development of the digital economy. China’s strategic goals of carbon peaking and carbon neutrality also urgently require the Yangtze River Delta city cluster to accelerate urban green transformation. So, does the digital economy help with greening the city cluster in the Yangtze River Delta? What are the mechanisms behind the demonstrated effects? It is the core theme of this research to clarify the influence of the digital economy on urban green transformation.
This study may make marginal contributions to the relevant research in three ways. First, distinguishing from previous studies, this paper takes the Yangtze River Delta city cluster as the research object and is able to grasp the intra-regional connections. In addition, through the differences in digital economy development within city clusters, the variation in the impact of digital economy development on urban green transformation at different stages is analyzed to provide effective experiences for the green transformation of various cities and regions. Secondly, this paper delineates green transformation into the transformation of production, living and ecological space at the city level, and constructs the index system of urban green transformation accordingly. Furthermore, on the basis of the overall impact, the impact of the digital economy on urban green transformation is described from the dimensions of production, life and ecological space. Finally, this paper uses an intermediary effect model to test this mechanism. It looks at how the digital economy affects the city’s greening in a rational industrial setting. The structure of the continuation section is as follows: the theoretical analysis and research hypotheses are conducted in Section 2. Section 3 describes the methods and data. In Section 4, the empirical results are discussed. Section 5 provides a summary of the findings and policy implications.
2. Theoretical Analysis and Research Hypothesis
2.1. Digital Economy Promotes the Green Transformation of Cities
The green transformation of cities emphasizes a shift to a more sustainable development paradigm, with an emphasis on socioeconomic growth and ecological and environmental carrying capacity. This paradigm for sustainable urban development will incorporate economic prosperity, social harmony, resource conservation, and ecological health [15]. The city’s green transformation includes intensive and efficient manufacturing space, livable and moderate living space, and attractive ecological space. The digital economy’s diversity, availability, and sharing are powerful driving forces for economic development and crucial for promoting green and low-carbon sustainable development initiatives and urban green transformation [16,17]. From the perspective of production, life, and ecology, these processes contribute to the digital economy’s role in urban green transformation. In addition, it is necessary to use the digital economy’s development dividend for the green transformation of the urban clusters in the Yangtze River Delta.
First, the rapid development of new technologies such as big data, cloud computing, the Internet of Things, blockchain, artificial intelligence, and 5G communication has gradually eliminated backward industries [18]. In addition, new industries such as electronic information product manufacturing, software and information services, and the Internet industry have been generated. Through the transformation of traditional industries, total factor productivity is comprehensively improved [19], thereby promoting the transformation of production space. The digital economy may employ network effects to avoid declining marginal effects and enhance manufacturing sector flow [20]. Digital industrialization disrupts traditional production methods and creates new management business models. Digital industrialization drives traditional industries to undergo digital transformation through the widespread use of information technology. Digital transformation is divided into three phases: digitization, digitalization, and digital transformation [21]. Digitization mainly embodies the encoding of analog information into digital format, and the storage and transmission of information through computers to precipitate data and digitize information [22,23]. Digitalization is the transformation of traditional processes through information technology. The use of information systems to record data in real time facilitates analysis and improvement of production processes, thus improving timeliness and communication efficiency, significantly reducing process time, and enabling digital supervision [24]. Digital transformation refers to the transformation of existing business models through big data, artificial intelligence and other information technologies. Based on precipitated data and process digitization, it is possible to build a digital platform for production, optimize operation and decision making, change traditional informative interaction, and realize online and mobile business [25,26]. Digital transformation uses information technology such as information collection and information identification to rearrange industrial division of labor and cooperation, comprehensively transform traditional industries, and improve total factor productivity.
Second, the digital economy changes people’s lives in an intelligent, networked, easy way and modifies consumption mode and pattern by promoting corporate innovation and space transformation [27]. The digital economy integrates into urban and rural lives, improves people’s information processing abilities, and reduces social costs [28]. The universality, convenience, and sharing of digital technologies provide solid guarantees for improving public services, eliminating urban and rural living differences, improving people’s livelihoods, and promoting social harmony [29,30]. As human society enters the mobile Internet era, stronger user stickiness generates massive data, and the digital economy gives full play to the role of information matching to match supply and demand, gradually forming a platform economy and a sharing economy [31], breaking the boundaries of time and space. Digital industrialization enables remote telecommuting and e-government through digital technology, thus improving the intelligence, networking capacity and convenience of living places and public services. The digital economy integrates digital technology with traditional industries, generating a “long tail effect” that overturns traditional production methods [32]. Through emerging technologies such as the Internet of Things and virtual reality, demand-driven production and business models that meet consumers’ individual needs are created, changing residents’ consumption patterns and modes, broadening consumer groups, and improving their comfort and convenience [33].
Lastly, the rise of the digital economy improves digital governance, raises environmental awareness, and forces traditional sectors to reform by increasing resource efficiency, which is good for the environment. Information technology innovation promotes the development of digital economy and effectively limits pollution by building a digital governance platform for the ecological environment [34,35,36]. Through the development of digital industrialization, new industries such as energy-saving and environmental protection, new energy vehicles, high-end equipment manufacturing and new materials put pressure on overly polluting enterprises and accelerate the digital management of the ecological environment [37]. The development of ecological civilization forces traditional industries to carry out the digital transformation of industries and promote the intelligent transformation of production modes. It promotes the integration and development of digital technology into the current economy and the efficiency of resource allocation [38]. The digital economy reduces the impact of human production and life on the environment by improving quality, efficiency, energy saving and reducing pollution. As a result of the initial study, this paper presents the following research hypotheses:
Hypotheses 1 (H1).
The growth of the digital economy has a direct beneficial influence on urban green transformation, as well as on urban production, lifestyle, and ecological spatial change.
2.2. Digital Economy’s Green Transformation Transmission
Apart from the direct impact on urban green transformation, the digital economy may also indirectly impact by improving industrial structure [39]. Differences in resource endowments and economic growth levels hinder green transformation in cities. The escalating industrial structure is vital for coordinating factor allocation and lowering regional development disparities.
First, the digital economy transforms the global labor market, restructures development partnerships, and promotes advanced industry [40]. The digital economy creates a “low-consumption, low-pollution, recyclable” production approach to green the city. The digital economy connects, balances, and drives secondary and tertiary industries, spreads digital innovations through synergy and positive feedback, and reduces the cost of digital transformation across other enterprises [41]. As China carries out new infrastructure construction including 5G base stations, ultra-high voltage, intercity high-speed railroads and urban rail transportation, new energy vehicle charging piles, big data centers, artificial intelligence, and industrial internet, it provides key drivers to provide convergence and innovation and accelerate the development of digital industries [42,43].The development of digital industry has led to the innovation and wide application of digital technologies such as big data and cloud computing, disrupting the business model that has been in place for a long time and pushes traditional industries toward digitization, automation, and intelligent transformation.
Second, the digital economy has the potential to enhance resource allocation and industrial structure. The digital economy promotes the green transformation of cities by enhancing the positive interaction between industrial structure rationalization and consumer upgrading by eliminating excess production capacity and coordinating regional and industrial growth [44]. The development and proliferation of digital technology such as big data and 5G communications support the incorporation of cutting-edge technologies into industrial organizations and value chains [45]. The digital economy promotes the integration of the industrial and service sectors and accelerates the formation of new industries such as new materials and new energy vehicles. By creating a “new infrastructure” for industrial digitalization, it may be possible to eliminate bottlenecks to data flow, establish correlations across production sectors, and encourage businesses to enhance their operational efficiency. By combining digital technology with traditional industries, the industrial structure can be optimized, and the digital supply chain cooperation network can be built [46] (Figure 1). Accordingly, the following is the research hypothesis:
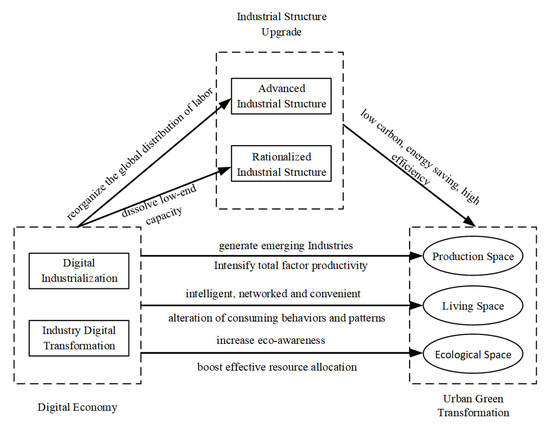
Figure 1.
The digital economy’s influence on Yangtze River Delta’s green transformation.
Hypotheses 2 (H2).
By promoting advanced industrial structure and industrial rationalization, the digital economy may indirectly affect urban agglomeration green transformation.
3. Models, Variables and Data
3.1. Model Setting
The following benchmark regression model is created to investigate the digital economy’s impact on cities’ green transformation.
where i and t signify city and time, is the level of green transformation of the city, and denotes the level of digital economy development. The vector represents a series of control variables; denotes the individual fixed effect of the city that does not change over time, controls for the time fixed effect, and denotes the random disturbance term.
Now we explore how the internet economy affects city greening. Based on the previous analysis, we evaluated whether industrial structure upgrading (M) is a variable that mediates the relationship between the digital economy and urban green transformation. Based on evidence that the digital economy has a significant impact on urban green transformation, the linear regression models of the digital economy on industrial structure upgrading and the digital economy on industrial structure upgrading on urban green transformation were established. The significance of the regression coefficients was used to determine the existence of a mediating effect. The specific forms of the above regression model set are as follows:
3.2. Variable Settings
3.2.1. Explanatory Variables
The urban green transformation aims to build a sustainable paradigm for urban expansion, social harmony, resource conservation, and environmental soundness. This article divides urban green transformation into production space, living space, and ecological space changes and establishes the Yangtze River Delta city cluster’s green transformation index system based on city-level data [47].
Urban production space optimizes the efficiency of inputs and outputs in the social production process [48]. Urban production space input intensification and output efficiency are achieved by optimizing capital and staffing inputs among industries to maximize value-added. The evaluation index system of urban production space transformation is constructed using two elements of input intensification and output efficiency.
According to the World Health Organization and the United Nations Conference on Housing and Sustainable Urban Development’s basic notion of comfortable living, urban living space is where residents go around their daily lives. This includes comfort of living environment; the equity of medical care, education and income; the convenience of transportation and entertainment; and the safety of health and security [49]. Based on the four factors, this study creates an urban living space transformation evaluation index system.
Urban ecological space is where ecological services are provided, ecological security is ensured, and people’s quality of life is improved. The focus is on reducing pollution, improving pollution management, and expanding urban green space [50]. Therefore, the evaluation index system of urban ecological space transformation is constructed from the indicators of three aspects: reducing pollution, managing pollution, and increasing greenery.
So, the urban green transformation index system uses three dimensions: urban production space, living space, and ecological space (see Table 1).

Table 1.
Urban green transformation evaluation index system.
The green transformation of the city harmonizes the living, working, and ecological areas and creates a livable city where people and the environment live in harmony. The level of urban green transformation is measured using weighted approaches such as the production space transformation index, dwelling space transformation index, and ecological space transformation index, recorded as Green.
3.2.2. Core Explanatory Variable
The digital economy (Dige) combines digital information, the Internet, and digital technological innovation. Due to inadequate city-level digital economy data, this research evaluates Internet development and digital financial inclusion [51]. The number of Internet users per 100 people, the proportion of computer service and software employees, number of telecommunication services per population, and number of mobile phone users per 100 people were used to gauge Internet development. Digital financial inclusion was constructed by the Peking University Institute of Digital Finance and the fintech company Alibaba Ant Financial Service. The entropy method calculates the lnDige.
3.2.3. Control Variables
- (1)
- Human capital, an essential resource for greening cities, drives economic growth and promotes environmental consciousness [52]. Human capital may be described using the college student-to-resident ratio (Hum).
- (2)
- As China’s economy enters a new cycle, inventive aptitude and financial development become more crucial. The number of patents awarded to the resident population is advised to assess innovation capacity (Inn) [53]. Financial development (Fin) is measured by the financial deposit and loan balance per capita [54].
- (3)
- Foreign economic and commercial activity are essential indicators of a city’s development, and reliance on foreign commerce affects industrial restructuring. FDI can create a “pollution paradise.” Foreign trade dependency (Trade) is assessed using import and export ratios to GDP [55], whereas foreign investment uses total foreign direct investment (Fdi).
- (4)
- Fiscal policy and macroeconomic regulation affect city growth. Green growth may benefit from fiscal policies. Fiscal decentralization is measured by the prefecture-level city budgetary income ratio to the federal or national government (Gov).
3.2.4. Mediating Variables
Industrial structure upgrading includes sophisticated (High) and rationalized (Rat) industrial structures [56], which incorporate output structure, employment structure, and inter-industry variability. This research will measure the advanced industrial structure using Fu’s approach [57]. First, the GDP is divided into three components according to the three industry divisions, and the value added of each component is used as a component of the spatial vector to form a set of 3-dimensional vectors . The angles : of the vectors are then calculated separately with the industries arranged from the lower to the higher level. A greater industrial structure advanced index (High) means a higher level. Shanghai has a more sophisticated industrial structure than other Yangtze River Delta cities, with tertiary industry accounting for 70% of added value. Consequently, the advanced industrial structure is processed logarithmically and recorded as lnHigh.
Past studies have primarily employed the Thiel index to characterize industrial structure rationalization. However, the Thiel index can induce the phenomena of “pseudo-rationalization.” Consequently, this study employs the degree of industrial structure deviation to assess the rationalization (Rat).
3.3. Data Sources and Descriptive Statistics
Data from 41 Yangtze River Delta cities were used for the digital economy development and urban green transformation indexes. Based on digital inclusive finance data and the 2010 elimination of Chaohu, 41 Yangtze River Delta cities were analyzed. The study uses data from the China City Statistical Yearbook, China City Construction Statistical Yearbook, and China Regional Economic Statistical Yearbook. Descriptive statistics were used for all variables in this work; the findings are reported in Table 2.
Table 2.
Descriptive statistics of variables.
4. Measurement, Results and Empirical Tests
4.1. Yangtze River Delta Green Transformation Index Analysis
Table 3 shows the green transformation indices of 41 cities in the Yangtze River Delta urban agglomeration. Shanghai (0.63), Nanjing (0.66), and Hangzhou (0.62) had mean green transition index values over 0.6 from 2011–2020. These cities are the centers of the Yangtze River Delta city cluster, with strong scientific research, competent government governance, and extensive industrial backing to achieve green transformation. Suzhou2, Fuyang, and Bozhou, all in northern Anhui, had mean values below 0.4. These cities have not changed the prior economic development paradigm, which prevents urban greening, along with natural resource scarcity and pollution. Due to high-quality development, green transformation in these cities has improved. The green transformation degree of each Yangtze River Delta city cluster city has improved between 2011 and 2020.
Table 3.
Green transformation of the Yangtze River Delta from 2011 to 2020.
The research compares urban green transformation in three provinces and one city in the Yangtze River Delta using a line graph (Figure 2). From 2011 to 2020, Figure 2 depicts the Yangtze River Delta’s change in greenness. Shanghai’s urban green transformation level exceeds the average level of the other three provinces. It developed gently at first and then more rapidly. Jiangsu and Zhejiang both have modest growth that is gradual. The level of green transformation in Anhui Province is low compared to other Yangtze River Delta provinces and cities. Anhui’s degree of green transformation increased over the sample period, reducing the gap between Jiangsu and Zhejiang.
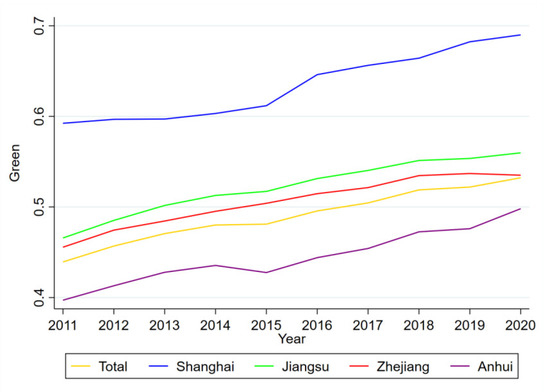
Figure 2.
Yangtze Delta urban agglomeration change folding line chart.
In this study, three typical years, in the beginning, middle, and end of the sample period, are used to display the kernel density estimation of urban green transformation to further emphasize the dynamic development pattern of green transformation in the Yangtze River Delta city cluster (Figure 3). Figure 3 shows the Yangtze River Delta urban agglomeration’s “single peak” rightward development. It shows that the Yangtze River Delta metropolitan agglomeration is undergoing a green makeover. The green development idea has hastened the traditional economy’s transition and upgrading, and the green transformation effort has attained stage outcomes. The curve’s width expands with “little expansion and small constriction,” while the height of the main peak declines and rises. The curve distribution extension shows a convergence tendency with a fading trailing characteristic. This bundle of evolutionary features shows that inequalities in resource endowments and industrial foundation levels limit cities’ potential to support urban green transformation. Green transformation routes vary widely. Thanks to the orderly development of ecological civilization construction, cities with lower and higher levels of green transformation are converging to the average, and absolute disparities are shrinking. Is there a substantial connection between the green transformation of the Yangtze River Delta city cluster and the growth of the digital economy? This paper builds a scatter plot and fits a curve to show their relationship (Figure 4). Figure 4 indicates a favorable relationship between the digital economy and urban green transformation. It shows that improving the digital economy’s development level can speed up urban green transformation. The relationship needs empirical evidence.
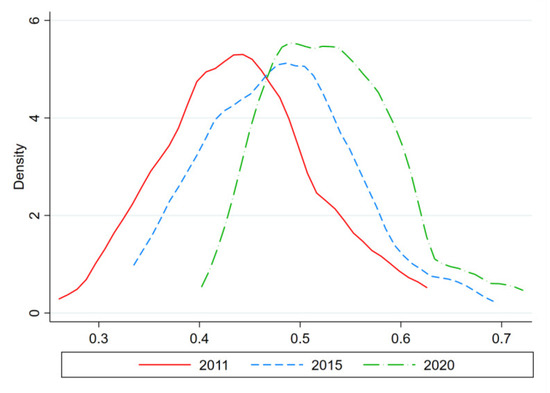
Figure 3.
Green transformation kernel density in Yangtze River Delta.
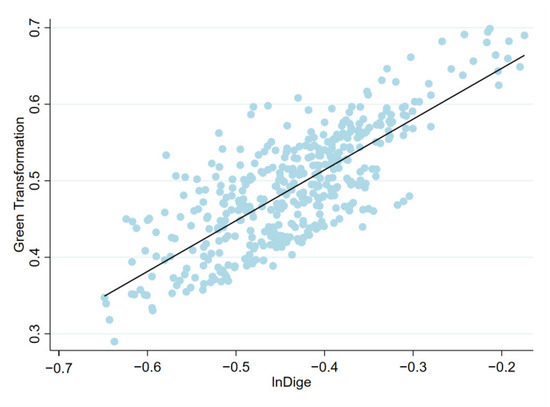
Figure 4.
Scatter plot of green transformation and digital economy.
4.2. Benchmark Regression Results
The tests of multicollinearity, heteroskedasticity, and autocorrelation are ruled out using autocorrelation and the variance inflation factor. Table 4 columns (1) and (2) demonstrate digital economy parameter estimations impacting the green transformation of the Yangtze River Delta city cluster. Positive digital economy coefficients on urban green transformation pass the 1% significance test. Arguably, this means that the digital economy may make cities greener. Human capital (Hum) and fiscal decentralization (Gov) are both linked to greening cities (2). They pass the 1% significance test, indicating that human capital developed via education and fiscal decentralization has a non-trivial positive influence on urban green transformation transition. At 1%, the computed coefficient of financial development (Fin) is negative, meaning that increased financial growth would not lead to green transformation in cities. Increased financial development encourages financial institutions to borrow excessively, which promotes business speculation and generates pollution emissions. High borrowing increases systemic risk uncertainty, which hinders urban green transformation (Wagner, 2010). The significance test failed at the 10% threshold for innovation capacity (lnInn), foreign investment (Fdi), and foreign trade dependency (Trade). Increasing innovation capacity may not be enough to enable urban green transformation since existing innovation focuses less on green technical innovation. The power to effect urban green transformation must be improved [58]. International investment and foreign trade dependency are incompatible with urban green transformation because they increase local reliance on foreign business. Moreover, foreign capital may bring about a “pollution paradise” effect, which is not conducive to promoting the green transformation of the city. In order to further analyze the influence of the digital economy on the green transformation of the Yangtze River Delta urban agglomeration, this study analyzes the digital economy’s influence on the city’s green transformation from the perspectives of production, living, and ecological space.
Table 4.
Baseline regression results.
The estimated coefficients of the impact of the digital economy on green living, green production, and green space in the city are positive and pass the 5% significance test in columns 3, 5, and 7. After adding each control variable, the coefficients of the digital economy on green production, lifestyle, and ecological space pass the 5% significance test. The digital economy modifies production, living, and ecological space through industrial digitalization and digital industrialization. The digital economy enhances productivity, alters manufacturing techniques, and transforms urban production sites. It also helps with the development of intelligent cities by boosting the ease and comfort of inhabitants. The digital economy can replace the old crude manufacturing method and diminish environmental degradation in the transition of urban ecological spaces. This paper’s study demonstrates that H1 is valid.
4.2.1. Rejection of Abnormal Samples
The existence of abnormal samples could bias the results of the study. Shanghai is significantly larger than the other Yangtze River Delta cities in terms of the economic scale, population size, and administrative status, as it is the only municipality directly under the central government. The estimated coefficients of the digital economy on the green transformation and the three spatial transformations of the Yangtze River Delta city cluster remain significant at the 1% level, and the test results are consistent with what has come before (Table 5).
Table 5.
Regression results of removing abnormal samples.
4.2.2. Control of Fixed Effects
For several years, the Chinese government’s work report has cited the digital economy as the driving force of the new growth stage. Three provinces and one city in the Yangtze River Delta have actively promoted the digital economy and enacted digital-specific legislation. Unobservable factors at the provincial level may influence the estimation outcomes in the research analysis. Using province fixed effects and province and year interaction effects, this study employs Zhao et al. (2020) [51] to offset the possible changes in the macro-systemic environment brought on by the growth of the digital economy. Table 6 presents the estimation results. The computed coefficients for the digital economy in columns (1) through (8) are all statistically positive at the 5% level, indicating that the study’s findings remain robust after accounting for macroeconomic factors.
Table 6.
Test of province fixed effects.
4.2.3. Endogeneity Test
The previous article found that the digital economy benefits the Yangtze River Delta urban agglomeration’s green transformation as well as the three major spatial transformations and that there is a considerable positive link between them. However, the aforementioned study’s analytic procedure may involve possible endogeneity problems to cope with endogeneity difficulties coming from omitted variables and two-way causation. The approach of Alesina & Zhuravskaya (2011) [59] is used in this research to assess the endogeneity problem by choosing the relevant instrumental variables. Because cultural traditions, economic policies, and economic development constraints are relatively similar among different parts of the Yangtze River Delta city cluster, and digital economy development is strongly correlated, this paper draws on Cai & Dong (2016) [60]. It uses the mean value of the digital economy development level of other cities in the Yangtze River Delta city cluster in that year as the instrumental variable, which can satisfy the research questions. The 2SLS instrumental variables technique is used to conduct regressions in this study, and the regression results are reported in Table 7.
Table 7.
Instrumental variables method test.
The computed coefficients all remain significant at the 5% level, indicating that the influence of the digital economy on the green transformation and the three spatial transformations of the Yangtze River Delta city cluster remains once the endogeneity problem is completely examined. Furthermore, this paper uses the K-Paaprk rk LM statistic to examine the under-identification problem, the weak instrumental variable problem with the K-Paaprk Wald F statistic, and the over-identification problem with the Hanse J statistic, and the findings reveal that none of these issues exist. As a result, the instrumental variables used in this paper are fairly reliable. Overall, the influence of the digital economy on the green transformation and the three spatial transformations of the Yangtze River Delta urban agglomeration stays consistent with the study mentioned above after resolving the potential endogeneity problem.
4.3. Intermediary Effect Analysis
The above paper examines the transmission mechanism of the digital economy to promote urban green transformation by influencing industrial structure advancement and rationalization. To test the hypothesis of this mechanism of action, this paper uses the mediating effect model for empirical testing, with the specific results shown in Table 5 and Table 6. The coefficients are significant at the 1% level, showing that the digital economy promotes advanced industrial structure and rationalization.
Sophisticated industrial structure and rationalization are added to the digital economy’s urban green transformation regression equation in Table 8 and Table 9. The digital economy’s advanced industrial structure can contribute to the sustainability of the Yangtze River Delta urban agglomeration’s sustainability (Table 8, Column 3). The digital economy and the advanced industrial structure are significant at the 1% level, and the digital economy’s impact coefficient decreases relative to the baseline regression, indicating that the digital economy can facilitate the green transformation of the Yangtze River Delta urban agglomeration through the advanced industrial structure. The coefficients for the digital economy (lnDige) in Table 9, column 3 are significantly positive at the 1% level, even though industrial structure rationalization has no significant mediating effect on green transformation. This paper looks at how advanced and rationalized industrial structures affect the green transformation of cities from the points of view of production, living, and ecological space. The goal is to show how the digital economy affects the green transformation of the Yangtze River Delta urban agglomeration through advanced industrial structures and why rationalizing industrial structures cannot play a significant role.
Table 8.
Intermediation effect test (High).
Table 9.
Intermediation effect test (Rat).
After incorporating the advanced industrial structure in Table 8, the estimated coefficients of the digital economy’s three major spatial shifts decrease compared to the regressions at the start, but all are above 10 percent. The estimated coefficients of advanced industrial structure in columns (7) and (9) are significantly positive. They pass the 5% significance test, indicating that the digital economy can facilitate the transformation of living space and ecological space by improving the advanced industrial structure. Increases in advanced industrial structures can increase the proportion of the tertiary industry, significantly improve the level of the service industry to improve the quality of life of residents and promote the transformation of living space, and effectively alleviate the problem of environmental pollution by reducing the proportion of primary and secondary industries, which is conducive to the transformation of ecological space. The effect of advanced Industrial structure on the transformation of production space is not significant as shown in column (5), indicating that its expansion will not affect production space in the Yangtze River Delta urban agglomeration. Perhaps this is because the Yangtze River Delta city cluster blindly promotes the advanced industrial structure, which causes the problem of “hollowing out” of the industrial structure and weakens the economic structure’s stability.
After incorporating industrial structure rationalization in columns (5), (7), and (9) of Table 9, the estimated digital economy coefficients on the three major geographical transformations differ from the baseline regression. The calculated coefficients of ecological spatial transformation for the digital economy grow, but all remain significant at the 10% level. The estimated industrial structure rationalization coefficients in columns (5) and (7) are significantly negative at the 1% level, indicating that the digital economy can enhance industrial structure rationalization and accelerate inter-industry factor integration. The digital economy can accelerate inter-industry factor allocation optimization, improve utilization efficiency, and strengthen the positive interaction between industrial structure rationalization and consumption upgrading by coordinating inter-industry resource allocation to meet the diverse needs of residents and improve their quality of life. The industrial structure rationalization coefficient in column (9) is positive at the 5% significance level, indicating that it impedes ecological spatial transformation, resulting in incompatibility between pollution emissions and urban ecological spatial development.
The Sobel–Aroian–Goodman and Bootstrap tests were used further to confirm the mediating roles of advanced and rational industrial structures. For further research into mechanisms of action, effect sizes of mediating variable routes must be clarified. This article uses the Cutler–Lleras–Muney technique [61]. The results demonstrate that advanced industrial structures mediate green transformation, spatial living, and ecological transformation in the Yangtze River Delta city cluster by 10.84%, 19.48%, and 10.23%, respectively. The rationalization of industrial structures reduces output and residential space by 22.58 and 21.74 percent, respectively. Industrial structure rationalization masks ecological space by 7.43%. It shows that advanced, rationalized industrial structures greatly mediate cities’ digital economy-driven green transformation.
5. Conclusions and Policy Implications
Using 41 cities in the Yangtze River Delta urban agglomeration as research objects, this paper empirically examines the effect of the digital economy on the green transformation of the Yangtze River Delta city cluster. This effect was empirically tested on three aspects, urban production space, living space and ecological space, using the panel fixed model and mediating effect model, and the following research conclusions were obtained. (1) Throughout the study period, the Yangtze River Delta urban agglomeration’s total level of green transformation grew steadily. However, there were significant differences between provinces and cities. They had more visible geographical characteristics, while the absolute differences within the urban agglomeration were shrinking as ecological civilization construction was implemented more thoroughly. (2) The digital economy, as a crucial driver for attaining high-quality growth, may substantially contribute to the Yangtze River Delta urban agglomeration’s green transformation, significantly impacting urban production, living, and ecological space. The finding remains valid when instrumental variables and other robustness tests are added. (3) The digital economy can help the Yangtze River Delta urban agglomeration achieve a higher level of green transformation by improving the advanced industrial structure, but it is not conducive to production space transformation. The rationalization of industrial structure, as a mediating variable, can enhance the transformation of production and living space but considerably restrict ecological space, with little impact on the Yangtze River Delta urban agglomeration’s green transformation. (4) The Yangtze River Delta city cluster’s green transition in the digital economy is aided by human capital and fiscal decentralization. In contrast, the Yangtze River Delta city cluster’s green transformation is hampered by financial development, international trade dependence, and foreign investment.
In light of the findings, this study offers pertinent policy recommendations for promoting the green transformation of cities through the digital economy.
First, the government should keep promoting green development, strengthen the idea of integrated development of the Yangtze River Delta, coordinate the growth of urban agglomerations, set up a competitive and cooperative relationship between urban agglomerations, and encourage the orderly development of urban green transformation.
Second, the government should speed up the construction of 5G networks, data centers, and the industrial Internet, undertake digital technology “neck” projects, and promote the digital economy. The green transformation of cities does not result from nothing, nor can it be achieved overnight. At the moment, boosting the digital economy can increase economic output, reduce environmental stress, and improve quality of life. This makes it possible for cities to change in a way that is orderly and green.
Third, the government needs to objectively evaluate the resource endowment gaps of various regions, follow scientific and orderly principles, and promote the upgrading of industrial structures. At present, China’s economic development has entered a new phase. With the complete execution of the “East Digital West Computing” project and the continued promotion of carbon peaking and carbon-neutral work, a new cycle of industrial structure optimization and upgrading is necessary.
Lastly, the government should support the green transformation of cities based on local conditions. On the one hand, each area should rely on its comparative advantages and propose digital economy support policies to generate new advantages and fully grasp the historical opportunity of “East Digital West Computing.” In addition, each region should expand its digital economy talent training program by aggressively introducing suitable people.
Author Contributions
X.C., Writing—Reviewing and Editing. J.S., Conceptualization, Methodology, Software, Data curation, Writing—Original draft preparation, Visualization, and Investigation. Z.Y., Writing—Reviewing and Editing. All authors have read and agreed to the published version of the manuscript.
Funding
This research received no external funding.
Institutional Review Board Statement
Not applicable.
Informed Consent Statement
Not applicable.
Data Availability Statement
In this contribution, only publicly available data from international data portals has been used.
Conflicts of Interest
The authors declare no conflict of interest.
References
- Jiang, P.; Sonne, C.; You, S. Dynamic Carbon-Neutrality Assessment Needed to Tackle the Impacts of Global Crises. Environ. Sci. Technol. 2022, 56, 9851–9853. [Google Scholar] [CrossRef] [PubMed]
- Zeng, P.; Wei, X.; Duan, Z. Coupling and Coordination Analysis in Urban Agglomerations of China: Urbanization and Ecological Security Perspectives. J. Clean. Prod. 2022, 365, 132730. [Google Scholar] [CrossRef]
- Li, Z.; Li, N.; Wen, H. Digital Economy and Environmental Quality: Evidence from 217 Cities in China. Sustainability 2021, 13, 8058. [Google Scholar] [CrossRef]
- Lange, S.; Pohl, J.; Santarius, T. Digitalization and Energy Consumption. Does ICT Reduce Energy Demand? Ecol. Econ. 2020, 176, 106760. [Google Scholar] [CrossRef]
- Pradhan, R.P.; Arvin, M.B.; Nair, M.; Bennett, S.E.; Bahmani, S. Short-Term and Long-Term Dynamics of Venture Capital and Economic Growth in a Digital Economy: A Study of European Countries. Technol. Soc. 2019, 57, 125–134. [Google Scholar] [CrossRef]
- Cheng, M. Sharing Economy: A Review and Agenda for Future Research. Int. J. Hosp. Manag. 2016, 57, 60–70. [Google Scholar] [CrossRef]
- Chala, N.; Poplavska, O. Digital Economy: Impact on the Socio-Economic Transformation in Ukraine. Наукoві Записки Наукма. Екoнoмічні Науки 2020, 5, 124–130. [Google Scholar] [CrossRef]
- Yin, W.; Kirkulak-Uludag, B.; Chen, Z. Is the Sharing Economy Green? Evidence from Cross-Country Data. Sustainability 2021, 13, 12023. [Google Scholar] [CrossRef]
- Dabbous, A.; Tarhini, A. Does Sharing Economy Promote Sustainable Economic Development and Energy Efficiency? Evidence from OECD Countries. J. Innov. Knowl. 2021, 6, 58–68. [Google Scholar] [CrossRef]
- Xu, S.; Yang, C.; Huang, Z.; Failler, P. Interaction between Digital Economy and Environmental Pollution: New Evidence from a Spatial Perspective. Int. J. Environ. Res. Public Health 2022, 19, 5074. [Google Scholar] [CrossRef]
- Ismagilova, E.; Hughes, L.; Dwivedi, Y.K.; Raman, K.R. Smart Cities: Advances in Research—An Information Systems Perspective. Int. J. Inf. Manag. 2019, 47, 88–100. [Google Scholar] [CrossRef]
- Kumar, H.; Singh, M.K.; Gupta, M.P.; Madaan, J. Moving towards Smart Cities: Solutions That Lead to the Smart City Transformation Framework. Technol. Forecast. Soc. Change 2020, 153, 119281. [Google Scholar] [CrossRef]
- Ji, Q.; Li, C.; Jones, P. New Green Theories of Urban Development in China. Sustain. Cities Soc. 2017, 30, 248–253. [Google Scholar] [CrossRef]
- Zhou, X.; Yang, L.; Gu, X.; Zhang, L.; Li, L. Scarcity Value Assessment of Ecosystem Services Based on Changes in Supply and Demand: A Case Study of the Yangtze River Delta City Cluster, China. Int. J. Environ. Res. Public Health 2022, 19, 11999. [Google Scholar] [CrossRef] [PubMed]
- Frantzeskaki, N.; Broto, V.C.; Coenen, L.; Loorbach, D. Urban Sustainability Transitions; Routledge: New York, NY, USA, 2017; ISBN 0-415-78418-2. [Google Scholar]
- Wang, L.; Chen, L.; Li, Y. Digital Economy and Urban Low-Carbon Sustainable Development: The Role of Innovation Factor Mobility in China. Environ. Sci. Pollut. Res. 2022, 29, 48539–48557. [Google Scholar] [CrossRef] [PubMed]
- Qi, G.; Wang, Z.; Wang, Z.; Wei, L. Has Industrial Upgrading Improved Air Pollution?—Evidence from China’s Digital Economy. Sustainability 2022, 14, 8967. [Google Scholar] [CrossRef]
- Wang, W.; Kumar, N.; Chen, J.; Gong, Z.; Kong, X.; Wei, W.; Gao, H. Realizing the Potential of the Internet of Things for Smart Tourism with 5G and AI. IEEE Netw. 2020, 34, 295–301. [Google Scholar] [CrossRef]
- Meng, F.; Zhao, Y. How Does Digital Economy Affect Green Total Factor Productivity at the Industry Level in China: From a Perspective of Global Value Chain. Environ. Sci. Pollut. Res. 2022, 79497–79515. [Google Scholar] [CrossRef]
- Shapiro, C.; Varian, H.R.; Carl, S. Information Rules: A Strategic Guide to the Network Economy; Harvard Business Press: Boston, MA, USA, 1998; ISBN 0-87584-863-X. [Google Scholar]
- Verhoef, P.C.; Broekhuizen, T.; Bart, Y.; Bhattacharya, A.; Dong, J.Q.; Fabian, N.; Haenlein, M. Digital Transformation: A Multidisciplinary Reflection and Research Agenda. J. Bus. Res. 2021, 122, 889–901. [Google Scholar] [CrossRef]
- Dougherty, D.; Dunne, D.D. Digital Science and Knowledge Boundaries in Complex Innovation. Organ. Sci. 2012, 23, 1467–1484. [Google Scholar] [CrossRef]
- Loebbecke, C.; Picot, A. Reflections on Societal and Business Model Transformation Arising from Digitization and Big Data Analytics: A Research Agenda. J. Strateg. Inf. Syst. 2015, 24, 149–157. [Google Scholar] [CrossRef]
- Li, F.; Nucciarelli, A.; Roden, S.; Graham, G. How Smart Cities Transform Operations Models: A New Research Agenda for Operations Management in the Digital Economy. Prod. Plan. Control. 2016, 27, 514–528. [Google Scholar] [CrossRef]
- Pagani, M.; Pardo, C. The Impact of Digital Technology on Relationships in a Business Network. Ind. Mark. Manag. 2017, 67, 185–192. [Google Scholar] [CrossRef]
- Iansiti, M.; Lakhani, K.R. Digital Ubiquity: How Connections, Sensors, and Data Are Revolutionizing Business. Harv. Bus. Rev. 2014, 92, 19. [Google Scholar]
- Savchenko, A.B.; Borodina, T.L. Green and Digital Economy for Sustainable Development of Urban Areas. Reg. Res. Russ. 2020, 10, 583–592. [Google Scholar] [CrossRef]
- Preacher, K.J.; Hayes, A.F. SPSS and SAS Procedures for Estimating Indirect Effects in Simple Mediation Models. Behav. Res. Methods Instrum. Comput. 2004, 36, 717–731. [Google Scholar] [CrossRef]
- Bertot, J.; Estevez, E.; Janowski, T. Universal and Contextualized Public Services: Digital Public Service Innovation Framework; Elsevier: Amsterdam, The Netherlands, 2016; Volume 33, pp. 211–222. ISBN 0740-624X. [Google Scholar]
- Zou, J.; Deng, X. To Inhibit or to Promote: How Does the Digital Economy Affect Urban Migrant Integration in China? Technol. Forecast. Soc. Chang. 2022, 179, 121647. [Google Scholar] [CrossRef]
- Sutherland, W.; Jarrahi, M.H. The Sharing Economy and Digital Platforms: A Review and Research Agenda. Int. J. Inf. Manag. 2018, 43, 328–341. [Google Scholar] [CrossRef]
- Kanat, I.; Raghu, T.S.; Vinzé, A. Heads or Tails? Network Effects on Game Purchase Behavior in the Long Tail Market. Inf. Syst. Front. 2020, 22, 803–814. [Google Scholar] [CrossRef]
- Bogers, M.; Hadar, R.; Bilberg, A. Additive Manufacturing for Consumer-Centric Business Models: Implications for Supply Chains in Consumer Goods Manufacturing. Technol. Forecast. Soc. Chang. 2016, 102, 225–239. [Google Scholar] [CrossRef]
- Ouyang, X.; Li, Q.; Du, K. How Does Environmental Regulation Promote Technological Innovations in the Industrial Sector? Evidence from Chinese Provincial Panel Data. Energy Policy 2020, 139, 111310. [Google Scholar] [CrossRef]
- Ayres, R.U.; Williams, E. The Digital Economy: Where Do We Stand? Technol. Forecast. Soc. Chang. 2004, 71, 315–339. [Google Scholar] [CrossRef]
- Denicolai, S.; Zucchella, A.; Magnani, G. Internationalization, Digitalization, and Sustainability: Are SMEs Ready? A Survey on Synergies and Substituting Effects among Growth Paths. Technol. Forecast. Soc. Chang. 2021, 166, 120650. [Google Scholar] [CrossRef]
- Yang, X.; Zhang, J.; Ren, S.; Ran, Q. Can the New Energy Demonstration City Policy Reduce Environmental Pollution? Evidence from a Quasi-Natural Experiment in China. J. Clean. Prod. 2021, 287, 125015. [Google Scholar] [CrossRef]
- Abukhader, S.M. Eco-Efficiency in the Era of Electronic Commerce–Should ‘Eco-Effectiveness’ Approach Be Adopted? J. Clean. Prod. 2008, 16, 801–808. [Google Scholar] [CrossRef]
- Sorescu, A.; Schreier, M. Innovation in the digital economy: A broader view of its scope, antecedents, and consequences. J. Acad. Mark. Sci. 2021, 49, 627–631. [Google Scholar] [CrossRef]
- Su, J.; Su, K.; Wang, S. Does the Digital Economy Promote Industrial Structural Upgrading?—A Test of Mediating Effects Based on Heterogeneous Technological Innovation. Sustainability 2021, 13, 10105. [Google Scholar] [CrossRef]
- Chen, Y.; Wang, L. Commentary: Marketing and the Sharing Economy: Digital Economy and Emerging Market Challenges. J. Mark. 2019, 83, 28–31. [Google Scholar] [CrossRef]
- Wu, J.; Zhang, Y.; Shi, Z. Crafting a Sustainable Next Generation Infrastructure: Evaluation of China’s New Infrastructure Construction Policies. Sustainability 2021, 13, 6245. [Google Scholar] [CrossRef]
- Zhang, X.; Zhang, Z. How Do Smart Villages Become a Way to Achieve Sustainable Development in Rural Areas? Smart Village Planning and Practices in China. Sustainability 2020, 12, 10510. [Google Scholar] [CrossRef]
- Ma, D.; Zhu, Q. Innovation in Emerging Economies: Research on the Digital Economy Driving High-Quality Green Development. J. Bus. Res. 2022, 145, 801–813. [Google Scholar] [CrossRef]
- Liu, Y.; Yang, Y.; Li, H.; Zhong, K. Digital Economy Development, Industrial Structure Upgrading and Green Total Factor Productivity: Empirical Evidence from China’s Cities. Int. J. Environ. Res. Public Health 2022, 19, 2414. [Google Scholar] [CrossRef] [PubMed]
- Yin, W.; Ran, W. Supply Chain Diversification, Digital Transformation, and Supply Chain Resilience: Configuration Analysis Based on FsQCA. Sustainability 2022, 14, 7690. [Google Scholar] [CrossRef]
- Wang, M.-X.; Zhao, H.-H.; Cui, J.-X.; Fan, D.; Lv, B.; Wang, G.; Li, Z.-H.; Zhou, G.-J. Evaluating Green Development Level of Nine Cities within the Pearl River Delta, China. J. Clean. Prod. 2018, 174, 315–323. [Google Scholar] [CrossRef]
- Hulten, C.R. Growth Accounting with Intermediate Inputs. Rev. Econ. Stud. 1978, 45, 511–518. [Google Scholar] [CrossRef]
- Shafer, C.S.; Lee, B.K.; Turner, S. A Tale of Three Greenway Trails: User Perceptions Related to Quality of Life. Landsc. Urban Plan. 2000, 49, 163–178. [Google Scholar] [CrossRef]
- Xu, C.; Dong, L.; Yu, C.; Zhang, Y.; Cheng, B. Can Forest City Construction Affect Urban Air Quality? The Evidence from the Beijing-Tianjin-Hebei Urban Agglomeration of China. J. Clean. Prod. 2020, 264, 121607. [Google Scholar] [CrossRef]
- Zhao, T.; Zhang, Z.; Liang, S.K. Digital Economy, Entrepreneurship, and High-Quality Economic Development: Empirical Evidence from Urban China. Manag. World 2020, 36, 65–76. [Google Scholar]
- Ahmed, Z.; Wang, Z. Investigating the Impact of Human Capital on the Ecological Footprint in India: An Empirical Analysis. Environ. Sci. Pollut. Res. 2019, 26, 26782–26796. [Google Scholar] [CrossRef]
- Hauknes, J.; Knell, M. Embodied Knowledge and Sectoral Linkages: An Input–Output Approach to the Interaction of High-And Low-Tech Industries. Res. Policy 2009, 38, 459–469. [Google Scholar] [CrossRef]
- Giuliano, P.; Ruiz-Arranz, M. Remittances, Financial Development, and Growth. J. Dev. Econ. 2009, 90, 144–152. [Google Scholar] [CrossRef]
- Antweiler, W.; Copeland, B.R.; Taylor, M.S. Is Free Trade Good for the Environment? Am. Econ. Rev. 2001, 91, 877–908. [Google Scholar] [CrossRef]
- Song, M.; Zhao, X.; Shang, Y. The Impact of Low-Carbon City Construction on Ecological Efficiency: Empirical Evidence from Quasi-Natural Experiments. Resour. Conserv. Recycl. 2020, 157, 104777. [Google Scholar] [CrossRef]
- Fu, L.H. An Empirical Research on Industry Structure and Economic Growth. Stat. Res. 2010, 27, 79–81. [Google Scholar]
- Zhao, S.; Jiang, Y.; Wang, S. Innovation Stages, Knowledge Spillover, and Green Economy Development: Moderating Role of Absorptive Capacity and Environmental Regulation. Environ. Sci. Pollut. Res. 2019, 26, 25312–25325. [Google Scholar] [CrossRef] [PubMed]
- Alesina, A.; Zhuravskaya, E. Segregation and the Quality of Government in a Cross Section of Countries. Am. Econ. Rev. 2011, 101, 1872–1911. [Google Scholar] [CrossRef]
- Cai, J.; Dong, Y. Banking Competition and Firms’ Innovation: Empirical Evidence from Chinese Industrial Enterprises Database. J. Financ. Res. 2016, 11, 96–111. [Google Scholar]
- Cutler, D.M.; Lleras-Muney, A. Understanding Differences in Health Behaviors by Education. J. Health Econ. 2010, 29, 1–28. [Google Scholar] [CrossRef]


Publisher’s Note: MDPI stays neutral with regard to jurisdictional claims in published maps and institutional affiliations. |
© 2022 by the authors. Licensee MDPI, Basel, Switzerland. This article is an open access article distributed under the terms and conditions of the Creative Commons Attribution (CC BY) license (https://creativecommons.org/licenses/by/4.0/).