Abstract
The article presents analysis and evaluation of information usefulness efficiency for recipients with secondary and higher education using the example of information and shopping websites. Different levels of quality and information usefulness efficiency have an impact on different ways of processing information by users which, in turn, may result in different consumer behavior and their decisions. The study describes the basic methodological assumptions, the research evaluation procedure of information usefulness efficiency, and the forms of informational content and various forms of information presentation and visualization, as well as the results of data analysis from the study conducted on a group of respondents. In order to determine the factors that have the greatest impact on the perception of information usefulness on websites by users, the data obtained from the study using various methods, such as online questionnaire, usability testing and heuristic analysis, were analyzed using the DEA method, which is usually used for the analysis and evaluation of efficiency. The results of the research presented in this article can be useful in creating assumptions for methods of content presentation and visualization of various forms of content building for the needs of different user groups for information and business websites.
1. Introduction
In today’s increasingly developed information society, one of the most popular media for years, allowing almost unlimited access to information from anywhere in the world, is the Internet. Thanks to web pages, websites and internet services, web users can browse any informational content, watch multimedia materials, communicate, shop or use online programs and applications. However, with the growing number of possible applications of the Internet, the amount of data collected in it also grows year by year. As a result, finding interesting content often becomes very difficult, time-consuming, and sometimes even impossible. Therefore, currently one of the main problems in accessing the requested information on the Internet is not the lack of its occurrence, but huge overloading, information gap and asymmetry, useless and incomprehensible ways of organizing and presenting information, or the multitude of IT tools enabling access to content on different ways. Therefore, appropriate ways of defining, describing, organizing and presenting content on websites are becoming more and more important for users, which in turn affect the usefulness of shared information and the increased effectiveness of mutual communication using websites and internet services. In turn, the most important goals for companies and organizations, operating online and striving for a high level of efficiency in their business, should be sustainable activities in relation to economic, social and environmental performance, otherwise referred to as corporate sustainability [1,2]. Moreover, such institutions should also be interested in using the idea of digital sustainability, that is, the use of IT tools for creating, using, transmitting, or sourcing electronic data for organizational activities, as well as introducing modern digital innovations and smart technologies into its business in order to ensure sustainable economic growth now and in the future [3,4]. Another important aspect of digital sustainability should also be attention paid to a high level of digital products and resource usability, due to the fact that there are more and more applications of modern technologies such as ICT, IoT or AI/ML in different areas of the economy [4,5]. Because of the fact that there is currently little research on the evaluation of information usefulness efficiency on websites in terms of sustainability, the authors of the article decided to cite the literature review of the research and concepts related as closely as possible to the issues raised in the work.
Interpersonal communication is the basis of existence and one of the most basic and oldest social processes that determines the existence and functioning of the world [6,7]. In the social sciences and humanities, communication is seen as a contact with people and a manifestation of mutual interactions, whose purpose is to share knowledge and information, as well as maintaining the social context needed to exchange thoughts, skills, feelings and ideas [8,9,10]. These processes take place by means of assigning and receiving the meaning of specific behaviors and symbols formed by words, images, gestures, sounds or touch. By communicating with each other, people receive and transmit information through individual senses, such as: eyesight, hearing, smell, touch or taste [11]. In business and organization, communication is a process that plays a significant role in the implementation of basic management functions, serves the purpose of providing information and mutual communication between the organization’s stakeholders and is the basis for building relationships between the company and the environment [12,13]. It is especially important to understand the form, content and meaning of the message between the sender and the recipient, thanks to which the main functions of the organization’s activities are satisfied, such as, among others: informing, planning, organizing, controlling and motivating [14,15,16]. In turn, in marketing, communication is a system of actions and means by which the company transfers various information to the market and tries to shape the behavior of both internal and external recipients. Marketing communication involves the coordination of promotional activities and other marketing activities in order to communicate with customers, which takes place by receiving and transmitting specific content or information [17,18]. One of the most popular, relatively cheap and quick-to-function communication channels used on a large scale in marketing communication are websites and internet services based on electronic media. They also perform a basic function according to the assumptions of the communication model in a hypermedia computing environment, which combines the possibilities of the mass communication model with the model of individualized communication, and also introduces a new quality of the process to marketing communication. This model presents a new meaning of the message, which is characterized by multimedia, the content and form of the message changing qualitatively, and the relationships and communications between marketing entities taking place interactively [19,20].
Effectiveness is a concept that has many meanings and various interpretations in the sciences of economics and management. One of the most frequently used approaches is efficiency or economy, which is the result of the activity of a business entity or specific project and the result of the relation between the obtained effects and the incurred costs. This effectiveness can be estimated before and after the activity starts, and the inputs can be expressed in terms of resources or costs [21,22,23]. Another popular approach is effectiveness or organizational effectiveness, which means the ability of a business entity or enterprise to adapt currently and strategically to changes in the environment as well as productive and economical use of resources to achieve the adopted goals [22,24,25]. Regardless of how different definitions of effectiveness are understood and interpreted, the general concept of effective communication is understood to mean the receipt of a message in the same sense as the intention of the sender, that is as the realization of a cognitive goal [26,27]. The task of effective communication is the most adequate transfer of widely understood information; that is, the ability to fulfill the intention of the act of communication. Adequacy refers here to the appropriate time, function, social reach and the content of the act of communication [28]. Effective communication between people depends, among other things, on similarities in communication skills and attitudes, degree and type of education, social experiences or culture of the sender and receiver [27]. On the other hand, to define organizational communication as effective, it should meet the following conditions: it should be based on business goals, rely on a clear set of expected results, create a pleasant climate, influence attitudes and focus on transforming information first into understanding and then into action [29,30].
Information is a concept that has a very large number of definitions and various interpretations among others due to its original character. For the purposes of analyzing the communication process, the concept of information should be understood as content expressed in linguistic and/or non-linguistic signs that means something to someone [31]. In turn, from the point of view of economics and management sciences and in the context of effective communication, it can be said that information is data that have been interpreted by its recipient or recipients and used for a specific purpose. Data are understood here as all kinds of facts, numbers and symbols that have not yet been analyzed and properly prepared [32]. According to P. Sienkiewicz, information is a set of facts, events or features of specific objects (things, processes, systems) contained in a message (statement), presented and given in such a form (figure) that allows the recipient to respond to the situation and take appropriate mental or physical action [33]. On the other hand, Wiener believes that information is a certain content, the source of which is the outside world, and the process of obtaining it is related to the adaptation of people to this world [34]. As can be seen in the above definitions, the concepts of data, message and content are essential elements in the process of informing. However, there are significant differences between informing and communicating, related inter alia with different goals of both processes, its participants or mutually occurring relations. Therefore, according to D. Weiss, informing concerns the transmission and reception of structured data, while the purpose of communication is the exchange of information aimed at changing someone’s consciousness [35,36]. In turn, A. Bartoli believes that only the sender of the message plays an active role in informing, while in the process of communication there is interaction between the participants; besides, it is an act, a subject and means of communicating information at the same time [37]. Features of information are selected aspects that describe it in more detail and include the following three characteristics: quality, value and usefulness. The information quality consists of appropriate features that information should have, so that its quality is at a sufficiently high level. The most often desired quality features of information include: timeliness, accuracy, veracity, adequacy, completeness, readability, etc. [32,38,39]. The information value usually means a certain feature that determines the measure of its suitability, but this feature is also referred to as valuableness, usefulness, importance of information or utility value [40]. According to A. Charkiewicz, the information value is also a combination of various features related to its quality and usefulness in terms of a specific recipient and decisions made by him [41]. Usefulness in the information dimension is related to the qualitative theory of information, which was first described by M. Mazur, and according to which the utility of the information concept determines its quality (inter alia accuracy, authenticity, etc.), amount (appropriate range of time and flowing frequency), and relationship with tasks (validity of the subject) [42]. According to P. Sienkiewicz, information usefulness is also related to the probability of achieving the intended goal for the taken action. Therefore, if the action is taken together with the information received, and the goal is achieved to a greater extent than it would have been before obtaining it, it can be said that the information was useful. Therefore, the effect of the taken actions must differ significantly before and after obtaining specific information [33]. According to Bogdan Stefanowicz in one of the most synthetic approaches presenting the useful information, it is said that this information should have the right content and be delivered at the right time and in the right form [43]. The information usefulness collected on the website is a number of different criteria that should be characterized by information content that is available, current or understandable to recipients [38,39]. The evaluation criteria of information usefulness for their suitability for a user may be features such as: accuracy, veracity, timeliness, completeness, reliability, adequacy, form, frequency of use, scope, coherence, source, time horizon, etc. [38,44,45].
Usability in the context of digital products is a scientific discipline dealing with the ergonomics and functionality of interactive devices and electronic applications, among others in terms of the ease and convenience of using websites and internet applications. Web usability, according to the ISO 9241-11 standard, defines the extent to which the website can be used by specified users to achieve specified goals in a specified context of use [46]. According to J. Nielsen, one of the best-known experts, the usability of an IT product is determined by such components as ease of learning, effectiveness of achieving goals in working tasks, ease of remembering acquired skills, system tolerance for errors and level of user satisfaction understood as a pleasure felt with system use [47]. In Nielsen’s opinion, usability is also a quality attribute which evaluates how easy to use user interfaces are and refers to methods of improving ease and pleasure of use during the design process [48]. In turn, another of the known practitioners of designing useful websites, namely S. Krug, calls to not make users unnecessarily think while using digital products. According to him, usability means the certainty that something works well and a person with average skills or experience can use it as intended, without being frustrated. In Krug’s opinion, useful things are characterized by such features as helpfulness, ease of learning, ease of remembering, effectiveness, efficiency, and being desirable and delightful [49]. Another approach for understanding information in the context of its usefulness in information systems are different concepts related to technical usability of these systems. Therefore, for end users, such aspects as perceived usefulness, perceived ease of use and usability of computer systems are important. According to F.D. Davis, the perceived usefulness is the degree to which a person believes that using a particular system would enhance her performance [50]. This type of usefulness has been confirmed by many researchers as a reliable and effective indicator to use for various information technologies by users with different levels of knowledge and experience. However, according to S.A. Gahtani, the perceived ease of use is the degree to which a person believes that using a particular system will not result in additional costs associated with its operation [51]. This type of usefulness describes the extent to which something new is not perceived as difficult to understand in study or practical use. In addition, as stated, E.M. Rogers perceived ease of use to be considered as the degree to which consumers perceive a new product or service as a better than its alternatives [52]. However, according to J. Nielsen, the usability of a computer system is the extent to which the system can be used by specified users to achieve specific purposes, consistent with the rules of effectiveness, efficiency and satisfaction in a specified context of use [53]. In practice, usability is a field of knowledge dedicated to the convenience and ergonomics of using computer systems, and in particular of Internet sites. The web service is useful when the first visit attracts the attention of visitors, and further browsing allows intuitive use of its resources [49,54].
Evaluation of information usefulness efficiency was treated by the authors of this article in the context of its economic efficiency evaluation, that is as a result of the relation between the obtained effects and incurred expenses. This is due to the fact that, on the one hand, access to the desired information enables the fulfillment of various information needs (income, effects, etc.), and on the other hand, actually getting to the right information is usually associated with incurring various related charges (costs, expenses, etc.). The literature on the subject points out that information has the potential to create effects or specific revenues, which is now reflected in its treatment as the fifth resource, as it meets the conditions imposed on resources in general, such as work, ground, capital or organization. Moreover, information as a resource has specific properties, such as the possibility of any use to achieve specific goals, having value and the requirement to incur costs to obtain them, being a mobile and non-consumable resource, manifesting the synergy effect, property of duplication and easy copying without leaving a sign of this treatment, or being an experimental good and a source of profit [55,56,57]. On the other hand, information is also characterized by the possibility of generating costs, which is especially noticeable during its acquisition, storage, processing, sending and sharing with recipients. This is related to the involvement of appropriate specialists, taking someone’s time, and using appropriate resources; that is, incurring specific financial, time and personnel costs. This is particularly evident in the case of media information markets, where most often the fixed costs of generating and preparing information are high (e.g., film production), while the variable costs of information reproduction are usually low (e.g., duplicating copies of film discs). Therefore, any information valuation should be carried out on the basis of its value, not just the cost of production [58]. Moreover, in order to obtain information that is more reliable, accurate and meeting the relevant quality requirements than the standard, it is necessary to incur higher costs, spend more time and put in more effort [55,56,57]. Other costs related to the use of information include psychological and cognitive barriers, such as: lack of appropriate knowledge to handle information, information overload, problems with remembering information, switching costs, costs of paying attention or information asymmetry [59].
The study presented in this article makes a significant contribution to the existing literature. It is one of the first studies on the analysis and evaluation of information usefulness efficiency applied to websites, using a combination of various types of quantitative and qualitative methods in research and analysis. The following four methods were used in the study: internet survey, usability testing, heuristic analysis and the DEA method. The article fills the research gap in the discussion on the possibility and applicability of using the DEA method on efficiency evaluation in a situation, where the role of decision-making units (DMUs) was given to people (respondents of the survey), and not machines, devices or institutions, as is usually practiced.
The article is structured as follows. In the first section, the literature review of the research and concepts related to the issues raised in the article on the evaluation of information usefulness efficiency on websites in terms of sustainability was reviewed. The second section characterizes the research problem, the research procedure, the research entity, the research object and thematic scope as well as the methods used in the research. The third section describes the individual stages of the research procedure, presents graphically obtained results from the preliminary data analysis carried out on the group of respondents and the main data analysis using the DEA method, and also carries out a detailed interpretation of the presented data. The fourth section makes a general interpretation of the results obtained from the study in terms of the evaluation of information usefulness efficiency on websites, summarizes the research carried out and draws conclusions for the future.
2. Materials and Methods
The research problem of the article is the analysis and evaluation of information usefulness efficiency applied to selected information and shopping websites with the use of selected methods. The evaluation of information usefulness efficiency was focused mainly on available informational content and various forms of information presentation and visualization, such as text, graphics, images, pictures, movies and information graphics. In addition, attention was also paid to knowledge increase aspects, cognitive aspects and user experience (UX) aspects. The selected research problem was prepared and developed on the basis of quantitative research (internet survey) and qualitative research using the usability testing and the heuristic analysis. Analysis of the results was carried out with the use of the DEA method.
The research entity survey conducted in May 2021 used a 34-person group of respondents, which was selected for the study by the targeted selection method and represented people with secondary and university education. The sample size was considered as statistically representative due to the specificity of the study related to the website’s usability evaluation. All respondents were students; most of them graduated from some form of higher education (52%), a smaller fraction graduated from high school (40%), and the others graduated from technical high school (8%). The vast majority of the respondents were citizens of Polish nationality (90%), and the others (10%) were citizens of other countries. All respondents represented two different age groups of young people aged 18–22 years old (65%) and 23–26 years old (35%). Among the respondents, the majority were women (57%) and the remainder were men (43%). From the answers obtained from the respondents, it can be concluded that exactly everyone (100%) uses the Internet several times a day. The most popular form of communication using the Internet among respondents were mobile devices (83%) and stationary devices such as laptops (57%); the use of desktop computers (44%) and tablet devices (4%) were reported significantly less.
The research objects were five different Polish-language internet services with the possibility of content reading and browsing, as well as online shopping. The websites included in the study, in terms of analysis and evaluation, were fully functional software products used to transmit and receive information content in various forms, scope and functionality. For the study, services with informative articles were selected based on the following aspects: the one selected topic, various forms of information presentation in the article, the time needed to read the textual content and view the multimedia content in the article, and the length of the article’s total content counted by the number of screens to scroll. Selected websites were characterized by various forms of information content presentation on the one specified topic, such as: textual content combined with images, pictures, movies, or infographics; full product specification in the form of textual content with a picture gallery; full product specification in the form of textual and multimedia content with software interactions; full product specification and the possibility of making online purchases and suggestions of sample products on the selected topic.
The thematic scope of the research was a group of electronic devices such as smartwatches, whose popularity in society in recent years is much higher than traditional watches and still growing. The smartwatch is a wearable computer, in the form of a watch with a touch screen and the size of a wristwatch, that meets all the functions of a traditional electronic watch and additionally has some smartphone functions and telemetry functions. Smartwatches most often operate based on mobile operating systems, are equipped with various types of wireless communication, and may have various additional functions, such as a digital camera, accelerometer, thermometer, pedometer, heart rate monitor, altimeter, barometer, compass, GPS receiver, MP3 player and more [60].
The research procedure of analysis and evaluation of information usefulness efficiency applied to the selected information and shopping websites consisted of taking the following steps:
- Creation of the survey, conducting the survey on selected websites and collecting data from respondents using the usability testing and heuristic analysis;
- Preliminary data analysis using normalization and construction of a hierarchical structure of criteria, which contain the list of eight groups of criteria related to different aspects of information usefulness, thematically assigned main criteria and obtained values of final results;
- Main data analysis using the DEA method and data interpretation for main criteria within the CCR-I and the BCC-I model;
- Drawing out conclusions from the analysis.
The usability testing is one of the most popular UX qualitative research methods, used for usability evaluation and based largely on the user-oriented design approach. This method is used primarily to assess the functionality and usability of websites [61]. Usability tests, as opposed to group tests, are usually carried out on individual users and rely on the practical use of selected functions of a website. During the performance of specific tasks, participants are asked to pay attention to what they see, do and feel, and then describe their impressions orally or in writing. The purpose of the research is to check the correct functioning of the website and to detect areas where users have problems, and then to provide recommendations for improvement [62].
The heuristic analysis is one of the UX expert research methods based on a group assessment made by specialists in a selected field, the so-called experts. These methods use the opinions and assessments of various people (e.g., experts, professionals and non-professionals) involved in solving a given problem, finding facts and relationships between them and formulating their own uninhibited judgments and proposals for solutions. Heuristic analysis deals with the study of creative thinking processes and formulating recommendations, which application allows for more effective problem solving [63]. The use of heuristic analysis to evaluate website usability usually consists of determining the degree of its compliance with recognized design principles, the so-called heuristics, UX guidelines, requirements or other evaluation criteria [48].
The data envelopment analysis method (DEA) is a linear mathematical programming technique that is used for the evaluation of the effectiveness (performance or efficiency) of a group of complex entities, referred to as decision-making units (DMUs). The DEA is one of the most widely applied non-parametric methodologies used to study frontier efficiency, ever since its introduction in 1978 by Charnes, Cooper, and Rhodes (acronym: CCR), that has grown into a powerful mathematical and linear programming technique [64,65]. The DEA method, as a non-parametric method, was created to overcome the limitations of various disadvantages of parametric methods, which means that it does not require the presentation of a functional relationship between inputs and outputs. The subject of the analysis of this method is efficiency or productivity; how DMUs transform their inputs into outputs. This method determines the most effective unit among the respondents, and the results of the others are referred to by creating a ranking of all units and demonstrating a leader worth following (the so-called benchmark). One of the main goals of DEA analysis is to improve the efficiency of ineffective DMUs, which, in relation to the reference unit, is referred to as the projection at the limit of production possibilities. As the type of set of units is not strictly defined here, any units capable of transforming inputs into outputs can be included in the analysis, and therefore units such as service, manufacturing, commercial, public sector or non-profit organizations can be analyzed [66,67]. However, the set of decision units to the analysis must be carefully selected in order to make meaningful comparisons. Therefore, the group of examined units should have a finite number, be fairly homogeneous, pursue the same goal and operate under the same market conditions [68]. The overall assessment of the productivity level for individual DMUs in the DEA method is measured as the quotient of the weighted sum of inputs (costs) to the weighted sum of outputs (revenues), where the result is a pointer in the range 0 to 1 [65,69]. In the DEA method, many models are distinguished, according to the orientation criterion and the scale effects criterion. The two basic and most commonly used models include the CCR and BCC models, which can be additionally input- or effect-oriented. In the CCR model, in which an assumption of constant returns to scale is made, the relative efficiency of a given unit is the same for input and output orientation, therefore CCR-I and CCR-O have the same result. In turn, the input-oriented BCC-I model is the first and most popular modification of the basic CCR-I model, which in turn has an impact on the method of estimating effectiveness. The BCC-I model is a model that assumes the existence of variable returns to scale (VRS), thanks to which it is possible to recognize whether the ineffectiveness of a given object results from the waste of inputs (the so-called pure technical ineffectiveness) or from operating in the non-optimal area of economies of scale (the so-called scale ineffectiveness). It may also be seen that the object is ineffective both technically and in terms of scale, which demonstrates the presence of so-called global technical ineffectiveness [70,71,72,73]. The DEA method has been widely used, researched and developed by scientists and practitioners all over the world for over 40 years since its inception in a variety of areas and types of units, such as schools, hospitals, universities, banks, agriculture, transportation, courts, companies, cities, regions and countries [65,66,74,75].
3. Results
3.1. The Survey
In the first stage of the research procedure, in order to collect data from respondents, an electronic survey was created using the free of charge Google Forms online survey system [76]. The survey study was based on the evaluation of selected criteria and performing simple successive tasks, which were performed in a network environment using an internet browser application and selected internet information and shopping services. All of the tasks were evaluated by respondents on a slightly extended Likert scale for values from 0 (lack of or lowest rating) to 5 (highest rating), based on the level of satisfaction and usability fulfillment of specific qualitative and impression criteria for content on selected internet services [77].
3.2. The Preliminary Data Analysis and Presentation of the Survey Results
In the second stage of the research procedure, preliminary data analysis was performed for a specific research problem. For this purpose, eight groups of criteria, related to different aspects of information usefulness, were built. The created groups of criteria were selected thematic areas of analysis and evaluation of information usefulness, and they related to the content and impressions of the articles, published on the analyzed websites, as part of the following aspects: informational, information presentation, knowledge increase, cognitive, user experience (UX) and economic effectiveness. Then, a list of thematically related main criteria was assigned to each of the groups of criteria, which were additionally divided into criteria with the feature of income (effect) or cost (input). The total number of groups for the criteria was eight and was selected on the basis of the analyses results of the effectiveness evaluation models in the context of the overall assessment of quality or level of provided services, which were carried out by other researchers [78,79,80]. Furthermore, in this stage, assigning cost-income features to the criteria was related to the need for further analysis and evaluation of the information usefulness efficiency using the DEA method. In addition, it was assumed that the income criteria (outputs) were a kind of web article usefulness property which the recipient experienced after reading the content of the article on the website, thanks to which he was potentially satisfied with the article as an informative product and he was able to obtain additional values for himself, e.g., information, knowledge, wisdom, etc. In turn, the cost criteria (inputs) were a kind of web article usefulness property related to the article as an informative product and incorporating all costs of its production, storage on the website and its further distribution. The number of individual income criteria within the selected groups of criteria varied and ranged from a minimum of two to a maximum of five main criteria. The number of individual cost criteria, as in the case of the income criteria, was also varied and ranged from a minimum of three to a maximum of seven main criteria. The condition for selecting a certain number of income and cost criteria within one group of criteria was the fulfillment of the determining assumption that the product of the number of income and cost criteria must be smaller than the total number of respondents who took part in the survey [81,82,83].
As part of the second stage, the results of the data analysis carried out for a specific research problem were presented. Exceptionally in this stage and in order to clearly show the results obtained in the study, the data from individual respondents were averaged to one value and then normalized for comparison purposes. Symbols of the main criteria (MC-01-O, …, MC-16-O and MC-01-I, …, MC-15-I), a list of names of individual main criteria, a profitable (output) or costly (input) type of criterion feature and values obtained from the survey after preliminary data analysis in the context of five analyzed websites (Site-1, Site-2, Site-3, Site-4, Site-5) are presented in the following Table 1.

Table 1.
Structure of each group of criteria and assigned main criteria with obtained results from the survey (source: self-study).
3.3. The Main Data Analysis
In the third stage of the research procedure, and as a result of the conducted preliminary data analysis, the properly prepared results were obtained, which the authors of the article decided to interpret in two different ways. The first way of interpretation was the comparison of the results within individual websites, and to determine which of the five examined websites and, represented by them, which forms of content presentation and experiences from applied information usefulness were the most effective, using the input-oriented CCR-I model with assumption of constant returns to scale. The second way of interpretation was the comparison of the results within individual websites and to determine which of the five examined websites and, represented by them, which forms of content presentation and experiences from applied information usefulness were the most effective, using the input-oriented BCC-I model with assumption of variable returns to scale. In the CCR-I model, the lowest possible level of inputs is searched, at which it is possible to achieve effective results for the object under the assumption that output variables increase proportionally with the input variables. Meanwhile, in the BCC-I model, the lowest possible level of inputs is searched, at which it is possible to achieve effective results for the object under the assumption that proportional change of the inputs does not necessarily lead to a proportional change of the outputs [84,85]. Therefore, in the processes of main data analysis and interpretation for both objectives set in the study, the DEA method was used.
The main data analysis obtained in the study for individual main criteria consisted of selecting appropriate data sources from each respondent separately, and then calculating the total efficiency level of selected websites using the DEA method within two different models oriented at the inputs analysis; that is, the CCR-I constant returns to scale model and the BCC-I variable returns to scale model. In the context of the performed analyses using the DEA method, each of the respondents was treated as a separate decision-making unit (DMU). Calculations and results related to the application of the DEA method were performed with the use of the MaxDEA 8 computer program [86].
3.4. The First Method of Data Interpretation and Presentation of the Results
The first method of data interpretation was the analysis of selected websites for each group of criteria using the CCR-I model of the DEA method in terms of cumulative values for individual main criteria and within each respondent. The sum of the values obtained in this way was the value of information usefulness efficiency for one selected website and within one selected thematic group of criteria. This method of data analysis was supposed to show the impact of all main criteria values within one specified group of criteria on a group efficiency assessment of individual websites, and then the possibility of creating a group ranking of websites. Similar operations were performed for each of the eight thematic groups of criteria, and then the final efficiency assessment for individual websites was calculated and their final ranking was created. The final ranking of websites was to demonstrate their order from the highest- to the lowest-rated according to respondents, in terms of the efficiency level of eight different aspects of information usefulness and applied in selected information and shopping websites.
The results obtained from the main data analysis using the CCR-I model of the DEA method for the values of information usefulness efficiency are presented in the following Table 2 and in Figure 1.
Table 2.
The final ranking of websites divided into groups for the values of information usefulness efficiency after main data analysis using the CCR-I model of the DEA method (source: self-study).
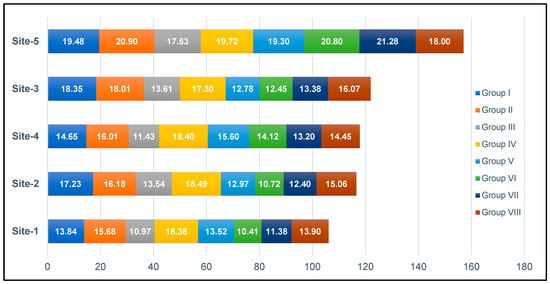
Figure 1.
The final ranking of websites from the highest- to the lowest-rated, divided into groups for the values of information usefulness efficiency after main data analysis using the CCR-I model of the DEA method (source: self-study).
As follows from the first data analysis using the CCR-I model of the DEA method and based on the results presented in Figure 1, all of the evaluated information and shopping websites were characterized by a relatively high level of information usefulness efficiency. The range of obtained values for individual services varied in the range from 68% to 100%, the ideal rating value, obtained by the best-rated website in the opinion of the respondents. The best website in the ranking in terms of the information usefulness efficiency level turned out to be website 5 (Site-5), which obtained the summary evaluation result of all groups of criteria at the level of 15,699 points (100%), and at the same time it was recognized as a pattern (the so-called benchmark) for other services. This website was characterized by a one-page style and textual content combined with attractive and large-size images, and a full product specification as well as spectacular interaction and user experience opportunities. The second place, with a score of 12,195 points (78%) was taken by website 3 (Site-3), which was characterized by a two-column style and textual content combined with images, movies and infographics. The third place in the ranking was taken by website 4 (Site-4), with a score of 11,786 points (75%), characterized by textual content combined with large-size images, a picture gallery, full product specification, online shopping options and the possibility of comparing similar products. Website 2 (Site-2) was in fourth position, with a slightly lower score at the level of 116.58 points (74%), which was characterized by a two-column style and very extensive textual content combined with images and the possibility of making online purchases for selected models of smartwatch devices in one of the popular online shops. Website 1 (Site-1) turned out to be the last in the ranking, with a score on the level of 10,607 points (68%), which obtained the lowest scores in almost all groups of criteria (except for group 5) and was characterized by a one-column style and advisory textual content combined with images and the possibility of making online purchases for selected models of smartwatch devices in one of the popular auction services.
As part of the obtained data and on the basis of the results presented in Table 2, the second area of analysis and interpretation within the CCR-I model was the summary evaluation of the efficiency level for the individual eight groups of criteria. As was the case with the ranking of individual websites, all of the evaluated groups of criteria were also characterized by a relatively high level of effectiveness. The range of obtained values for individual groups of criteria varied in the range from 74 to 100%, the ideal rating value, obtained by the best-rated group in the opinion of the respondents. The best thematic group in the ranking in terms of the efficiency level turned out to be group 4 (Group 4), which obtained the summary evaluation result within all analyzed websites at the level of 90.28 points (100%), and at the same time it was recognized as a pattern (the so-called benchmark) for other groups of criteria. This group concerned a total of eight criteria (four inputs and four outputs) related to “Cognitive aspects of the article’s content message”, and its result means that, in this group, the most effective results were achieved with proportionally the lowest level of costs. Of the groups, those that obtained slightly worse efficiency results, with 83–87 points (92–97%), were group 1 (Group 1—Informational aspects in the content of the article) and group 2 (Group 2—Information presentation aspects in the content of the article). The efficiency level of 71–78 points (about 80–86%) was obtained by the following three groups: group 7 (Group 7—UX aspects of the article in terms of emotions on the website), group 5 (Group 5—UX aspects of the article in terms of textual content on the website) and group 8 (Group 8—Economic effectiveness aspects of the article). The lowest efficiency level, with 67–69 points (74–76%), was obtained by the following two groups: group 3 (Group 3—Knowledge increase aspects in the content of the article) and group 6 (Group 6—UX aspects of the article in terms of graphic content on the website).
3.5. The Second Method of Data Interpretation and Presentation of the Results
The second method of data interpretation was also an analysis of selected websites for each group of criteria, but using the BCC-I model of the DEA method in terms of cumulative values for individual main criteria and within each respondent. The sum of the values obtained in this way was also the value of information usefulness efficiency for one selected website and within one selected thematic group of criteria. Analogously to the first case, this method of data analysis was supposed to show the impact of all main criteria values within one specified group of criteria on a group efficiency assessment of individual websites, and then the possibility of creating a group ranking of websites. Similar operations were performed for each of the eight thematic groups of criteria, and then the final efficiency assessment for individual websites was calculated and their final ranking was created. The final ranking of websites was to demonstrate their order from the highest- to the lowest-rated according to respondents, in terms of the efficiency level of eight different aspects of information usefulness and applied in selected information and shopping websites.
The results obtained from the main data analysis using the BCC-I model of the DEA method for the values of information usefulness efficiency are presented in the following Table 3 and in Figure 2.
Table 3.
The final ranking of websites divided into groups for the values of information usefulness efficiency after main data analysis using the BCC-I model of the DEA method (source: self-study).
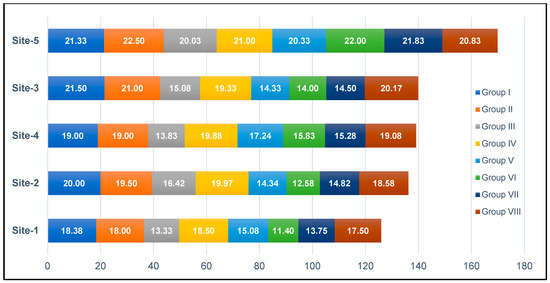
Figure 2.
The final ranking of websites from the highest- to the lowest-rated, divided into groups for the values of information usefulness efficiency after main data analysis using the BCC-I model of the DEA method (source: self-study).
As follows from the second data analysis using the BCC-I model of the DEA method and based on the results presented in Figure 2, all of the evaluated information and shopping websites were characterized by a relatively higher level of information usefulness efficiency than in the case of the CCR-I model. The range of obtained values for individual services varied in the range from 74 to 100%, the ideal rating value, obtained by the best-rated website in the opinion of the respondents. The best website in the ranking in terms of the information usefulness efficiency level turned out to be, again, website 5 (Site-5), which obtained the summary evaluation result of all groups of criteria at the level of 16,987 points (100%), and at the same time it was recognized as a pattern (the so-called benchmark) for other services. The second place, with a score of 13,992 points (82%), was taken again by website 3 (Site-3), which was only slightly ahead of the third site in the ranking, website 4 (Site-4), which obtained the score of 139,15 points (82%). Website 2 (Site-2) was in fourth position once again with a slightly lower score of 136,21 points (80%). The last in the ranking turned out to be, again, website 1 (Site-1), with a score at of 12,594 points (74%), which obtained the lowest scores in almost all groups of criteria once more (except for group number 5).
As part of the obtained data and on the basis of the results presented in Table 3, the second area of analysis and interpretation within the BCC-I model was the summary evaluation of the efficiency level for the individual eight groups of criteria. As was the case with the ranking of individual websites, also all of the evaluated groups of criteria were characterized by a relatively high level of effectiveness. The range of obtained values for individual groups of criteria varied in the range from 75 to 100%, the ideal rating value, obtained by the best-rated group in the opinion of the respondents. The best thematic group in the ranking in terms of the efficiency level was group 1 in this instance (Group 1), which obtained the summary evaluation result within all analyzed websites at the level of 100.20 points (100%), and at the same time it was recognized as a pattern (the so-called benchmark) for other groups of criteria. This group concerned a total of seven criteria (five inputs and two outputs) related to “Informational aspects in the content of the article”, and its result means that, in this group, the most effective results were achieved with not necessarily the lowest level of costs proportionally. Three groups obtained marginally worse efficiency results of 96–100 points (95–99%): group 8 (Group 8—Economic effectiveness aspects of the article), group 4 (Group 4—Cognitive aspects of the article’s content message) and group 2 (Group 2—Information presentation aspects in the content of the article). The efficiency level of 80–82 points (80–82%) was again obtained by the following two groups: group 7 (Group 7—UX aspects of the article in terms of emotions on the website) and group 5 (Group 5—UX aspects of the article in terms of textual content on the website). The lowest efficiency level of 75–78 points (75–78%) belonged to the following two groups: group 6 (Group 6—UX aspects of the article in terms of graphic content on the website) and group 3 (Group 3—Knowledge increase aspects in the content of the article).
4. Conclusions
The conducted research of analysis and evaluation of information usefulness efficiency, applied to selected information and shopping websites, showed significant differences in the respondents’ perception of the information usefulness efficiency level in terms of various analyzed aspects. One of the goals of the research was to show that the information usefulness efficiency and available content on websites is important for recipients and potential buyers, which has been positively proved. Various types of websites selected for the study in terms of methods of content communication and attractive subject matter of websites for the respondents resulted in the results of the research turned out to be current, interesting and practical. Moreover, the application of a combination of various types of quantitative and qualitative methods in research and analysis mean that the results obtained can be regarded as realistic and useful in different areas and applications.
Regarding the results from the first data analysis in terms of the ranking of websites selected for research, it can be concluded that, regardless of the two different models of scale effects for the DEA method used in the calculations, the overall ranking of websites from the most to the least effective is identical for both CCR-I and BCC-I models. This confirms the unequivocal perception and evaluation of the respondents regarding the level of quality and efficiency of individual websites. The result values of the efficiency levels between the weakest and the best service for both models fluctuated in very similar ranges from approx. 70 to 100%. The differences that existed were mainly due to the slightly higher values achieved in the case of the BCC-I model, which means that in this particular model the level of achieved efficiency was higher for all analyzed websites. Regardless of the analyzed models, the service with the highest level of efficiency (benchmark—100%) according to the respondents was the one-page style website 5 (Site-5), which represents content in the form of visualization intended for advertising websites, where the main emphasis is on the presentation of the product, description of its specifications, showing off its functionality in the best possible way and helpful information for making the purchase.
Regarding the results from the second data analysis in terms of the ranking of eight criteria groups and related main criteria selected for research, it can be concluded that there was a greater diversity in this area in the obtained results for the CCR-I and BCC-I models. For each of the models, the obtained results were completely different for the rankings of quality and efficiency level of various aspects of information usefulness perceived by the respondents within the surveyed websites. This is indirectly due to the different methods of calculating efficiency by each of the models, in one case assuming the proportionality of the increase in effects along with costs or, in the second case, in the absence of this dependency, which in turn may highlight the various causes of the dependencies between inputs and outputs. Regarding the received data, the highest values of the total efficiency obtained for each group of criteria are variable in most groups of criteria for both models. The effect of this is completely different rankings of individual groups of criteria within the CCR-I and BCC-I models, which in turn also influences a different significance assessment of criteria groups and related main criteria among the respondents. Depending on the analyzed models, the groups of criteria with the highest efficiency level (over 90%) according to the respondents were: cognitive aspects (benchmark for CCR-I model and BCC-I model), informational aspects (CCR-I model and benchmark for BCC-I model), information presentation aspects (CCR-I model and BCC-I model) and economic effectiveness aspects (BCC-I model).
In conclusion, it can be said that the DEA method used in the study has proven effective in practical data analysis, allowed for performing calculations and data analysis both in terms of creating the ranking of the analyzed websites and criteria groups, and thus also for the appropriate data interpretation in terms of information usefulness efficiency evaluation. Moreover, it must be admitted that the DEA method has proven successful in efficiency evaluation, even in a situation where the role of decision-making units (DMUs) was given to people (respondents), and not machines, devices or institutions, as is usually practiced. Therefore, further research of information usefulness efficiency on websites should be conducted towards more in-depth efficiency analysis, both using criteria for evaluating websites and individual respondents, as well as results analyzing using different variants of the DEA method and other data analysis methods, such as various types of multi-criteria methods, e.g., AHP/ANP, SAW, SMART or TOPSIS.
Author Contributions
Conceptualization, M.N.; Data curation, M.N.; Formal analysis, M.N. and D.P.; Funding acquisition, M.N. and D.P.; Investigation, M.N.; Methodology, M.N.; Project administration, M.N.; Resources, M.N.; Software, M.N. and D.P.; Validation, M.N. and D.P.; Visualization, M.N. and D.P.; Writing—original draft, M.N.; Writing—review & editing, M.N. and D.P. All authors have read and agreed to the published version of the manuscript.
Funding
The project was financed within the framework of the program of the Minister of Science and Higher Education under the name “Regional Excellence Initiative” in the years 2019–2022; project number 001/RID/2018/19; the amount of financing PLN 10,684,000.00. The project was financed by the Ministry of Education and Science in Poland under the programme “Regional Initiative of Excellence” 2019–2023 project number 015/RID/2018/19, total funding amount PLN 10 721 040,00.
Institutional Review Board Statement
Ethical review and approval were waived for this study, due to verbal informed consent was obtained from all subjects before the study.
Informed Consent Statement
Informed consent was obtained from all subjects involved in the study.
Data Availability Statement
Data used in the study are available in the article.
Acknowledgments
We are very grateful to the Minister of Science and Higher Education.
Conflicts of Interest
The authors declare no conflict of interest.
References
- The Sustainability Yearbook 2020. S&P Global and RobecoSAM AG. Available online: https://www.robeco.com/docm/docu-robecosam-sustainability-yearbook-2020.pdf (accessed on 10 August 2022).
- Elkington, J. Cannibals with Forks: The Triple Bottom Line of 21st Century Business; Capstone: Oxford, UK, 1999. [Google Scholar]
- Dubey, R.K.; Dubey, P.K.; Chaurasia, R.; Singh, H.B.; Abhilash, P.C. Sustainable agronomic practices for enhancing the soil quality and yield of Cicer arietinum L. under diverse agroecosystems. J. Environ. Manag. 2020, 262, 110284. [Google Scholar] [CrossRef] [PubMed]
- George, G.; Merrill, R.K.; Schillebeeckx, S.J.D. Digital Sustainability and Entrepreneurship: How Digital Innovations Are Helping Tackle Climate Change and Sustainable Development. Entrep. Theory Pract. 2020, 45, 999–1027. [Google Scholar] [CrossRef]
- Hilty, L.M.; Aebischer, B. ICT for sustainability: An emerging research field. In ICT Innovations for Sustainability; Springer: Cham, Switzerland, 2015; pp. 3–36. [Google Scholar] [CrossRef]
- Armstrong, M.; Taylor, S. Zarządzanie Zasobami Ludzkimi, wydanie VI; Wydawnictwo Wolters Kluwer Polska: Warszawa, Poland, 2011. [Google Scholar]
- Furnham, A. The Psychology of Behaviour at Work: The Individual in the Organization, 2nd ed.; Psychology Press: New York, NY, USA, 2012. [Google Scholar]
- Potocki, A. Komunikacja Wewnętrzna w Przedsiębiorstwie; Wydawnictwo Akademii Ekonomicznej w Krakowie: Kraków, Poland, 2001. [Google Scholar]
- O’Sullivan, T.; Hartley, J.; Saunders, D.; Montgomery, M.; Fiske, J. Kluczowe Pojęcia w Komunikowaniu i Badaniach Kulturowych; tłum. A. Gierczak-Bujak; Wydawnictwo Astrum: Wrocław, Poland, 2005. [Google Scholar]
- Morreale, S.P.; Spitzberg, B.H.; Barge, J.K. Komunikacja Między Ludźmi. Motywacja, Wiedza i Umiejętności; Wydawnictwo Naukowe PWN SA: Warszawa, Poland, 2007. [Google Scholar]
- Giblin, L. Umiejętność Postępowania z Innymi; Wydawnictwo OLIMEX: Kraków, Poland, 1993. [Google Scholar]
- Griffin, R.W. Podstawy Zarządzania Organizacjami, 3rd.; Wydawnictwo Naukowe PWN: Warszawa, Poland, 2017. [Google Scholar]
- Verčič, A.T.; Verčič, D.; Krishnamurthy, S. Internal Communication: Definition, Parameters, and the Future. Public Relat. Rev. 2012, 38, 223–230. [Google Scholar] [CrossRef]
- Stankiewicz, J. Komunikowanie Się w Organizacji; Wydawnictwo Astrum: Wrocław, Poland, 2006. [Google Scholar]
- Domachowski, W. Interakcyjny Model Funkcjonowania Społecznego, Społeczna Psychologia Kliniczna; Wydawnictwo Naukowe PWN: Warszawa, Poland, 1991. [Google Scholar]
- Sievert, H.; Scholz, C. Engaging Employees in (at Least Partly) Disengaged Companies. Results of an Interview Survey within about 500 German Corporations on the Growing Importance of Digital Engagement via Internal Social Media. Public Relat. Rev. 2017, 43, 894–903. [Google Scholar] [CrossRef]
- Pilarczyk, B. Komunikacja marketingowa jako sposób osiągania przewagi konkurencyjnej na rynku. In Komunikacja Rynkowa—Skuteczne Narzędzia i Obszary Zastosowania; Zeszyty Naukowe Uniwersytetu Ekonomicznego w Poznaniu, nr 153; Pilarczyk, B., Waśkowski, Z., Eds.; Wydawnictwo Uniwersytetu Ekonomicznego w Poznaniu: Poznań, Poland, 2010; p. 120. [Google Scholar]
- Mattelart, A. Teorie Komunikacji: Krótkie Wprowadzenie; Wydawnictwo Naukowe PWN: Warszawa, Poland, 2001. [Google Scholar]
- Hoffman, D.; Novak, T. Marketing in Hypermedia Computer—Mediated Environments: Conceptual Fundations. J. Mark. 1996, 60, 50–53. [Google Scholar] [CrossRef]
- Kramer, J. System informacji i komunikacji marketingowej wobec wyzwań gospodarki opartej na wiedzy i mądrości. Stud. Ekon. Zesz. Nauk. Wydz. Uniw. Ekon. Katow. 2013, 140, 9–21. [Google Scholar]
- Kowal, W. Kontrola Skuteczności Marketingowej—Problem Zmienności Interpretacji i Pomiaru; Wyd. Uniwersytetu Ekonomicznego we Wrocławiu: Wrocław, Poland, 2010. [Google Scholar]
- Szpaderski, A. Postulat prakseologii jako teorii podstawowej dla nauk organizacji i zarządzania. Przykład zastosowań. Organ. I Kier. 2006, 2, 3–32. [Google Scholar]
- Penc, J. Leksykon Biznesu; Agencja Wydawnicza Placet: Warszawa, Poland, 1997. [Google Scholar]
- Mazurkiewicz, A. Sprawność działania—Interpretacja teoretyczna pojęcia. In Nierówności Społeczne a Wzrost Gospodarczy. Uwarunkowania Sprawnego Działania w Przedsiębiorstwie i Regionie; Zeszyt Naukowy Uniwersytetu Rzeszowskiego nr 20; Woźniak, M.G., Ed.; Wydawnictwo Uniwersytetu Rzeszowskiego: Rzeszów, Poland, 2011; pp. 47–57. [Google Scholar]
- Zieleniewski, J. Organizacja i Zarządzanie; Wydawnictwo Naukowe PWN: Warszawa, Poland, 1981. [Google Scholar]
- Brzezińska, E.; Paszkowska-Rogacz, A. Kształtowanie Relacji Pracowniczych; Polsko-Amerykańskie Centrum Zarządzania: Łódź, Poland, 2001. [Google Scholar]
- Sikorski, C. Zachowania Ludzi w Organizacji; Wydawnictwo Naukowe PWN: Warszawa, Poland, 2001. [Google Scholar]
- Golka, M. Bariery w Komunikowaniu i Społeczeństwo (dez)Informacyjne; Wydawnictwo Naukowe PWN: Warszawa, Poland, 2008. [Google Scholar]
- Quirke, B. Komunikacja Wewnętrzna Krok po Kroku; Wyd. Wolters Kluwer Polska sp. z o.o.: Warszawa, Poland, 2011. [Google Scholar]
- Głodowski, W. Komunikowanie Interpersonalne; Wydawnictwo Hansa Communication: Warszawa, Poland, 2006. [Google Scholar]
- Gros, U. Zachowania Organizacyjne w Teorii i Praktyce Zarządzania; Wydawnictwo Naukowe PWN: Warszawa, Poland, 2003. [Google Scholar]
- Piecuch, T. Informacja w funkcjonowaniu współczesnych przedsiębiorstw. Mod. Manag. Rev. 2013, 18, 161–170. [Google Scholar] [CrossRef]
- Sienkiewicz, P. Ewaluacja Informacji w Społeczeństwie Informacyjnym. Zesz. Nauk. Uniw. Szczecińskiego 2011, 650, 126–132. [Google Scholar]
- Wiener, N. Cybernetyka i Społeczeństwo; Wydawnictwo Książka i Wiedza: Warszawa, Poland, 1961. [Google Scholar]
- Weiss, D. Ressources Humaines; Editions d’Organisation: Paris, France, 2005. [Google Scholar]
- Shannon, C.; Weaver, W. Mathematical Theory of Communication; University of Illinois Press: Urbana, IL, USA, 1949. [Google Scholar]
- Bartoli, A. Communication et Organisation. Pour une Politique Générale Cohérente; Les Éditions d’Organisation: Paryż, France, 1994. [Google Scholar]
- Nowakowski, M. Comparative Analysis of Information Usefulness Evaluation Methods on Business Internet Services. Eur. Res. Stud. J. 2020, 23, 292–306. [Google Scholar] [CrossRef]
- Nowakowski, M. Analysis and evaluation of information usefulness and user experience for content presentation in electronic media. Procedia Comput. Sci. 2020, 176, 3654–3664. [Google Scholar] [CrossRef]
- Stefanowicz, B. O Wartości Informacji. Kwartalnik Nauk o Przedsiębiorstwie 2008, 1, 64–69. [Google Scholar]
- Charkiewicz, A. O Ciennosti Informacji; Nauka: Moskwa, Russia, 1973. [Google Scholar]
- Mazur, M. Jakościowa Teoria Informacji; WNT: Warszawa, Poland, 1970. [Google Scholar]
- Stefanowicz, B. Informacja; SGH—Oficyna Wydawnicza: Warszawa, Poland, 2007. [Google Scholar]
- Nowakowski, M. Information assimilation as a decisive factor about website user’s behaviors. In Problems, Methods and Tools in Experimental and Behavioral Economics; Kesra, N., Małgorzata, Ł., Eds.; Springer: Cham, Switzerland, 2018; pp. 211–229. [Google Scholar]
- Nowakowski, M. The Impact Of Users’ Highly Sensory Processing Sensitivity on Websites’ Information Usefulness Perception. Procedia Comput. Sci. 2021, 192, 4980–4990. [Google Scholar] [CrossRef]
- ISO 9241-11 Standard. Available online: https://www.iso.org/obp/ui/#iso:std:iso:9241:-11:ed-2:v1:en (accessed on 18 May 2022).
- Nielsen, J. Usability 101: Introduction to Usability. 2012. Available online: https://www.nngroup.com/articles/usability-101-introduction-to-usability (accessed on 3 May 2022).
- Nielsen, J. Usability Engineering; Morgan Kaufmann: San Francisco, CA, USA, 1993. [Google Scholar]
- Krug, S. Don’t Make Me Think: A Common Sense Approach to Web Usability, 3rd ed.; revised edition; New Riders: Indianapolis, IN, USA, 2013. [Google Scholar]
- Davis, F.D. Perceived usefulness, perceived ease of use, and user acceptance of information technology. MIS Q. 1989, 13, 319–340. [Google Scholar] [CrossRef]
- Gahtani, S.A. The applicability of TAM outside North America: An empirical test in the United Kingdom. Info. Resour. Manag. 2001, 14, 37–46. [Google Scholar] [CrossRef]
- Rogers, E.M. Diffusion of Innovations, 5th ed.; The Free Press: New York, NY, USA, 2003. [Google Scholar]
- Nielsen, J.; Tahir, M. Homepage Usability: 50 Websites Deconstructed; New Riders: Indianapolis, IN, USA, 2002. [Google Scholar]
- Kalbach, J. Designing Web Navigation: Optimizing the User Experience; O’Reilly Media: Sebastopol, CA, USA, 2007. [Google Scholar]
- Stefanowicz, B. Informacja. Wiedza. Mądrość; Biblioteka Wiadomości Statystycznych, tom 66; Główny Urząd Statystyczny: Warszawa, Poland, 2013. [Google Scholar]
- Oleński, J. Elementy Ekonomiki Informacji. Podstawy Ekonomiczne Informatyki Gospodarczej; Katedra Informatyki Gospodarczej i Analiz Ekonomicznych UW: Warszawa, Poland, 2000. [Google Scholar]
- Oleński, J. Ekonomika Informacji. Metody; PWE: Warszawa, Poland, 2003. [Google Scholar]
- Shapiro, C.; Hal, R.V. Information Rules: A Strategic Guide to the Network Economy; Harvard Business School Press: Boston, MA, USA, 1999. [Google Scholar]
- Dziuba, D.T. Gospodarki Nasycone Informacją i Wiedzą. Podstawy Ekonomiki Sektora Informacyjnego; Katedra Informatyki Gospodarczej i Analiz Ekonomicznych UW: Warszawa, Poland, 2000. [Google Scholar]
- Wikipedia—The Free Encyclopedia “Smartwatch”. Available online: https://en.wikipedia.org/wiki/Smartwatch (accessed on 10 May 2022).
- Rubin, J.; Chisnell, D. Handbook of Usability Testing. How to Plan, Design and Conduct Effective Tests, 2nd ed.; Wiley Publishing: Indianapolis, IN, USA, 2008. [Google Scholar]
- Tullis, T.; Albert, B. Measuring the User Experience: Collecting, Analyzing, and Presenting Usability Metrics (Interactive Technologies), 2nd ed.; Morgan Kaufmann: Waltham, MA, USA, 2013. [Google Scholar]
- Antoszkiewicz, J.D. Metody heurystyczne w procesach przedsiębiorczych. In Współczesne Dylematy Badań Nad Przedsiębiorczością; Kosała, M., Urbaniec, M., Żur, A., Eds.; Uniwersytet Ekonomiczny: Kraków, Poland, 2016. [Google Scholar]
- Fotova Čiković, K.; Martinčević, I.; Lozić, J. Application of Data Envelopment Analysis (DEA) in the Selection of Sustainable Suppliers: A Review and Bibliometric Analysis. Sustainability 2022, 14, 6672. [Google Scholar] [CrossRef]
- Ramanathan, R. An Introduction to Data Envelopment Analysis. A Tool for Performance Measurement; Sage Publications: New Delhi, India, 2003. [Google Scholar]
- Cooper, W.W.; Seiford, L.M.; Zhu, J. Chapter 1—Data envelopment analysis: History, Models and Interpretations. In Handbook on Data Envelopment Analysis; Cooper, W.W., Seiford, L.M., Zhu, J., Eds.; Kluwer Academic Publishers: Boston, MA, USA, 2004; pp. 3–4. [Google Scholar]
- Leu, J.-D.; Tsai, W.-H.; Fan, M.-N.; Chuang, S. Benchmarking Sustainable Manufacturing: A DEA-Based Method and Application. Energies 2020, 13, 5962. [Google Scholar] [CrossRef]
- Emrouznejad, A. An Extensive Bibliography of Data Envelopment Analysis (DEA); Supplement 2, Working Paper; University of Warwick: Coventry, UK, 2001; Volume IV, pp. 1–24. [Google Scholar]
- Seiford, L.M. A bibliography for Data Envelopment Analysis (1978–1996). Ann. Oper. Res. 1997, 73, 393–438. [Google Scholar] [CrossRef]
- Banker, R.D.; Charnes, A.; Cooper, W.W. Some Models for Estimating Technical and Scale Inefficiencies in Data Development Analysis. Manag. Sci. 1984, 30, 1078–1092. [Google Scholar] [CrossRef]
- Charnes, A.; Cooper, W.W.; Rhodes, E.L. Measuring the efficiency of decision making units. Eur. J. Oper. Res. 1978, 2, 429–444. [Google Scholar] [CrossRef]
- Coelli, T.; Rao, D.S.P.; Battese, G.E. An Introduction to Efficiency and Productivity Analysis; Kluwer Academic Publisher: Boston, MA, USA, 1998. [Google Scholar]
- Domagała, A. Inwariantność podstawowych modeli DEA ze względu na przesunięcie i zmianę jednostki pomiaru. Uniw. Ekon. W Pozn. Zesz. Nauk. 2009, 124, 35–56. [Google Scholar]
- Seol, H.; Lee, H.; Kim, S.; Park, Y. The impact of information technology on organizational efficiency in public services: A DEA-based DT approach. J. Oper. Res. Soc. 2017, 59, 231–238. [Google Scholar] [CrossRef]
- Pawłowska, M. Wpływ Zmian w Strukturze Polskiego Sektora Bankowego na Jego Efektywność w Latach 1997–2002 (Podejście Nieparametryczne); Bank i Kredyt nr 11–12, Narodowy Bank Polski Instytut Ekonomiczny: Warszawa, Poland, 2003; pp. 51–65. [Google Scholar]
- Google Forms Website. Available online: https://www.google.pl/intl/pl/forms/about (accessed on 28 April 2021).
- Likert, R. A Technique for the Measurement of Attitudes. Arch. Psychol. 1932, 22, 1–55. [Google Scholar]
- Ziębicki, B. Uwarunkowania Oceny Efektywności Świadczenia Usług Użyteczności Publicznej. Zeszyty Naukowe Wyższej Szkoły Ekonomicznej w Bochni 2007, 6, 149–166. [Google Scholar]
- Bielski, M. Podstawy Teorii Organizacji I Zarządzania; Wydawnictwo C.H. Beck: Warszawa, Poland, 2005. [Google Scholar]
- Kafel, T.; Ziębicki, B. Wymiary i kryteria oceny efektywności organizacji pozarządowych. In Organizacje Komercyjne I Niekomercyjne Wobec Wzmożonej Konkurencji Oraz Wzrastających Wymagań Konsumentów; Nalepka, A., Ed.; WSB-NLU: Nowy Sącz, Poland, 2009. [Google Scholar]
- Boussofiane, A.; Dyson, R.G.; Thanassoulis, E. Applied Data Envelopment Analysis. Eur. J. Oper. Res. 1991, 52, 1–15. [Google Scholar] [CrossRef]
- Golany, B.; Roll, Y. An Application Procedure for DEA. Omega 1989, 17, 237–250. [Google Scholar] [CrossRef]
- Sarkis, J. Preparing your data for DEA—Information technology. In Productivity Analysis in the Service Sector with Data Envelopment Analysis, 3rd ed.; Avkiran, N.K., Ed.; The University of Queensland: Brisbane, Australia, 2006; pp. 115–123. [Google Scholar]
- Hodžić, S.; Alibegović, J.D. The efficiency of regional government expenditure in smart tourist destination: The case of Croatia. Tour. South East Eur. 2019, 5, 307–318. [Google Scholar]
- Fotova Čiković, K.; Joško Lozić, J. Application of Data Envelopment Analysis (DEA) in Information and Communication Technologies. Teh. Glas. 2022, 16, 129–134. [Google Scholar] [CrossRef]
- MaxDEA Website. Available online: http://maxdea.com (accessed on 10 April 2022).


Publisher’s Note: MDPI stays neutral with regard to jurisdictional claims in published maps and institutional affiliations. |
© 2022 by the authors. Licensee MDPI, Basel, Switzerland. This article is an open access article distributed under the terms and conditions of the Creative Commons Attribution (CC BY) license (https://creativecommons.org/licenses/by/4.0/).