Abstract
With the changing trends in global climate and increasing awareness of the environmental impact of the built environment, private and public sector building stakeholders are under constant and mounting pressure to reduce carbon emissions, energy consumption and waste generation. Conceptually, green building regulations are claimed to be the most effective tool toward promoting better environmental outcomes. Nonetheless, there is limited empirical evidence to justify claims for their effectiveness, especially in the Australian context, despite the introduction of various green building standards and regulations over the past two decades. In addressing this gap, this research aims to map the energy consumption and carbon emissions of certified offices under the mandatory Commercial Building Disclosure program. For this, the energy and carbon efficiencies of green certified commercial offices within the eight Australian central business districts (CBD) for 2011–2020 were assessed, and the offices were classified as green and non-green offices, based on their National Australian Built Environment Rating System (NABERS) of fewer than 4, and 4 and above stars, respectively. Data were extracted from the Commercial Building Disclosure program datasheet and thereafter analysed using various descriptive and inferential statistical techniques. Furthermore, the normalisation process was undertaken to capture the relative changes in energy and environmental performance between green and non-green offices. The results show an encouraging trend of a possible significant improvement in energy savings, and a reduction in carbon emissions for offices that have undergone retrofit and obtained an increase in their NABERS ratings. However, it is notable that 6-star NABERS-certified offices sometimes tend to save less energy than their 4- and 5-star rated counterparts, despite their high initial investment costs. Thus, this informs policymakers, authorities and practitioners that the highest NABERS rating does not necessarily help reduce energy consumption in buildings, and that greater emphasis should be placed on promoting the use of a whole building design approach, by exploring a more effective and appropriate combination of features, systems and materials based on stakeholders’ needs and behaviours.
1. Introduction
Over the last few decades, the discourse of real estate development, construction and facilities management has been replete with recommendations for the building industry to move towards being more sustainable, reducing carbon emissions, energy consumption and waste generation [1]. Encouragingly, evidence has shown that there has been a constant growth in the number of buildings being certified by different “green building” certifications to determine the greenness level of various types of buildings [2,3,4]. Hitherto, most of the green building certifications are voluntarily driven, whilst greater efforts have been placed by governments to make certifications mandatory in some relevant sustainable initiatives across various countries. Some of the commonly discussed certifications include LEED and ENERGY STAR (USA), BREEAM (UK), Green Mark (Singapore), CASBEE (Japan), G-SEED (South Korea), BASIX, NatHERS, Green Star and NABERS (Australia).
In Australia, under the Building Energy Efficiency Disclosure Act 2010, any commercial offices with spaces of more than 1000 square meters are required to go through the annual NABERS energy rating and tenancy lighting assessments (i.e., LTA), and disclose their energy efficiency through the Commercial Building Disclosure (CBD) program. This mandatory program aims to improve the energy and environmental performance of large office buildings and create transparency among buyers, tenants and vendors [5]. In terms of residential houses and buildings, all new development projects are required to comply with the BASIX requirements in New South Wales, and real estate agents and sellers are mandated to make a sustainability declaration for any property sales in Queensland. Turning to the UK and the US, BREEAM and LEED certifications are mandatory for all governmental projects, respectively. Furthermore, all new homes in the UK and building owners in the US are required to comply with their national Code for Sustainable Houses (CSH) and the relevant energy performance disclosures across different states, respectively (see Hsu [6], for more details). ENERGY STAR has increasingly become a part of the policy instrument across respective states of the US; similar to NABERS Energy, ENERGY STAR provides details of energy use and carbon emission intensity per area for more than a one-year period for the evaluation and comparison [7].
In line with the above transition, a considerable amount of literature has documented the environmental performance of green buildings. For example, Kats [8] suggested that LEED-certified office buildings in the US can save up to 30% more energy than their non-green building counterparts. This is supported by a number of later studies (e.g., [9,10]), which consistently reported the superior energy efficiency of LEED-certified office buildings. More recently, Asensio and Delmas’s [11] analysis of 178,777 commercial buildings in the US has encouragingly shown that 210 million kilowatt-hours (kWh) of energy use or 145 kilotons of annual CO2 equivalent emissions (kgCO2-e) could be reduced through the implementation of green building certifications and initiatives. Most recently, Hamoda’s [12] energy analysis of 11 case properties in Kuwait revealed that, with the incorporation of green building technologies (e.g., PV solar systems, greywater and material recycling systems), a total of up to 40% and 25% of direct and indirect energy savings could be achieved in residential development projects, respectively.
On the other end, the value of green buildings has also received criticism. For example, Menassa et al. [13] found that many LEED-certified public buildings occupied by the US defence sector had failed to achieve the expected level of energy savings and carbon reduction, and that those LEED-certified buildings consumed a higher amount of energy than the national averages reported. Scofield [14,15] and Amiri et al. [16] added that there is little or no evidence to support the superiority of LEED in energy and carbon reductions—particularly when buildings are barely LEED-certified, but not LEED Gold-certified. Asensio and Delmas’s [11] study also noted that green building certifications in the US were fairly effective specifically for large-sized buildings, but not for the small- and medium-sized buildings that represented about two-thirds of the overall emissions within the country’s commercial building sector. Most recently, Scofield et al.’s [17] comparative analysis of annual energy use and carbon emissions between LEED and non-LEED office buildings showed that the average LEED buildings with lower ratings (e.g., LEED-certified or Silver) are not always more energy- and carbon-efficient than their non-LEED counterparts. This phenomenon could be partially attributed to the current requirements for LEED certification, whereby one third of the required points are allocated to the energy category while the rest are allocated to other criteria such as location and transportation (17%) and indoor environmental quality (16%) [18]. The overall picture that emerges from here is that there is room for improvement for green buildings designed to be more energy-efficient and environmentally sustainable than conventional non-green buildings.
Despite all previous work done, the approaches in quantifying building performance seem to be fragmented, and there is a very limited relevant and longitudinal database to help chart the effectiveness of green building certifications adopted in compliance with relevant regulations (c.f. [19,20,21]). Gabe’s [22] analysis of the Australian mandatory building energy disclosure program and those affected office stocks showed that there are minimal energy savings in those buildings with a rating of barely 4 stars and above. This tends to add weight to Kim and Lim’s [23] conclusion that further reductions in energy usage and carbon emissions could be achieved by making green buildings above the average standard (e.g., NABERS or Green Star 4.5 to 5.5 stars). The study also acknowledged the unique characteristics of each Australian green building certification, while other factors such as the timing of their study could also affect the results of their analysis. Collectively, the review of literature shed light on the needs for a longitudinal empirical assessment of the energy consumption and carbon emissions of green buildings towards providing a better picture on the effectiveness of adopted sustainability-driven regulations and certifications.
To the best of our knowledge, no or little work has been conducted to analyse how much energy usage and carbon emissions could be reduced by regulation-driven green buildings, when compared to their non-green building counterparts. As such, this research aims to investigate the effectiveness of mandatory green building regulations by (i) determining the regulatory impacts by analysing the energy consumption and carbon emissions trend of NABERS certified office buildings and spaces; and (ii) evaluating possible improvements in energy savings and carbon reductions across different levels of a green building certification tool. In fulfilling these, this research analysed the 10-year longitudinal data of NABERS-certified offices, mandated by the Commercial Building Disclosure program across the CBD of eight Australian capital cities. Furthermore, as Kim and Lim [23] suggested, any offices certified with a NABERS rating of 4-stars and above are considered as “green”, while any ratings below are considered as “non-green”. The “green status” here represents higher energy and a greater carbon efficiency. However, the degree of efficiency may differ by specific ratings (e.g., “market leading”, “excellent”, and “good” performance for NABERS 6, 5, and 4-stars, respectively).
2. Literature Review
2.1. National Australian Built Environment Rating System (NABERS) and Green Building Regulations in Australia
In Australia, there are mainly two major green building certifications for non-residential buildings, namely NABERS and Green Star. Of these, NABERS was initiated by the Australian government in 1998 to measure the on-going building operational efficiency such as energy usage [24]. It consists of NABERS Energy, Water, Indoor Environment and Waste, while NABERS Energy can be also used as a pathway to obtain the government-supported Climate Active Carbon Neutral certification for better carbon efficiencies [25]. Unlike the case of the US ENERY STAR, which measures the energy efficiency of a building as a whole, NABERS measures offices from three different scopes: (i) whole building, (ii) tenancies (for tenant-occupied spaces) and (iii) base building (for landlord-occupied spaces) [7]. For certification, GreenPower, which is the government-supported program for off-site renewable energy generation and purchase, could be also used, although it is not mandatory [26].
Notwithstanding the fact that none of the above-mentioned certifications are completely mandatory, there is a consistent growth of green buildings in the Australian commercial office sector, with over 1000 NABERS-certified office buildings as of 2022 [27]. The rapid increase of NABERS- certified office buildings across Australia was at least partially attributed to regulatory pressures, while the low cost of compliance and the quasi-mandatory nature of NABERS also played a role [28]. In connection with this, Kim and Lim [23] reviewed several mandatory green building regulations, such as the Energy Efficiency in Government Operations (EEGO) policy and the National Green Leasing Policy (NGLP), and suggested that they reflect the government’s effort to showcase their leadership as a “green tenant”. This is because both government agencies and landlords are mandated to engage with the legally-binding Green Lease Schedule (GLS) as a part of their lease documentation, in order to achieve a minimum 4.5-stars in NABERS [29]. Furthermore, the National Construction Code (NCC) was developed based on the Building Code of Australia (BCA) to specify the minimum requirements for the safety, health, amenity, accessibility and sustainability aspects of new residential and non-residential buildings throughout Australia [30]. NCC includes the commitment agreement between the landlord and the NABERS national administrator to ensure the subject building achieves at least 5.5-stars in NABERS Energy [31]. As a result, it could be considered as the “performance-based” mandatory code for building sustainability [32], despite some shortcomings such as difficulties associated with the quantification of its performance requirements (e.g., energy efficiency) [19]. Lastly, the Commercial Building Disclosure program was introduced as a part of the Building Energy Efficiency Disclosure Act 2010. Under this program, most sellers, landlords, tenants or real estate agents of office spaces are required to obtain a Building Energy Efficiency Certificate (BEEC) and publicly disclose their building energy efficiency information, including their NABERS ratings [23]. This was previously applicable to office areas over 2000 sqm. However, the bar was raised to 1000 sqm from mid 2017 [33]. This regulation allows potential buyers and tenants to better understand the greenness level of the offices of their interests, and promotes transparency among building owners and landlords for the development and construction of more environmentally friendly, innovative, and energy-efficient green buildings. Currently, the program is one of the most widely used mandatory programs for the Australian office sector, mainly due to its “all-inclusive” nature and heavy financial penalties for non-compliance [34]. Furthermore, it is suggested as one of the three instruments driving the Australian office market toward being more environmentally sustainable, along with NABERS and Green Star certifications [35].
2.2. Effectiveness of Mandatory Green Building Regulations on Buildings’ Environmental Sustainability
Hitherto, a considerable amount of research has documented the trends, transition, characteristics and scope of green building regulations across various developed and developing countries. Bulkeley et al.’s [36] critical review of urban climate change policy and actions showed that at least 40 countries have made green building regulations mandatory for residential and/or non-residential buildings. For example, in China, Rizhao city has mandated a solar water heater system since the early 90s, and the city achieved the mature stage in its adoption after 15 years. Furthermore, the authors recommended that, for an effective urban climate change response, there should be stronger: (i) collaboration among local communities, relevant stakeholders and government agencies; (ii) financial incentives and political support; and (iii) emphasis placed on training for wider communities regarding the benefits of sustainability. Iwaro and Mwasha’s [37] survey of 97 building professionals and government officials across developing countries also revealed that the rate of compliance and effectiveness of regulatory activities in developing countries are far behind those of developed nations. This tends to support Gabe and Christensen’s [28] findings that voluntarily adopted green building certifications were ineffective in meeting environmental targets set by governments across many countries. Sentman et al.’s [38] study of green building regulations revealed that mandates and penalties are often used when existing incentives are found to be not as effective as originally intended. The overall picture that emerges from here and other studies (e.g., [37,39,40]) is that there is an increasing transition from voluntary to mandatory adoption of green building regulations across many countries, whereby more specific energy savings and environmental targets have been baselined. This, therefore, allows the continued growth of energy-efficient and environmentally-friendly green buildings, despite their higher price tag (c.f. [41,42,43,44]).
The energy and environmental performance of mandatorily adopted green buildings had also been discussed. For example, in Australia, Thomas [45] conducted the Post Occupancy Evaluation (POE) survey based on the refurbished Stockland head office in Sydney, and discussed its results along with energy and environmental data. The research found that the design and refurbishment of offices, in compliance with the requirements specified in NABERS and GreenPower, could lead to carbon reductions of up to 50%. Subsequently, Kim et al.’s [46] analysis of mandatorily adopted NABERS-certified office buildings in the CBDs of Sydney, Melbourne and Brisbane across the period of 2011–2015, showed that the green building market had reached its maturity. Around the same time, Gabe [47] assessed office buildings under the Australian mandatory building energy disclosure program, and found decreasing energy consumption levels over the first five certification periods, from an average of 161–174 kWh/m2/year to 120 kWh/m2/year. This reflected reductions in greenhouse gas emissions of up to 32%, although this trend stopped after the sixth certification. Additionally, locational attributes were found to be insignificant in influencing energy consumption and carbon emissions. This tends to support Fuerst et al.’s [48] findings of the relatively weak impact of climate zones in LEED adoptions across the US—despite the expectation that extreme climate conditions would lead to more energy-efficient green buildings, for better indoor environment quality (IEQ) controls. More recently, Gui and Gou’s [49] analysis of NABERS-certified office buildings across Australia’s six major cities showed that one rating increase leads to better energy and carbon efficiencies. For example, they found that a rise in the certification level could lead to reductions in energy use intensity (EUI) and emission intensity (EMI) by 184.45 MJ/m2/year (or approximately 51.2 kWh/m2/year) and 41.94 kgCO2-eq/m2/year, respectively. However, their findings revealed that the degree of efficiency tends to diminish as the rating increases, and that the actual energy savings and carbon reductions would depend on the climate and socioeconomics conditions of each city.
2.3. Theoretical Framework for Green Building Certification and Hypotheses
The institutional theory and law of diminishing marginal returns have been adopted here to help explain the behaviours of building owners and tenants towards green building certifications, and the varying level of energy savings and carbon emissions reduction across different NABERS star ratings. DiMaggio and Powell’s [50] institutional theory has often been used to underpin organisational adoption of certain policies, culture, standards and practices due to coercive, normative and mimetic isomorphic pressures [51,52]. Of these, coercive pressures refer to the regulatory or political pressures imposed on organisations or individuals to act in certain ways due to the fear of being banned, fined or punished [50,53]. This tends to support the authors’ conclusion on the importance of governmental regulations in driving the adoption rate of green building certification (e.g., [54,55,56,57]). Additionally, normative pressures refer to pressures induced by norms and behaviours widely accepted by professional and industry authorities [50]. As Kim et al. [54] suggested, office buildings located within the Australian CBDs were mainly occupied by professionals from the Fire, Insurance and Real Estate (FIRE) sectors, and these sectors are key stakeholders in the development and investment of green buildings. Lastly, mimetic pressures arise when organisations of a similar business focus or nature are located near to each other and are closely aware of each other’s practices, and tend to imitate their counterparts for improved competitiveness and performance. In this research, it is very likely that building owners and investors of those sampled office stocks across the eight CBDs, could be driven by the Commercial Building Disclosure program and the Building Energy Efficiency Disclosure Act 2010, and are in turn bound by the potential fines and penalties imposed for any non-compliance; hence the potential losses of income. Furthermore, most of the building owners and tenants were related to the FIRE sector, and were somehow subject to peer influence and competitive intensity for improved business turnover and social reputation. Collectively, this could lead to the development of the Hypothesis 1 (H1) below:
Hypothesis 1 (H1).
Building owners and tenants who occupy the office buildings within CBDs are more likely to purchase or lease green offices over non-green alternatives and go beyond the average green building certifications ratings of 4-stars.
In addition, under the premises of the law of diminishing marginal returns, it is suggested that the number of outputs will eventually decrease or diminish, even if the amount of input continuously increases while other factors remain constant [58]. This thus indicates that, allocating or investing extra resources would not always lead to continuous exponential growth in output once the saturation point is reached. In agreeing with this, Mahmoudi and Feylizadeh [59] emphasised the importance for stakeholders to determine the relationships and saturation point between the amount of investment and output for effective resource management. From a holistic perspective, in the context of green buildings, Jackson’s [60] examination of the risks involved in sustainable real estate projects showed that a constant increase in the number of green buildings of respective star ratings may lead to reductions in their returns on investment. This phenomenon could partially be explained in relation to the saturation point of those groups of certified buildings in which they become social norms and commonly available within the commercial office market. This tends to support Gabe’s [47] conclusions that the increasing number of NABERS re-certifications of office buildings at the same star rating could lead to diminishing energy savings and carbon reductions. However, it is beyond the scope of this research to specifically map the re-certification of office buildings and their star ratings, and in turn examine their subsequent reductions in energy consumption and carbon emissions. Future research should explore this further. Nevertheless, the law of diminishing marginal returns is helpful to underpin and formulate our Hypothesis 2 (H2):
Hypothesis 2 (H2).
The relative amount of energy savings and carbon reductions obtained from green offices could decrease after a certain star rating.
3. Methods
This research adopted an evaluation survey design, by analysing l0 years (i.e., 2011 to 2020) of longitudinal energy and carbon efficiencies of certified green and non-green offices (see Thomas [61] for more details about evaluation research design for policy research). In this research, the NABERS certification was used to define the mandatory green building regulation, as it covers most offices with 1000 sqm or above, subject to lease, sub-lease, and sales. With the assistance of MS Excel, the data was extracted from the Commercial Building Disclosure program registry (see https://www.cbd.gov.au/, accessed on 16 March 2021), which documented the location of certified space or buildings, their floor level, rated area, energy usage (MJ) and carbon emissions (kgCO2-e), carbon emission intensity (kgCO2-e/m2), NABERS ratings and certification date. The collated data was further screened according to the postcodes and certification date of respective offices.
In this research, the stratified sampling method was adopted, and offices located within the CBDs of the eight major Australian capital cities were targeted. Overall, 113,767 of NABERS-certified offices have been identified. Out of these, 73,276 offices are certified as 4-star or above, and thus, deemed as “green”. It should be noted that a single building may contain several NABERS-certified offices, and this research focused on the certified offices rather than the building itself.
Various descriptive and inferential analytical procedures were conducted in this study, to determine the energy consumptions and carbon emissions of green and non-green offices. Of these, multiple correspondence analysis (MCA) was conducted to identify the underlying relationship between locations, types, and green certification of offices. As Hoffman and Leeuw [62] and Loosemore et al. [63] suggested, the MCA allows the construction and visualisation of categorical data, while the proximity between each variable represents their correlations. In this research, a joint plot of category was presented to describe the relationships among the “green” status of certified offices, their geographical locations, and their position in the buildings. Following Craighead’s [64] techniques, any office located on the seventh story or higher would be considered as high-rise, while the rest were classified as low-rise. To complement this, a visual examination was conducted on the incremental trend of green and non-green offices, whereby the number of stars was used to determine the level of greenness of NABERS-certified offices. The results would help fulfil the first research objective.
In addition, the energy consumption and carbon emissions of the certified offices were computed by dividing the actual energy and carbon emissions over the assessed area of the certified offices, in terms of kWh/m2 and kgCO2-e/m2 for each year of the study period, respectively. For ease of reference and understanding, Figure 1 summarises the research processes, showing the steps adopted for data collection and analysis.
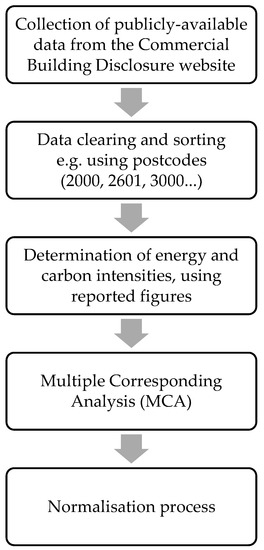
Figure 1.
An overview of the research process.
Lastly, as shown in Figure 1, the normalisation process was undertaken to meet the second research objective, i.e., to map the possible changes in energy consumption and carbon emissions of NABERS-certified offices, using Equations (1) and (2) below.
where
- El = Energy consumption of lower rating (e.g., 6-star (kWh/m2)
- Eh = Energy consumption of higher rating (e.g., 5-star) (kWh/m2)
- CO2l = CO2 emissions of lower rating (e.g., 6-star) (kgCO2-e/m2)
- CO2h = CO2 emissions of higher rating (e.g., 5-star) (kgCO2-e/m2)
Generally, all annual energy consumption and carbon emission intensity values were sorted according to the star ratings of the respective certified offices and years of certifications. This was followed by a comparison of the energy consumption and carbon emissions of a higher star NABERS-credited office (e.g., a 6-star rating), with a lower star NABERS-credited office (e.g., a 3-star rating), in order to determine the amount of energy saving and/or carbon reduction obtained between the star ratings. This method was widely adopted in previous studies (e.g., [23,65]) as it allowed the removal of systematic differences between variables with varying characteristics [66]. In this research, the adoption of the normalisation process could further help understand if and to what extent transforming existing non-green offices to green offices could help to obtain improved energy consumption and carbon reduction. The results could in turn explain the implications for the possible saturation point of green building certifications and investment. A total of 35 pairwise comparison analyses were conducted in this research.
4. Results
4.1. Trends of Green and Non-Green NABERS Certified Offices from 2011–2020
Table 1 presents the trend of NABERS-certified offices across the targeted eight CBDs. The results show that Sydney CBD has the largest number of NABERS-certified offices under the Commercial Building Disclosure program (n = 43,968), followed by Melbourne (n = 22,483) and Brisbane CBD (n = 20,792). Of these, it is notable that Sydney has the highest proportion of green offices within its CBD (77%), followed by Darwin CBD (75%). Interestingly, Melbourne lags behind Darwin, with only 53% of its CBD offices are NABERS 4-star-certified or above. It is not clear why there is such a big gap in the NABERS-certified offices in Sydney, Darwin and Melbourne, particularly because Melbourne is Australia’s second most populous city, where multiple corporate headquarters are located (e.g., ANZ, NAB, Telstra, BHP). One possible picture that emerges from this study is that climate zones and the socioeconomic status of respective capital cities could play an important role in driving the growth of green offices; Sydney, Melbourne and Darwin were classified under Climate Zone 5 (warm temperature), 6 (mild temperature) and 1 (high humidity summer, warm winter), respectively. This phenomenon is further evident in the percentage difference of green offices between Melbourne (Zone 6) and Brisbane (Zone 2), whereby the latter had a higher percentage of green offices than the former, despite having a similar number of NABERS-certified offices reported. Recent research by JLL [67] reported that Melbourne CBD had surpassed Sydney CBD as the largest CBD in Australia. Future research could thus be undertaken to explore this further.

Table 1.
Number of green and non-green offices across eight major Australian CBDs (2011–2020).
Figure 2 presents the overall trend of NABERS-certified offices throughout 2011–2020. It is encouraging to note that the number of green offices (denoted by the blue trend) has outperformed the non-green counterpart (denoted by the orange trend) since 2012. In 2011, only 40% of certified offices had achieved a NABERS 4-star rating or above, whereas there has been a substantial growth in the number of green offices since 2013. The results further revealed that almost 70% of the certified offices in 2017 were considered “green”, and this figure reached almost 80% in 2020. Overall, the accumulated number of green offices reported after mid 2016 was slightly higher (n = 39,859) than those reported in the early half of 2016 (n = 33,417), due to the changes in the space requirement from 2000 m2 to 1000 m2 in the Commercial Building Disclosure program. Consequently, this also led to a decrease in the number of non-green offices, from 23,705 to 16,780. Collectively, this points to the effectiveness of the Commercial Building Disclosure program towards encouraging or compelling organisations to move into or invest in, green offices.
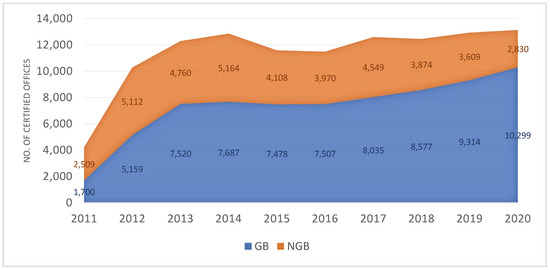
Figure 2.
An incremental trend of green and non-green offices (2011–2020).
Figure 3 shows the trend of green building certification of offices from 2011–2020. Notably, there is a considerable but positive change in the number of NABERS-rated offices; whereas in 2011 most of the offices were certified with either a 4-star or 4.5-star NABERS rating (n = 1,444), ten years later more than half of offices were certified with at least a 5-star NABERS rating (n = 5,744). Nonetheless, the findings suggests that 6-stars NABERS-rated green offices are still relatively rare in Australia, which contributes less than 1% of the total number of green offices. Interestingly, the results suggest that 5.5-star and 5-star NABERS-rated offices contributed about 15% and 40% of the overall green offices in 2020, respectively, which was a leap in improvement compared with an aggregate of 15% representation back in 2011. This provides further confidence in attesting the effectiveness of the Commercial Building Disclosure program in Australia. The overall picture that further emerges from here is that building stakeholders (e.g., landlords, tenants and investors) are increasingly becoming more environmentally conscious; most of them are no longer solely driven by regulatory compliance, and instead are going beyond the average rating of green building certification. This therefore tends to support H1.
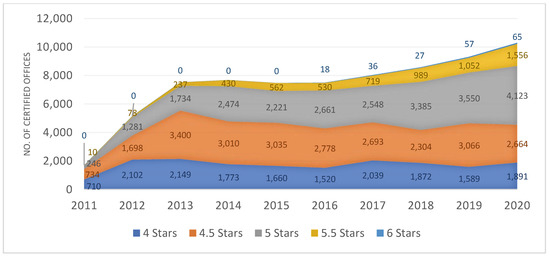
Figure 3.
Trend of green building NABERS-certified green offices, based on their star ratings (2011–2020).
4.2. Relationships between Location, Type and Green Certification of Offices
Figure 4 presents the MCA’s joint category plot. The test results of 1.449 and 1.285 (i.e., Eigenvalues) and 0.465 and 0.333 (i.e., Cronbach’s alpha) were obtained for Dimensions 1 and 2, respectively. Following Loosemore et al.’s [63] guideline, the results are deemed as acceptable for exploratory research, and could in turn provide a meaningful indication of trends. For ease of discussion and interpretation, three cloud combinations (CC) are formed to show the relationship between the location, type, and green certification of offices across the eight capital cities. As denoted by CC1, most of the green-certified offices located in Sydney CBD were found within high-rise buildings. This tends to support the research reported by Urban Taskforce Australia [69] that Sydney is the 37th tallest city in the world, based on the addition of all completed 150 million buildings, and that the current evolution of technologies and materials have made high-rise developments greener, and with the improved ability for building stakeholders to offset carbon emissions and implement more renewable energy generation. Additionally, the results denoted by CC2 show that Melbourne, Brisbane, and Perth tend to have more non-green offices (i.e., with a 3.5-star NABERS rating or below), compared to their counterparts. In particular, these three capital cities had the largest numbers of NABERS-certified green offices after Sydney, ranging from 7,309 to 12,800, and with the percentage of non-green offices ranging 38–47%, as summarised in Table 1. Interestingly this points to the urge for government and professional bodies to place more emphasis on these three capital cities, to make Australia a greener and more sustainable country and meet its sustainable development targets. Lastly, from CC3, it can be seen that most of the NABERS-certified offices located in Darwin and Canberra were found within low-rise buildings.
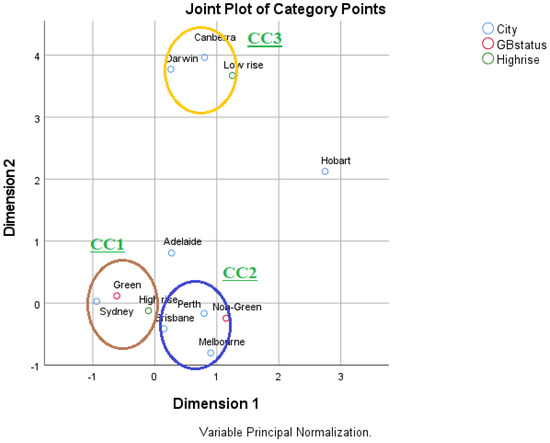
Figure 4.
Joint category plot for green building status, high−rise office building and their locations.
4.3. Energy Consumption and Carbon Emissions of NABERS Certified Offices
Figure 5 summarises the computed energy consumption and carbon emissions across different star ratings. The results thus help fulfil the second research objective, and partially support H2. In particular, our findings reveal that there is a decrease in the amount of energy saving obtained from green building certification after making the 3-star and the 5.5-star increment.
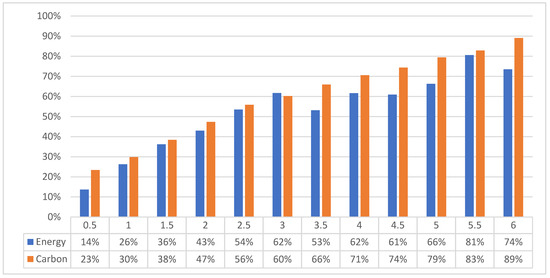
Figure 5.
An average increase in energy and carbon efficiency achieved from an increase in a star rating.
In terms of energy savings, the results in Figure 5 and Table 2 reveal that there are positive associations between the increase in star rating and the amount of energy saving, and that a varying level of star rating increment could bring about a different amount of energy saving. For example, as shown in Table 2, an average of an 81% energy saving could be obtained by achieving a 5.5-star rating increment from a 0-star rating, and a 6-star rating increment could lead up to an average of approximately 74% energy saving. Interestingly, this points to the question as to whether it is more feasible and energy-efficient to upgrade to a 6-star NABERS-certified office, considering that there is a slight decrease in energy savings. This also tends to suggest that the saturation point of energy saving could be at a 5.5-star rating increment for any upgrading work for non-green 0-Star NABERS-rated offices. Notably, this also applies to other current non-green (i.e., 1- 3.5-star-rated) NABERS-certified offices. Our findings further reveal that a 2.5-star rating upgrade to an office that is currently certified with either a 1.5-, 2-, 2.5- or 3-star rating could bring about potential energy savings of 44–106%, with an average of 54%. Of these, an attempt to upgrade a current office with a rating of either 1.5 or 2 stars to a 4.5-star rating, could bring about the highest average energy savings, of 106% and 117%, respectively. An overall picture that emerges from here is that obtaining a higher star rating or going for a higher rating increment does not always lead to additional energy savings, and may not be the most economically and environmentally viable strategy. Building stakeholders should consider their current office’s NABERS star rating, and understand their needs, budget, market standards and climate zone, and conduct a more detailed life cycle cost analysis before making an informed decision on their refurbishment work. This tends to agree with Gabe’s [47] conclusions that geographical location is one of the key considerations for building stakeholders, in pursuing operational energy efficiency.
Table 2.
Savings of energy consumption achievable from transforming non-green to green offices.
Regarding carbon emissions, the trend obtained is relatively similar to that of energy savings, whereby there is a positive association between NABERS star ratings and the amount of reduction in carbon emissions. For example, Figure 5 and Table 3 show that a 0.5 star increment from a 3.5-stars rating, could lead to only a 23% reduction in carbon emissions, and a 1-star increment from either an existing 3-star- or 3.5-star certified office, could bring about an average of a 30% reduction in carbon emissions. Moreover, upgrading to the highest rating of 6-star from an existing 0-star certification could lead to an 89% reduction in carbon emission, followed by a 5.5-star increment, with an average of 83% reduction in carbon emissions. This phenomenon is slightly different to the case of energy savings, whereby the 5.5-stars increment range offers the optimal savings. It is further revealed that the same attempt to upgrade a current office with a rating of either 2 or 1.5 stars to a 4.5-star rating could bring about only a relatively moderate carbon reduction, of 49% and 52%, respectively. Overall, the results confirm that upgrading existing non-green offices with at least a 4-star NABERS rating could contribute to considerable reduction in carbon emission.
Table 3.
Savings in carbon emissions achievable from transforming non-green to green offices.
5. Discussion
One of the most salient findings here is that each Australian green building market is unique, as evidenced by the MCA’s joint-category plot and its three cloud combinations. Specifically, it may not be only the regulation (i.e., coercive pressure), but also the pressures arising from competitors, clients’ expectations, neighbours, and professional bodies (i.e., the normative and mimetic isomorphic pressures), which could collectively impact building stakeholders’ decisions to buy, lease or sub-lease green offices. Our findings also tend to support Kim and Lim’s [70] earlier study, showing that green buildings in Sydney CBD are generally taller, larger and newer, compared with their comparable non-green building counterparts. These characteristics are typically seen in Premium or A-grade office buildings commanding higher sale and rental prices. This, therefore, further highlights possibly stronger mimetic or normative isomorphic pressures in the Sydney office market, compared with other office markets (e.g., Brisbane, Darwin or Canberra CBDs). This is further supported by Kim et al.’s [54] study showing why tenants of the Sydney CBD office market lease green offices; they prefer the green option over the non-green alternatives to better reflect their corporate identity, to keep up with the Joneses, to meet their organisation needs and to provide better IEQ for their employees. Our findings, therefore, first inform policymakers, authorities and practitioners that identifying the stakeholders’ unique demand for each Australian commercial office market is important, along with continuously implementing the mandatory Commercial Building Disclosure program for improved marketability and widespread green building practices.
The results of the normalisation procedures further show that transforming non-green offices into green offices would generally lead to additional energy savings. Specifically in Sydney CBD, it is known that tenants are required to pay energy bills, even if they have a gross lease [71]. This, therefore, implies that tenants paying expensive energy bills could benefit from putting in extra effort to achieve a “green status”. However, this research also finds reduced energy savings in certain circumstances. For example, the upgrade of an existing 3.5-star-rated office to achieve the highest 6 stars would be costly, while it can only save energy consumption by 17%. To compensate for this, building stakeholders would be required to adopt supplementary strategies (e.g., extra energy-saving features or design) to reduce their energy bills. The incremental trend of green offices in Australia also indicates that building owners may face a lower return on investment (ROI) from the NABERS-certified offices in the coming years. While green buildings used to be considered as something unique, this is no longer the case in the current Australian office market. From the building owner’s perspective, making further development—such as obtain dual certification from NABERS and WELL—would be required, in order to maintain a competitive advantage of their buildings over others. Collectively, these findings inform us that the use of a whole building design and the benefits would be necessary, rather than the known operational or economic benefits alone. By understanding various stakeholder needs and behaviours, strategies to encourage better use of green offices can be adopted by policymakers, authorities, and practitioners. This is supported by research showing that integrating end-user behaviours and technology through change management, education, and communication is required for further reductions on building energy consumption and other environmental outcomes [72]. Moreover, modification to the current rating requirements addressing sources of building energy usage could be considered, as it is partially reflected in the recent update to the NABERS certification [73]. Considering this change has been in effect since mid 2021, further research can be conducted to identify the most suitable modifications to the current rating requirements, once more longitudinal data becomes available.
Meanwhile, the promising findings related to savings in carbon emissions support the upgrading or retrofitting of existing non-green offices in order to become green offices with a NABERS 4-star rating or above. This tends to give weight to the earlier findings that NABERS has its advantages in reducing carbon emissions [23]. This is beneficial to building owners and tenants who may be required to pay carbon tax in the future, or who wish to showcase their commitment to environmental sustainability. At the same time, this research reveals that savings of energy consumption and carbon emissions do not always improve proportionally, despite the belief that these two should generally correlate with each other [49]. At present, it is believed that this could be attributed to several factors, such as the scope of the ratings (e.g., base building, whole building), types of energy used in the office buildings (e.g., electricity, gas, on-site photovoltaics), usage of GreenPower, building design and features, as well as the geographical variation of an individual office location. Therefore, future research could be conducted to make a complete assessment of these factors.
6. Conclusions
This research identified that there has been an increase of “above the average” green offices across the major Australian office markets since the first introduction of the Commercial Building Disclosure program. More importantly, the results of this research advise that an increase in NABERS ratings generally leads to further energy savings and carbon reductions in green offices with a NABERS 4-star rating or above. However, better energy efficiency alone may not fully justify making the extra investment to achieve the highest ratings from NABERS. Rather, the findings of this research highlight the importance of promoting the non-operational benefits of the certification. Despite the findings that investing in a NABERS, 6-star rating may not always the “best value for money” option, it can still be a strong business case for many building stakeholders. From the policy implementation perspective, therefore, emphasising the intangible benefits of NABERS certification would be necessary, especially to increase the number of 6-star-rated offices across the country.
Despite the above-discussed findings and implications, it should also be noted that the analysis of this research is restricted by data availability. Lack of data associated with other regulations, as well as voluntary adoptions (e.g., Green Star) did not allow us to fully explore and compare their effectiveness. As Thomas [61] and more recently, Denne and Wright [74] suggest, an evaluation of regulatory implementations requires considerations of the extent to which the desired results are achieved. Therefore, once relevant data becomes available, further research is suggested, in order to draw more firm conclusions on how various green building regulations in Australia can be further developed, to achieve their regulatory objectives. Another limitation is that this research did not consider or model the varying amount of energy savings and carbon emission reductions, and different NABERS star ratings of certified offices across the eight capital cities. Thus, future empirical studies could explore whether the climate zone of respective capital cities and the height or floor level of respective offices play a moderating role in shaping the energy savings and carbon emission reduction potentials.
Author Contributions
Research design, analysis and writing, S.K.; review and editing, B.T.H.L. and B.L.O. All authors have read and agreed to the published version of the manuscript.
Funding
This research is funded by the UNSW Built Environment.
Institutional Review Board Statement
Not applicable.
Informed Consent Statement
Not applicable.
Data Availability Statement
Data used for this research could be found from https://www.cbd.gov.au/, accessed on 16 March 2021.
Acknowledgments
This research is supported by the UNSW Built Environment as a form of Ph.D. publication award.
Conflicts of Interest
The authors declare no conflict of interest.
References
- Bolden, K. Four Pillars Impacting Sustainable Sustainability in Real Estate. EY [Online], 7 February 2020. Available online: https://www.ey.com/en_us/real-estate-hospitality-construction/four-pillars-impacting-sustainable-sustainability-in-real-estate (accessed on 16 December 2020).
- Kim, S.; Lim, B.T.H. Do office tenants really pay for the greenness? Findings from PLS-SEM. AIP Conf. Proc. 2019, 2114, 20052. [Google Scholar] [CrossRef]
- Chithra, K.; Anilkumar, P.P. An Assessment of Leed Based Green Building Certification System from the Energy Efficient Building Perspective. Int. J. Emerg. Technol. Adv. Eng. 2013, 3, 316–320. [Google Scholar]
- Yoshida, J.; Sugiura, A. Which “Greenness” Is Valued? Evidence from Green Condominiums in Tokyo. 2010. Available online: https://mpra.ub.uni-muenchen.de/23124/ (accessed on 16 December 2020).
- Australian Government. Overview. Available online: https://www.cbd.gov.au/program/overview/overview (accessed on 20 August 2022).
- Hsu, D. How much information disclosure of building energy performance is necessary? Energy Policy 2014, 64, 263–272. [Google Scholar] [CrossRef]
- Bannister, P.; Burt, L.; Hinge, A. Under the Hood of Energy Star and NABERS: Comparison of Commercial Buildings Benchmarking Programs and the Implications for Policy Makers. In 2016 ACEEE Summer Study on Energy Efficiency in Buildings; From Components to Systems, From Buildings to Communities; ACEEE: Pacific Grove, CA, USA, 2016; pp. 1–12. [Google Scholar]
- Kats, G.H. Green Building Costs and Financial Benefits, USA. 2003. Available online: http://www.greenspacebuildings.com/wp-content/uploads/2011/05/Kats-Green-Buildings-Cost.pdf (accessed on 15 August 2022).
- Newsham, G.R.; Mancini, S.; Birt, B.J. Do LEED-certified buildings save energy? Yes, but…. Energy Build. 2009, 41, 897–905. [Google Scholar] [CrossRef]
- Turner, C.; Frankel, M. Energy Performance of LEED for New Construction Buildings. Available online: https://www.solaripedia.com/files/658.pdf (accessed on 16 December 2020).
- Asensio, O.I.; Delmas, M.A. The effectiveness of US energy efficiency building labels. Nat. Energy 2017, 2, 17033. [Google Scholar] [CrossRef]
- Hamoda, M.F. Role of Green Buildings in Reduction of Energy Consumption. In Gulf Conference on Sustainable Built Environment; Bumajdad, A., Bouhamra, W., Alsayegh, O.A., Kamal, H.A., Alhajraf, S.F., Eds.; Springer: Cham, Switzerland, 2020; pp. 439–451. ISBN 978-3-030-39733-3. [Google Scholar]
- Menassa, C.; Mangasarian, S.; El Asmar, M.; Kirar, C. Energy Consumption Evaluation of U.S. Navy LEED-Certified Buildings. J. Perform. Constr. Facil. 2012, 26, 46–53. [Google Scholar] [CrossRef]
- Scofield, J.H. Do LEED-certified buildings save energy? Not really…. Energy Build. 2009, 41, 1386–1390. [Google Scholar] [CrossRef]
- Scofield, J.H. Efficacy of LEED-certification in reducing energy consumption and greenhouse gas emission for large New York City office buildings. Energy Build. 2013, 67, 517–524. [Google Scholar] [CrossRef]
- Amiri, A.; Ottelin, J.; Sorvari, J. Are LEED-Certified Buildings Energy-Efficient in Practice? Sustainability 2019, 11, 1672. [Google Scholar] [CrossRef]
- Scofield, J.H.; Brodnitz, S.; Cornell, J.; Liang, T.; Scofield, T. Energy and Greenhouse Gas Savings for LEED-Certified U.S. Office Buildings. Energies 2021, 14, 749. [Google Scholar] [CrossRef]
- He, Y.; Kvan, T.; Liu, M.; Li, B. How green building rating systems affect designing green. Build. Environ. 2018, 133, 19–31. [Google Scholar] [CrossRef]
- Armstrong, A.; Wright, C.; Ashe, B.; Nielsen, H. Enabling Innovation in Building Sustainability: Australia’s National Construction Code. Procedia Eng. 2017, 180, 320–330. [Google Scholar] [CrossRef]
- Wilkinson, S. Building approval data and the quantification of sustainability over time: A case study of Australia and England. Struct. Surv. 2015, 33, 92–108. [Google Scholar] [CrossRef]
- Iyer-Raniga, U.; Moore, T.; Wasiluk, K. Residential Building Sustainability Rating Tools in Australia. Environ. Des. Guide 2014, 1–14. Available online: https://www.jstor.org/stable/26152179#metadata_info_tab_contents (accessed on 15 August 2022).
- Gabe, J. An empirical comparison of voluntary and mandatory building energy performance disclosure outcomes. Energy Policy 2016, 96, 680–687. [Google Scholar] [CrossRef]
- Kim, S.; Lim, B.T.H. How effective is mandatory building energy disclosure program in Australia? IOP Conf. Ser. Earth Environ. Sci. 2018, 140, 12106. [Google Scholar] [CrossRef]
- NSW Office of Environment & Heritage. An Introduction to NABERS: What Are the NABERS Tools? Available online: https://nabers.gov.au/public/WebPages/ContentStandard.aspx?module=10&include=Intro.htm (accessed on 3 January 2018).
- NABERS. Climate Active Carbon Neutral Certification. Available online: https://www.nabers.gov.au/ratings/climate-active-certification (accessed on 2 September 2022).
- NABERS. NABERS Energy. Available online: https://www.nabers.gov.au/ratings/our-ratings/nabers-energy (accessed on 3 September 2022).
- NABERS. Find a Current Rating|NABERS. Available online: https://www.nabers.gov.au/ratings/find-a-current-rating?buildingtype=office&ratingtype=energy&starratings=4,4.5,5,5.5,6 (accessed on 11 October 2022).
- Gabe, J.; Christensen, P.H. Information or Marketing? Lessons from the History of Private-Sector Green Building Labelling. In Sustainable Real Estate: Multidisciplinary Approaches to an Evolving System; Walker, T., Krosinsky, C., Hasan, L.N., Kibsey, S.D., Eds.; Palgrave Macmillan: Cham, Switzerland, 2018; pp. 115–163. ISBN 978-3-319-94565-1. [Google Scholar]
- Burroughs, S. Green Leases in Australia: An Analysis of Current Trends and Issues. In Proceedings of the SB11 Helsinki World Sustainable Building Conference, Helsinki, Finland, 18–21 October 2011. [Google Scholar]
- ABCB. What Is the National Construction Code (NCC)? Available online: https://www.abcb.gov.au/Resources/Publications/Education-Training/What-is-the-NCC (accessed on 16 December 2020).
- ABCB. Energy Efficiency: NCC Volume One; Handbook. 2019. Available online: https://www.abcb.gov.au/Resources/Publications/Education-Training/NCC-Volume-One-Energy-Efficiency-Provisions (accessed on 14 February 2020).
- Moore, T.; Holdsworth, S. The Built Environment and Energy Efficiency in Australia: Current State of Play and Where to Next. In Energy Performance in the Australian Built Environment; Rajagopalan, P., Andamon, M.M., Moore, T., Eds.; Springer: Singapore, 2019; pp. 45–59. ISBN 978-981-10-7879-8. [Google Scholar]
- Department of the Environment and Energy. Changes to the Commercial Building Disclosure Program. Available online: http://cbd.gov.au/overview-of-the-program/changes-to-the-commercial-building-disclosure-program (accessed on 17 February 2020).
- Australian Government. Getting Assessed: Access and Information. Available online: https://www.cbd.gov.au/how-do-i-comply/compliance/getting-assessed-access-and-information (accessed on 27 September 2021).
- Parliament of Australia. 7. Sustainable Buildings. Available online: https://www.aph.gov.au/Parliamentary_Business/Committees/House/ITC/DevelopmentofCities/Report/section?id=committees%2Freportrep%2F024151%2F25690 (accessed on 27 February 2020).
- Bulkeley, H.; Schroeder, H.; Janda, K.; Zhao, J.; Armstrong, A.; Chu, S.Y.; Ghosh, S. Cities and Climate Change: The Role of Institutions, Governance and Urban Planning. UK. 2009. Available online: http://siteresources.worldbank.org/INTURBANDEVELOPMENT/Resources/336387-1256566800920/6505269-1268260567624/Bulkeley.pdf (accessed on 16 December 2020).
- Iwaro, J.; Mwasha, A. A review of building energy regulation and policy for energy conservation in developing countries. Energy Policy 2010, 38, 7744–7755. [Google Scholar] [CrossRef]
- Sentman, S.D.; Del Percio, S.T.; Koerner, P. A Climate for Change: Green Building Policies, Programs, and Incentives. J. Green Build. 2008, 3, 46–63. [Google Scholar] [CrossRef]
- Gou, Z. The Shift of Green Building Development in China from a Voluntary to Mandatory Approach. In Green Building in Developing Countries: Policy, Strategy and Technology; Gou, Z., Ed.; Springer: Cham, Switzerland, 2020; pp. 1–21. ISBN 978-3-030-24650-1. [Google Scholar]
- Tanaka, K. Review of policies and measures for energy efficiency in industry sector. Energy Policy 2011, 39, 6532–6550. [Google Scholar] [CrossRef]
- Hoffer, E.R. Dynamics of Green Building Regulation: A Grounded Theory Study of Industry Practice Change. Int. J. Eng. Sci. Technol. 2020, 2, 25–33. [Google Scholar]
- Dodge Data & Analytics. World Green Building Trends 2018: Australia. 2018. Available online: https://www.worldgbc.org/sites/default/files/World%20Green%20Building%20Trends%202018%20SMR%20FINAL%2010-11.pdf (accessed on 6 October 2019).
- Kontokosta, C.E. Energy disclosure, market behavior, and the building data ecosystem. Ann. N. Y. Acad. Sci. 2013, 1295, 34–43. [Google Scholar] [CrossRef]
- Choi, E. Green on Buildings: The Effects of Municipal Policy on Green Building Designations in America’s Central Cities. J. Sustain. Real Estate 2010, 2, 1–21. [Google Scholar] [CrossRef]
- Thomas, L.E. Evaluating design strategies, performance and occupant satisfaction: A low carbon office refurbishment. Build. Res. Inf. 2010, 38, 610–624. [Google Scholar] [CrossRef]
- Kim, S.; Lim, B.T.; Kim, J. The Effect of Building Sustainability Regulation on the Green Office Building Stock in Australia. In Proceedings of the International Conference on Sustainable Built Environment, Actions for the Built Environment of Post-Carbon era Complying with COP21, Seoul, Korea, 11–14 December 2016; pp. 470–473, ISBN 9791196006501. [Google Scholar]
- Gabe, J. Successful greenhouse gas mitigation in existing Australian office buildings. Build. Res. Inf. 2016, 44, 160–174. [Google Scholar] [CrossRef]
- Fuerst, F.; Kontokosta, C.; McAllister, P. Determinants of Green Building Adoption. Environ. Plan. B 2014, 41, 551–570. [Google Scholar] [CrossRef]
- Gui, X.; Gou, Z. Association between green building certification level and post-occupancy performance: Database analysis of the National Australian Built Environment Rating System. Build. Environ. 2020, 179, 106971. [Google Scholar] [CrossRef]
- DiMaggio, P.J.; Powell, W.W. The Iron Cage Revisited: Institutional Isomorphism and Collective Rationality in Organizational Fields. Am. Sociol. Rev. 1983, 48, 147. [Google Scholar] [CrossRef]
- David, R.J.; Tolbert, P.S.; Boghossian, J. Institutional Theory in Organization Studies. In Oxford Research Encyclopedia of Business and Management; David, R.J., Tolbert, P.S., Boghossian, J., Eds.; Oxford University Press: Oxford, UK, 2019; ISBN 9780190224851. [Google Scholar]
- Anagnostopoulos, D.; Sykes, G.; McCrory, R.; Cannata, M.; Frank, K. Dollars, Distinction, or Duty? The Meaning of the National Board for Professional Teaching Standards for Teachers’ Work and Collegial Relations. Am. J. Educ. 2010, 116, 337–369. [Google Scholar] [CrossRef]
- Saeed, A.; Jun, Y.; Nubuor, S.; Priyankara, H.; Jayasuriya, M. Institutional Pressures, Green Supply Chain Management Practices on Environmental and Economic Performance: A Two Theory View. Sustainability 2018, 10, 1517. [Google Scholar] [CrossRef]
- Kim, S.; Lim, B.T.; Kim, J. Tenants’ motivations to lease Green Office Buildings: An exploratory study of Sydney Central Business District. Int. J. Struct. Civ. Eng. Res. 2019, 8, 59–62. [Google Scholar] [CrossRef]
- Darko, A.; Chan, A.P.C. Strategies to promote green building technologies adoption in developing countries: The case of Ghana. Build. Environ. 2018, 130, 74–84. [Google Scholar] [CrossRef]
- Darko, A.; Zhang, C.; Chan, A.P. Drivers for green building: A review of empirical studies. Habitat Int. 2017, 60, 34–49. [Google Scholar] [CrossRef]
- Granade, H.C.; Creyts, J.; Derkach, A.; Farese, P.; Nyquist, S.; Ostrowski, K. Unlocking Energy Efficiency in the U.S. Economy, New York. 2009. Available online: https://www.mckinsey.com/client_service/electric_power_and_natural_gas/latest_thinking/~/media/204463a4d27a419ba8d05a6c280a97dc.ashx (accessed on 16 December 2020).
- Blum, D.; Holling, H. Spearman’s law of diminishing returns. A meta-analysis. Intelligence 2017, 65, 60–66. [Google Scholar] [CrossRef]
- Mahmoudi, A.; Feylizadeh, M.R. A grey mathematical model for crashing of projects by considering time, cost, quality, risk and law of diminishing returns. Grey Syst. Theory Appl. 2018, 8, 272–294. [Google Scholar] [CrossRef]
- Jackson, J. How Risky Are Sustainable Real Estate Projects? An Evaluation of LEED and ENERGY STAR Development Options. Am. Real Estate Soc. 2009, 1, 91–106. [Google Scholar] [CrossRef]
- Thomas, D.R. Policy Under the Microscope: Research Strategies for Investigating Policy Processes. In Health and Public Policy in New Zealand; Ashton, T., Davis, P., Eds.; Oxford University Press: Oxford, UK, 2001; ISBN 0195584171. [Google Scholar]
- Hoffman, D.L.; De Leeuw, J. Interpreting multiple correspondence analysis as a multidimensional scaling method. Mark. Lett. 1992, 3, 259–272. [Google Scholar] [CrossRef]
- Loosemore, M.; Lim, B.; Ilievski, M. Depression in Australian Undergraduate Construction Management, Civil Engineering, and Architecture Students: Prevalence, Symptoms, and Support. J. Civ. Eng. Educ. 2020, 146, 4020003. [Google Scholar] [CrossRef]
- Craighead, G. High-Rise Building Definition, Development, and Use. In High-Rise Security and Fire Life Safety, 3rd ed.; Craighead, G., Ed.; Butterworth-Heinemann: Boston, MA, USA, 2009; Chapter 1; pp. 1–26. ISBN 978-1-85617-555-5. [Google Scholar]
- Kim, S.; Osmond, P. Analyzing green building rating tools for healthcare buildings from the building user’s perspective. Indoor Built Environ. 2014, 23, 757–766. [Google Scholar] [CrossRef]
- Zhou, Y.; Zhu, J.; Tong, T.; Wang, J.; Lin, B.; Zhang, J. A statistical normalization method and differential expression analysis for RNA-seq data between different species. BMC Bioinform. 2019, 20, 163. [Google Scholar] [CrossRef]
- JLL. Melbourne Takes the Status of Being the Largest CBD Office Market in Australia: The Melbourne’s CBD Office Market Has Reached the 5 million sqm Milestone, Marking the City as Australia’s Largest CBD. Available online: https://www.jll.com.au/en/newsroom/melbourne-takes-the-status-of-being-the-largest-cbd-office-market-in-australia (accessed on 15 October 2021).
- The Centre for International Economics. Decision Regulation Impact Statement: Energy Efficiency of Commercial Buildings. 2018. Available online: https://abcb.gov.au/sites/default/files/resources/2022/Final-RIS-energy-efficiency-of-commercial-buildings.docx (accessed on 6 October 2022).
- Urban Taskforce Australia. Standing Tall: High Rise Buildings to Help Sydney Become a Green Metropolis; Urban Ideas. 2022. Available online: https://www.urbantaskforce.com.au/wordpress/wp-content/uploads/2022/01/Standing-Tall-Urban-Ideas-January-2022.pdf (accessed on 6 October 2022).
- Kim, S.; Lim, B.T.H. Analysing the Characteristics of Green and Non-Green Buildings: From the Real Estate Perspective. In Proceedings of the 2018 International Conference on Environment (ICENV 2018), Penang, Malaysia, 11–13 December 2018; pp. 1–5. [Google Scholar]
- Gabe, J.; Rehm, M. Do tenants pay energy efficiency rent premiums? J. Prop. Investig. Financ. 2014, 32, 333–351. [Google Scholar] [CrossRef]
- Wolfe, A.K.; Malone, E.L.; Heerwagen, J.; Dion, J. Behavioral Change and Building Performance: Strategies for Significant, Persistent, and Measurable Institutional Change. 2014. Available online: https://www.pnnl.gov/main/publications/external/technical_reports/PNNL-23264.pdf (accessed on 6 October 2022).
- NABERS. NABERS Annual Report 2019–2020: Major Achievements. Deepening Our Relationship with the NABERS Community. Available online: https://nabers.info/annual-report/2019-2020/major-achievements/ (accessed on 5 September 2022).
- Denne, T.; Wright, L. A Review of Methods for Analysis of Regulatory Effectiveness: January 2017. NZ Transport Agency Research Report No. 604. 2017. Available online: https://www.researchgate.net/profile/Tim-Denne/publication/315694907_A_review_of_methods_for_analysis_of_regulatory_effectiveness/links/58dc5cfeaca2725c47470167/A-review-of-methods-for-analysis-of-regulatory-effectiveness.pdf (accessed on 15 August 2022).


Publisher’s Note: MDPI stays neutral with regard to jurisdictional claims in published maps and institutional affiliations. |
© 2022 by the authors. Licensee MDPI, Basel, Switzerland. This article is an open access article distributed under the terms and conditions of the Creative Commons Attribution (CC BY) license (https://creativecommons.org/licenses/by/4.0/).