Article

Analysis on the Impact of River Basin Ecological Compensation Policy on Water Environment Pollution

1
School of Economics and Management, Shandong Agricultural University, Tai’an 271018, China
2
School of Economics, Shandong University of Finance and Economics, Jinan 250014, China
*
Authors to whom correspondence should be addressed.
Sustainability 2022, 14(21), 13774; https://doi.org/10.3390/su142113774
Submission received: 9 August 2022 / Revised: 4 October 2022 / Accepted: 11 October 2022 / Published: 24 October 2022
(This article belongs to the Section Sustainable Water Management)

Abstract

:
The implementation of the river basin ecological compensation policy (ECP) is an important way to improve the ecological environment and achieve the goal of “beautiful China” (“Beautiful China” is a concept put forward by the 18th National Congress of the Communist Party of China.). The impact analysis of the watershed ecological compensation policy provides an important basis for improving the mechanism. The research regards the Dawen River Basin ecological compensation policy in Shandong Province as a natural experiment and uses the 2005–2017 prefecture-level city panel data. Based on the two-way panel fixed effect model, Propensity Score Matching and Differences-in-Differences (PSM-DID) are applied to analyze the mechanism of the Dawen River Basin ECP pilot project and its impact on the intensity of water pollution, in order to provide experience for the development of ecological compensation work in the Yellow River Basin in the future. The empirical results show that the implementation of the river basin ECP has significantly reduced the intensity of water pollution by 22.47% with a short time lag, and the pollution reduction effect of the policy is increasing year by year. The river basin ECP has an obvious optimizing effect on industrial structure, with an inconspicuous effect on economic growth and technological progress. Finally, relevant policy recommendations are put forward from the aspects of the promotion, implementation and effect of the river basin ECP.

1. Introduction

Since the economic reform and opening up, China’s rapid economic development has brought tremendous pressure to the river basin ecological environment, especially the upward trend of water pollution. Among all kinds of ecological environmental pollution, water pollution is the most serious and of top priority to be solved [1]. In order to reduce increasingly severe ecological problems and promote the coordinated development of economy and environment, China has introduced a series of ecological protection policies since 2005 [2], including the river basin ECP. As an economic means to reduce the discharge of pollutants and improve the environment of the river basin, ECP has gradually received significant government attention.
Effective water resource management requires the gradual improvement of the river basin ECP, and policy evaluation provides an important basis for policy improvement. As an important area in ecological compensation, the evaluation of the river basin ECP has received extensive attention from the academic community. In the early stage of research, most scholars focused on “who compensates who” [3,4], “how much” [5,6,7] and “how to compensate” [8,9], and generated fruitful research results. With the deepening of the research, the evaluation of the ECP performance has attracted more and more attention. The evaluation of ECP by overseas scholars mostly focused on case studies, typically the research on Virilla in Costa Rica [4]. Chinese scholars’ research could be divided into qualitative and quantitative aspects. Qualitative research mainly used questionnaires to compare residents’ preferences for different policies or to compare the differences before and after the implementation of policies [10]. Quantitative research could be further divided by research contents into two aspects. On the one hand, the cost-benefit approach and data envelopment analysis are used to evaluate the efficiency of policy design and implementation [11]. On the other hand, the entropy weight model is used to evaluate the benefits of ecological compensation by constructing the evaluation index system of ecological compensation [12,13]. Only a few scholars studied the ECP effect on ecological environment through econometric models. In the research of the ECP effect on ecological environment, some scholars have used the synthetic control method (SCM) to study it and found that the implementation of the “regional compensation policy for water environment” significantly reduced the intensity of water pollution, and the main mechanisms of action were to improve the economic level, strengthen public awareness of environmental protection and increase the proportion of state-owned enterprises [14]. Other scholars have studied the water environment governance effect of the river basin ECP from the two aspects of governance effect and mechanism analysis by using the Differences-in-Differences method and believed that the river basin ECP can improve the water environment governance effect by encouraging local governments to increase environmental governance investment [15]. Most of the existing research is concerned with the analysis of the average impact effect and the impact mechanism of policy implementation; the research on the time trend and time-lag effect needs to be supplemented.
The introduction of “The Ecological Protection and High-quality Development of the Yellow River basin” indicates that the ecological compensation for the whole Yellow River Basin has become the focus of China’s ecological compensation work in the future. As the largest tributary of the lower reaches of the Yellow River, the Dawen River is the early pilot project of the river basin ECP. The research on the impact of ECP on water environmental pollution in the Dawen River Basin is of great significance for the development of ecological compensation work in the Yellow River Basin in the future, and provides a reliable basis for improving the river basin ecological compensation mechanism.
Thus, according to the “find the problem, put forward the hypothesis, design the model, conduct empirical analysis, obtain the conclusion” research framework, the research regards the ecological compensation pilot project of the Dawen River Basin in Shandong Province as a natural experiment and uses macro panel data from 17 prefecture-level cities in Shandong Province from 2005 to 2017. The Propensity Score Matching method is used to match 17 prefecture-level cities in Shandong Province, and the Differences-in-Differences method is used to eliminate the influence of natural trends and reveal the average impact effect, dynamic marginal effect and specific impact mechanism of the ECP pilot project on water pollution. Finally, policy recommendations are put forward for the better promotion of river basin ecological compensation policies.

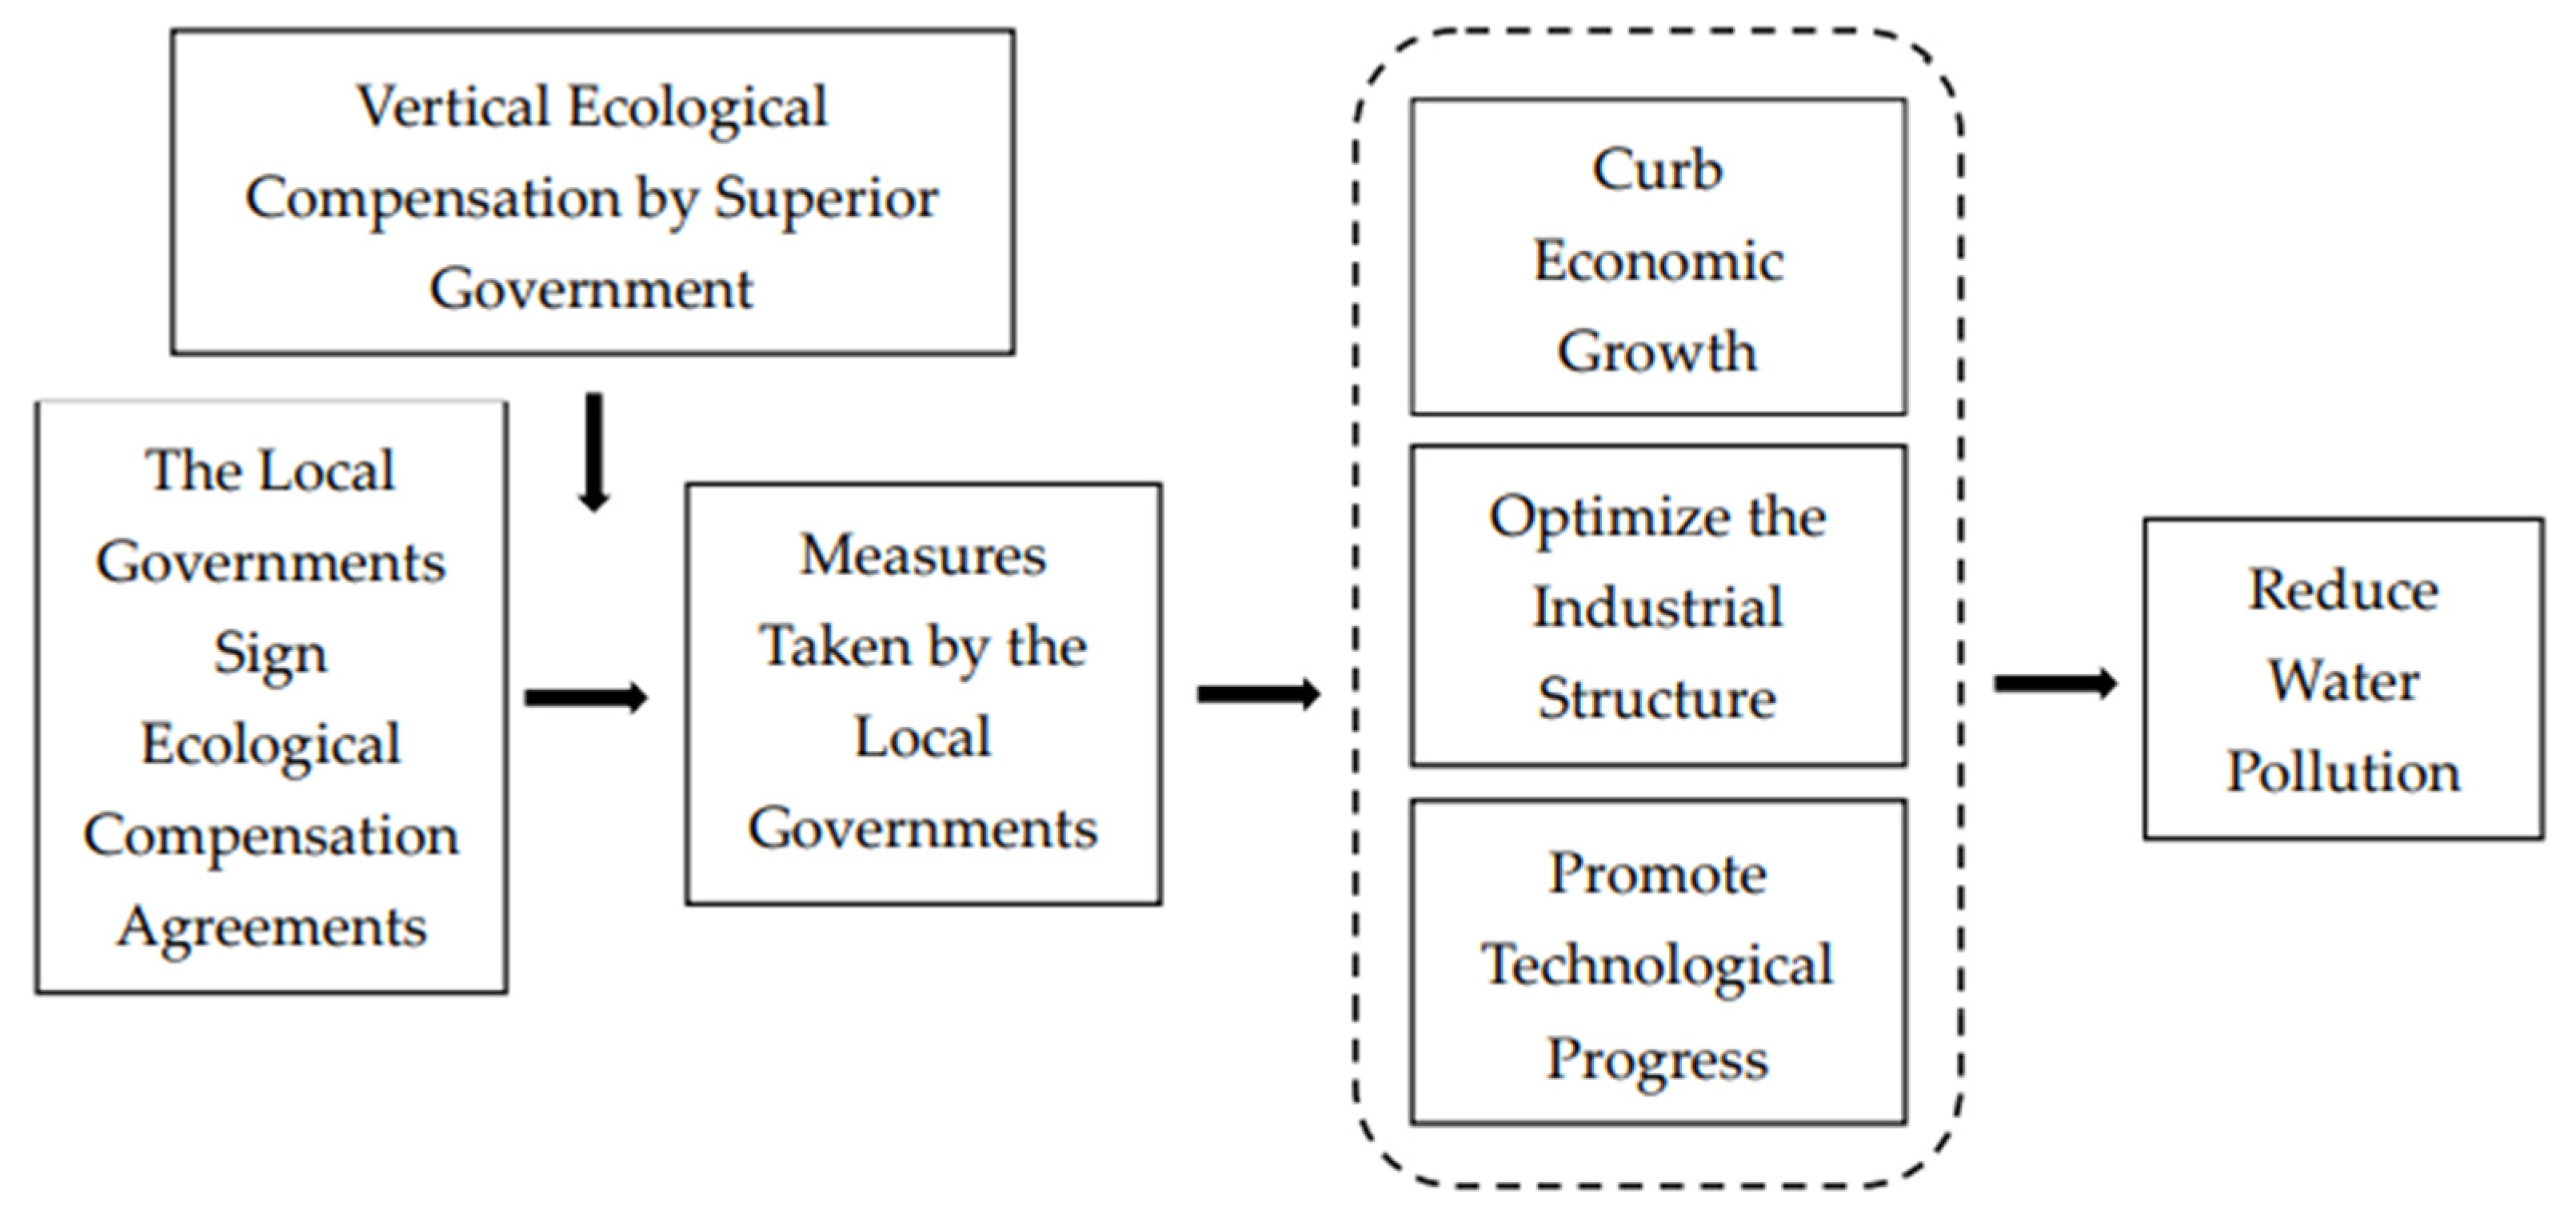
2. Research Hypothesis

The river basin ecological environment can provide tangible material products and intangible ecological benefits, which are typical public goods. Based on the theory of public goods, due to the existence of non-rival and non-exclusive, river basin ecological products will be overused, resulting in the “Tragedy of the Commons” and the free-riding phenomenon. Water resources have externalities. In order to protect water resources, the upstream needs to invest in cost and sacrifice part of economic development. The effect of such investment and protection will spill over to the whole basin, resulting in positive externalities. Poor upstream protection, or even the pollution of water sources, will infringe on the right of the downstream to access clean water, resulting in negative externalities. According to Coase Theorem, the externality of public goods can be solved by clarifying property rights. As long as property rights are clear and transaction costs are zero or small, the pareto optimality of resource allocation can be achieved no matter who is given property rights at the beginning [16]. However, water resources are owned by the state in China, and water resources are managed by a system that combines river basin management with administrative region management. In China, there are no clear legal norms on the relationship between resource property rights and environmental property rights. Therefore, in China, with the public ownership of natural resources, the government can only rely on administrative regulation to protect citizens’ environmental rights. The biggest “short board” of administrative regulation is the lack of an incentive mechanism. The local government lacks the necessary incentive for environmental protection in the river basin, which eventually leads to high costs and low efficiency. River basin ecological compensation separates the ownership and use rights of natural resources, internalizes the external effect by means of transfer payment and the market mechanism, and establishes the incentive mechanism.
In 2008, a pilot project of basin ecological compensation at the Dawen River Basin was carried out in Shandong Province. Specifically, a combination of vertical and horizontal compensations was adopted: vertically, if the water quality of Dongping Lake at the end of the basin improved, the provincial government would provide financial compensation to Tai’an City; horizontally, “two-way compensation” was adopted between Laiwu City (upstream) and Tai’an City (downstream). If the water quality at the junction of the two cities was up to the standard, the downstream city (Tai’an City) would compensate the upstream city (Laiwu City); otherwise, the upstream city would compensate the downstream city. In this pilot project, the local governments represent residents in their jurisdictions to negotiate and sign ecological compensation agreements. At the same time, the superior government acts as a strong reciprocal government [17] and carries out vertical ecological compensation. Based on game theory and game relationships, river basin ecological compensation can effectively mobilize the enthusiasm of environmental protection in the relevant regions. From the perspective of their own gains and losses, the local government makes the decision to maximize interests and actively adopt measures to promote the obvious improvement of the water environment in the Dawen River Basin.
Specific measures taken by local governments to improve water environment are shown in Figure 1.First, the local government will shut down or relocate enterprises that contribute greatly to the regional economy while causing serious pollution. Although this will lead to the stagnation or regression of regional economic growth, it can reduce water pollution from industrial sources [15] and improve the water environment. Second, with the optimization of the industrial structure as the leading factor, the government will focus on supporting and developing the tertiary industries that use less water resources and have less sewage discharges. This will have a positive effect on the advancement and rationalization of the industrial structure [18,19,20] and realize the co-development of the economy and environment. Third, the government will increase investment funds and support technological reforms. On the one hand, it can improve industrial processing technology to reduce the generation of sewage. On the other hand, it can improve the technical level to treat sewage, increase the secondary utilization rate and reduce the discharge of industrial sewage [21]. All of the above three ways can have a good effect on the water environment and significantly reduce water pollution. In addition, the government’s methods of restraining economic growth, optimizing industrial structure and advancing technological progress are all long-term actions. The introduction of relevant government policies, the withdrawal of heavy polluting enterprises, the transformation of industrial structure and the innovation of science and technology all need a long period of time. At the same time, the improvement effect of these behaviors on the water environment will gradually increase over time. Therefore, the river basin ECP may not have an immediate impact on water environment, that is, the impact may have a time-lag effect and the marginal effect may have an increasing trend.
Based on the above analysis, this research proposes the following hypotheses:
H1: 
The river basin ECP can significantly reduce water pollution;
H2: 
The effect of the river basin ECP on water pollution has a time-lag effect and the marginal effect has an increasing trend;
H3: 
The river basin ECP reduces water pollution by inhibiting economic growth, optimizing industrial structure or promoting technological progress.

3. Methods and Variables

3.1. Methods

This study regards the Dawen River Basin ecological compensation pilot project in Shandong Province as a natural experiment, and evaluates the performance of the ecological compensation pilot project by comparing the effects of ECP in the experimental group and the control group. It should be pointed out that except ECP, the natural regulation of the water environment with time trend is also one of the reasons for river environment improvement. Therefore, this research adopts Differences-in-Differences (DID) estimation to eliminate the influence of natural trends, accurately identify policy effects and objectively evaluate the effect of the river basin ECP on water environment improvement.
In DID estimation, the experimental group and the control group need to satisfy the parallel trend hypothesis, otherwise, it will lead to endogeneity. To solve this problem, the Propensity Score Matching (PSM) method was used to control the systematic differences of observable variables. In addition, this study uses a two-way panel fixed effects model for DID estimation.
Specific steps are as follows:
The PSM method is applied to match the experimental group with the control groups to find the most similar one to the experimental group.
The fixed-effects model is applied to estimate the matched experimental group and control group.
The basic regression model is set as follows:
P i , t PSM = α 0 + α 1 Did i , t + α 2 Treated i , t + α 3 Time i , t + α 4 Control i , t + ε i , t
P i,t PSM is the water environment intensity of city i in the year t, and it is the dependent variable. Treatedi,t is a regional dummy variable. The regions of the experimental group in the year t are set as 1 and the other regions are set as 0. Timei,t is a time dummy variable. The years before the policy are set as 0 and the rest are set as 1. Didi,t is a cross item, representing the effect of the river basin ECP on the experimental group. Controli,t is a set of control variables. εi,t is stochastic disturbance team.

3.2. Experimental and Control Group

According to the Dawen River Basin Ecological Compensation Pilot Project Measures based on the Upstream and Downstream Agreement, Laiwu and Tai’an City basically cover the relevant river basin scope. Therefore, whole-city statistics were used to ensure the objectivity of the analysis results. Laiwu City (upstream) and Tai’an City (downstream), which belong to the scope of policy implementation, are selected as the experimental group. The PSM method is used to select the control group according to the situation of the other 15 cities in Shandong Province. The details and specific operations are listed in Section 4.1 PSM Results.

3.3. Variables

The data in the China City Statistical Yearbook and Shandong Province Statistical Yearbook constitute the annual panel data of prefecture-level cities in Shandong Province from 2005 to 2017 in this study. Due to the large value of some variables, it is not convenient to calculate. Logarithmic treatment can compress the scale of variables and weaken the multicollinearity and heteroscedasticity of models. At the same time, logarithmic processing will not change the nature and correlation of data and will not affect the empirical analysis results. Therefore, some non-negative numerical variables are logarithmically processed. See Table 1 for specific variable settings.

3.3.1. Dependent Variable

The dependent variable in this study is water pollution intensity. The key point of policy evaluation is the realization of policy objectives [22]. The primary objective of the Dawen River Basin ECP is to improve the water environment. In China, water pollution mainly comes from industry, people’s life and agriculture. Taking into account the availability of data, this research selects the total discharges of industrial wastewater and domestic sewage as the total wastewater discharges. The implementation of the ECP is to balance the relationship between economic development and ecological protection. Therefore, this research selects the ratio of the total wastewater discharge to the real GDP as the evaluation index of water pollution intensity. Logarithmic conversion is performed on the ratio before analysis.

3.3.2. Independent Variables

  • Time dummy variable. The start time of the Dawen River Basin ECP is 2008, so the years before 2008 are defined as 0 and the rest of the years are defined as 1. The changes in water pollution intensity could be compared before and after 2008;
  • Regional dummy variable. As the experimental group, Laiwu and Tai’an are defined as 1, and the control group selected by the PSM method is defined as 0;
  • Cross term. The cross term of the time dummy variable and regional dummy variable is the core explanatory variable to analyze the impact of ECP on water pollution. If its coefficient is negative and significant, the Dawen River Basin ECP has significantly reduced the water pollution and promoted the improvement of the ecological environment.

3.3.3. Controlled Variables

In order to minimize the estimation bias, the selection of controlled variables was based upon related studies [23,24].
  • Economic development level. Most studies have shown that economic development will affect the water environment to some extent, and the effect may be positive or negative. In this research, the regional GDP per capita is used to represent the level of economic development;
  • Industrial structure. Optimizing the industrial structure can reduce the discharge of pollutants and make the ecological environment better. The tertiary industry has less pollution to water resources. If the proportion of the tertiary industry in the industrial structure can be increased, the water pollution situation may be significantly reduced. Therefore, the added value of the tertiary industry divided by the real GDP of the region is used to represent the industrial structure;
  • Science and technology level. The improvement of science and technology brings technological progress. On the one hand, technological progress can reduce the output of wastewater at the source. On the other hand, it can improve the ability to treat wastewater and ultimately reduce water pollution. This article uses the total scientific and technological expenditure at the end of the year to indicate the level of science and technology;
  • Wastewater treatment capacity. The improvement of wastewater treatment capacity can reduce the discharge of wastewater and reduce water pollution. The wastewater treatment rate is used to represent wastewater treatment capacity;
  • Population. Daily life wastewater is one of the main sources of wastewater. As the main source of daily life wastewater, larger populations will produce more wastewater and cause more serious water pollution. The total population at the end of the year is used to represent population;
  • Xiaoqing River Basin. Like the Dawen River Basin, the Xiaoqing River Basin is also an inner-province basin of Shandong. In 2010, basin ecological compensation was carried out in the Xiaoqing River Basin, and the water quality has been significantly improved. That is, the implementation of the Xiaoqing River Basin ECP affected the pollution of the water environment in the cities it flows through. A binary dummy variable is set. In 2010 and beyond, the value of cities that the Xiaoqing River flows through are set to be 1, and the rest are 0.
Logarithmic transformations are performed on all other controlled variables except for the “Xiaoqing River” variable (binary dummy variable). The descriptive statistics of main variables in the study are shown in Table 2

4. Results and Discussion
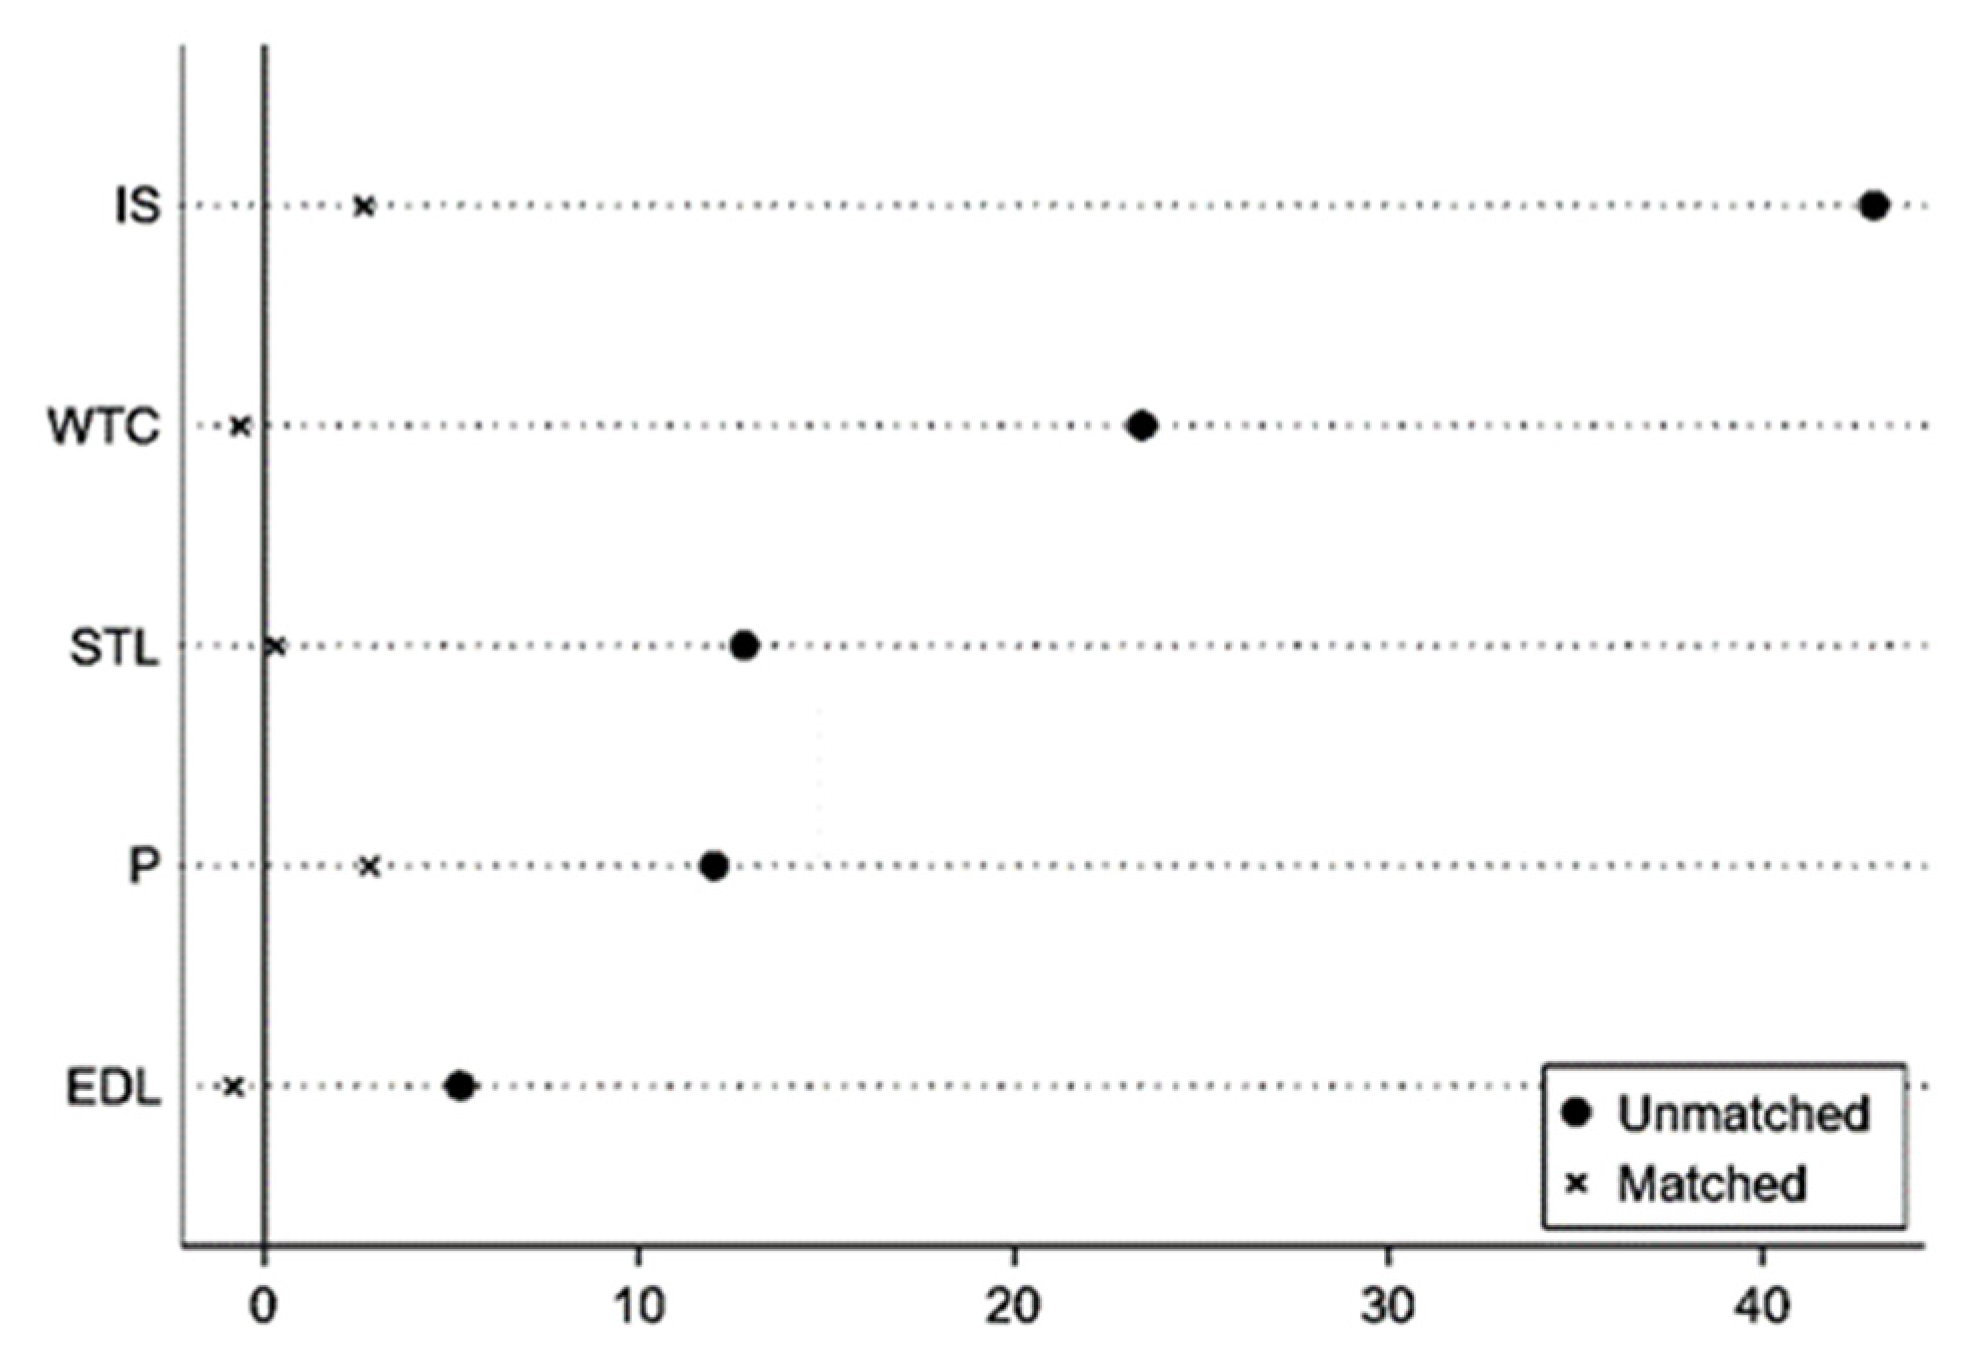
4.1. PSM Results

This research selects economic development level (EDL), industrial structure (IS), science and technology level (STL), wastewater treatment capacity (WTC) and population (P) as covariates for matching. After matching, the treatment group obtains 26 observations and the control group obtains 170 observations—in total, 196 observations. In order to ensure that the PSM model is accurate and the matching results meet the requirements, the stationarity test is carried out. If the matching variables have no significant differences between the treatment group and the control group, and the absolute value of the standard deviation is less than 10%, it passes the stationarity test. The test results are shown in Figure 2 and Table 3.
Observation shows that there is no significant difference in matching variables between the treatment group and the control group after matching, and the absolute values of their standard deviations are all less than 10%, showing that the stationarity test is passed. The PSM model adopted in this research is accurate and the matching results meet the requirements.

4.2. Results Analysis

4.2.1. Average Impact

DID estimation is used on the samples after matching, and the results are shown in Table 4.
As shown in Table 4, when the controlled variables are not added and the time and individual effects are not controlled (Model 1), the river basin ECP can reduce the water pollution intensity of the experimental group by 19.85% at the significance level of 1%; when no controlled variables are added but the time and individual effects are controlled (Model 2), the river basin ECP can the reduce water pollution intensity of the experimental group by 21.04% at the significant level of 5%; when the controlled variables are added but the time and individual effects are not controlled (Model 3), the river basin ECP can reduce the water pollution intensity of the experimental group by 25.15% at the significant level of 5%; and when the controlled variables are added and the time and individual effects are controlled (Model 4), the river basin ECP can reduce the water pollution intensity of the experimental group by 22.47% at the significant level of 10%. On the whole, the cross-term coefficient is always negative at the significance level of 10% and above, and the coefficient is relatively stable. This indicates that ECP can significantly reduce water pollution intensity in the experimental group, so H1 is established. Some scholars have carried out studies on the impact of different river basin ecological compensation policies on water environment by the method of DID. The results show that the implementation of ECP has a significant effect on the improvement of water quality, and the ecological compensation pilot project has significantly reduced the intensity of water pollution, which is consistent with the results of this research [25,26]. However, the relevant studies only analyzed the average effect of the policy implementation effect and did not analyze the dynamic marginal effect and influence mechanism.

4.2.2. Dynamic Marginal Effect

According to the above analysis, the river basin ECP can significantly reduce water pollution intensity. The traditional DID model can only analyze the average effect of the river basin ECP. In order to investigate the time trend and time-lag effect, the dynamic marginal effect analysis is carried out.
Expand the Formula (1) by adding the interaction terms between the time dummy variable and the regional dummy variable, and construct the policy dynamic influential effect model as follows:
P i , t PSM = β 0 + β 1 Treated i , t + β 2 Yeart t + β 3 Control i , t + μ i + ε i , t
Yeartt = Treatedi,t × Yeart, among which Yeart is a time dummy variable. It is 1 in the year of policy implementation, and 0 in other years. μi stands for individual fixed effect.
It can be observed from Table 5 that β2 is always negative. After adding the control variables and fixing the individual effects (Model 6), only the coefficients of the cross term from 2010 to 2017 passed the significance test. This indicates that although implemented in 2008, the river basin ECP did not have a significant effect until 2010. That is, there is a short time-lag effect on the improvement of the water environment. It shows that in the process of implementing the river basin ECP, the actions taken by the local government after being inspired are not achieved overnight; it needs time to complete and finally give full play to the due effect. In addition, from the perspective of the marginal effect, the absolute value of the cross-term coefficient gradually increases, which shows an increasing trend of the marginal effect of the river basin ECP on water environment, and the implementation effect of the policy increases year by year. Thus, H2 is established. Some scholars have studied the effect evaluation of ecological compensation policy in the Xin‘an River Basin and found that there is no time-lag effect in the implementation effect, and the effect will become more obvious with the passage of time [27]. Other scholars used the PSM-DID and two-way panel fixed effect model to evaluate the pollution reduction effect of policies and found that the pollution reduction effect of policies was increasing year by year and there was a short-term time-lag effect [24]. By comparison, although there are differences in the time-lag effect of different river basins, they all have an increasing trend of marginal effects, that is, the effect of the river basin ECP will become more obvious with the passage of time.

4.3. Robustness Test

As for the robustness test, the actual policy implementation time is changed, and 2006 and 2007 are selected as the policy impact years, by referring to the previous practice [28,29].
The specific model is as follows:
P i , t PSM = γ 0 + γ 1 Treated i , t Time t + γ 2 Control i , t + φ t + μ i + ε i , t
Treatedi,t × Timet is the interaction item. If the coefficient of Treatedi,t × Timet is significant, the influencing factors of water pollution intensity are likely to come from factors besides the river basin ECP. Otherwise, the reduction in the water pollution benefits from the river basin ECP. φt stands for time fixed effect. The regression results are shown in Table 6.
According to Table 6, when 2006 (Model 7) and 2007 (Model 8) are used as the hypothetical policy impact year, the coefficient of the interaction term is not significant, which proves the reduction in water pollution intensity mainly comes from the ECP, and the regression results are stable.

4.4. Influence Mechanism Analysis

In order to understand the specific impact mechanism of the river basin ecological compensation policy, this research, by referring to previous practice [30,31], analyzes the mechanism from three aspects: economic growth effect, industrial structure effect and science and technology progress effect. Among them, the regional GDP per capita is selected as the economic growth effect indicator, the added value of the tertiary industry divided by the real GDP of the region is selected as the industrial structure effect indicator, and the total scientific and technological expenditure at the end of the year is selected as the technological progress effect indicator.
The specific model is as follows:
Y idt = η 1 + η 2 Did i , t + η 3 Control i , t + φ t + μ i + ε i , t
Yidt refers to the level of economic development, industrial structure and technological level. It represents the economic growth (Model 9), industrial structure optimization (Model 10) and science and technology progress (Model 11), respectively. The regression results are shown in Table 7.
According to Table 7, the river basin ECP can increase the proportion of the tertiary industry in the industrial structure by 2.43% at the significant level of 10%. That is, the basin ECP has a significant effect of optimizing the industrial structure. However, the river basin ECP has no significant effect on economic growth and science and technology progress. On the whole, in the face of environmental protection pressure and policy incentives, the government in the ecological compensation pilot project has made more industrial structure adjustments. A high-level and reasonable industrial structure has reduced the use of water resources and reduced sewage discharge. This is beneficial to the optimization of water environment quality, while the effects of economic growth and science and technology progress are not significant. Therefore, H3 is established. Most of the existing related research take the Xin’an River as the research object. The research results show that the implementation of the Xin’an River Basin ECP can force the industrial structure to upgrade and has obvious industrial structure effect, which is consistent with the results of this research [32].

5. Conclusions and Policy Recommendations

This study takes the Dawen River Basin ecological compensation pilot project in Shandong Province as a natural experiment. Based on the panel data of prefecture-level cities from 2005 to 2017, the PSM-DID model has been used to analyze the impact of ECP on water pollution intensity, and the robustness test and the analysis of the impact mechanism have been carried out. The research conclusions are basically consistent with the hypothesis. The research results are as follows:
The average impact analysis shows that the implementation of the river basin ECP can stimulate local governments, significantly reduce the intensity of water pollution, improve the quality of water resources from the source and achieve the expected goal of the policy. The dynamic marginal effect analysis shows that the river basin ECP has significantly reduced the intensity of water pollution, whose marginal effect is increasing year by year, and a short time-lag effect exists. This is because the watershed ecological protection measures taken by the government need a lot of time to complete, and the watershed ecological protection project is not a one-off. Once built, it will have a sustained and year-to-year impact on water quality. The influence mechanism analysis shows that the river basin ECP has a significant effect on optimizing the industrial structure. The government promotes the advanced industrial structure by increasing the proportion of the tertiary industry with less pollution, thus affecting the wastewater discharge per unit of GDP and reducing water environment pollution. However, the government does not pay enough attention to the effects of policy implementation in terms of economic growth and technological progress, and the corresponding measures are insufficient, resulting in the insignificant effects of economic growth and technological progress.
Based on the research results, the policy recommendations are drawn.
  • Guide the participation of the whole population and promote vertical and horizontal mixed river basin ecological compensation according to local conditions. The Dawen River Basin pilot project, as one of the early pilot projects of China, is a typical vertical and horizontal cross-border river basin ecological compensation pilot project within the province, which effectively alleviates water environmental pollution and improves water resources. Therefore, the government should gradually promote models of this kind considering the actual conditions of each region. Markets, society and non-governmental organizations should be guided to participate in and perfect the ecological compensation mechanism.
  • Overcome the policy time lag and persist in the river basin ECP for a long time. The river basin ECP may have a short time lag, while the marginal effect is increases year by year. That is, after the policy is implemented, it may not have a significant impact immediately, and the impact will gradually increase over time. In view of this characteristic, in order to maintain the policy influence, the government should adhere to the long-term implementation of the policy, focus on the long-term goal and give full play to the policy effect, so as to reduce pollutant emissions and improve environmental conditions.
  • Focus on technological innovation and help long-term sustainable economic development in the future. Although the river basin ECP has an obvious effect on the optimization of the industrial structure, its effect on economic growth and technological progress is not obvious. The government should more actively accelerate technological innovation and promote energy conservation and emission reduction. At the same time, it should stimulate economic growth, create new impetus for sustainable economic development in the future and achieve a win–win situation between economic development and ecological construction.

Author Contributions

Conceptualization, Y.G.; methodology, S.L.; software, S.L.; validation, Y.G.; formal analysis, S.L.; investigation, Y.L.; resources, Y.L.; data curation, Y.L.; writing—original draft preparation, S.L.; writing—review and editing, Y.L.; supervision, X.G.; project administration, Y.G.; funding acquisition, X.G. All authors have read and agreed to the published version of the manuscript.

Funding

This research was funded by The National Social Science Foundation of China (20BGL198), The National Natural Science Foundation of China (71503148) and Special Fund of Social Science Layout Study in Shandong Province (19CDCJ08).

Institutional Review Board Statement

Not applicable.

Informed Consent Statement

Not applicable.

Data Availability Statement

Publicly available datasets were analyzed in this study. These data can be found here: https://data.cnki.net/yearbook/Single/N2022010255 (accessed on 8 August 2022), https://data.cnki.net/yearbook/Single/N2021050059 (accessed on 8 August 2022).

Acknowledgments

This study is funded by National Social Science Fund “Study on Multi-subject Coordination Mechanism in River Basin Ecological Compensation” (20BGL198); National Natural Science Fund “Food Crop Ecological Compensation Mechanism Based upon Carbon Sink Function” (71503148); Special Fund of Social Science Layout Study in Shandong Province “Innovation Study of River Basin Ecological Compensation in Water Pollution Prevention and Cure of Shandong Province” (19CDCJ08).

Conflicts of Interest

The authors declare no conflict of interest.

References

  1. Zhang, X. Trend of and the governance system for water pollution in China. China Soft Sci. 2014, 10, 11–24. [Google Scholar]
  2. Xu, G.L.; Jie, Y.M.; Ge, Y.X. Research on ecological Compensation Mechanism of Watershed, 1st ed.; China Agriculture Press: Beijing, China, 2014; pp. 17–19. [Google Scholar]
  3. Freeman, R.E. Strategic Management: A Stakeholder Approach. Pitman: Boston, MA, USA, 1984. [Google Scholar]
  4. Jiang, S.Q.; Chen, K. A review of researches on payment for watershed ecosystem services. Ecol. Econ. 2016, 32, 175–180. [Google Scholar]
  5. Guan, X.J.; Liu, W.K.; Chen, M.Y. Study on the ecological compensation standard for river basin water environment based on total pollutants control. Ecol. Indic. 2016, 69, 446–452. [Google Scholar] [CrossRef]
  6. Li, G.F.; Shi, M.J.; Zhou, D.Y. How much will farmers be compensated for water reallocation from agricultural water to the local ecological sector on the edge of an oasis in the Heihe River Basin? Agric. Water Manag. 2021, 249, 106801. [Google Scholar] [CrossRef]
  7. Ren, Y.S.; Lu, L.; Zhang, H.M.; Chen, H.F.; Zhu, D.C. Residents’ willingness to pay for ecosystem services and its influencing factors: A study of the Xin’an River basin. J. Clean. Prod. 2020, 268, 122301. [Google Scholar] [CrossRef]
  8. Guan, X.J.; Liu, M.; Meng, Y. A comprehensive ecological compensation indicator based on pollution damage—Protection bidirectional model for river basin. Ecol. Indic. 2021, 126, 107708. [Google Scholar] [CrossRef]
  9. Liu, M.C.; Rao, D.D.; Yang, L.; Min, Q.W. Subsidy, training or material supply? The impact path of eco-compensation method on farmers’ livelihood assets. J. Environ. Manag. 2021, 287, 112339. [Google Scholar] [CrossRef] [PubMed]
  10. Yu, Z.N.; Tan, Y.Z.; Wu, C.F.; Mao, M.Z.; Zhang, X.L. Alternatives or status quo? Improving fallow compensation policy in heavy metal polluted regions in Chaling County, China. J. Clean. Prod. 2019, 210, 287–297. [Google Scholar] [CrossRef]
  11. Gao, Y.H.; Qiu, S.L. The evaluation of watershed eco-compensation: A case study of the Tingjiang River Basin. J. Hebei Agric. Univ. 2022, 24, 25–33. [Google Scholar]
  12. Chen, Y.; Dou, S.Q.; Xu, D.Y. The effectiveness of eco-compensation in environmental protection -A hybrid of the government and market. J. Environ. Manag. 2021, 280, 111840. [Google Scholar] [CrossRef]
  13. Peng, Y.T. Evaluation of comprehensive benefits of ecological compensation for water sources in xin’an river basin. Jianghuai Trib. 2020, 5, 75–82. [Google Scholar]
  14. Qin, B.T.; Yu, Y.W.; Ge, L.M. Improvement effect and mechanism of watershed ecological compensation system: Based on a quasi-natural experiment in Jiangsu Province. East China Econ. Manag. 2022, 36, 21–31. [Google Scholar]
  15. Ma, J.Q.; Yue, Z. Effects of ecological compensation on water environment governance in the Yellow River Basin: A test based on difference-in-difference method. Resour. Sci. 2021, 43, 2277–2288. [Google Scholar] [CrossRef]
  16. Xu, S.B.; Wang, Y.D.; Geng, X.Y. Ecological compensation: Theoretical review and research prospect. For. Econ. 2022, 42, 14–26. [Google Scholar]
  17. Wang, Q.G. Empirical explanation of strong reciprocity model of government based on historical perspective. Mac. Econ. 2014, 11, 55–56. [Google Scholar]
  18. Zheng, Y.C. Research on the Responsibility Sharing and Synergy Effect of Multi-Subject in Watershed Eco-Compensation. Ph.D. Thesis, Shandong Agricultural University, Tai’an, China, 2019. [Google Scholar]
  19. Zheng, Q.Q.; Wan, L.; Wang, S.Y.; Wang, C.Y.; Fang, W.P. Does ecological compensation have a spillover effect on industrial structure upgrading? Evidence from China based on a multi-stage dynamic DID approach. J. Environ. Manag. 2021, 294, 112934. [Google Scholar] [CrossRef]
  20. Lu, W.X.; Wu, F.W. Can ecological compensation horizontal transfer payments narrow the income gap between urban and rural areas? —Empirical evidence based on ecological compensation in typical watershed of China from 2000 to 2019. Fin. Res. 2022, 7, 35–51. [Google Scholar]
  21. Na, R.; Zhang, H.L.; Wan, L.L. Non-linear impact of ecological compensation in typical watersheds on regional technological innovation: The threshold effect test based on the panel data of the Anhui section of the Xin’an River Basin. Sci. Tech. Manag. Res. 2021, 41, 225–230. [Google Scholar]
  22. Gao, G.K.; Guo, T.; Wu, S.C. A study on the relation of eco-compensation and the industrial structure optimization in the Yangtze river delta. Shanghai Econ. 2016, 6, 73–85+92. [Google Scholar]
  23. Zhang, Y.; Jiang, D.C. FDI, government regulation and the water-pollution in China: An empiricaltest based on the decomposition of industry structure and the technology progress. China Econ. Quart. 2014, 13, 491–514. [Google Scholar]
  24. Zhou, H.H.; Gu, G.F. Assessment on pollution reduction effects of sustainable development policy in Chinese resource—Based cities. Arid Land Resour. Environ. 2020, 34, 50–57. [Google Scholar]
  25. Xiong, K.; Huang, L.C.; Wang, B. Empirical analysis of implementation effect for ecological compensation policy in main river basins of Jiangxi Province based on difference-in-difference method. J. Nanchang Inst. Tech. 2022, 41, 85–91. [Google Scholar]
  26. Jing, S.W.; Zhang, J. Xin’anjiang river basin horizontal ecological compensation reduce the intensity of water pollution? China Popul. Resour. Environ. 2018, 28, 152–159. [Google Scholar]
  27. Ma, Q.H.; Du, P.F. Evaluation on the effect of ecological compensation in Xin’an River Basin. Chin. J. Environ. Manag. 2015, 7, 63–70. [Google Scholar]
  28. Dong, Y.M.; Zhu, M.Y. Can high-speed rail construction reshape the layout of China’s economic space—Based on the perspective of regional heterogeneity of employment, wage and economic growth. China. Ind. Econ. 2016, 10, 92–108. [Google Scholar]
  29. Wang, G.X.; Li, G. Effect of “Ecological Province” construction oncarbon emission reduction in China. Acta Geogr. Sin. 2020, 75, 2431–2442. [Google Scholar]
  30. Cheng, G.; Zhang, X.X. Has the “Belt and Road” initiative promoted RMB internationalization? An empirical test based on psm-did method. Mod. Fina. Econ. 2020, 40, 80–95. [Google Scholar]
  31. Huang, Z.P. Does the establishment of national poverty-stricken counties promote local economic development? An empirical analysis based on psm-did methods. China Rural Econ. 2018, 5, 98–111. [Google Scholar]
  32. Zhang, H.; Gu, D.; Wu, S.; Yu, W. Effect of emission reduction in the compensated areas under the policy of watershed eco-compensation: A case study of the Xin’an River Basin. Resour. Sci. 2022, 44, 768–779. [Google Scholar] [CrossRef]
Figure 1. The mechanism of water environment improvement by river basin ecological compensation.
Sustainability 14 13774 g001
Figure 2. Standard deviation of each variable before and after Propensity Score Matching (%).
Sustainability 14 13774 g002
Table 1. Variable description of the study on the influence of river basin ECP on water environment pollution.
TypeNameMeaning
Dependent variableWater pollution intensityThe ratio of total wastewater discharge to real GDP
Independent variableCross itemTime dummy variable multiplied by region dummy variable
Controlled variable, covariate, mediatorEconomic development levelRegional GDP per capita
Industrial structureThe added value of the tertiary industry divided by the real GDP of the region
Science and technology levelTotal science and technology expenditure at the end of the year
Controlled variable, covariateWastewater treatment capacityWastewater treatment rate
PopulationTotal population at the end of the year
Controlled variableXiaoqing RiverBinary dummy variable
Table 2. Descriptive statistics of main variables in the study of the river basin ECP’s influence on water environment pollution.
VariablesSample CapacityMean ValueStandard DeviationMinimum ValueMaximum Value
Water pollution intensity211−2.260.43−3.21−1.27
Economic development level21110.680.628.5412.09
Industrial structure2113.580.232.614.10
Science and technology level21110.131.386.1112.86
Wastewater treatment
capacity
2114.440.193.614.61
Population2116.190.584.827.06
Xiaoqing River Basin2110.180.390.001.00
Table 3. Propensity Score Matching stationarity test.
VariablesMatchMeanSD (%)SD
Reduction (%)
Double t Test
Treatment GroupControl GroupT Valuep > |t|
Economic development levelBefore10.7110.685.2084.100.260.80
After10.7110.71−0.80−0.030.98
Industrial structureBefore3.663.5742.9093.801.810.07
After3.663.652.700.110.91
Science and technology levelBefore10.2910.1112.8097.600.610.54
After10.2910.280.300.010.99
Wastewater treatment capacityBefore4.484.4323.4097.301.090.28
After4.484.48−0.60−0.030.98
PopulationBefore6.266.1812.0076.700.650.52
After6.266.242.800.100.92
Table 4. Average impact analysis of river basin ECP under different models.
VariablesModel 1Model 2Model 3Model 4
DID−0.20 ***
(0.05)
−0.21 **
(0.06)
−0.25 **
(0.09)
−0.22 *
(0.09)
Economic development level −0.01
(0.05)
−0.11
(0.32)
Industrial structure 1.23 ***
(0.20)
0.32
(0.25)
Science and technology level −0.11 ***
(0.02)
−0.12
(0.06)
Wastewater treatment capacity 0.60 *
(0.29)
0.56
(0.27)
Population −0.01
(0.04)
−0.51
(2.76)
Xiaoqing River −0.02
(0.07)
0.03
(0.08)
Constant term−2.77 ***
(0.03)
−2.72 ***
(0.05)
−8.52 ***
(1.58)
−1.07
(15.02)
Time effect Yes Yes
Individual effect Yes Yes
n196196196196
Note: Within the brackets are the robust standard errors of the estimated coefficients of the variables; *, ** and *** indicate that the parameter estimates are significant at the levels of 10%, 5% and 1%, respectively. The following are the same.
Table 5. Dynamic marginal effect analysis of river basin ECP under different models.
VariablesModel 5Model 6VariablesModel 5Model 6
Yeart2008−0.03
(0.03)
−0.00
(0.09)
Yeart2013−0.08
(0.04)
−0.29 **
(0.08)
Yeart2009−0.04
(0.04)
−0.04
(0.10)
Yeart2014−0.11 **
(0.03)
−0.42 ***
(0.06)
Yeart2010−0.03
(0.02)
−0.14 *
(0.05)
Yeart2015−0.13 *
(0.04)
−0.48 ***
(0.09)
Yeart2011−0.07 *
(0.04)
−0.25 **
(0.06)
Yeart2016−0.15 **
(0.04)
−0.54 ***
(0.08)
Yeart2012−0.07 *
(0.04)
−0.26 **
(0.07)
Yeart2017−0.16 *
(0.06)
−0.59 **
(0.14)
Controlled variablesNoYesControlled variablesNoYes
Individual
effect
YesYesIndividual
effect
YesYes
n196196n196196
Note: Within the brackets are the robust standard errors of the estimated coefficients of the variables; *, ** and *** indicate that the parameter estimates are significant at the levels of 10%, 5% and 1%, respectively. The following are the same.
Table 6. Robustness test for counterfactual parallel trends.
VariablesModel 7Model 8
Treatedi,t × Time2006−0.38
(0.32)
Treatedi,t × Time2007 −0.16
(0.20)
Constant term0.21
(14.44)
0.96
(15.01)
Controlled variablesYesYes
Individual effectYesYes
Time effectYesYes
n196196
Table 7. Influence mechanism analysis of river basin ECP under different models.
VariablesModel 9Model 10Model 11
DID0.13
(0.13)
0.02 *
(0.01)
−0.24
(0.17)
Constant term7.87
(14.46)
2.10 ***
(0.34)
−13.27
(18.28)
Controlled variablesYesYesYes
Individual effectYesYesYes
Time effectYesYesYes
n196196196
Note: Within the brackets are the robust standard errors of the estimated coefficients of the variables; * and *** indicate that the parameter estimates are significant at the levels of 10% and 1%, respectively. The following are the same.
Publisher’s Note: MDPI stays neutral with regard to jurisdictional claims in published maps and institutional affiliations.

