Abstract
Subsidence deformation of abandoned goafs can induce cracking, distortion and even collapse of surface buildings (structures), and thus, subsidence deformation poses a great threat. Accurate detection of the abandoned goaf location and overburden morphology is an important prerequisite for stability evaluation and scientific management of surface buildings (structures), and effective detection methods are bottlenecks for accurate detection. Taking the abandoned goaf in the Tengzhou section of China’s Mu Shi expressway as an engineering example, step-by-step detection, traditional detection and combination methods are used to determine the location of the underlying abandoned goaf and overburden morphology. First, we conduct disaster investigation on the expressway and surface within the affected area of the abandoned goaf and initially determine the detection area. Then, according to the principle that the detection range can be examined step-by-step from large to small, the high-density resistivity method is used for detection, and the high-resolution seismic method is further selected to analyze the target area. Then, based on the results of the resistivity method, the position of the abandoned goaf is evaluated with the high-resolution seismic method, and the distributions of the overburden subsidence, the water-filled fractured zone and the caving zone (the three belts) are determined. Finally, boreholes are drilled deep into the bottom of the abandoned goaf at specific locations and the distributions of the abandoned goaf and three belts are verified and corrected with drilling data, acoustic detection and borehole TV imaging technology, thereby providing accurate data on abandoned goafs for highway stability evaluation.
1. Introduction
After the mining of underground mineral resources, a large number of goafs will be left behind. These abandoned goafs can become deformed and degraded under the influence of internal and external factors, which will cause cracks, distortion and even collapse of surface structures [1,2,3]. With the development of China’s economy, there are more roads, railways and large buildings, and the available land resources tend to be scarce. It is difficult to avoid construction work at sites with an underlying abandoned goaf [4]. To realize the construction of buildings (structures) at the site of an abandoned goaf, it is necessary to accurately evaluate and dispose of the abandoned goaf. There are already many successful cases [5,6,7]. However, the implementation of these successful cases must be based on accurately grasping the location of the abandoned goaf and overburden morphology [8,9,10]. Most abandoned goafs are often characterized by an advanced age and a lack of mining data. However, abandoned goafs are still subject to illegal prospecting and random mining [11,12]. It is difficult to meet the stability evaluation requirements of the building (structure) foundation by acquiring detailed information about the abandoned gob area only based on mining information collected by several parties [13,14]. The use of reasonable and efficient detection methods to achieve accurate detection of the abandoned goaf location and overburden morphology is particularly important.
At present, the detection methods for abandoned goafs mainly include electrical detection, electromagnetic induction detection, seismic detection and radioactive detection. The electrical detection and electromagnetic induction methods acquire electric distribution characteristics of the underground rock and soil by an electric field or magnetic field to determine the problem area and have the characteristics of low cost and high efficiency [3,12]. Seismic exploration mainly analyses the elastic wave transfer laws of the rock and soil to examine the characteristics of the underground rock and soil and has a high detection precision. Seismic exploration is commonly used in the determination of the goaf, especially the determination of the three belts [15,16,17]. Radioactive detection technology has high sensitivity and high precision and is more frequently applied to radioactive mining areas. Geophysical exploration methods have certain flaws. For example, the electrical detection and electromagnetic induction methods are more susceptible to external electromagnetic fields, and seismic exploration is less accurate at large depths [18]. Therefore, to improve the detection accuracy of abandoned goaf information, a variety of methods are often used for comprehensive detection to eliminate multiple solutions and overcome the limitations of various geophysical methods as much as possible, while large-area deep drilling is adopted in the verification stage. The use of multiple geophysical exploration methods can achieve the purpose of complementary geophysical techniques, but the approach also greatly increases the cost of geophysical exploration [19]. Even in this case, it is difficult to provide true verification data, and only densely spaced drilling verification with depth provides true verification data. When intense verification drilling is conducted, the process can also destroy the stable structure of the abandoned goaf, which can easily cause the abandoned goaf to become reactivated and induce secondary disasters. It is necessary to use a combination of fewer but reasonable geophysical techniques according to the situation of the abandoned goafs and supplementary effective verification methods to comprehensively determine the exact location and state of abandoned goafs.
At present, the detection of abandoned goafs mainly relies on combining as many geophysical methods as possible to improve the accuracy of the detection results, and more often, in-depth detection and superficial verification methods are implemented [20,21]. The objective of this paper is to take the Tengzhou Section of China’s Mushiexpressway as an engineering example without detailed knowledge of the mining materials, and the step-by-step detection method is used to determine the location and filling status of the abandoned goaf that affects the expressway area. At the same time, the locations of the three belts of the overburden in the abandoned goaf are determined, which provides a scientific basis for stability evaluation of abandoned goafs and post-highway construction control.
2. Methodology
The highway with underlying abandoned goaf in the study area is located in the southeast direction of Tengzhou City, China. The terrain in this area is generally gentle, and there are local steep ridges. An expressway is a linear structure, and detection of the underlying abandoned goaf is mainly conducted along the direction of the expressway and the two sides of the adjacent roadbed [13]. Step-by-step detection is used to gradually reduce the detection target area, and a combination of several detection methods is used to determine the position of the abandoned goaf and the overburden state.
Preliminary detection areas are selected through investigation and analysis. In the absence of accurate mining data, relevant information is collected from abandoned mining areas by relevant departments, such as the Mining Bureau. At the same time, disaster investigation is carried out around the affected expressway. Specifically, disaster investigation includes examining the topography and landform characteristics, determining the distribution characteristics of surface cracks, and studying the spatial position relationship of the highway’s subsidence-induced distortion. Using the high-density resistivity method to achieve a high detection efficiency along the line length, a long measurement line is laid in the preliminary selected area for basic coverage. The long-line measurement results are interpreted, and the detection area is further reduced according to the high-resistance characteristics of the abandoned goaf; short-line detection is then carried out. The high-density resistivity method is used for the final interpretation results, thereby providing detection targets for high-resolution seismic methods. The use of high-resolution seismic methods that are based on the arrival time and axis distribution characteristics of different geotechnical bodies can effectively determine the position and shape of the abandoned goaf in the detection target area and the distribution range of the three belts. Verification holes are drilled into the goaf at the maximum subsidence in the target area, and the position and shape of the goaf are determined using the high-resolution seismic method and the distribution range of the three belts are verified and corrected through drilling core data, sound wave detection data and borehole TV imaging data; the location and status of the abandoned goaf are thus accurately determined. The process is shown in Figure 1.
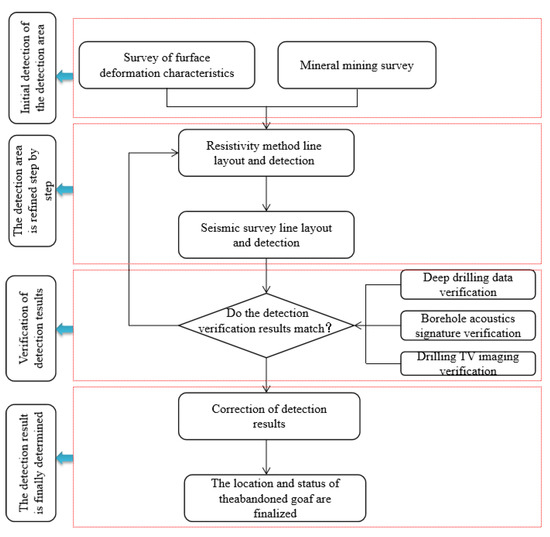
Figure 1.
Abandoned goaf detection verification process.
The distribution range of the three belts is further corrected, and the acoustic detection of the borehole is carried out. The data processing of the borehole wave velocity test is mainly to calculate the wave velocity of rock mass. The borehole wave velocity test adopts a double receiving probe, and the rock wave velocity between the two receiving probes is [22]:
In the above equation, refers to the spacing between the two receiving probes, t1 refers to the arrival time of the longitudinal wave at probe 1 and t2 refers to the arrival time of the longitudinal wave at probe 2.
3. Case Study
3.1. Regional Survey Analysis
- (1)
- Investigation and analysis of surface disaster characteristics
The expressway with the underlying abandoned goaf is located in the southeast of Tengzhou, China. The terrain in this area is generally flat with scarps. Under the abandoned goaf, the mileage range of the expressway distortion is K3+480~K4+280, the guardrail is very distorted, and the subgrade and pavement sinking deformation are very large. Since 1990, the maximum vertical displacement of the subgrade midline has been lower than the original design elevation of 1.5 m. As indicated by surface disaster survey data, the main types of disasters on both sides of the highway above the abandoned goaf are surface subsidence deformation, collapse pits and ground cracks. The location of the route space and the disaster characteristics are shown in Figure 2.
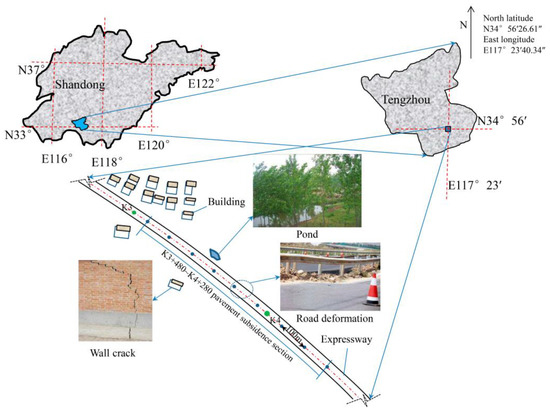
Figure 2.
Highway and surface disaster location relationship.
Surface subsidence deformation and collapse pit investigation: In Figure 2, on the north side of the expressway, an elliptical pond has been formed due to surface subsidence. The short axis of the pond is 10.5 m long, and the long axis is 38.9 m long. The direction of the long axis is basically parallel to the direction of the expressway. The position of the pond is close to the maximum deformation position of highway subsidence, and the edge of the pond exhibits different degrees of tensile cracks. On the two sides of the highway K3+480~K4+280, there are a number of small collapse pits, and the edge of the pit near K3+760 also has circular cracks with different widths. At present, most of the subsidence areas are still likely to be active, thereby forming new concave areas.
Residential deformation survey: In Figure 2, a private residence is located at K3+780 on the south side of the expressway, and the cross-range of the highway subgrade is approximately 30 m. A residential housing survey revealed that the wall has a crack of approximately 2 cm. Upon inquiry to the residents of the household, it was learned that the wall had gradually cracked and the crack had continuously expanded since 1997; in addition, crack growth was the fastest after 2000. The residents were evacuated for safety reasons. The cracks continued to expand from 2000 to 2006 and have basically stabilized since 2006. Other walls have cracks of varying degrees.
Highway crack investigation: Since the highway pavement was repaired several times at irregular intervals, no distinct cracks were observed on the expressway surface, and only twist deformation was observed. There are clear cracks on the side of the highway subgrade. The cracks are narrow in the upper part and wider in the lower part, and some intersect the circular cracks that have developed on the ground. The most cracks are observed near K3+754.
- (2)
- Investigation and analysis of regional coal mining
Coal mining-related materials were collected at the Municipal Mining Bureau and the Municipal Highway Bureau. The coal mine is located in Tengzhou city, Shandong Province. The coal mine is equipped with a pair of main and auxiliary inclined shafts near the outcrop of the No. 3 coal seam. The location corresponds to K3+760 on the north side of the expressway, and the cross-range of the subgrade is approximately 50 m. The No. 3 coal seam is inclined to the east and southeast, and the mining direction is basically the same as that of the expressway. The mining thickness of the coal seam is 1.3~13.0 m, and the thickness of most mining areas is between approximately 2 and 8 m. The length of the coal seam projection is approximately 1000 m, which tends to the southeast, and the inclination angle is 22°, while the local inclination angle is 23°~26°. The No. 3 coal seam is mainly mined via longwall mining, and the roof is mined via direct mining. In 1984, mining in the area was stopped. From 1985 to the end of 2005, the coal mine still used residual and wear-through mining and direct roof mining of the No. 3 coal seam. The mining location and the cross-range of the expressway are 240~360 m. The mining range is relatively far from the expressway. The mining depth is 130~176 m, the average mining thickness is 2~8 m and the dip angle is 23°~26°.
The coal mines in the area are old and operated by private companies and corporations. The mined areas have limited information, and there are no mining drawings. It is impossible to determine the detailed mining conditions. The roof of the stratum and coal seam in this area is broken, the strength is low, and the burial depth of the coal seam roadway is shallow. Temporarily supported roadways and goafs collapse due to the roof rock mass, which will inevitably lead to the development of geological disasters on the surface [3], such as the collapse of the two sides of the highway, deformation of the expressway and destruction of the surrounding houses.
According to the shallow drilling data collected in the previous period, quaternary sediments are the main cover within 10 m of the stratum in the affected area of highway subsidence; in the depth range of 10~30 m, the sediments are mainly composed of fully weathered to strongly weathered sandstone and shale interbeds. Among these strata, the developed coal seam is visible at a depth of 25 m at K3+684, and the weak and slightly weathered rock mass occurs below 30 m; there are no detailed drilling data on the deeper layers.
3.2. Detection and Analysis via the High-Density Resistivity Method
Detection with the DUK-2A high-density resistivity method. The method has the characteristics of a simple measurement and layout, automatic data collection and result graph generation, high efficiency, etc. [12]. A total of 60 electrodes were used for data acquisition, and a Winner device was used. The maximum isolation factor was 16 and the distance between the electrodes was 10 m. The specific layout scheme is shown in Figure 3. The measuring electrode distance is 5 m, and the specific arrangement is shown in Figure 3. Under normal circumstances, the goaf abnormal resistance is divided into two cases. If the goaf is not filled with any collapsed rock or groundwater, the goaf will appear as an anomalous high-resistance area; if part of the goaf is filled with collapsed rock or groundwater, with some of voids remaining, the goaf will exhibit high-resistance anomalies in certain parts. When the goaf is completely filled with collapsed rock or groundwater, the goaf will contain conductive ions such as Ca2+ and Mg2+, making the filled area appear as a low-resistance anomaly. Considering the distribution characteristics of surface disasters and to acquire mining data on the abandoned goaf in the early stage, survey lines 1 and 2 are laid out. Survey line 1 is arranged at the foot of the roadbed slope on the north side of the expressway (section K3+480~K3+960), and survey line 2 is arranged at the foot of the slope on the south side of the highway subgrade (section K3+470~K3+950). Based on the interpreted results of lines 1 and 2, survey line 3 is arranged 30 m away on the north side of survey line 1 and parallel with survey line 1 (section K3+750~K3+905).
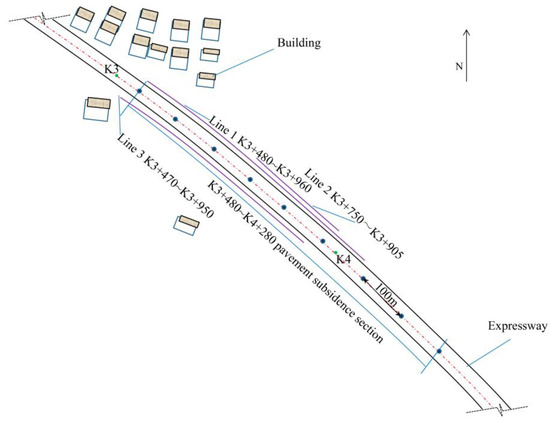
Figure 3.
Electrical method line layout diagram.
In survey line 1, for the K3+480~K3+960 segment, reciprocating measurements are taken. As electrical profiling reflects that the test depth is shallow, the results of the measured profile extracted using the two-section double-pole device are shown in Figure 4. From top to bottom, the actual acquisition apparent resistivity profile, the calculated apparent resistivity profile, the interpreted profile and the follow-up line measurement profile are similar. The interpreted profile shows that the apparent resistivity of the rock and soil within a depth of 15 m is less than 10 Ωm. This layer is mainly a quaternary cover layer, which is low in resistivity due to atmospheric precipitation. The burial depth is between 15 and 50 m, and the apparent resistivity is between 10 and 600 Ωm. This layer is mainly composed of sandstone and shale with different degrees of weathering. The K3+640~K3+760 and K3+820~K3+900 segments exhibit an anomalous high-resistivity area at a depth of 50 m, and the apparent resistivity is between 700 and 7000 Ωm. According to the preliminary drilling data, the layers are mostly siltstone and sandstone. Generally, the resistivity of sedimentary rocks is within 1000 Ωm, and it is preliminarily concluded that there are well-developed fractures in the rock mass below 50 m. When the detection depth is increased to 88 m, the high-resistance anomalous area does not form a closed area, and the distribution characteristics of the exposed goaf are not distinct. It is inferred that the abandoned goafin in this section is likely to be filled by collapsed rock.
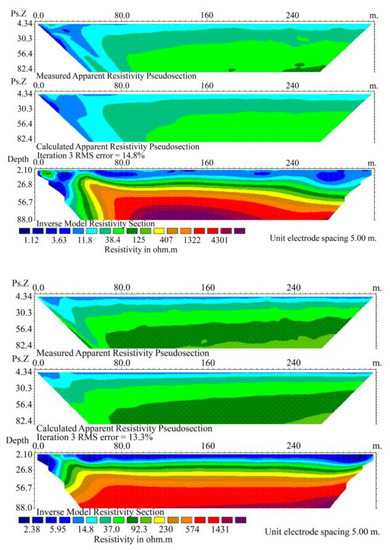
Figure 4.
Resistivity profiles of the K3+480~K3+800 and K3+640~K3+960 section diodes in line 1.
In survey line 2, for the reciprocating measurement in the K3+630~K3+790 section, the measurement direction is from large to small pile numbers, and the detection results are shown in Figure 5 and Figure 6. From the detection results, it can be seen that the high-resistance characteristics of the goafs in the K3+650~K3+780 and K3+795~K3+820 sections of line 2 are distinct. Since the electrical profile reflects a shallow depth, the data of the measured cross-section of the double-pole device are extracted to clarify the electrical anomalous reaction in the goaf. The area below a depth of 60 m is also characterized by high-resistance goaf characteristics, and the exploration depth is increased to 80 m. There is no distinct anomalous area in the goaf distribution, indicating that the deep goaf is filled with collapsed rock.
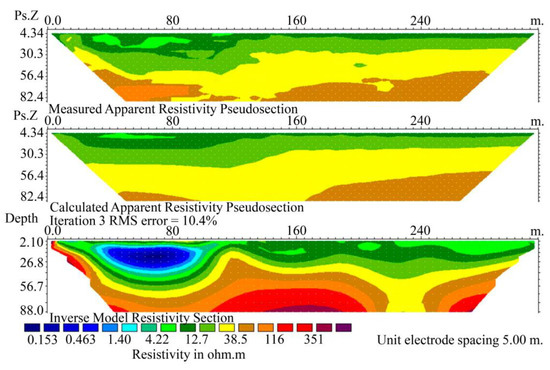
Figure 5.
Line 2 K3+790-K3+470 section detection results.
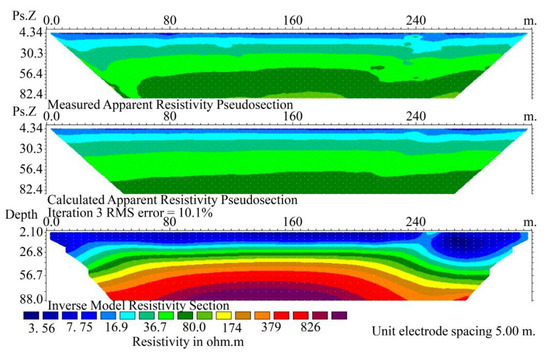
Figure 6.
Line 3 K3+950~K3+630 section detection results.
Survey line 3 is arranged in section K3+750~K3+905, the most severely distorted section of the expressway, based on detection results of survey lines 1 and 2, and measurements are obtained from large to small pile numbers. As shown in Figure 7, the shallow depth is 40 m, and the internal resistivity is less than 50 Ωm. The survey line is located 30 m on the south side of the roadbed. Considering that there is a subsidence pond at this location, the water system is connected due to the development of bed cracks, and the apparent resistivity is significantly reduced. In the K3+865~K3+835 and K3+820~K3+795 sections, at a burial depth from 56~76 m, there is a semi-closed anomalous high-resistivity area, which is inferred to be the impact range of the goaf; the boundary top interface is indicated with dashed circles in the figure.
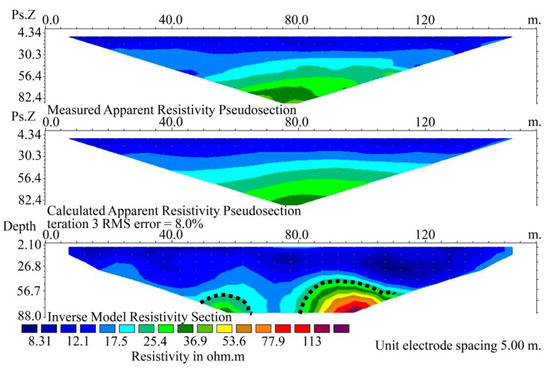
Figure 7.
Line 3 K3+905~K3+750 section detection results.
The approximate position of the goaf under the expressway is measured by the high-density resistivity method using line 1 and sections K3+640~K3+760 and K3+820~K3+900, line 2 and sections K3+650~K3+780 and K3+795~K3+820, and line 3 and section K3+865~K3+835. According to the thickness, depth, dip angle of the goaf and location of the abandoned goaf, the extent of the influence of goaf subsidence on the surface can be inferred, and the general range of deformation of the expressway is K3+480~K4+280. It is preliminarily determined that most of the abandoned goaf is filled with collapsed rock. The burial depth is within 0~50 m, which is the range of the subsidence and water-filled fractured zones. The burial depth of 50~88 m is the impact range of the goaf. Due to the small difference in resistivity of the shallow geotechnical bodies, it is difficult to distinguish the areas of the subsidence and water-filled fractured zones. Considering the detection error and objective detection condition constraints, the high-resolution seismic method is used to comprehensively determine the target area of K3+470~K4+080 and further examine the position of the goaf and the distribution of the three belts.
3.3. High-Resolution Seismic Method Target Detection
The curved subsidence zone and the water-filled fractured zone of the abandoned goaf are difficult to clearly distinguish on the resistivity profile. Based on the high-density resistivity detection results, high-resolution seismic reflection wave characteristic analysis is carried out to further determine the three-belt distribution characteristics of the goaf [23]. Seismic lines are arranged in the determined detection target area K3+470~K4+080. The main acquisition parameters of the engineering seismograph are: the time window is 182 ms, the sampling points are 1820 and the sampling interval is 0.1 ms, with an offset of 8 m and a dot pitch of 1 m. The hammer is excited. The test results are shown in Figure 8 and Figure 9. Survey line 4 is arranged at the shoulder position on the north side (section K3+480~K4+080), and survey line 5 is arranged at the shoulder position on the south side (section K3+470~K4+070). Since interpretation analysis of lines 4 and 5 is conducted the same way, only line 4 is used as an example for the analysis.
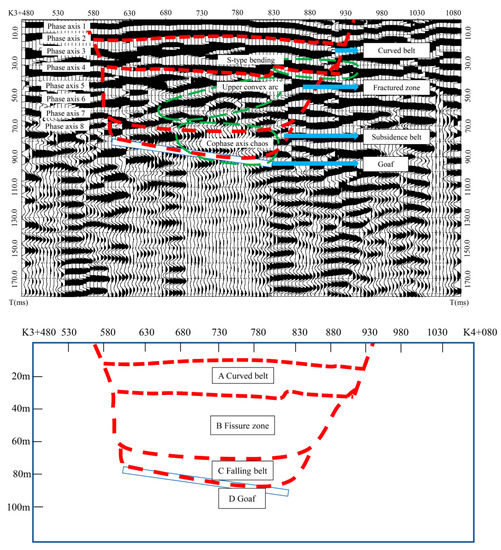
Figure 8.
Line 4 detection results.
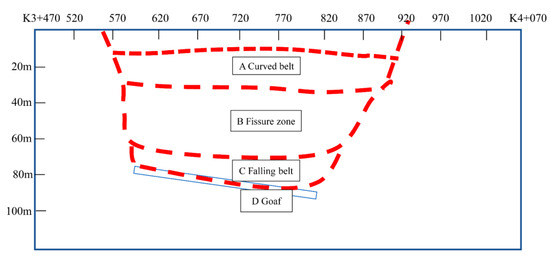
Figure 9.
Line 5 detection results.
Interpretation of the detection results: The reflected waves in the goaf have the following general behavior of the seismic image: for the same curve, fractures or discontinuities occur along the same phase axis, and the waveform of the reflection profile appears to be oscillating or periodically increasing. From the test results in Figure 8, the in-phase axis group is relatively continuous, the in-phase axis is clearly identifiable, and there are many features. The arrival times of the first, second and third in-phase axes are approximately 5 ms, 15 ms and 25 ms, respectively. The in-phase axis is continuous and has irregular bending. This phenomenon indicates that there are many sets of sedimentary layers in the quaternary overburden and weathered rock strata, and the reflection characteristics of the bedrock surface are very notable; the regional lithology is consistent, and the in-phase axis is continuous. It is inferred that this part is the curved subsidence zone affected by the goaf, and the seismic test results are consistent with the resistivity test results.
The wave arrival time of the fourth in-phase axis is approximately 35 ms, the phase is relatively continuous, and there is an S-bend between K3+830 and K+930. The arrival times of the 5th and 6th in-phase axes are 45 ms and 55 ms, respectively, and the in-phase axis is relatively continuous overall, but it is more disordered; an upper convex arc is present between K3+730 and K3+830. Goaf collapse has caused many cracks in the rock formation, and the fissure zone can attenuate the energy of the emitted wave, resulting in the emission wave’s in-phase axis disorder. It is inferred that this part is the water-filled fractured zone affected by the goaf.
The wave arrival times of the 7th and 8th in-phase axes are 65 ms and 75 ms, respectively, and an upper convex arc is also present between K3+630 and K3+730; in addition, the in-phase axis is very disordered. The depth of exploration continues to increase, the in-phase axis of the same phase is more disordered and difficult to identify, and there is in-phase axis loss between K3+680 and K3+800. This finding indicates that the site is affected by mining activities, resulting in a large number of gravel collapses and cavities. The broken rock mass and the unfilled cavity form a strong reflection interface and a region in which the reflected wave energy is rapidly depleted. The multiple interface reflections and dissipation of reflected wave energy lead to chaotic observations and loss of in-phase axis. It is inferred that this part is the goaf zone. This finding is consistent with the actual mining data.
According to the characteristics of the seismic reflection waves and the results of the above electrical method, combined with the general position correspondence of the three belts, a comprehensive analysis is carried out to determine the location of the abandoned goaf and the specific limits of the three belts. The range of the abandoned goafs that have a significant impact on the expressway is as follows: along the expressway, with regards to the K3+580~K3+830 section on the north side and the K3+580~K3+900 section on the south side, the lateral distance of the north-south sides along the expressway axis is within 30 m. Among these sections, the burial depth is approximately 35 m, which is a subsidence and deformation zone. The burial depth is between 35 and 75 m, which is the water-filled fractured zone. The subsidence zone is between 75 and 90 m, and the unfilled cavity of the goaf is approximately 2~8 m.
3.4. Probe Verification
To further verify the accuracy of detection, the deformation of the expressway and the detection results are comprehensively considered, and the K3+580~K3+830 section is selected, which covers the anomalous high-resistivity area; the resistivity method and the seismic method are used to examine the missing in-phase axis area via deep drilling. As shown in Figure 10, the No. 1, No.2 and No.3 holes are characteristic boreholes with a drilling distance of 40 m, and the boreholes are drilled deep into the goaf. To avoid verification results that are not representative and based on the characteristic drilling data of the three boreholes, the No.2 borehole sound wave detection and TV imaging data are used for verification.
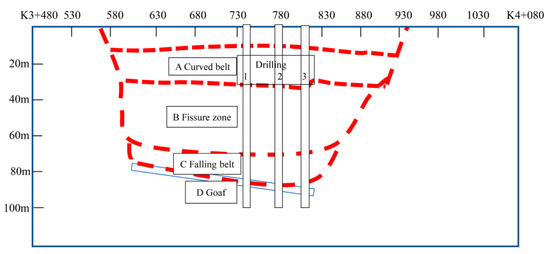
Figure 10.
Drilling position map.
- (1)
- Drilling and sound wave detection verification
Drilling data are shown in Table 1. The relative drilling position to seismic line 4 is shown in Figure 10. According to the drilling data, the depth of the borehole is basically the same, indicating that the cavity formed by caving is not excessively inclined. The hole height detected by the drill pipe is different, indicating that the goaf is in a filled or semi-filled state with no clear regularity. According to the drilling data and related experiments, the 30 m depth is mainly composed of quaternary sediments and strongly weathered mudstones and sandstones. Its saturated uniaxial compressive strength is less than 0.26 MPa and the softening coefficient is less than 0.17, indicating a significant water-weakening effect and a certain degree of expansion and relative water repellency; the depth between 30 and 80 m mainly consists of weak weathered siltstone and sandstone, and below 78 m, the drilling phenomenon appears. The thickness of the drill pipe is approximately 3~5 m, and the goaf is filled with groundwater due to the existence of a large number of connected fissures. The semi-filled goaf is currently in equilibrium, and the drilling quality is basically consistent with the position of the three belts determined from the geophysical results. According to the drilling data, it is observed that the range of the fractured and caving zones is slightly larger compared to the geophysical exploration results, which may be caused by different degrees of disturbance to the rock sample in drilling sampling.

Table 1.
Drilling data.
The distribution range of three belts is further corrected, and the acoustic detection of boreholes is carried out. The data processing of the borehole wave velocity test is based on Equation (1), discussed in the Methodology section. The No.2 borehole is selected as the test hole to perform acoustic wave detection and then the acoustic wave test data are processed to plot the acoustic wave test curve, as shown in Figure 11. The rock mass velocity at a depth of 50 m in the borehole is basically between 1800 and 3500 ms−1, which is a normal value range. This section is mainly composed of quaternary sedimentary cover and strongly weathered mudstone and sandstone. The abovementioned detection results show that this area mainly belongs to the curved subsidence zone in the three belts of the goaf. The rock mass velocity below the 50 m depth drops sharply to between 1200 and 3000 ms−1, which is mainly composed of broken, weak weathered siltstone and sandstone. However, the wave velocity of generally weakly weathered siltstone should be above 4000 ms−1, indicating that a large number of fissures and unfilled voids are present in the rock mass of this section, which is consistent with the characteristics of the caving zone. The characteristics of the No. 2 hole wave velocity along with the depth are basically consistent with the distribution characteristics of the overlying strata in the goaf detected by the high-resolution seismic method.
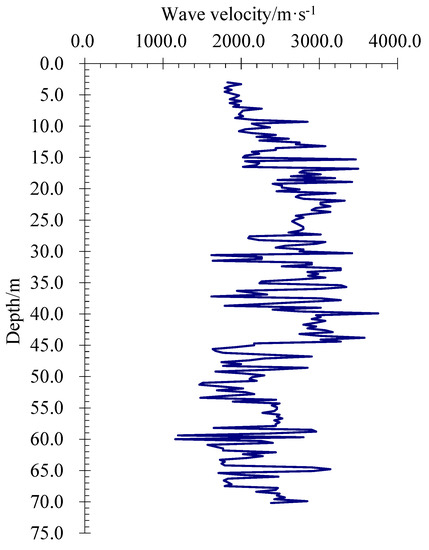
Figure 11.
Acoustic wave detection curve [24].
- (2)
- Borehole TV imaging technology verification
The borehole TV imaging method is more intuitive [25]. The No. 2 drilling feature position image is analyzed and the feature boundary image is captured, as shown in Figure 12. Figure 12a shows that when the probe enters the hole at 30.5 m, the rock wall of the hole is notably rough and uneven, and the weathering is severe. The probe penetrates to 46.5 m, as shown in Figure 12b, and although the wall of the hole is smooth, cracks in the rock are clearly visible. The probe gradually descends, and the wall of the cracked hole is observed; the borehole wall is uneven. Figure 12c shows a separation void formed by rock mass collapse at 68 m, indicating that groundwater has reached the goaf and that the groundwater is visible. The pores of the fracture zone are developed, and the pores are filled with groundwater. As shown in Figure 12d, the drilling probe penetrated into the groundwater-filled area. The water is turbid due to disturbance, and it is difficult to see the surrounding environment despite the intense lighting. After approximately 1 h at a stationary position, the probe continues to descend, and it is observed that there is no round hole shape, which is accompanied by a clearly visible boundary line. It is determined that the boundary line should be the boundary between the roof and the two gangues of the goaf, as shown in Figure 12e. Based on the other observed probe angles, it is found that there are many roadway collapse zones filled with gravel and goaf filled with groundwater, and the field of view is not very clear, as shown in Figure 12f. At a depth of 85.0 m, the descent cannot be continued because the bottom has been reached. The drilling details in the goaf are clearly recorded by borehole TV imaging technology. The verification results show that the range of rock formation changes is consistent with the geophysical results; although goaf collapse is severe, and the goaf is in a semi-filled state and filled with groundwater, it still has distinct roadway features.
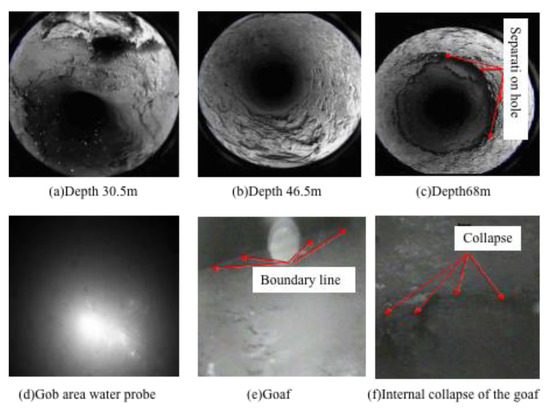
Figure 12.
No. 2 borehole TV images [24].
3.5. Verification and Correction Analysis
It has been verified by the deep drilling, sound wave detection and TV imaging data of the feature location that the goaf is full of groundwater, and most of the voids are filled by the collapsed rock mass; in addition, locally there are still clear roadway features. The abandoned goafs can become deformed and degraded under the influence of internal and external factors, which will cause cracks, distortion and even collapse of surface structures. Especially, the water and rock mechanical properties will influence the stability of abandoned goafs. The abandoned goaf has remained stable for a long time, but disturbance will likely lead to secondary activation of the abandoned goaf, especially due to digging, which suddenly releases the groundwater in the goaf of surface expressways, causing catastrophic hazards [26,27,28]. The proven results of the resistivity and seismic methods are more accurate. Since the abandoned goaf has an irregular shape, and the error distribution is used to further correct the heights of the fracture zone, the caving zone and the goaf. The average size determined via verification technology is considered the average value, and then the average value of the geophysical results is calculated. Finally, the range of the goaf is distributed within 30 m on the north side of the expressway axis, namely, the K3+580~K3+830 section, and the south side is mainly the K3+580~K3+900 section. The curved subsidence zone has a depth of approximately 35 m, the water-filled fractured zone has a burial depth of 35~75 m, the subsidence zone is between 75 and 90 m, and the average height of the abandoned goaf is approximately 4.5 m.
4. Conclusions
Taking the abandoned goaf in the Tengzhou section of China’s Mu Shi expressway as an engineering example, step-by-step detection, traditional detection and combination methods are used to determine the location of the underlying abandoned goaf and overburden morphology. The following conclusions were reached:
- (1)
- In the absence of detailed mining data on abandoned goafs, step-by-step detection, traditional detection and combination probing methods should be applied. The target area is gradually reduced and determined, which improves the location of the abandoned goaf and the efficiency of overburden morphology detection; mitigating the lack of effective joint detection with necessary verification techniques is scientific and reasonable for determining the location and status of abandoned goafs.
- (2)
- Traditional re-detection and superficial verification methods are improved. It is proposed to verify and correct the joint geophysical findings by using sound wave detection, TV imaging technology and deep drilling data. The approach also intuitively shows the structural characteristics of the three belts in the goaf and the filling characteristics of the goaf, thereby effectively avoiding multiple detection solutions of the abandoned goaf.
- (3)
- Because the abandoned goaf has an irregular shape, the error distribution is used to correct the heights of the fracture zone, the caving zone and the goaf, which provides a basis for the subsequent evaluation of the abandoned goaf stability and the expressway subgrade.
- (4)
- The detection results show that the K3+580~K3+900 section is within 30 m on both sides of the central axis of the expressway, and the goaf is widely distributed in the depth range of 75~90 m. The depths of the three belts are determined: the curved subsidence zone has a depth of approximately 35 m, the water-filled fractured zone has a burial depth of 35~75 m, the caving zone is between 75 and 90 m, and the average height of the abandoned goaf is approximately 4.5 m. Taking the abandoned goaf in the Tengzhou section of China’s Mushi expressway as an engineering example, the location and filling state of the abandoned goaf affecting the expressway area are determined, and the location of the overburden in the abandoned goaf is determined, which provides a scientific basis for stability evaluation of abandoned goafs and post-highway construction control.
Author Contributions
Conceptualization, S.Z.; methodology, P.J.; software, S.W.; validation, H.W.; formal analysis, S.W.; investigation, H.W. data curation, L.L.; writing—original draft preparation, L.L.; writing—review and editing, S.Z.; funding acquisition, S.Z. All authors have read and agreed to the published version of the manuscript.
Funding
This research received no external funding.
Informed Consent Statement
Not applicable.
Data Availability Statement
Not report any data.
Acknowledgments
Thanks to the China Zaozhuang City Highway Bureau for providing engineering geological conditions and seismic image data.
Conflicts of Interest
The authors declare no conflict of interest.
References
- Wang, S.; Su, Y.; Wang, C. Analysis of stress and strain of surrounding rock in goaf based on GIS. Arab. J. Geosci. 2021, 14, 1843. [Google Scholar] [CrossRef]
- Tan, Y.L.; Zhao, T.B.; Xiao, Y.X. Researches on floor stratum fracturing induced by antiprocedure mining underneath close-distance goaf. J. Min. Sci. 2010, 46, 3. [Google Scholar] [CrossRef]
- Ma, H.; Wang, J.; Wang, Y. Study on mechanics and domino effect of large-scale goaf cave-in. Saf. Sci. 2012, 50, 689–694. [Google Scholar] [CrossRef]
- Xu, P.; Mao, X.; Zhang, M.; Zhou, Y.; Yu, B. Safety analysis of building foundations over old goaf under additional stress from building load and seismic actions. Int. J. Min. Sci. Technol. 2014, 24, 713–718. [Google Scholar] [CrossRef]
- Díaz-Fernández, M.E.; Álvarez-Fernández, M.I.; Álvarez-Vigil, A.E. Computation of influence functions for automatic mining subsidence prediction. Comput. Geosci. 2010, 14, 83–103. [Google Scholar] [CrossRef]
- Du, M.; Wang, X.; Zhu, J. Analysis on Stability of Edge Roadbed in Large Mined-Out Regions Where the High-Speed Railway Pass. Geotech. Geol. Eng. 2021, 39, 1849–1860. [Google Scholar] [CrossRef]
- Wang, L.; Li, N.; Zhang, X.-N.; Wei, T.; Chen, Y.-F.; Zha, J.-F. Full parameters inversion model for mining subsidence prediction using simulated annealing based on single line of sight D-InSAR. Environ. Earth Sci. 2018, 77, 161. [Google Scholar] [CrossRef]
- Li, L.; Wu, K.; Zhou, D.-W. Evaluation theory and application of foundation stability of new buildings over an old goaf using longwall mining technology. Environ. Earth Sci. 2016, 75, 763. [Google Scholar] [CrossRef]
- Wang, C.; Lu, Y.; Qin, C.; Li, Y.; Sun, Q.; Wang, D. Ground disturbance of different building locations in old goaf area: A case study in China. Geotech. Geol. Eng. 2019, 37, 4311–4325. [Google Scholar] [CrossRef]
- Mccay, A.T.; Valyrakis, M.; Younger, P.L. A meta-analysis of coal mining induced subsidence data and implications for their use in the carbon industry. Int. J. Coal Geol. 2018, 192, 91–101. [Google Scholar] [CrossRef]
- Krishnamurthy, N.; Rao, V.A.; Kumar, D.; Singh, K.K.K.; Ahmed, S. Electrical resistivity imaging technique to delineate coal seam barrier thickness and demarcate water filled voids. J. Geol. Soc. India 2009, 73, 639–650. [Google Scholar] [CrossRef]
- Das, P.; Pal, S.; Mohanty, P.R.; Priyam, P.; Bharti, A.K.; Kumar, R. Abandoned mine galleries detection using electrical resistivity tomography method over Jharia coal field, India. J. Geol. Soc. India 2017, 90, 169–174. [Google Scholar] [CrossRef]
- Helm, P.; Davie, C.; Glendinning, S. Numerical modelling of shallow abandoned mine working subsidence affecting transport infrastructure. Eng. Geol. 2013, 154, 6–19. [Google Scholar] [CrossRef]
- Du, Z.; Ge, L.; Ng, A.H.-M.; Li, X. Investigation on mining subsidence over Appin–West Cliff Colliery using time-series SAR interferometry. Int. J. Remote Sens. 2018, 39, 1528–1547. [Google Scholar] [CrossRef]
- Nie, L.; Zhang, M.; Jian, H. Analysis of surface subsidence mechanism and regularity under the influence of seism and fault. Nat. Hazards 2013, 66, 773–780. [Google Scholar] [CrossRef]
- Yan, W.; Chen, J.; Tan, Y.; Zhang, W.; Cai, L. Theoretical Analysis of Mining Induced Overburden Subsidence Boundary with the Horizontal Coal Seam Mining. Adv. Civ. Eng. 2021, 2021, 6657738. [Google Scholar] [CrossRef]
- Zhou, B.; Hatherly, P.; Sun, W. Enhancing the detection of small coal structures by seismic diffraction imaging. Int. J. Coal Geol. 2017, 178, 1–12. [Google Scholar] [CrossRef]
- Gan, F.; Han, K.; Lan, F.; Chen, Y.; Zhang, W. Multi-geophysical approaches to detect karst channels underground—A case study in Mengzi of Yunnan Province, China. J. Appl. Geophys. 2017, 136, 91–98. [Google Scholar] [CrossRef]
- García-Yeguas, A.; Ledo, J.; Piña-Varas, P.; Prudencio, J.; Queralt, P.; Marcuello, A.; Ibañez, J.M.; Benjumea, B.; Sánchez-Alzola, A.; Pérez, N. A 3D joint interpretation of magnetotelluric and seismic tomographic models: The case of the volcanic island of Tenerife. Comput. Geosci. 2017, 109, 95–105. [Google Scholar] [CrossRef]
- Yu, G.; Li, H.; Zhang, D. Simulation Study on Electromagnetic Response Characteristics of Unfavorable Geological Body Under Complex Conditions. Geotech. Geol. Eng. 2021, 39, 3371–3382. [Google Scholar] [CrossRef]
- Nogueira, P.V.; Rocha, M.P.; Borges, W.R.; Silva, A.M.; Assis, L.M.D. Study of iron deposit using seismic refraction and resistivity in Carajas Mineral Province, Brazil. J. Appl. Geophys. 2016, 133, 116–122. [Google Scholar] [CrossRef]
- Lei, T.; Sinha, B.K.; Sanders, M. Estimation of horizontal stress magnitudes and stress coefficients of velocities using borehole sonic data. Geophysics 2012, 77, WA181–WA196. [Google Scholar] [CrossRef]
- Arosio, D.; Longoni, L.; Papini, M.; Zanzi, L. Seismic characterization of an abandoned mine site. Acta Geophys. 2013, 61, 611–623. [Google Scholar] [CrossRef]
- Zhang, S.; Zhang, X.; Li, Y. Old goaf detection and verification techniques under highway. J. Cent. South Univ. (Sci. Technol.) 2015, 46, 3361–3367. [Google Scholar]
- Chatterjee, R.; Gupta, S.D.; Mandal, P.P. Fracture and stress orientation from borehole image logs: A case study from Cambay basin, India. J. Geol. Soc. India 2017, 89, 573–580. [Google Scholar] [CrossRef]
- Liu, J.; Zhao, Y.; Tan, T.; Zhang, L.; Zhu, S.; Xu, F. Evolution and modeling of mine water inflow and hazards characteristics in southern coalfields of China: A case of Meitanba mine. Int. J. Min. Sci. Technol. 2022, 32, 513–524. [Google Scholar] [CrossRef]
- Liu, Q.; Zhao, Y.; Tang, L.; Liao, J.; Wang, X.; Tan, T.; Chang, L.; Luo, S.; Wang, M. Mechanical characteristics of single cracked limestone in compression-shear fracture under hydro-mechanical coupling. Theor. Appl. Fract. Mech. 2022, 119, 103371. [Google Scholar] [CrossRef]
- Zhao, Y.; Zhang, L.; Wang, W.; Wan, W.; Ma, W. Separation of elastoviscoplastic strains of rock and a nonlinear creep model. Int. J. Geomech. 2017, 18, 04017129. [Google Scholar] [CrossRef]
Publisher’s Note: MDPI stays neutral with regard to jurisdictional claims in published maps and institutional affiliations. |
© 2022 by the authors. Licensee MDPI, Basel, Switzerland. This article is an open access article distributed under the terms and conditions of the Creative Commons Attribution (CC BY) license (https://creativecommons.org/licenses/by/4.0/).