Abstract
Analyzing the efficiency of the water, energy, and food (WEF) nexus is critical for effective governance strategies. Therefore, three-stage data envelopment analysis (DEA) was used to measure the efficiency level of WEF in the 36 districts of Punjab, Pakistan, for the period from 2015 to 2021. Furthermore, the stochastic frontier was used to analyze the effect of external environmental factors on these efficiency scores of the WEF nexus. The results of the DEA showed that the number of frontier efficiency districts decreased, and most districts experienced rank change over time. Overall, the performance of 50% of the districts declined over time. The relative decline in efficiency was found to be higher in districts Bahwalnaghar and Rahim Yar Khan. The performance of districts Multan and Sheikhupura increased over time, while districts Vehari and Sargodha were the most complete and efficient in actual performance. According to the SFA’s findings, the WEF nexus efficiency of South Punjab districts was negatively impacted by external environmental factors (urbanization rate, manufactured industry output, population), leading to severe stress across WEF sectors. Districts in central and southern Punjab, however, were more likely to have lower rankings because of the positive impact of external environmental factors on the efficiency of the WEF nexus. The substantial rise of external environmental variables focused on scale expansion rather than quality improvement, which created a wide gap in WEF inputs and, hence, reduced the efficiency of the WEF nexus in the districts. The findings of this study provide valuable insights for developing governance strategies based on external environmental factors and WEF resource endowment, and they complement the efficiency calculation of WEF nexus research. Future research should focus on the Baluchistan region, the most deprived area in terms of water, energy, and food.
1. Introduction
Water, energy, and food (WEF) are essential components of the economy and society, but local conditions significantly impact their long-term viability and sustainability. The WEF nexus, as first defined by Hoff [1] consists of numerous interconnections between WEF resources and the WEF system and local conditions. The Interdisciplinary Harvard Water Program was established in 1965 when the WEF conceptual view was first developed. Engineers, economists, and political scientists were involved in the project, which developed a prototype river basin system with integrated irrigation and power plants [2]. For the holistic WEF nexus, it is recognized that external links are important for overcoming implementation difficulties and moving the nexus from a concept to practice [3]. Core and peripheral sub-nexuses describe the WEF nexus’s connections internally and externally [4]. The impact of external links on WEF resources is yet to be determined. As a result, this study examined how WEF’s input/output efficiency in Pakistan is affected by the interplay between the core and peripheral sub-nexuses.
Research on the WEF nexus has been conducted mainly from a bottom-up or a top-down perspective in the early stages of linkage identification and quantification. It is common to use methods such as life cycle analysis, interpretive structural models, causal loop programs and process engineering, stakeholder meetings, and semi-structured interviews to discover, map, and groom connections within and between systems [5,6,7,8]. The nexus boundary definition significantly impacts these connections because they are scale and space specific. Many studies consider administrative boundaries or watersheds to be the boundaries of the WEF nexus and use policy implications to facilitate nexus governance based on policy implementation or resource system integrity [4,9]. Nexus is a buzzword used to connect silo nodes, but it is unclear which silo node should be connected to the other silo nodes. This demonstrates the linkage set’s dynamic behavior, which makes linkage grooming more difficult. According to Ringler [10], the land is a crucial resource that should be integrated into the overall strategy. No single method exists for defining nexus boundaries and linkage sets in local practice to deal with these dynamics [5,11].
Smajgl et al. [12] first proposed core and peripheral sub-nexus definitions, which aimed to cluster and manage the linkages. Additional details of the core and peripheral sub-nexuses were provided by Huang et al. [4]. The core sub-nexus is defined as the complex links between WEF in the processes of product consumption and waste disposal; the peripheral sub-nexus includes interconnections with the dynamic overall urban and natural environmental systems. The core and peripheral sub-nexuses address the local resource problem. Many studies at the micro level have focused on the core sub-nexus, which identifies the interconnections between factors and human behavior at the micro level. Using a nexus approach, these studies aimed to balance the supply and demand of WEF resources at the local level [13,14,15,16]. Impetus nexus implementation in the peripheral sub-nexus requires consideration of the urban system, environmental capacity, and political procedure [17]. Nexus thinking is encouraged as a result of this theoretical foundation. The input–output connections between regions and subsystems are the focus of meso-level research. Numerous input–output models are in use, and this dataset came from the regional input–output table [18]. The impact of a given region’s operation on the WEF sectors can be calculated based on the flow of resources, allowing for the integration of core and peripheral sub-nexuses [19]. As a result, policy implementation is weakened, and the efficiency of the input–output chain is reduced. Analyzing differences between regions is an important step in developing spatially targeted nexus strategies. Most studies have looked at regional differences from the peripheral sub-nexus because it is believed to be the major factor causing regional differences.
As Pakistan’s population has grown, so has the country’s thirst. Data show that, in 2016, Pakistan had a population of 200 million people, with an accompanying decrease in the amount of water available per person, from 5260 m3 to 4870 m3, down from more than 10,000 m3 in 2016 [20], demonstrating the importance of water security in Pakistan. According to studies carried out on the topic, over 47% of the population in Pakistan is at risk of starvation, a worldwide problem due to which people are not getting enough to eat. Not to mention, irrigation is crucial to the food production system [21]. The provinces of Punjab are home to the majority of Pakistan’s irrigated land. With regard to granary staples, the country of Pakistan relies heavily on the exportation of rice, cotton, and sugar cane. Surprisingly, twenty-five percent to thirty-five percent of Pakistan’s GDP comes from agriculture (GDP). Approximately 95% of the country’s available water is used by this sector [22]. All of Pakistan’s power plants’ economic growth has slowed as a result of the 25–40% supply gap, political and social unrest, and stagnation. Ironically, Pakistan has sizable amounts of untapped natural resources that could readily supply all of the country’s energy demands for hundreds of years to come [23]. There has been an uptick in the usage of Punjab, Pakistan, which now has 31% more arable land than it did ten years ago, and this has led to an increase in total crop production and a rise in the standard of living for many locals. Of the energy used, more than 80 percent is used directly in farming [24]. The district-wise energy consumption pattern is given in Figure 1.
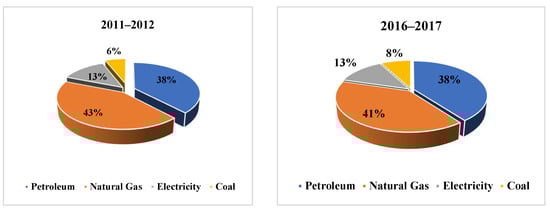
Figure 1.
Share of energy sources in Punjab [25].
According to the WEF nexus, bioethanol energy performance in Pakistan is not much desired [26]. There were biophysical bounds and possibilities set on the water–food system by examining assumptions about water use and crop yields in three different rapid population situations in Pakistan, as described by [27]. Recognizing WEF resource distribution and socioeconomic challenges [28] is important, but a critical sub-nexus relating to regional difference on the basis of efficiency of these resources has received little attention. This calls for additional research.
Core and peripheral sub-nexus interactions primarily focus on the consumption of WEF resources, which does not threaten local development. When it comes to waste management, it has been integrated into the WEF nexus. However, the causal loop diagram of the WEF’s nexus structure has been used, and the peripheral-to-core feedback loop is still missing from the WEF’s overall structure [5]. Local economic development significantly impacts the production, consumption, and conservation of WEF products [8]. Region-specific attributes (such as energy generation, crop farming, and water supply methods) in the WEF nexus are to blame for this. As a result, the WEF nexus is influenced by external factors such as industrial structure and urbanization in the peripheral sub-nexus. As a result, the WEF nexus’s true efficiency must be determined by removing the influence of external environmental factors.
Previous studies on efficiency measurements did not include this suppression [29]. By way of example, Li et al. [30] calculated China’s WEF nexus input–output efficiency by treating the local WEF nexus as a black box and without considering the impact of external factors. This three-stage data envelopment analysis (T-DEA) employed stochastic frontier analysis (SFA) at the second stage to decompose the composite disturbance term and bring model results closer to the actual situation. T-DEA has been widely used to calculate the “real” input–output efficiency (I-O efficiency) among decision-making units (DMUs) [29]. T-DEA was used in the first stage to calculate the comprehensive and real efficiency. In contrast, SFA was used in the second stage to eliminate external environment factors and statistical noise.
This study’s goal was first to specify interactions between inputs, outputs, and environmental factors within the local WEF nexus box with the addition of population factors and to build an index system for efficiency calculation to fill research gaps and determine the real efficiency of the WEF nexus in Pakistan. The T-DEA method used data from Punjab’s 36 districts from 2015 to 2021 to conduct the quantification work. DEA offers the benefits of being non-parametric, requiring no formulation of a functional form, and being computationally simple, using linear programming. The real efficiency of the WEF nexus, the ranking change between comprehensive and real efficiency, and the effects of external environmental factors were then examined and discussed. Interestingly, results from this study found that the developed districts are less efficient than others. It indicates that external environmental factors have adversely affected the WEF nexus efficiency of the South Punjab districts, which has resulted in significant stress across WEF sectors. However, districts in Punjab’s central and southern regions, where external environmental factors positively influenced the WEF nexus efficiency, were more likely to have lower rankings. The contribution of this study is twofold: First, the nexus between water, energy, and food was analyzed with the help of DEA and SFA methods in Punjab, Pakistan, because there is a dire need for this study. Second, this study extended the conceptual framework of the WEF nexus box of Huang et al. [4] with population factor.
The remaining part of this paper is organized as follows: In the second part, materials and method are discussed briefly. In the second part, the conceptual framework of the study is also explained with the addition of population factor. In the third section, the findings of the study are explained systematically. The discussion and conclusions are explained in the fourth and fifth section, respectively.
2. Materials and Methods
2.1. Interactions between the Various Components (Inputs, Output, External Factors) in Local WEF Nexus Initially
Hoff [1] outlined the WEF nexus, which includes a resource sub-nexus (e.g., food and water), as well as links to the external environment (e.g., climate change, economy, social justice). To sustain local development, WEF resources are used locally. These resources are inputs, while waste and emissions from fossil energy use are outputs in this consumption process. For data envelopment analysis (DEA) in this study, districts of Punjab are referred to as data management units (DMUs) because they represent the nexus black box [30]. In this study, industry ratio, urbanization rate, and waste treatment capacity were all used to represent how much WEF resource was consumed in the nexus black box based on the local development state and waste disposal.
Growth in local GDP and population aggregation increase demand for WEF resources and the intensity of WEF resource consumption [31,32]. For example, the positive or negative relationship between urbanization and food security is still being debated. Wang et al. [8] argued that urbanization in Pakistan could improve food security in rural areas by integrating large-scale, fragmented farmland and ensuring environmental protection in Pakistan’s rural areas even though urbanization increases the WEF provision on an urban scale. However, because the waste generated is an unwanted byproduct, it must be collected and disposed of first. Organic waste can be converted to biofuel, and wastewater can be recycled during treatment. Biofuel and reclaimed water, like the reclaimed water in Singapore, are important inputs in some regions [31]. Therefore, treatment capacity is essential for reusing generated waste and meeting local environmental protection requirements. Interactions between inputs, outputs, and environmental factors are depicted in Figure 1, a modification of the conceptual framework of Huang et al. [4].
This study used the T-DEA method to calculate the “real” input–output efficiency of the provincial WEF nexus, which eliminated the influence of external environmental factors and statistical noise on efficiency measurement, as is widely acknowledged in efficiency studies, such as the study carried out by Zhang et al. [27].
2.2. Conceptual Framework
This study is based on the parametric and nonparametric analysis. In nonparametric analysis, inputs and outputs use to calculate the efficiency scores as shown in Figure 1.
Water, energy, and food are used as inputs to produce waste disposal and development by using nonparamtric approach. Parametri approach is used in this study, to analyze the effect of external factors on efficiency scores. These factors are population, industrial ratio, and urbanization. The relationship among inputs, outputs, and external factors is shown in the following Figure 2.
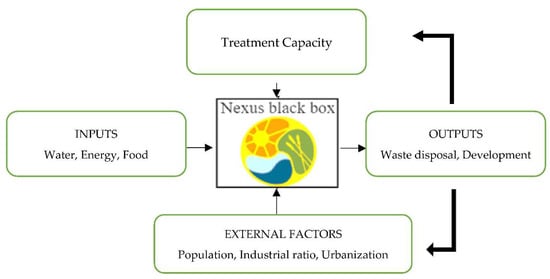
Figure 2.
Interactions between inputs, outputs, and environmental factors: nexus black box [32].
2.3. An Approach That Uses Three Stages of DEA Modeling
Traditional DEA models suggest that locating the DMU as close to the production frontier as possible maximizes efficiency. Environmental factors, statistical noise, and managerial inefficiency are three factors that can hinder or enhance a DMU’s ability to achieve optimum efficiency [29]. Input slack results from these factors, keeping the DMU from reaching the production frontier. When it came to the second stage of calculating efficiency, Fried et al. [33] used a T-DEA approach that eliminated the influence of environmental factors and statistical noise. Calculating “real” input–output efficiency across all DMUs and comparing is a prerequisite.
The first step is to determine the overall efficiency, which considers internal and external factors, using a traditional DEA model, such as the CCR or BCC models. An input-oriented BCC model was chosen in this study, following the model selection of Li et al. [30] and Zhang et al. [29], respectively. An important aspect of the BCC model is that it does not have a constant return to scale, which is consistent with the complex system characteristics of the WEF nexus [5,6,7,8,9,10,11,12,13,14,15,16,17,18,19,20,21,22,23,24,25,26,27,28,29,30]. SFA was used in the second stage to improve the original inputs by adjusting the input slack. Environmental factors and statistical noise were excluded from the input variables by using a regression between input slack and outside environmental factors. It is important to note that, in this regression equation, the first stage’s input slack is a dependent variable, and environmental factors are independent variables, indicating how local development affects this nexus. Thus, the model’s stochastic error includes environmental effects, statistical noise, and management inefficiency. The input–output efficiency of the DMUs was re-measured in the third stage using the input-oriented BCC model. The “real” efficiency level of all DMUs was calculated using the improved input variables. On the other hand, the BCC and SFA models helped to implement the T-DEA.
2.3.1. The Input-Oriented BCC Model
In a set of decision-making units, water, food, and energy use different inputs (xi) to produce outputs (y). WEF produce numerous levels (yij) of elements such as social and economic development. The input–output index is represented by X = (x1, x2, …, Xmj) and Y = (y1, y2, …, Ysj, symbolized), while input–output weights are represented by λ. Constant return to scale represents the CCR model, limiting the frontier boundary, while variable return to scale denotes the BBC model. The boundary is quantified in the double procedure of the BCC model, Equation (1):
1 ≥ ≥ 0 is the input–output efficiency of decision-making units of jth, with the decision making of jth being the DEA competence when θ =1; if it is not, the decision-making unit of jth does not have DEA competence, representing that the decision-making unit is not placed at the production frontier. Created on the production frontier, the wide-ranging efficiency processes, , for each decision-making unit are considered to be composed by the objective input or x target. is the space between the decision-making unit and the production frontier, and x goal is the top value supposing that the decision-making unit is situated at the production frontier.
2.3.2. The SFA Model
In order to analyze the impact of external factors on the efficiency score, stochastic frontier analysis was used. SFA is a parametric approach. The input drooping of each decision-making unit is first proposed using the target input value Sij = (xij − xij) target based on the influences of local development, and regular environmental factors are designated, which have substantial influences on the decision-making units. Then, the SFA model of the ith input can be denoted by Equation (2):
where α is a constant value, b is the vector of parameters of the external environment variables αi bi to be assessed, and Equation (2a) is the collected error term, the statistical noise assumed to follow the normal distribution. Equation (2b) is the managerial inefficiency following the positive normal distribution of Equation (2d). Equation (2c) was continuously engaged to regulate whether the SFA model was valid for approximation; an approaching one designated the Γ managerial inefficiency controls as the collected error term, and the SFA model was applicable. A Γ potential of zero specifies that numerical noise is the leading factor, and the OLS model should be used. The collected error term should be disintegrated before regulating the decision-making inputs. This study adopted the decay method planned by Jondrow et al. [34], and the restricted anticipation of managerial incompetence was developed using Equation (3):
When combining Equations (2) and (3), the conditional expectation of statistical noise is calculated using Equation (4):
Finally, the adjusted input value can be achieved via Equation (5):
A DMU is efficient if and lies on production frontier, while indicates that, if the output value stays the same while the input value rises, the DMU’s input–output efficiency falls. In the input-oriented BCC model, the “actual” input–output efficiency is determined by adjusting the input value and the starting output value.
2.4. Variables of the Study
The selection of variables for T-DEA modelling was based on the interaction study presented in Section 2.1 and Figure 1 (see Table 1).

Table 1.
Variable descriptions.
2.4.1. Input–Output Variables
For example, water consumption (WC), energy expenditure, and food production, as well as waste gas emissions, are all considered inputs (WG). An important indicator of the agricultural economy is the amount of food produced in the local WEF nexus [4]. According to each district’s needs, a significant amount of water must be used for food production. Urban water consumption is dominated by domestic water use in Punjab.
Waste disposal is considered an input to the WEF nexus because undesirable outputs are input variables in the DEA modeling approach [29,30,31,32,33,34,35]. To begin with, in the input-oriented DEA modeling approach, the input variable is treated as a negative indicator, and a lower input value is preferable at a constant output value level. Thirdly, the WC and EC groups include reclaimed water and biofuel energy, which are kinds of indirect cost and require additional resources to reduce waste production or conduct waste treatment. Fourthly, the reclaimed water and biofuel energy are counted in the WC and EC groups as an input variable [36]. However, waste gas emissions have not yet been established as an input variable. Gross domestic product (GDP) as a measure of economic and social progress is the most desirable output metric. WEF nexus modeling already includes AGDP as an output variable [30], so we maintained that approach here.
2.4.2. External Factors
The effectiveness of the WEF nexus in the local area may be affected by external factors. According to Huang et al. [4], two factors represent local development impacts: urbanization rate (UR) and manufactured rate (MR). UR and MR are critical metrics for gauging a city’s competitiveness [37]. To better understand the impact of waste disposal on the WEF nexus, WWTC was selected.
The rate of urbanization is a societal phenomenon. An increase in urbanization means a greater concentration of people in cities, which increases the demand for WEF services. The WEF nexus does not necessarily benefit from an expanding population with regard to input–output efficiency because of the complicated interactions between the WEF system and the expanding population. Bigelow et al. [38] showed that urban population growth and water withdrawal have a complicated relationship. An important first step in making comparisons between WEF regions more robust is eliminating the impact of UR.
Economically, secondary industry is a representation of the regional industry structure. Each district has a different MR. The higher the MR value, the more industrialized the local economy is, and, as a result, the more WEF are consumed and disposed of. For example, a lower MR value indicates that agriculture is the predominant economic activity, resulting in higher water consumption.
Capacity in the technological dimension for wastewater treatment is essential for handling the amount of wastewater generated. Wastewater treatment contributes positively to local ecosystem services if the WWTC value is higher. Significant regional differences in population density and economic development in central, lower, and upper Punjab affected WWTC. The data were taken from Punjab Development Statistics Reports.
3. Results
Some Punjab Development Statistics Report were used to compile data for the 36 districts from 2015 to 2021. For the most efficient computation, we used DEAP software.
3.1. Regional Variation in Efficiency Based on Resource Endowment
Using Table 2, we can see how well the WEF nexus worked in different districts of Punjab. The “real” input–output efficiency was dominated by management efficiency after removing social, economic, and waste disposal impacts and statistical noise. Table 2 shows that, between 2015 and 2021, the WEF nexus’s management efficiency in Punjab’s local units increased rapidly. The Punjab’s average went from a value of 0.68 in 2015 to a value of 0.76 in 2021. Figure 1 also depicts the efficiency scores of the Punjab districts over the time period. Figure 3 shows the variation in the efficiency of the districts of Punjab over the time period. The details of Table 2 and Figure 3 are given in the coming sections.
Table 2.
The “real” input–output efficiency of districts’ WEF nexus.
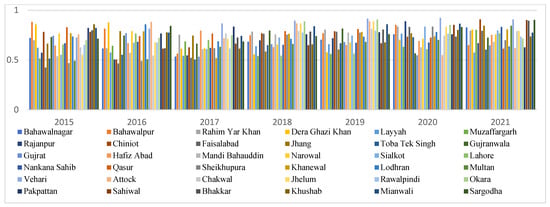
Figure 3.
Efficiency scores of the districts of Punjab (2015–2021).
3.2. Classification of Regions of Punjab Based on Their Natural Resources
The foundation of nexus governance is the recognition of regional differences in WEF resource endowment [39]. Per capita water resources (m3/person) were used to measure water endowment. Following the World Bank’s water need criteria of 1500 m3/person, three regions of Punjab were divided into water scarcity, water abundance groups, and food groups respectively. Regions were divided into three categories. Because of this, the 36 districts were divided into four groups, as shown in Figure 4.
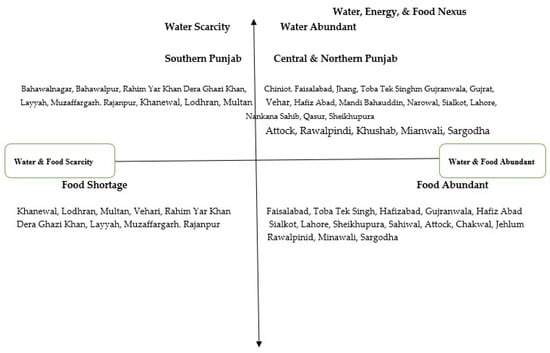
Figure 4.
Resource endowment based on World Bank criteria (source: Institute for Policy Reforms, 2020).
The average daily calorie consumption was found to be 3303 for the southern region of Punjab, 3220 for the central region, and 3254 for the northern region of Punjab. South Punjab had a minimum of around 1600 and a maximum of approximately 5000, whereas Central Punjab had a range of 600–5000, and Northern Punjab had a range of 1000–5000. Central Punjabis had a lower caloric consumption than their southern and northern counterparts. Central Punjab was home to the lowest income earners, while the South Punjab region was the most prosperous.
As shown in Figure 4, two distinct categories were created depending on the endowment of the WEF resources. There are fewer arable lands in the south in the food marketing areas such as Raheem Yar Khan, Dera Gazi Khan, Layyah, Muzaffargarh, Rajanpur, and Vehri. Punjab’s food production and production marketing were unbalanced, indicating that the country’s energy and food were not produced in the same places. Because energy and food production are water intensive, this posed a challenge to water consumption in these regions. In addition to using 70% of the world’s available water, traditional energy production also relies on local water consumption [40]. Inner Northern Punjab was also grappling with this problem.
3.3. Categories of Geographic Regions
Punjab case studies typically divide the area into three regions (the upper, the central, and the southern). Punjab’s regional development disparities can be addressed using any of these three classifications, which align with the central government’s regional development strategies. Some researchers have taken advantage of these classifications in their studies. Thus, this study used three regions to match the four groups (resource endowment) divided by region.
Figure 5 shows the real efficiency scores of each WEF nexus in each region. The central region deteriorated between 2015 and 2021, whereas all other regions grew rapidly from 2015 to 2021. There are many reasons for this, including the fact that the central region is a highly congested area that has experienced high population outflow and wastage of resources. Recently, it was found that the percentage of urbanization in the central Punjab increased. Efficiencies in the northern region are shown in Table 3 and Figure 5 and were the highest, indicating that resources were utilized in this region and also lowered their demand. The efficiency values in the southern region were slightly higher than those in the central region, consistent across the two regions, as a result of the divergence in national strategies brought on by the rise of Central Punjab. Figure 6 shows the average value of “real” input–output efficiency for each region.
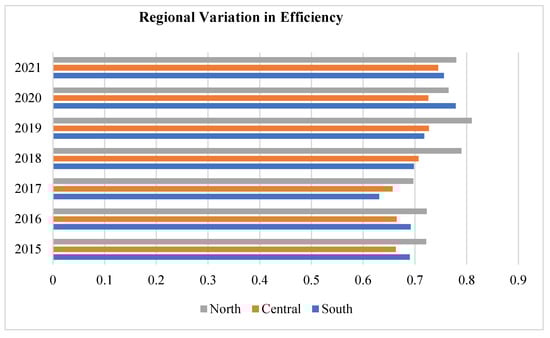
Figure 5.
Real efficiency scores on a regional level in Punjab.
Table 3.
The “real” average input–output efficiency of regions’ WEF nexus.
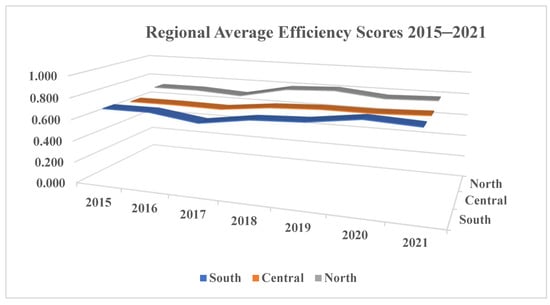
Figure 6.
The average value of “real” input–output efficiency for each region.
3.4. Discrepancies between the “Real” and the “Comprehensive” Efficiency
The comprehensive and real efficiency of DMUs are built on different production frontiers as a type of self-evaluation method in the classical, input-oriented BCC model [41], comparing the specific efficiency value, which is unsound [29]. This study analyzed each district’s rank change to highlight the differences between comprehensive and real efficiency. Table 2 in the SI contains the results relating to the comprehensive input–output efficiency. In Table 4, each district’s average rank change from 2015 to 2021 is shown, which shows the yearly value of each province.
Table 4.
Table rankings and changes in districts’ WEF nexus efficiency values.
Table 3 shows that the overall the performance of 50% of the districts declined over the time period. The relative decline was found to be higher in districts Bahwalnaghar and Rahim Yar Khan. The districts Vehari and Sargodha were the most complete and efficient in actual performance. The performance of districts Multan and Sheikhupura increased over the time. It is interesting that the developed districts were less efficient than others. There was no such change in Okara’s ranking after removing external environmental factors (UR, MR, and WWTC) and the statistical noise. This indicates that external environmental factors adversely affected the WEF nexus efficiency of South Punjab’s districts, which resulted in significant stress across WEF sectors. However, districts in Punjab’s central and southern regions, where external environmental factors positively influenced the WEF nexus efficiency, were more likely to have lower rankings.
Bahawalnagar, Bahawalpur, Rahim Yar Khan, and Dera Ghazi Khan all saw their rankings fall dramatically. External factors (e.g., the UR, MR, and WWTC) limited the WEF nexus efficiency of these districts, which contributed the most development. The district of Lahore is part of the central Punjab, which hinders modern industries. The urbanization rate, for example, had more of an impact on Lahore efficiency, which indicates that urbanization needs to be controlled. External environmental factors undervalued Vehari’s high management efficiency in relation to WEF scarcity. Regarding green industrial development in Lahore and Faisalabad, there was a decrease in the WEF nexus efficiency due to increased local energy consumption.
3.5. External Environment Factors’ Effect
Input slack variables (slacks of WC, EC, FP, and WG) were analyzed using the SFA model to investigate the effects of external environmental factors. The secondary industry rate, urbanization rate, and wastewater treatment capacity were all included as external environmental factors. For all four variables shown in Table 5, the LR test values of the one-sided error were above the critical value of the mixed chi-square distribution test. This demonstrated the SFA model’s sturdiness. It is clear from the gamma values of the four equations (>0.9) that inefficiency in management was a major contributor to input gaps and that the SFA model effectively removed the influence of external environmental factors and statistical noise. MR, UR, and WWTC all have unfavorable effects on WEF nexus efficiency, and the data supported this.
Table 5.
Impacts of external environment factors on input slacks from the SFA model.
MR refers to the economy’s local industrial structure, which positively affects WC, EC, and WG input slacks, but the WG slack failed the significance test by a factor of ten. Water and energy consumption in Punjab is still a problem, even though the country’s overall industrial structure is in decline. While the national water consumption of industry value added per PKR 10,000 decreased, it remained higher than the average level of developed countries or regions (27 m3; see chart below). The failure of the WG slack indicates that the MR and WG slack had no impact on Punjab’s central government’s strong regulations on waste gas emissions [41] According to the 1% significance test results, MR’s slightly negative impact on FP was significant enough to impact local food production through land use change and water consumption [42].
A 1% improvement in UR and WWTC would reduce the WEF input–output efficiency, as UR and WWTC positively impact all input slacks. According to the UR, the expansion of the city area in Punjab’s extensive urbanization mode led to land use change and increased water and energy consumption [43,44]. Urbanization in Punjab had a positive impact on food production, which is surprising. It is consistent with [3] findings that WWTC positively impacts both the EC and FP, mainly due to the energy-intensive nature of wastewater treatment. Regarding resources, there is a direct correlation between WWTC and water consumption (i.e., an increased amount of WWTC leads to an increase in water consumption).
4. Conclusions and Policy Recommendations
When evaluating and governing local WEF resources, it is necessary to take into account both the real efficiency of the WEF nexus and the geographical imbalance. This study used data from Punjab districts from 2015 to 2021 in order to evaluate Punjab’s overall and genuine WEF nexus efficiency (in the first and third stages, respectively). These stages refer to the efficiency of the WEF nexus. The study achieved this by utilizing the T-DEA approach in order to remove the influence of any external environmental influences (including industry ratio, urbanization rate, and wastewater treatment capacity). The province of Punjab suffers from a resource curse, which was investigated and explored with four groups that were differentiated by their WEF resource endowment and three regions that were differentiated by their physical location. In addition, the rank change that occurred between the first and third findings of the efficiency measurement was investigated in order to investigate the differences that existed between the comprehensive and genuine efficiencies. The efficiency of the Pakistani WEF was overestimated due to external variables. The results of the DEA showed that the number of frontier efficiency districts decreased, and most districts experienced rank change over time. Overall, the performance of 50% of the districts declined over time. The relative decline in efficiency was found to be higher in districts Bahwalnaghar and Rahim Yar Khan. The performance of districts Multan and Sheikhupura increased over time, while the districts Vehari and Sargodha were the most complete and efficient in actual performance. According to the SFA’s findings, the WEF nexus efficiency of South Punjab districts was negatively impacted by external environmental factors (urbanization rate, manufactured industry output, population), leading to severe stress across WEF sectors. Districts in central and southern Punjab, however, were more likely to have lower rankings because of the positive impact of external environmental factors on the efficiency of the WEF nexus. The substantial rise in external environmental variables focused on scale expansion rather than quality improvement, which created a wide gap in WEF inputs and, hence, reduced the efficiency of the WEF nexus in the districts. The findings of this study provide valuable insights for developing governance strategies based on external environmental factors and WEF resource endowment, and they complement the efficiency calculation of WEF nexus research. Future research should focus on the Baluchistan region, the most deprived area in terms of water, energy, and food.
According to the results from the SFA model, MR, UR, and WWTC have an unfavorable impact on the improvement of input–output efficiency. The endowment of WEF resources is an important consideration for future modeling and governance. There should be no “one-size-fits-all” policies regarding WEF nexus governance, and regional strategies should be improved. Another promising direction would be to develop an effective method for achieving intensive UR, MR, and WWTP growth. Future research should also consider the most deprived province of Pakistan, Baluchistan.
Author Contributions
Conceptualization, M.A., M.N.A., D.S., and S.H.; methodology, M.A. and M.N.A.; software, M.A. and S.H; validation, M.N.A. and D.S.; formal analysis, M.A.; investigation, M.A. and S.H.; resources, M.N.A. and D.S.; data curation, M.A.; writing—original draft preparation, M.A.; writing—review and editing, M.N.A., D.S., and S.H.; visualization, M.N.A. and D.S.; supervision, M.N.A.; project administration, M.N.A. and D.S.; funding acquisition, D.S. All authors have read and agreed to the published version of the manuscript.
Funding
This study was financially supported by the External Cooperation Program of the Chinese of Academy of Sciences (grant no. 131551KYSB20200022).
Informed Consent Statement
Not applicable.
Acknowledgments
The authors would like to thank the Higher Education Commission (HEC) of Pakistan for supporting this work under the Data-Driven Smart Decision Platform (PSDP-332) and National Centre for Industrial Biotechnology (PSDP-321) projects.
Conflicts of Interest
The authors declare no conflict of interest.
References
- Hoff, H. Understanding the Nexus, SEI Stockholm. Sweden. 2011. Available online: https://policycommons.net/artifacts/1359033/understanding-the-nexus/1972269/ (accessed on 20 October 2022).
- Ramos, E.P.; Sridharan, V.; Alfstad, T.; Niet, T.; Shivakumar, A.; Howells, M.I.; Gardumi, F. Climate, Land, Energy and Water systems interactions–From key concepts to model implementation with OSeMOSYS. Environ. Sci. Policy 2022, 136, 696–716. [Google Scholar] [CrossRef]
- Taghdisian, A.; Bukkens, S.G.; Giampietro, M. A Societal Metabolism Approach to Effectively Analyze the Water–Energy–Food Nexus in an Agricultural Transboundary River Basin. Sustainability 2022, 14, 9110. [Google Scholar] [CrossRef]
- Huang, D.; Li, G.; Chang, Y.; Sun, C. Water, Energy, and Food Nexus Efficiency in China: A Provincial Assessment Using Three-Stage Data Envelopment Analysis Model; Elsevier: Amsterdam, The Netherlands, 2022. [Google Scholar]
- Zhang, Y.F.; Li, Y.P.; Huang, G.H.; Ma, Y. A copula-based stochastic fractional programming method for optimizing water-food-energy nexus system under uncertainty in the Aral Sea basin. J. Clean. Prod. 2021, 292, 126037. [Google Scholar] [CrossRef]
- Sušnik, J.; Staddon, C. Evaluation of Water-Energy-Food (WEF) Nexus Research: Perspectives, Challenges, and Directions for Future Research. JAWRA J. Am. Water Resour. Assoc. 2021. [Google Scholar] [CrossRef]
- Lu, J.; Lin, Y.; Wu, J.; Zhang, C. Continental-scale spatial distribution, sources, and health risks of heavy metals in seafood: Challenge for the water-food-energy nexus sustainability in coastal regions? Environ. Sci. Pollut. Res. 2021, 28, 63815–63828. [Google Scholar] [CrossRef] [PubMed]
- Wang, X.C.; Jiang, P.; Yang, L.; Van Fan, Y.; Klemeš, J.J.; Wang, Y. Extended water-energy nexus contribution to environmentally-related sustainable development goals. Renew. Sustain. Energy Rev. 2021, 150, 111485. [Google Scholar] [CrossRef]
- Arnbjerg-Nielsen, K.; Gain, A.K.; Keskinen, M.; Varis, O.; McKnight, U.S. To what extent should we ensure the explicit inclusion of water quality within the WEF nexus? Discussion of “Water quality: The missing dimension of water in the water–energy–food nexus”. Hydrol. Sci. J. 2022, 67, 1287–1290. [Google Scholar] [CrossRef]
- Ringler, C.; Bhaduri, A.; Lawford, R. The nexus across water, energy, land and food (WELF): Potential for improved resource use efficiency? Curr. Opin. Environ. Sustain. 2013, 5, 617–624. [Google Scholar] [CrossRef]
- Smajgl, A.; Ward, J.; Pluschke, L. The water–food–energy Nexus–Realising a new paradigm. J. Hydrol. 2016, 533, 533–540. [Google Scholar] [CrossRef]
- Carvalho, P.N.; Finger, D.C.; Masi, F.; Cipolletta, G.; Oral, H.V.; Tóth, A.; Exposito, A. Nature-based solutions addressing the water-energy-food nexus: Review of theoretical concepts and urban case studies. J. Clean. Prod. 2022, 338, 130652. [Google Scholar] [CrossRef]
- Al-Saidi, M.; Hussein, H. The water-energy-food nexus and COVID-19: Towards a systematization of impacts and responses. Sci. Total Environ. 2021, 779, 146529. [Google Scholar] [CrossRef] [PubMed]
- Botai, J.O.; Botai, C.M.; Ncongwane, K.P.; Mpandeli, S.; Nhamo, L.; Masinde, M.; Mabhaudhi, T. A review of the water–energy–food nexus research in Africa. Sustainability 2021, 13, 1762. [Google Scholar] [CrossRef]
- Allouche, J.; Middleton, C.; Gyawali, D. The Water–Food–Energy Nexus: Power, Politics, and Justice; Routledge: London, UK, 2019. [Google Scholar]
- Moss, T.; Hüesker, F. Politicised nexus thinking in practice: Integrating urban wastewater utilities into regional energy markets. Urban Stud. 2019, 56, 2225–2241. [Google Scholar] [CrossRef]
- Diesendruck, C.E.; Dekel, D.R. Water–A key parameter in the stability of anion exchange membrane fuel cells. Curr. Opin. Electrochem. 2018, 9, 173–178. [Google Scholar] [CrossRef]
- Zhang, P.; Cai, Y.; Zhou, Y.; Tan, Q.; Li, B.; Li, B.; Jia, Q.; Yang, Z. Quantifying the water-energy-food nexus in Guangdong, Hong Kong, and Macao regions. Sustain. Prod. Consum. 2022, 29, 188–200. [Google Scholar] [CrossRef]
- Khan, S. Policy diagnostics for Pakistan’s water security challenge. World Water Policy 2019, 5, 8–14. [Google Scholar] [CrossRef]
- Kirby, M.; Mainuddin, M.; Khaliq, T.; Cheema, M.J.M. Agricultural production, water use and food availability in Pakistan: Historical trends, and projections to 2050. Agric. Water Manag. 2017, 179, 34–46. [Google Scholar] [CrossRef]
- Laghari, A.N.; Vanham, D.; Rauch, W. The Indus basin in the framework of current and future water resources management. Hydrol. Earth Syst. Sci. 2012, 16, 1063–1083. [Google Scholar] [CrossRef]
- Durrani, A.A.; Khan, I.A.; Ahmad, M.I. Analysis of Electric Power Generation Growth in Pakistan: Falling into the Vicious Cycle of Coal. Eng 2021, 2, 296–311. [Google Scholar] [CrossRef]
- Taiqi, Z. The impact of China-Pakistan Economic Corridor on Pakistan economy under the background of “One Belt And One Road”. Front. Soc. Sci. Technol. 2020, 2, 41–44. [Google Scholar]
- Arif, S.M.; Bannian, B. Water Management and Reservoirs in Pakistan: An Analysis of Legal Framework and Contemporary Challenges. Adv. State Stud. 2022, 1, 19–24. [Google Scholar]
- Ghani, H.U.; Silalertruksa, T.; Gheewala, S.H. Water-energy-food nexus of bioethanol in Pakistan: A life cycle approach evaluating footprint indicators and energy performance. Sci. Total Environ. 2019, 687, 867–876. [Google Scholar] [CrossRef] [PubMed]
- Grigg, N.S. Fifty years of water research: Has it made a difference? Water Int. 2021, 46, 1087–1098. [Google Scholar] [CrossRef]
- Zhang, J.; Liu, Y.; Chang, Y.; Zhang, L. Industrial eco-efficiency in China: A provincial quantification using three-stage data envelopment analysis. J. Clean. Prod. 2017, 143, 238–249. [Google Scholar] [CrossRef]
- Wen, C.; Dong, W.; Zhang, Q.; He, N.; Li, T. A system dynamics model to simulate the water-energy-food nexus of resource-based regions: A case study in Daqing City, China. Sci. Total Environ. 2022, 806, 150497. [Google Scholar] [CrossRef] [PubMed]
- Hsien, C.; Low, J.S.; Chung, S.Y.; Tan, D.Z. Quality-based water and wastewater classification for waste-to-resource matching. Resour. Conserv. Recycl. 2019, 151, 104477. [Google Scholar] [CrossRef]
- Brouder, A. World economic forum. In Handbook of Transnational Economic Governance Regimes; Brill Nijhoff: Leiden, The Netherlands, 2010; pp. 279–303. [Google Scholar]
- Lawford, R.; Bogardi, J.; Marx, S.; Jain, S.; Wostl, C.P.; Knüppe, K.; Ringler, C.; Lansigan, F.; Meza, F. Basin perspectives on the water–energy–food security nexus. Curr. Opin. Environ. Sustain. 2013, 5, 607–616. [Google Scholar] [CrossRef]
- Conway, D.; Van Garderen, E.A.; Deryng, D.; Dorling, S.; Krueger, T.; Landman, W.; Lankford, B.; Lebek, K.; Osborn, T.; Ringler, C.; et al. Climate and southern Africa’s water–energy–food nexus. Nat. Clim. Change 2015, 5, 837–846. [Google Scholar] [CrossRef]
- Weitz, N.; Strambo, C.; Kemp-Benedict, E.; Nilsson, M. Closing the governance gaps in the water-energy-food nexus: Insights from integrative governance. Glob. Environ. Change 2017, 45, 165–173. [Google Scholar] [CrossRef]
- Bigelow, D.P.; Chaudhry, A.M.; Ifft, J.; Wallander, S. Agricultural water trading restrictions and drought resilience. Land Econ. 2019, 95, 473–493. [Google Scholar] [CrossRef]
- Lv, H.; Yang, L.; Zhou, J.; Zhang, X.; Wu, W.; Li, Y.; Jiang, D. Water resource synergy management in response to climate change in China: From the perspective of urban metabolism. Resour. Conserv. Recycl. 2020, 163, 105095. [Google Scholar] [CrossRef]
- Kamrani, K.; Roozbahani, A.; Shahdany, S.M. Using Bayesian networks to evaluate how agricultural water distribution systems handle the water-food-energy nexus. Agric. Water Manag. 2020, 239, 106265. [Google Scholar] [CrossRef]
- Wu, L.; Elshorbagy, A.; Pande, S.; Zhuo, L. Trade-offs and synergies in the water-energy-food nexus: The case of Saskatchewan, Canada. Resour. Conserv. Recycl. 2021, 164, 105192. [Google Scholar] [CrossRef]
- Trainor, A.M.; McDonald, R.I.; Fargione, J. Energy sprawl is the largest driver of land use change in United States. PLoS ONE 2016, 11, e0162269. [Google Scholar] [CrossRef] [PubMed]
- Jaeger, W.K.; Amos, A.; Bigelow, D.P.; Chang, H.; Conklin, D.R.; Haggerty, R.; Langpap, C.; Moore, K.; Mote, P.W.; Nolin, A.W.; et al. Finding water scarcity amid abundance using human–natural system models. Proc. Natl. Acad. Sci. USA 2017, 114, 11884–11889. [Google Scholar] [CrossRef] [PubMed]
- Lee, L.C.; Wang, Y.; Zuo, J. The nexus of water-energy-food in China’s tourism industry. Resour. Conserv. Recycl. 2021, 164, 105157. [Google Scholar] [CrossRef]
- Mohtar, R.H.; Lawford, R. Present and future of the water-energy-food nexus and the role of the community of practice. J. Environ. Stud. Sci. 2016, 6, 192–199. [Google Scholar] [CrossRef]
- Bellezoni, R.A.; Meng, F.; He, P.; Seto, K.C. Understanding and conceptualizing how urban green and blue infrastructure affects the food, water, and energy nexus: A synthesis of the literature. J. Clean. Prod. 2021, 289, 125825. [Google Scholar] [CrossRef]
- Sadeghi, S.H.; Moghadam, E.S.; Delavar, M.; Zarghami, M. Application of water-energy-food nexus approach for designating optimal agricultural management pattern at a watershed scale. Agric. Water Manag. 2020, 233, 106071. [Google Scholar] [CrossRef]
- Bakhshianlamouki, E.; Masia, S.; Karimi, P.; van der Zaag, P.; Sušnik, J. A system dynamics model to quantify the impacts of restoration measures on the water-energy-food nexus in the Urmia lake Basin, Iran. Sci. Total Environ. 2020, 708, 134874. [Google Scholar] [CrossRef]


Publisher’s Note: MDPI stays neutral with regard to jurisdictional claims in published maps and institutional affiliations. |
© 2022 by the authors. Licensee MDPI, Basel, Switzerland. This article is an open access article distributed under the terms and conditions of the Creative Commons Attribution (CC BY) license (https://creativecommons.org/licenses/by/4.0/).