Essay

Research on the Evaluation of Coordinated Development of Tourism–Economy–Ecological Environment along the Silk Road Economic Belt

1
School of Economics, Southwest Minzu University, Chengdu 610041, China
2
School of Historical Culture & Tourism, Southwest Minzu University, Chengdu 610041, China
3
Independent Researcher, Gold Coast 4207, Australia
*
Author to whom correspondence should be addressed.
Sustainability 2022, 14(21), 13838; https://doi.org/10.3390/su142113838
Submission received: 12 September 2022 / Revised: 20 October 2022 / Accepted: 22 October 2022 / Published: 25 October 2022

Abstract

:
Tourism is currently one of the important development industries in many countries and regions, and a healthy environment is an important basis and carrier for the sustainable development of the tourism economy. Ensuring a harmonious relationship between tourism, the economy, and the environment has become one of the keys to achieving sustainable development of tourism destinations. Based on panel data on tourism, the economy, and the environment from nine provinces along the Silk Road Economic Belt from 2015 to 2019, this study has built a comprehensive evaluation index system of the tourism–economy–ecological environment (TEE). The entropy evaluation method, comprehensive evaluation model, and coupling and coordination degree model were used for quantitative analysis of the coordination development level and for assessing the spatial–temporal evolution patterns of coupling coordination for the TEE system in nine provinces along the Silk Road Economic Belt. The results show that the value of the TEE system is generally on the rise. Still, the growth rate of tourism and the economy subsystem is significantly higher than that of the environment subsystem. The coupling coordinating the development of the TEE system shows an increasing trend with a high degree of coupling. The coordination degree is relatively low, with significant gradient differences and apparent polarization. The main constraint to the coordinated development of the Silk Road Economic Belt is tourism and the economy.

1. Introduction

The impact of human social activities, especially economic activities, on the ecological environment and its feedback mechanisms have attracted widespread attention [1]. The continuous interaction between human activities and the components of nature leads to the formation and development of coupled human and natural systems [2,3]. In recent decades, to mitigate the environmental damage caused by human activities and achieve environmentally sound decision making, many researchers have successfully combined the natural and human sciences in the field of global change through decades of unremitting efforts [4]. Among them, the continuous development of human tourism activities and economic activities will have a great impact on the environment. For instance, an increase in tourists can drive local economic benefits and promote the development of the local economy, but, at the same time, inappropriate tourism activities will affect the local biodiversity, destroy the tourism landscape, and thus affect the local environment. Therefore, in terms of its conceptual–theoretical framework, this research attempts to examine the coordinated development of the Tourism–Economy–Environment system (hereafter referred to as the TEE system) in China’s Silk Road Economic Belt from a new perspective, highlighting the interaction between tourism activities, the economy, and environmental changes under a sustainable development strategy.
The essence of the sustainable development strategy advocated in the 21st century is to take the environment into account as part of the economic cost. At the same time, tourism is a specific industry that depends on resources. This means that the relationship between tourism, economy, and ecology is interdependent and contradictory. On the one hand, tourism plays a significant role in social and economic development and is even regarded as a pillar industry in many regions. On the other hand, there has been increased attention paid to the environment in relation to social and economic development. At the same time, there is an interactive relationship between tourism, the economy, and the environment. A sound environment could provide more resources for tourism and economic activities, thereby promoting the development of tourism and the economy. However, the development of tourism and the economy will inevitably have a specific impact on the environment. This impact can reach a certain level and cause damage, which is a further obstacle to tourism development and the economy [5]. Therefore, coordinating the relationship between the three subsystems and realizing the balanced and coordinated development of tourism, the economy, and the environment is of great practical significance for promoting the sustainable development of the Silk Road Economic Belt. It is a critical factor for achieving the success of the Silk Road Economic Belt strategy and so is one of the hotspots of current research.
The earliest studies on the relationship between tourism, the economy, and ecology can be traced back to the 1970s. Early research was mainly based on economic theories and methods to study the coordination of tourism development and environmental issues, and so emerged theoretical models such as tourism–economy, tourism–environment, economy–environment, and tourism–economy–environment. These theoretical models analyze the connection between tourism development, economic growth, and the environment. Research from other countries mainly focuses on the interrelationship between the two subsystems of tourism–economy, tourism–environment, and especially the interplay between the regional economy and the environment [6]. The model of tourism activity–environmental elements developed by Wall and Wright [7] is based on the analysis of tourism’s impact on the environment. Mbaiwa [8] and Dilek [9] established a sustainable development theory-based tourism industry–environment interaction evaluation model. Petrosillo et al. [10] developed a tourism-based socioecological vulnerability model, and Lacitignola et al. [11] established a socioecological model based on tourism. However, studying this constantly changing system is a long-term process, and it is not easy to conduct long-term studies. Therefore, the concept of a coordination degree in physics was first introduced by Yang [12] in his analysis of the relationship between the urban environment and economic development. In addition, it was developed by Liao [13], who used the coupling degree and the coupling coordination degree to investigate the relationship between the two systems, the environment, and the economy, which was a great innovation in the study area. After that, to explore the relationship between tourism economic development and the environment, the term “coupling coordination degree” was introduced to different research scales, such as provincial administrative regions, important cities, and urban agglomerations [14,15,16,17].The research includes the coordinated development of population–economy–ecology [18], the coordinated development of population–resources–environment [19], the coordinated development of economy–resources–environment [20], tourism economy–traffic conditions–environment [21], the coordinated development of tourism–ecology–economy [22], etc. The research methods include a sustainable development model [23], a coupled coordinated development model [24,25], a coordination degree evaluation model [26], etc. The research regions include the southwest [27], five northwestern provinces [28], three eastern provinces [29], the Yangtze River economic belt [30], the Yellow River basin [31,32], Heilongjiang province [33], and Shanxi province [34].With the proposal of a series of national and regional economic coordinated development strategies, the number of studies on the coupling relationship between the three in a regional context has started to rise. Yang et al. [35] conducted an empirical analysis of the coupling degree of the relationship of the TEE system in Inner Mongolia. They proposed recommendations that are suitable for the sustainable development of the Inner Mongolia region. Zhong and Liu et al. [36] analyzed the coupling coordination degree of 21 cities in Guangdong Province using a coupling model, and the spatial expression of GIS (Geographic Information Science) was used to make it more visual and specific. Zhang and Khalik et al. [4] empirically analyzed Turpan’s coupling coordinated development of the TEE system from 2001 to 2011. They concluded that the environment is the key factor restricting the improvement of the coupling coordination degree. Zhao et al. [37] used a coupled coordination model and grey models with the data from 2008–2017 to classify the tourism industry, economic development, and environment into two categories, ecological overtaking and economic overtaking. They also predicted that Xinjiang would reach a good level of coordinated action in 2021. With an in-depth study of the coupling coordination degree, Liao classified the coupling coordination degree level into 10 degrees: extreme disorder, severe disorder, moderate disorder, mild disorder, verge of disorder, reluctant coordination, primary coordination, intermediate coordination, good coordination, and high-quality coordination. Their research provides a basis for us to study the Silk Road Economic Belt in a better way. However, most existing studies have focused on the TEE system coordination relationship between national strategic economic zones or individual provinces. The research dimensions are mainly focused on a comparison over time and lack the comparison between regions in spatial dimensions. Meanwhile, there has been no study on the TEE system co-development of the Silk Road Economic Belt. The NDRC (National Development and Reform Commission), the Ministry of Foreign Affairs, and the Ministry of Commerce jointly issued the Vision and Actions on Jointly Building the Silk Road Economic Belt and 21st Century Maritime Silk Road in March 2015. The nine provinces along the Silk Road Economic Belt have been vigorously promoted as hotspots for domestic and international investment and policy support, and all achieved positive progress. By 2019, the comprehensive contribution of tourism to the regional GDP (Gross Domestic Product) of the Silk Road Economic Belt was CNY 5.3 trillion, accounting for 31.29% of the regional GDP, which is much higher than the national GDP of 6.69%. However, the rapid development of tourism has caused human activities to exceed the carrying capacity of the environment. This has led to the intensification of ecological damage in the Silk Road Economic Belt and the emergence of many phenomena of disharmony between man and nature. For example, it increased the area of desertification, damaged the environment in the landscape, and increased hours of wind and sand. This primarily affects the region’s economic development and also affects the coordinated development of the TEE system. Evaluating the level of the TEE system and developing the coordination is a scientific challenge for all provinces along the Silk Road Economic Belt.
With the trend of global economic integration and the increasing demand for a better life, tourism brings considerable benefits to the local economy as well as adverse effects, such as environmental pollution and resource destruction. Therefore, coordinating the relationship between tourism, economy, and the environment is a way to properly deal with the conflict between development and protection and to achieve the goal of coexistence. This paper attempts to summarize previous studies and takes the Silk Road Economic Belt panel data from 2015 to 2019 as an example to (1) construct an evaluation index system for the coordinated development of the TEE system; (2) measure its integration level through an econometric model; (3) clarify the development constraints and coordinate the relationships within the TEE system; and (4) provide practical suggestions for the more sustainable development of the TEE system to encourage harmonious coexistence between humans and nature.

2. Materials and Methods

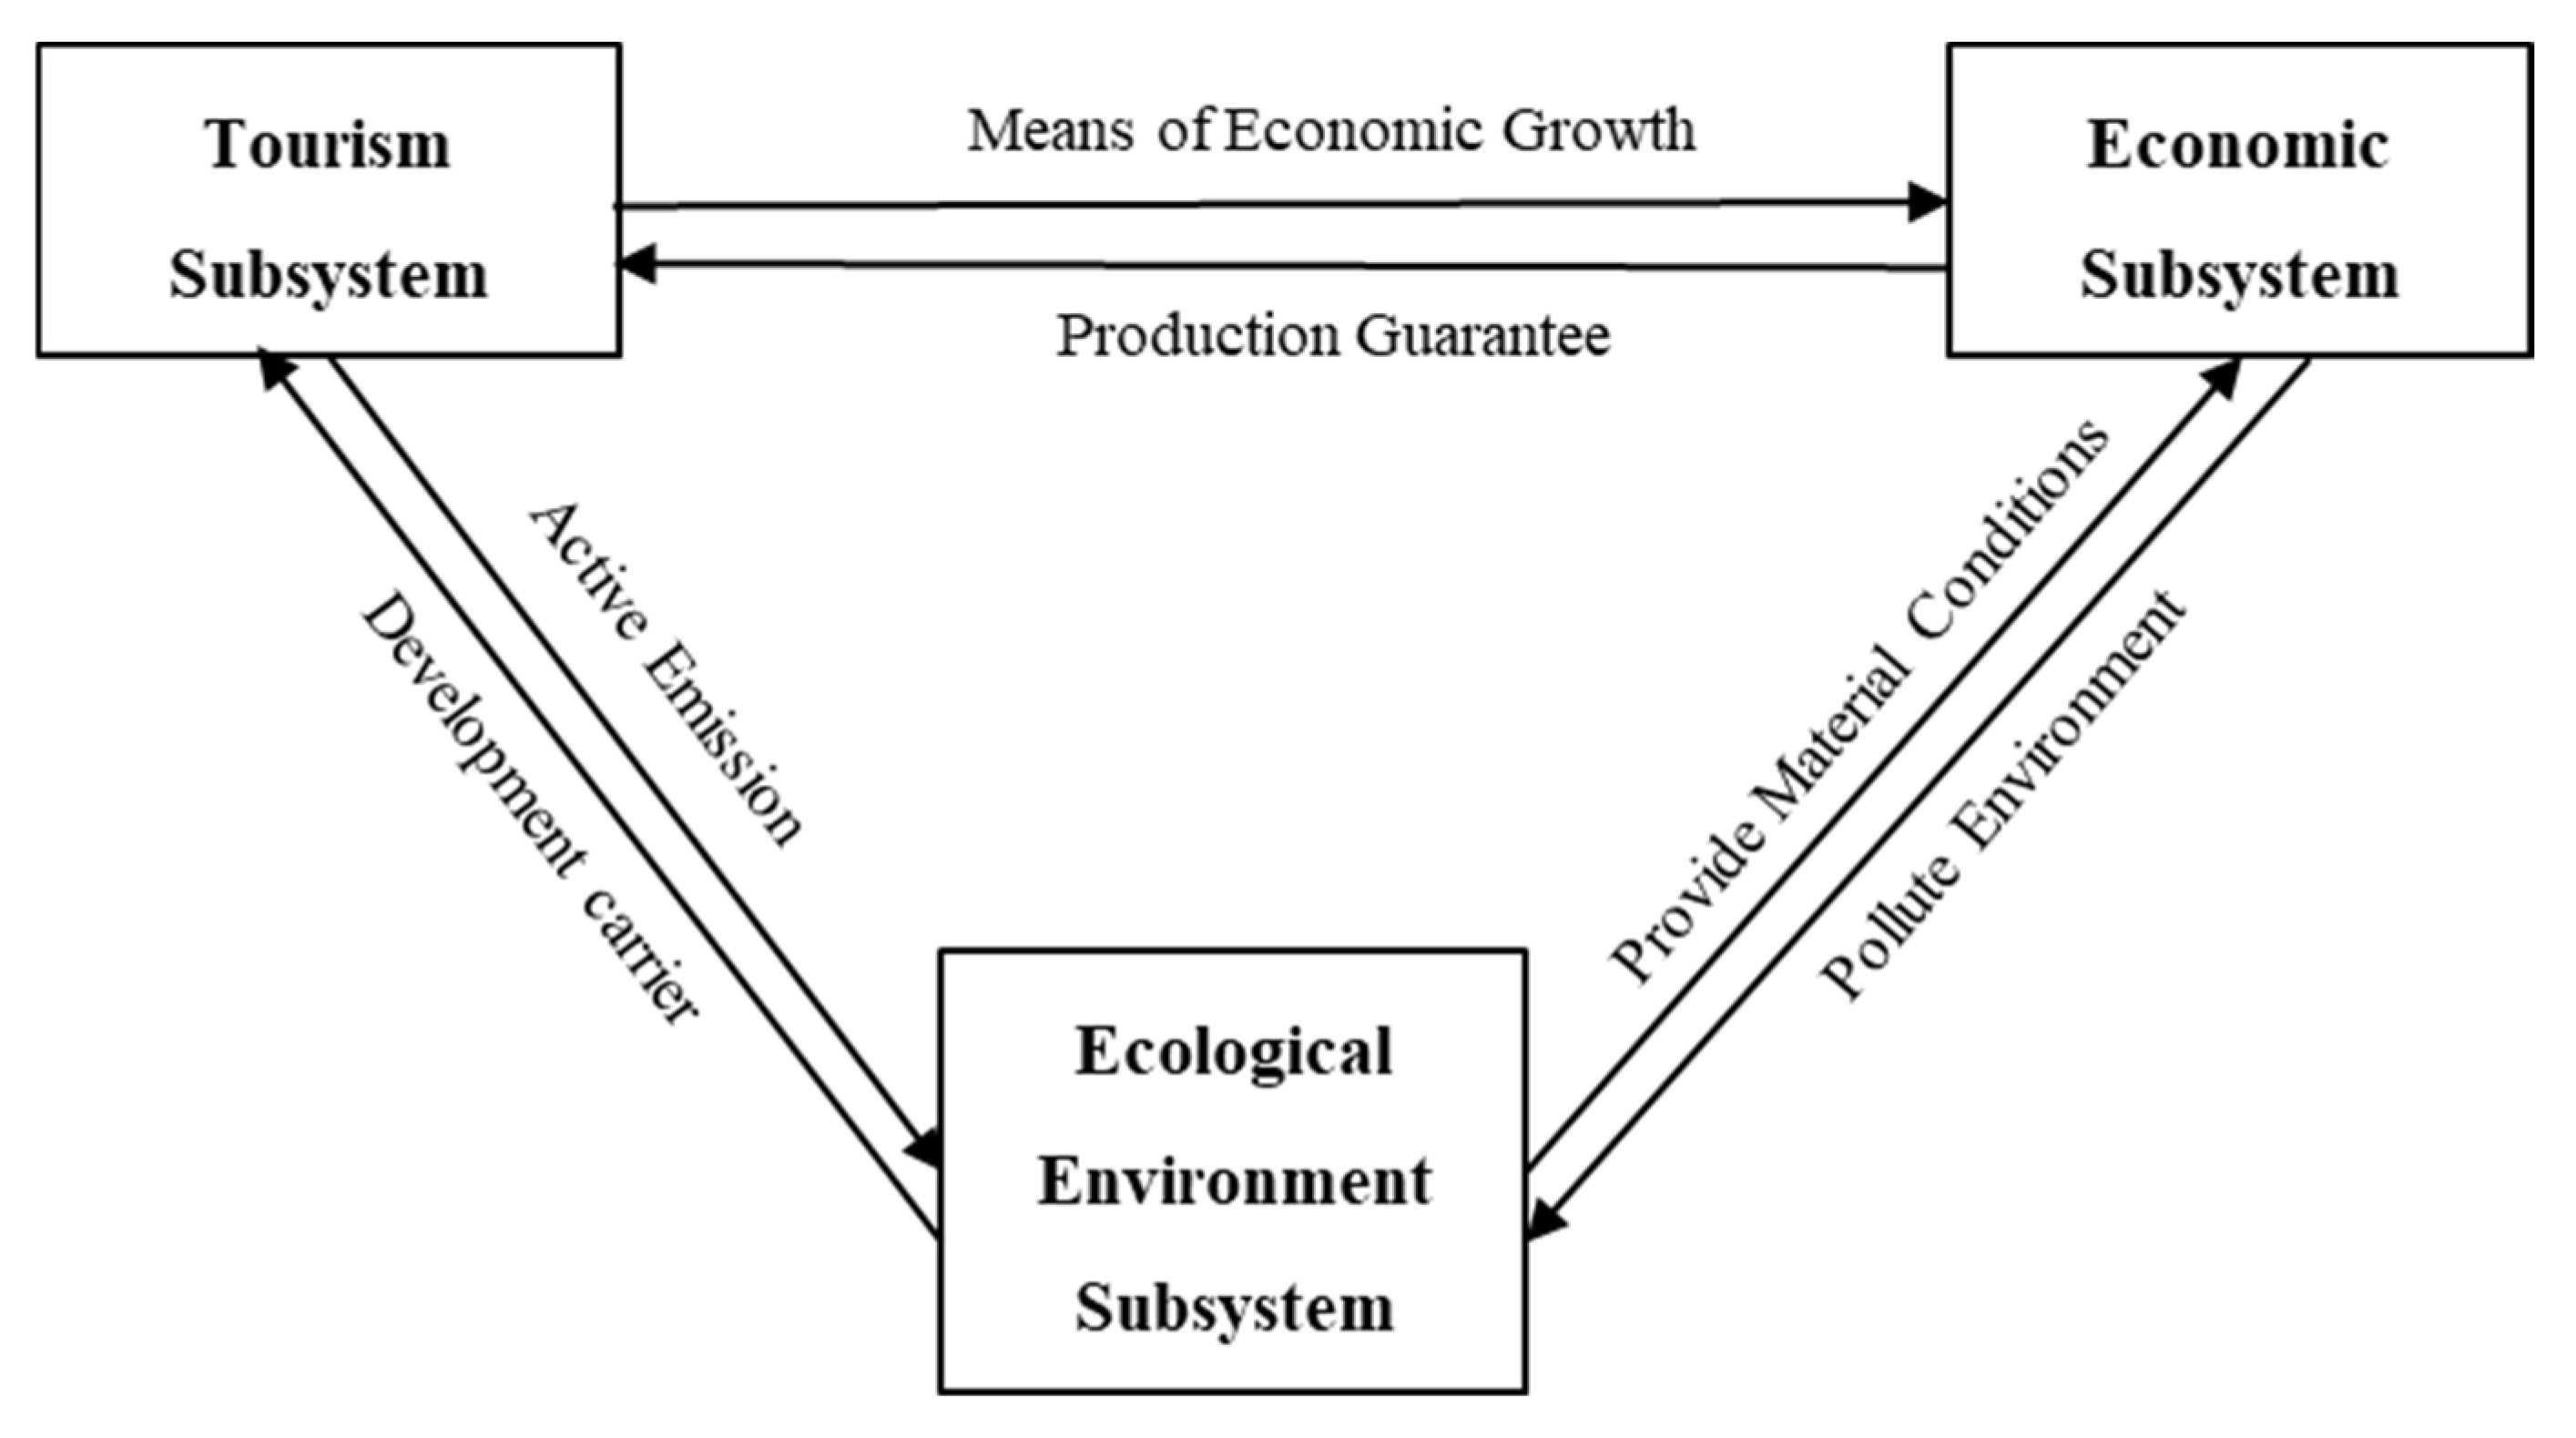
2.1. Analysis of the Coupling and Coordination Mechanism of TEE Systems

In 2016, The United Nations Educational, Scientific, and Cultural Organization (UNESCO) defined sustainability as “a paradigm for thinking about the future, in which environmental, social, and economic factors are balanced in the pursuit of improving the quality of life” [38]. Echoing the “triple bottom line” theory of sustainable development proposed by John Elkington in 1998 [39]. Taghvaee applied the “triple bottom line” theory to the study of sustainable development of regional transportation and constructed the Health, Environment, and Economy (HEY) model [40]. Therefore, the “triple bottom line” theory of sustainable development can also be applied to the coupling and coordination mechanism of the tourism–economy–ecological environment (TEE) system in this article.
Coupled and coordinated development is understood as the combination of coupling, coordination, and development. It is the evolutionary process from disorderly to orderly, from a low level of coordination to a high level of coordination between systems and elements [41]. In this study, the coordinated development of tourism, the economy, and environmental systems refers to an organic whole formed by a certain structure, which works effectively by sharing elements between the three systems. Its overall purpose is to improve the tourism industry and economic development level, limit the impact on the environment to a bearable range [42], and achieve the most appropriate tourism, economic development, and environmental goals [43]. The degree of coordination is an important index to describe the degree of interaction between systems or elements. It is also significant to discern the intensity of action between systems or components, the time interval of action, and the process of change in the system [44]. However, due to the interlocking, dynamic, and unbalanced nature of the system or elements, in some cases, the coordination degree does not reflect the overall efficacy and coordinated effects of the interactions between the system or elements [45]. For this reason, the concept of a coordinated development degree is introduced to measure the degree of coordination of the interactive coupling between systems or elements.
The interactions of tourism, the economy, and the environment are expressed such that the tourism subsystem includes essential means of achieving economic growth. Tourism development can promote or inhibit environmental protection. It is not appropriate to recklessly pursue economic benefits in tourism development. It is critical to consider ecological benefits to solve the contradiction between economic growth and environmental protection.
The environmental subsystem is the carrier of human existence, and there can be a conflict between the environment and economic development. On the one hand, inappropriate mining methods have damaged the environment, as has improper treatment of factory waste emissions. On the other hand, people can actively create policies and measures to conserve the environment. The economic subsystem mainly includes material subsistence production, flow, and distribution. More specifically, it includes agriculture, industry, services, etc. Through scientific and technological innovation, the efficiency of resource utilization in the production process could be improved, and the damage to the environment could be reduced.
Although the economic system is able to meet the material and cultural needs of human life, the consumed goods do not disappear. Instead, they are converted into other forms of matter and energy, including waste that pollutes the environment. In summary, TEE systems are not independent of each other internally, and the flow of feedback mechanisms between the systems is shown in Figure 1.
The essence of TEE system coupling is to combine the three systems to compare the level of comprehensive coordination among them. In other words, considering the environment while developing tourism and enhancing the economy is necessary. The environment is the background resource for tourism development and also promotes the development of tourism and the economy. A TEE system could make it a coordinated symbiosis of the three and allow them to promote each other.

2.2. Overview of the Study Area

Building the Silk Road Economic Belt is a significant way to create a new pattern of an open economy on all fronts and promote China’s economic development under the new normal state in China [46,47]. In March 2015, the Vision and Actions on Jointly Building the Silk Road Economic Belt and 21st Century Maritime Silk Road were issued by the NDRC, the MOFA (Ministry of Foreign Affairs), and the Ministry of Commerce. This document states that the Silk Road Economic Belt covers nine provinces in China. Among them, five provinces and regions are in the northwest: Shaanxi, Gansu, Qinghai, Ningxia Hui Autonomous Region (referred to as Ningxia), and Xinjiang Uyghur Autonomous Region (referred to as Xinjiang). The other four provinces and cities are in the southwest: Chongqing, Yunnan, Guangxi Zhuang Autonomous Region (referred to as Guangxi), and Sichuan [48] (Figure 2). This study also refers to the above nine provinces along the Silk Road Economic Belt in China as the “Silk Road Economic Belt provinces” in the following.
As an important economic corridor that connects the Eurasian Economic Circle, the Silk Road Economic Belt provinces have a total area of about 4,285,200 km2, which is the total administrative area of the nine provinces and accounts for 44.64% (4,285,200/9,600,000) of China’s land area. It covers four National Urban Agglomerations, 15 World Heritage sites, and two official national parks. It is a particular spatial area that integrates high-altitude areas, minority areas, old revolutionary base areas, ecotones, tourism resource gathering areas, and the main area for rural revitalization. It has a unique and irreplaceable strategic position in the coordinated regional development paradigm.
As of the end of 2019, the GDP of the provinces and regions along the Silk Road Economic Belt was CNY 16.95 trillion, which is only 17.11% (16.95/99.09) of the national GDP. According to the official website of the National Bureau of Statistics, the total tourism revenue was CNY 5.31 trillion, accounting for 26.28% of national tourism revenue (http://www.stats.gov.cn/tjsj./ndsj/ (accessed on 3 September 2022)). According to the official website of the Ministry of Culture and Tourism of The People’s Republic of China, there were 3303 A-level tourist attractions, accounting for 26.63% of A-level tourist attractions in China (https://sjfw.mct.gov.cn/site/dataservice/rural?type=10 (accessed on 3 September 2022)). The forest area is 84.147 million hectares, accounting for 38.17% (84.147/220.453) of the total forest area in the whole country. The national nature reserve area is 46.274 million hectares, which accounts for 47.16% (46.274/98.121) of the national total. As has been noted, the tourism industry and ecological environment are vital to the development of the regional economy, and the Silk Road Economic Belt contains rich tourism resources. However, there are still many prominent problems. The level of the entire regional economy is relatively low, and the development is not even. There is still room for improvement in terms of coordination mechanisms and integrated development. Moreover, the dependence of tourism development on resources is becoming stronger. The consumption of resources has increased, and the environment has been damaged. Therefore, studying the coordinated development of the TEE system in the Silk Road Economic Belt is significant. It could help governments to plan the development of the Silk Road Economic Belt provinces more scientifically and comprehensively, bring in more investments, and promote the construction and rational distribution of projects.

2.3. Data Sources

The research period was from 2015 to 2019, and nine provinces along the Silk Road Economic Belt were selected as the sample area. The data in this paper are mainly from the China Statistical Yearbook (2016–2020), China Tourism Statistical Yearbook (2016–2020), Guangxi Statistical Yearbook (2016–2020), Chongqing Statistical Yearbook (2016–2020), Sichuan Statistical Yearbook (2016–2020), Shaanxi Statistical Yearbook (2016–2020), Gansu Development Yearbook (2016–2020), Qinghai Statistical Yearbook (2016–2020), Ningxia Statistical Yearbook (2016–2020), and Xinjiang Statistical Yearbook (2016–2020). Some data analyzed in this research are from statistical communiques on the national economic and social development of the above nine provinces from 2015 to 2019.

2.4. Index Selection

2.4.1. The Basis of Index Selection

A sound and effective evaluation index system will directly affect the authenticity and accuracy of the research. Therefore, based on existing relevant research [49,50] and referring to the Green Development Indicator System and the OECD Sustainable Development System (https://www.oecd.org/china/ (accessed on 10 September 2022)). This paper constructed a coordinated development evaluation index system of the tourism–economy–environment nexus for the Silk Road Economic Belt with the principles of scientificity, comprehensiveness, and hierarchy. This evaluation index system includes three subsystems: tourism, the economy, and the environment. We used the econometric model and correlation coefficient method and eliminated indicators with multiple coefficients. Meanwhile, as shown in Table 1, we used the theoretical analysis method and Delphi method to determine each index and obtain the 39 evaluation indexes.

2.4.2. Dimensionless Processing of Relevant Indexes

Range analysis was used to assess the dimensionless positive and negative indexes separately to eliminate the possible influence of their magnitude. The larger the value of the dimensionless index, the better the result, and it is recorded as a positive index. In this paper, an increase in the value of a single index has a catalytic effect on the tourism–economy–environment system. The equation is as follows:
x i j = x i j min x j max x j min x j .
From the point of view of the dimensionless index value, if the value is smaller, the performance is better. In this paper, an increase in the value of a single index has a dampening effect on the TEE system—that is, an inverse index. The equation is as follows:
x i j = max x j x i j max x j min x j .
In the formula x i j are the original value and standardized value of the j-th index of province i, respectively. max xj and min xj are the maximum and minimum values of the j-th index.
However, due to the existence of zeroes in the values after nondimensionalization, the entropy method cannot be used directly. To eliminate the influence on the measure, the normalization formula for the index after nondimensionalization is as follows:
y i j = x i j × 0.99 + 0.01 .

2.4.3. Determine Index Weights

After normalizing the index, the proportion calculation of the data is performed. The formula is:
p i j = y i j i = 1 n y i j , ( i = 1 , 2 , n , j = 1 , 2 , m )
A proportion matrix of the data can be built:
p i j = ( p i j ) max = ( p 11 p 12 p 1 m p 21 p 22 p 2 m p n 1 p n 2 p n m )
Then, by calculating the proportion of the data, the entropy value of the j-th index is calculated. The formula is:
e j = 1 ln n i = 1 n p i j ln p i j .
In the formula, ej is the entropy value of the j-th item, and pij represents the proportion of the j-th item in the i-th province to the overall index. In is the natural logarithm.
Then, we can calculate the weight of the j-th index. The formula is:
w j = 1 e j j = 1 n ( 1 e j ) .
In the formula, 1 − ej is the difference coefficient of the j-th index, and wj is the weight of the j-th index. Based on Equations (1)–(6), the weight calculation results are shown in Table 1.

2.4.4. Comprehensive Evaluation Model for Coordinated Development of TEE System

This paper is in accordance with the Fishbein–Rosenberg model. It evaluates the tree system of the TEE system in the Silk Road Economic Belt concerning the studies of Liao [13], Yang [35], and Zhang et al. [4], which are calculated as follows:
f ( x ) = i = 1 m w j x i
g ( y ) = i = 1 n w j y i
h ( z ) = i = 1 k w j z i
The explanation of these formulas are detailed in Table 2.

2.4.5. Coupling Coordination Degree Model of TEE System Coordinated Development

The coupling coordination degree model was originally a physical concept that included the coupling degree and the coupling coordination degree. The coupling degree refers to the strength of the interaction between the internal (external) parts of the system or elements. The larger the coupling degree value, the greater the correlation between the system or elements. The degree of coordination can reflect the degree of benign coupling between systems. The greater the value of coordination, the better the degree of coupling between systems or elements. The degree of coordinated development between two or more systems and the degree of benign coupling can be reflected in the coupling coordination degree. Benign coupling refers to the system or elements within (or external to) each other to promote coupling or vice versa (malignant coupling). Based on this, the degree of interaction between the index and the promotion or restriction relationship can be characterized. The coupling degree model of the TEE system in the Silk Road Economic Belt was built to measure the degree of interaction between the three systems.
(1) The coupling degree formula of the TEE system is as follows:
C = 3 f ( x ) g ( y ) h ( z ) 3 f ( x ) + g ( y ) + h ( z )
In the formula, f(x) represents the comprehensive development level of the tourism system, g(y) represents the comprehensive development level of the economic system, and h(z) represents the comprehensive development level of the economic system. C represents the coupling degree between the three systems. The value of C is between 0 and 1. The more significant the C, the higher the correlation degree between systems. Conversely, the smaller the value of C, the lower the degree of correlation.
(2) The coupling degree indicates the strength of interactions between systems and does not reflect the level of coordinated development. In order to further study the changes in the level of coordinated development between TEE systems, a coupling coordination degree model is established. The formula is as follows:
T = α f ( x ) + β g ( y ) + δ h ( z )
D = ( C × T )
In the formula, α, β, and δ are undetermined coefficients. T is the comprehensive evaluation index of the regional TEE system, C is the coupling degree, and D is the coupling coordination degree. The values of α, β, and δ are mainly based on the importance of tourism, the economy, and the environment in the process of regional development. According to the Delphi method, this paper argues that the contributions of the tourism subsystem, economic subsystem, and ecological subsystem are essentially the same in the sustainable development process of the Silk Road Economic Belt, so α = β = δ = 1/3. The distribution function of Liao [13] was used to determine the coupling coordination degree classification criteria, and this classification method has been widely used by the academic community (Table 3). This research applies its classification criteria to the Silk Road Economic Belt to classify the types of coupling coordination of the TEE system in the Silk Road Economic Belt.

3. Results and Analysis

3.1. Evaluation of the Development Level of Tourism, the Economy, and the Environment

3.1.1. Development Level of Tourism Subsystem

The data obtained after the standardization of Equations (1) and (2) were input into Equation (7) to calculate the development level evaluation values of the Silk Road Economic Belt tourism subsystem in Table 4.
Table 4 shows that the overall development of the tourism subsystem rose dramatically from 2015 to 2019. During this period, the tourism industry in the Silk Road Economic Belt provinces maintained steady growth. The tourism development level was significantly improved by 1.53-fold, from 0.2772 (2015) to 0.4241 (2019), with an average annual growth rate of 2.94%. Although the pace of development of the tourism subsystem in the provinces along the route varied, the ranking of the provinces was relatively stable. Despite the various development level and paces of the tourism subsystem in the Silk Road Economic Belt provinces, the provinces’ ranking remained relatively stable. In 2015, the development levels of the tourism subsystems in the nine provinces and regions, from high to low, were roughly as follows: Sichuan, Yunnan, Shaanxi, Chongqing, Guangxi, Xinjiang, Gansu, Qinghai, and Ningxia. In 2019, the ranking (from high to low) was: Sichuan, Yunnan, Shaanxi, Guangxi, Chongqing, Xinjiang, Gansu, Qinghai, and Ningxia. Only Guangxi and Chongqing changed positions over the five years.
As shown in Figure 3, the dynamic evolution of the tourism subsystem shows that, except for Ningxia, there was an upward trend in the whole tourism development curve. Among the nine provinces, the top three in terms of tourism development value were Sichuan, Yunnan, and Shaanxi, which reached 0.7289, 0.7080, and 0.6348, respectively, in 2019. On the contrary, the bottom three were Gansu, Qinghai, and Ningxia, which only reached 0.2481, 0.0693, and 0.0330, respectively. This indicates a significant gap in the level of tourism development between provinces. In terms of the growth of tourism, the top three are Guangxi, Yunnan, and Shaanxi, with average annual growth rates of 5.40%, 5.04%, and 4.47%, respectively. The bottom three were Gansu, Qinghai, and Ningxia, with average annual growth rates of 1.74%, 0.47%, and 0.10%, respectively.
Qinghai and Ningxia were the lowest among the nine provinces in terms of both tourism development level and growth rate. This is highly related to the proportion of tourism revenue in GDP in the tourism subsystem. The province with the highest proportion among the nine provinces, Guangxi, was as high as 48.22%, Qinghai only accounted for 18.91%, and Ningxia was even lower at 9.07%. In general, the development level of the tourism subsystem in the Silk Road Economic Belt provinces maintained a relatively stable growth trend in the past five years, but the interprovince distribution still varied greatly.

3.1.2. Development Level of Economic Subsystems

The data obtained after the standardization of Equations (1) and (2) were input into Formula 8 to calculate the development level evaluation values of the Silk Road Economic Belt economic subsystem in Table 5.
The trend represented in Table 5 indicates that the overall development level of the economic subsystem in the Silk Road Economic Belt was the same as that of the tourism subsystem, which rose significantly. From 2015 to 2019, the economic development of the Silk Road Economic Belt achieved considerable improvement. The average value increased from 0.2529 in 2015 to 0.4230 in 2019, and the development level increased by 1.67-fold. The average annual growth rate is 3.40%, much higher than the level of tourism development.
Observing temporal changes, the economic subsystem in each province and region remained at a consistent development pace, mainly concentrated between 0.0544 and 0.8439. Despite a trend of increasing year on year, there was still an unequal distribution of development between provinces, as shown in Figure 4. In 2015, the level of development of the economic subsystem in the nine Silk Road Economic Belt provinces, from highest to lowest, was roughly: Sichuan, Chongqing, Guangxi, Xinjiang, Yunnan, Gansu, Ningxia, and Qinghai. In 2019, the order, from high to low, was: Sichuan, Chongqing, Shaanxi, Guangxi, Yunnan, Xinjiang, Ningxia, Gansu, and Qinghai. Sichuan and Chongqing were firmly among the highest, while Qinghai was in last place. The ranking of other provinces all experienced some changes. Specifically, the province with the most significant growth rate was Sichuan, with an average annual growth rate of 7.27%. This indicates that Sichuan achieved a blistering pace of economic development during this period. Four provinces, Chongqing, Yunnan, Shaanxi, and Guangxi, experienced rapid growth. As an essential central city in China, Chongqing has a decided advantage in terms of economic development. Ningxia, Gansu, and Qinghai all experienced a relatively small increase. This indicates that some features could directly affect economic growth to a certain degree, such as geographic location, arable land, road conditions, and industrial development.

3.1.3. Development Level of the Environment Subsystem

The data obtained after the standardization of Equations (1) and (2) were input into Equation (9) to determine the development level evaluation values of the Silk Road Economic Belt environment subsystem in Table 6.
As shown in Table 6, the development level of the environment subsystem in the Silk Road Economic Belt provinces was mainly between 0.2972 and 0.6594, and the overall average was between 0.4067 and 0.4656. The average annual rate initially increased, followed by a decrease, and then rose again until 2019. It fluctuated at an average annual rate of 1.01%, from 0.4153 in 2015 to 0.4656 in 2019. During the study period, Sichuan showed a slow increase, while Guangxi, Chongqing, Yunnan, and Shaanxi all showed first decline and then growth. Sichuan demonstrated a gradual upward trend in development level. Guangxi, Chongqing, Yunnan, and Shaanxi had a tendency to decline at the beginning and rise later on. Gansu, Qinghai, Ningxia, and Xinjiang increased in the beginning, followed by a decline, then rose up until 2019, which is generally consistent with the development process of the overall average but varied in terms of growth rates and levels between provinces. In terms of the measurement of the development level of the environment, the ranking of the nine Silk Road Economic Belt provinces changed a fair bit, as shown in Figure 5.
In 2015, the ranking, from highest to lowest, was roughly as follows: Yunnan, Guangxi, Sichuan, Qinghai, Shaanxi, Chongqing, Xinjiang, Gansu, and Ningxia. In 2019, the ranking, from highest to lowest, was: Yunnan, Sichuan, Qinghai, Guangxi, Xinjiang, Chongqing, Shaanxi, Gansu, and Ningxia. It can be seen that, from 2015 to 2019, Yunnan was at the top of the list, while Ningxia was at the bottom. The rankings of most other provinces changed. In general, the rankings of Sichuan, Qinghai, and Xinjiang rose, while the rankings of Guangxi and Shaanxi dropped. More specifically, Yunnan had the highest evaluation value for the environment subsystem and the most significant growth rate, which increased from 0.5189 in 2015 to 0.6594 in 2019. This indicated that Yunnan had promoted its environmental governance in recent years. Thus, its environmental condition has significantly improved. There were significant increases in Xinjiang, Qinghai, Sichuan, and Gansu in recent years related to these provinces’ environmental protection policies and measures. Chongqing and Ningxia only experienced a slight increase, with less than 1% annual growth. A unique natural environment could increase the difficulty of environmental improvement. Ningxia is an arid region in the northwest, while Chongqing is located in the southwest region, which has a relatively stable environment.
In general, as the concepts of high-quality development and an ecological civilization have been proposed, the Silk Road Economic Belt has made progress toward protecting the environment. Protecting the environment has received unprecedented attention and opened up new opportunities for economic development and ecological governance. Despite the fluctuations in the evaluation value of the ecosystem subsystem, most of the provinces and regions still maintained an overall trend of growth. During the research period, while both Shaanxi and Guangxi were affected by natural disasters such as heavy rains, floods, and landslides, both the economies and tourism subsystems of the two provinces still showed growth. Economic development and tourism have also created greater pressure for environmental protection. Other provinces have shown a downward trend but are in a constant recovery situation. During the study period, despite the increase in the economic and tourism subsystems in Shaanxi and Guangxi, the ecological assessment value decreased. One reason for this is the influence of natural disasters such as heavy rainfall, floods, and landslides; another reason is the greater pressure brought about by the influence of the economy and tourism development on ecological protection. However, the ecosystem of the two provinces is in a development trend of recovery and rise.

3.1.4. Overall Development Level of TEE System

According to Equation (11), the comprehensive evaluation value of the TEE system can be calculated to reflect the differences in the comprehensive tourism–economy–environment development of the Silk Road Economic Belt between provinces.
As shown in Figure 6, the overall development level of the nine Silk Road Economic Belt provinces is gradually rising. The average comprehensive evaluation has increased by 0.1224, or 38.84%, from 0.3152 in 2015 to 0.4376 in 2019, with an average annual growth rate of 2.45%. The degree of increase in the four southwestern provinces is faster than in the five northwestern provinces. The province with the highest comprehensive evaluation index and the most significant rise province is Sichuan, which increased from 0.5026 in 2015 to 0.7097 in 2018, with an average annual rate of 4.14%. The provinces with larger increases are Yunnan, Shaanxi, Guangxi, Chongqing, and Xinjiang, and the provinces with smaller increases are Gansu, Qinghai, and Ningxia.
Using the Jenks Natural Breaks Classification Method, the overall development level values of the nine provinces can be classified into three classes: a low-level class, a medium-level class, and a high-level class [19]. In 2015, Guangxi, Chongqing, Sichuan, Yunnan, and Shanxi were in the medium-level development class, while Gansu, Qinghai, Ningxia, and Xinjiang were in the low-level class. There are no high-level provinces yet. In 2019, Sichuan and Yunnan graduated to the high-level development class, and Guangxi, Chongqing, Shaanxi, and Xinjiang advanced to the medium-level development class. However, Gansu, Qinghai, and Ningxia provinces remain in the low-level development class. This is closely related to the level of regional economic development. The gross regional product, GDP per capita, and proportion of the tertiary industry’s total value to GDP all represent the degree of regional economic development. This indicates that the higher the degree of economic growth, the more advanced the tertiary industry, and the higher the degree of coordinated development between tourism, the economy, and the environment.

3.2. Spatial and Temporal Characteristics Analysis of TEE System Coupling Coordination

3.2.1. Evolutionary Analysis of TEE System Coordination Degree

We can substitute f(x), g(y), and h(z) into Equations (10)–(12) to obtain the TEE system coordination level of the Silk Road Economic Belt in Table 7.
As shown in Table 7, from the perspective of evolution over time, the overall degree of coupling and coordination of the Silk Road Economic Belt is lower than the coupling degree. The coupling degree shows a fluctuating upward trend, and the degree of coupling and coordination shows a gradually increasing trend. The average value of the coupling degree is between 0.8902 and 0.9201, with an increase of 3.36% and an average annual growth rate of 0.6%. At the same time, the average degree of coupling and coordination is between 0.5251 and 0.6265, with an increase of 12.83% and an average annual growth rate of 1.35%.
From the point of view of the evolution over time of the coupling degree, from 2015 to 2019, most of the TEE system coupling degrees in the nine Silk Road Economic Belt provinces experienced a continuous increase, while only three provinces showed a decline. As shown in Figure 7, the coupling degree of the nine provinces fluctuated within a relatively stable range and is presented in two classes. One is in the low coupling stage, to which Ningxia and Qinghai belong, and the other class exhibits high-level coupling and includes the other seven provinces. In other words, Ningxia and Qinghai are still in a state of continuous improvement because of the weak correlation between the internal system between tourism, the economy, and the environment. the other seven provinces, such as Guangxi, Sichuan, and Chongqing, have a strong correlation between the three systems, which will bring about long-term effects and interactions in each system. The province with the most significant increase in coupling degree is Qinghai, which increased by 25.43% from 0.5511 in 2015 to 0.6954 in 2019. The provinces with larger increases are Ningxia, Gansu, Yunnan, and Guangxi, and the provinces with declining growth are Chongqing, Sichuan, and Shaanxi.
It can be seen that the coupling degree reflects the strength of the connection between the systems. Most Silk Road Economic Belt provinces have experienced development from low to high. Only Chongqing, Sichuan, and Shanxi have been in a high-level coupling class for the whole study period. In the process of development, the adjustment of each subsystem of tourism, the economy, and the environment could have some impact on the coupling degree. This indicates that the overall connection between the TEE system in Silk Road Economic Belt provinces is gradually increasing, and the system is becoming more interactive. Regional development is more critical to the overall level of development. The weakness of one area may affect the overall situation.
In terms of the evolution over time of the coupling and coordination degree, from 2015 to 2019, the level of TEE system coupling coordination degree in the nine Silk Road Economic Belt provinces increased year on year—the same as the trend of the overall average level. As shown in Figure 8, although the coupling and coordination value of Qinghai is relatively low and has been at the bottom of the Silk Road Economic Belt ranking, it is the province with the most significant increase in coupling coordination value, increasing by 23.13% from 0.325 in 2015 to 0.4229 in 2019. The provinces with larger growth rates are Guangxi, Sichuan, Yunnan, Gansu, Ningxia, and Xinjiang, which all had an increased rate of more than 10%. However, Chongqing and Shanxi only increased slightly, with the growth being lower than average. The coordination degree gives additional information about the comprehensive development level based on the coupling degree. Therefore, the development process of TEE system coordination and coupling degree in the Silk Road Economic Belt provinces is inconsistent, and the level of coordinated development could better reflect the development region. That being said, the coupling value and coupling coordination value in the nine Silk Road Economic Belt provinces are growing unevenly, and the differences between provinces are distinct.

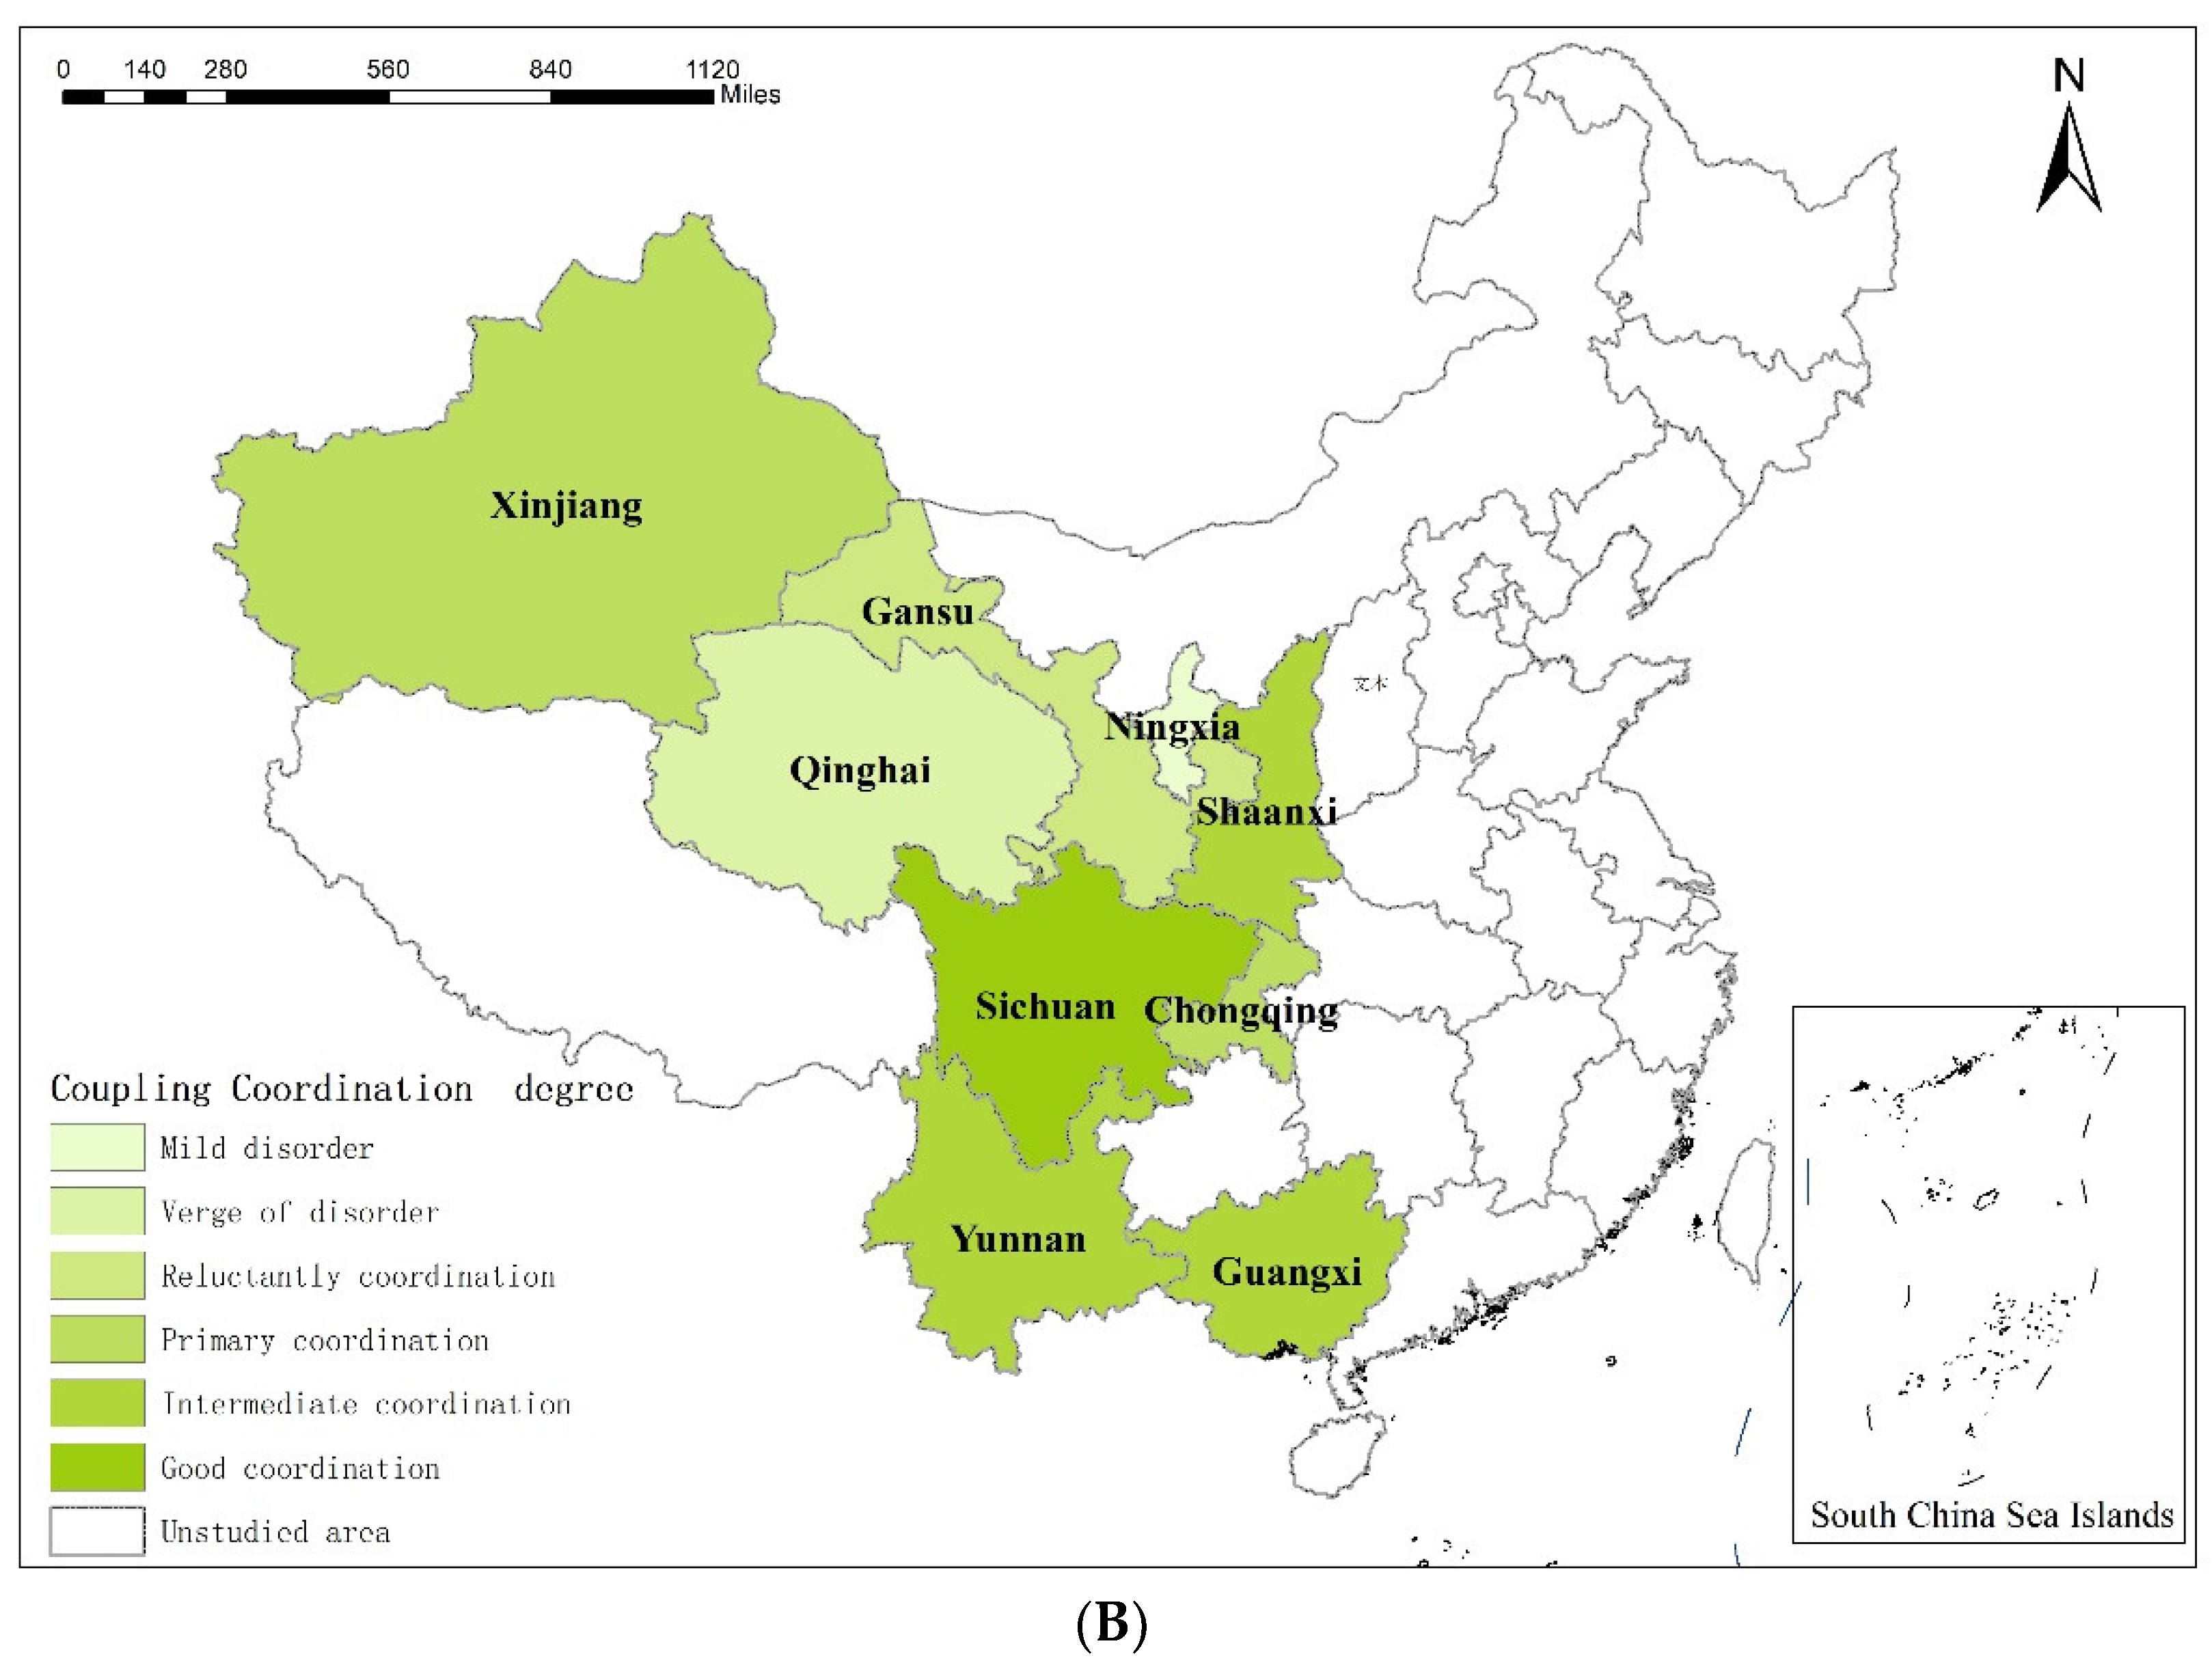
3.2.2. Spatial Pattern Analysis of TEE System Coordination Degree

Based on the calculated values of f(x), g(y), and h(z), and the coupling coordination degree D, the type of coordinated TEE system development in the Silk Road Economic Belt is derived from Table 3. ArcGIS10.2 software was used to depict the distribution of the coupling coordination degree of the TEE system in nine Silk Road Economic Belt provinces. It can be seen that the gradient difference in the level of coupling coordination is significant and always shows a spatial distribution pattern of increasing step by step from northwest to southwest.
As shown in Figure 9, in 2015, the coupling coordination degree of the TEE system in the Silk Road Economic Belt could be classified into four types: mild disorder, verge of disorder, primary coordination, and intermediate coordination. The coupling degree of 44.44% of provinces is at the level of disorder recession. Among them, Qinghai and Ningxia are at the stage of mild disorder, and Gansu and Xingjiang are on the verge of disorder. The percentage of coordinated development areas is 55.56%. Guangxi, Chongqing, Yunnan, and Shaanxi are in primary coordination, while only Sichuan is in intermediate coordination. In 2019, it could be divided into six types: mild disorder, verge of disorder, reluctantly coordination, primary coordination, intermediate coordination, and good coordination. The percentage of disorder recession areas decreased to 22.22% and was classified into two categories: mild disorder and verge of disorder. All provinces improved except for Ningxia, which remained at the stage of the mild disorder, and Qinghai, which was the only one on the verge of disorder. The proportion of coordinated development areas increased to 77.78%. Gansu developed into a reluctant coordination province, and Xinjiang and Chongqing became primary coordination provinces. Guangxi, Yunnan, and Shaanxi developed into intermediate coordination provinces, and Sichuan rose to be a good coordination province.
After five years of development, most provinces improved the coupling and coordination of the TEE system. Ningxia has the lowest coupling and coordination value among the nine provinces and is still in the stage of the mild disorder. This is closely related to Ningxia’s tourism, and the environmental subsystem has always been at the bottom of the ranking. Moreover, the growth rate of the three systems of the TEE system in Ningxia was the lowest for five years. Influenced by various factors, such as the weak momentum of tourism development, the coordinated development level of Ningxia’s TEE system is low. Due to the effect of various factors such as a poor foundation of regional economic level, limitations of land and traffic conditions, industrial pollution, and the lack of tourism development, Ningxia could not achieve high-level coordinated development of the TEE system.
Yunnan, Shanxi, Guangxi, Xinjiang, Gansu, and Qinghai have channeled great efforts into the tourism industry, constantly optimizing the relationship between tourism, the economy, and the environment, adjusting the industrial structure, and enhancing the internal correlation of the industrial chain. As a result, the coordinated development level of the TEE system has been continuously improved, and it has gradually surpassed the stage of disorder recession. Meanwhile, the degree of coordinated development has deepened. Chongqing has been in the primary coordination stage for five years. Two main factors led to this result. On the one hand, its economy, tourism, and environment are already at a relatively high level of development. On the other hand, due to the interaction of the economy, tourism, and the environment, its coordinated development degree only slightly increased during the study period.
As the “Land of Abundance,” Sichuan has been the province with the highest coordination development degree in the Silk Road Economic provinces. Sichuan has focused on building a strong economy, culture, and tourism, constantly improving regional ecocompensation mechanisms. The 10 cultural tourism products of the Tianfu tourism brand-name series have been implemented with high quality. As a result, the level of coordinated development of the TEE system in Sichuan has grown from medium to good coordination.

3.2.3. Analysis of Coupling Coordination Types and Constraining Factors

As shown in Table 8, during the analysis of TEE coordination in the nine Silk Road Economic Belt provinces, it was noteworthy that provinces with different types of coupling coordination have various constraints. The main constraints of good-coordination provinces are tourism and the environment, while the main constraints of provinces with intermediate coordination are the economy and the environment. Tourism and the environment are also the main constraints of primary coordination provinces. In contrast, tourism and the economy are the main constraints for the stage of reluctant coordination, verge of disorder, and mild disorder. Regarding restrictive factors, in 2015, the main factors for the TEE coordinated development of the Silk Road Economic Belt were tourism and the economy, which affected 66.67% of the regions; 22.22% of the area was restricted by the economy and the environment, while the restriction factors of tourism and the environment accounted for 11.11% of the area. In 2019, the area with tourism and the economy as constraints decreased to 44.44%, and the area where the constraints are the economy and the environment increased to 33.33%. The area restricted by tourism and the environment has risen to 22.22%. The main constraints in some areas have changed over the period of 2015–2019. For instance, the main factors in Yunnan and Guangxi have changed from tourism and the economy to the economy and the environment, and the main factors in Sichuan and Shaanxi have changed from the economy and the environment to tourism and the environment. Chongqing used to be restricted by tourism and environmental factors, but now the constraints have become the environment and the economy.

4. Discussion

4.1. Main Findings

This study established an evaluation index system of coupling and coordination degree for the TEE system in the Silk Road Economic Belt and built a comprehensive evaluation and coupling coordination degree model of the TEE system coordinated development. The development level of the three major subsystems and the coupling coordination between subsystems from 2015 to 2019 were measured, and the coordinated development of spatiotemporal characteristics was analyzed with ArcGIS. The results of this study are as follows:
(1)
The evaluation index system of the coupled TEE system coordination of the Silk Road Economic Belt includes the main factors affecting the region’s sustainable development. It breaks through the research that unilaterally explores the coordinated development relationship between tourism and the economy, the economy and the environment, and tourism and the environment.
(2)
The evaluation values of the three subsystems of tourism, the economy, and the environment in the Silk Road Economic Belt all show an increasing trend. Still, the growth rate of the tourism and economy subsystems is significantly higher than that of the environment subsystem. This complements the results of previous studies.
(3)
In terms of the evolution over time of the TEE system, the coupling and coordination value of the Silk Road Economic Belt provinces is lower than the coupling value. The mean of its coupling value is between 0.8902 and 0.9201, which belongs to the high-level coupling type, and the development is fluctuating. The development shows a slight upward trend, which indicates a strong connection between tourism, the economy, and the environment, and the three systems have a long-term effect and interaction. In the future development of the nine provinces of the Silk Road Economic Belt, it is necessary to take full advantage of tourism development, deeply explore the characteristic resources, protect the regional natural, cultural, and ecological environment, and promote the sustainable development of the regional economy.
(4)
In terms of the spatial pattern of the TEE system coupling coordination degree, the coordination degree shows that the overall level is relatively low, and the gradient difference is significant. Meanwhile, the four southwestern provinces are better than the five northwestern provinces, which means the polarization is apparent. Sichuan’s well-coordinated development state will allow it to create quality projects and develop high-quality products. The intermediate coordination stage of Guangxi, Yunnan, and Shaanxi should encourage them to fully exploit their unique resources, connect to the international market, and strengthen the leading role of tourism and the economy. Other provinces should base their decisions on their individual advantages to promote the relationships within the TEE system.
(5)
The constraints of different coupling and coordination types of provinces also vary, but the constraints of provinces of the same type are closely related. The main constraint on the coordinated development of the Silk Road Economic Belt is tourism and the economy.

4.2. Recommendations

Promoting high-quality, sustainable development is not only an inevitable requirement for the sustainable and healthy development of the Silk Road Economic Belt but also a demand to solve principal conflicts facing Chinese society and an inevitable requirement to follow the rules of economic and social development. From the analysis results, the development of the TEE system in the Silk Road Economic Belt is progressing steadily towards a trend of benign coupling. However, to more effectively promote the construction of the Silk Road Economic Belt, there is still much room for improvement, such as continuing the coordinated development of the three systems and achieving high-quality and sustainable development. Here are three main strategies.
(1)
Promoting economic development system reform. The development of the TEE system in the nine Silk Road Economic Belt provinces has been trending towards benign coupling. In contrast, tourism and the economy have become the main factors restricting the high-quality development of the Silk Road Economic Belt. Therefore, all provinces should take full advantage of national strategies such as the Belt and Road, Rural Revitalization, China’s Western Development, and China’s Development of an Ecological Civilization; focus on economic hinterlands; strengthen innovation-driven development; understand and follow the rules of the market; optimize development strategies; increase economic growth; and vigorously promote the transformation of the economic development level of the Silk Road Economic Belt from high-speed development to high-quality development.
(2)
Strengthening the supply-side structural reform of the tourism industry. First, there should be a focus on the characteristics of tourism resources in the Silk Road Economic Belt to vigorously develop emerging industries in sustainable tourism development. At the same time, the green transition and upgrading of the tourism industry structure should be promoted to stay on the path of a circular tourism economy. New tourism products should be developed, alongside the development of new industries, to enrich the “tourism+” product system, create characteristic tourism routes, innovate tourism digital marketing methods, explore innovative models of tourism industry integration, and comprehensively improve the quality of tourism development in the Silk Road Economic Belt. Third, “harmonious” development should be maintained as a goal. Based on the approval of the regional ecological environment carrying capacity, the approach, scale, and speed of tourism development should be reasonably positioned, tourism planning should be scientifically developed, and it should promote healthy economic development.
(3)
Strengthening environmental protection mechanisms. The Silk Road Economic Belt is a special spatial area integrating high-altitude areas, minority areas, old revolutionary areas, and ecotone. Despite the economic development and rapid growth of tourism boosted by the Belt and Road strategy, the development model of the economy and the environment is still in the extensive primary type, which is a development model that consumes a lot of energy and is passively dependent on natural resources. The quality of life is improving with the growth of the tourism industry and the economy. At the same time, the increasing frequency of human activities and the increasing demands on nature have had a significantly negative impact on the environment. The ability to recover from this negative impact is weak, and in turn, the ecosystem could have a significant effect on human activities. Therefore, the Silk Road Economic Belt provinces must focus on ecological protection while strongly supporting tourism to encourage the quality development of the regional economy. This is essential to promote coordination between the three subsystems.

4.3. Limitations and Future Work

In this paper, the data are from nine provinces of the Silk Road Economic Belt from 2015 to 2019. The COVID-19 pandemic has dramatically impacted global tourism and the economy since 2020, so the study does not include data from the last two years. On the other hand, the TEE system is complex and involves numerous inputs. There is no unified standard for the selection of an evaluation index for these three subsystems, so this study needs to be more comprehensive in terms of the index selection, and the quantitative study of the index also needs to be more in-depth. It can be seen that a more in-depth study of the coupled TEE system of the Silk Road Economic Belt is needed.

5. Conclusions

The sustainable development of humans and nature and the promotion of high-quality development are not only requirements for the sustainable development of the economy but also necessary to solve the major contradictions of a global society. Moreover, they are crucial to economic and social development laws. In the context of ecological civilization construction and economic development transformation and upgrading, high-quality tourism development and economic and environmental protection in the Silk Road Economic Belt have become issues of great importance to the government and academia. From the findings of this study, the development of tourism, the economy, and the environment in the nine provinces of the Silk Road Economic Belt shows benign coupling, but environmental protection is lagging compared with the rapid development of tourism and the economy. The main constraints on the coordinated development of the Silk Road Economic Belt, therefore, are tourism and the economy. For sustainable development, the tourism industry, which is highly dependent on resources and the environment, needs to attach importance to protecting the environment in the Silk Road Economic Belt. It will promote tourism and economic development by protecting the environment and can further protect and improve the environment through tourism and economic development. Therefore, the TEE system would be in a state of high-quality coordination, and the protection of the environment and high-quality, sustainable development of tourism and the economy would be promoted.

Author Contributions

Z.Z. and L.L. drafted the manuscript. J.Q. conceptualized and designed the study. Z.Z. contributed to theories and analysis. Y.F. revised the manuscript. All authors have read and agreed to the published version of the manuscript.

Funding

The research was funded by the Fundamental Research Funds for the Central Universities “Study on the spatial and temporal pattern and evolution of the effect of agro-tourism integration in Tibetan-related areas on the western Sichuan plateau” (Funder: Southwest Minzu University; Funding number: 2021SYYXSB24). It is also funded by the “Study on High Quality Development of Community Ecotourism in Giant Panda National Park project” of National Park Research Center 2021 Projects (Funder: Chengdu University of Technology; Funding number: GJGY2021-ZC001).

Institutional Review Board Statement

Not applicable.

Informed Consent Statement

Not applicable.

Data Availability Statement

The data presented in this study are openly available in China Statistical Yearbook (2016–2020). http://www.stats.gov.cn/tjsj./ndsj/ (accessed on 4 August 2022), Guangxi Statistical Yearbook (2016–2020). http://tjj.gxzf.gov.cn/tjsj/tjnj/ (accessed on 3 August 2022), Chongqing Statistical Yearbook (2016–2020). http://tjj.cq.gov.cn/zwgk_233/tjnj/ (accessed on 3 August 2022), Sichuan Statistical Yearbook (2016–2020). http://tjj.sc.gov.cn/scstjj/c105855/nj.shtml (accessed on 4 August 2022), Yunnan Statistical Yearbook (2016–2020). http://stats.yn.gov.cn/tjsj/tjnj/ (accessed on 4 August 2022), Shaanxi Statistical Yearbook (2016–2020). http://tjj.shaanxi.gov.cn/tjsj/ndsj/tjnj/ (accessed on 6 August 2022), Gansu Development Yearbook (2016–2020). http://tjj.gansu.gov.cn/tjj/c109464/info_disp.shtml (accessed on 4 August 2022), Qinghai Statistical Yearbook (2016–2020). http://tjj.qinghai.gov.cn/tjData/qhtjnj/ (accessed on 4 August 2022), Ningxia Statistical Yearbook (2016–2020). http://tjj.qinghai.gov.cn/tjData/qhtjnj/ (accessed on 5 August 2022), Xinjiang Statistical Yearbook (2016–2020). http://tjj.xinjiang.gov.cn/tjj/zhhvgh/list_nj1.shtml (accessed on 4 August 2022).

Conflicts of Interest

The authors declare no conflict of interest.

References

  1. Ting, W.Y. Research on the Coordinated Development of the coupling of Tourism Economy and Ecological Environment in Zhejiang. Hunan and Yunnan. Master’s Thesis, Beijing Forestry University, Beijing, China, 2020. [Google Scholar]
  2. Lin, C.Y.; Yang, Y.E.; Malek, K.; Adam, J.C. An investigation of coupled natural human systems using a two-way coupled agent-based modeling framework. Environ. Model. Softw. 2022, 155, 105451. [Google Scholar] [CrossRef]
  3. Jiang, H.; Simonovic, S.P.; Yu, Z. ANEMI_Yangtze v1.0: A coupled human–natural systems model for the Yangtze Economic Belt-model description. Geosci. Model Dev. 2022, 15, 4503–4528. [Google Scholar] [CrossRef]
  4. Zhang, Y.P.; Wahap, H.; Dang, J.H.; Deng, B.S.; Wang, R. Analysis of the coupled tourism-economy-ecology development in Turpan. Geography 2014, 29, 140–145. [Google Scholar]
  5. Shu, J.L.; Tong, W. An empirical study on the coordinated development of tourism-economy-ecological environment coupling in coastal cities. Ocean. Univ. China 2017, 6, 43–49. [Google Scholar]
  6. Liu, S.A.; Wan, Y.L. Ecotourism research progress: A Biblio-metric analysis during 1990–2016. SAGE Open 2020, 10, 205–215. [Google Scholar] [CrossRef]
  7. Wall, G.; Wright, C. The Environmental Impact of Outdoor Recreation; University of Waterloo: Waterloo, ON, Canada, 1977; pp. 237–241. [Google Scholar]
  8. Mbaiwa, J.E. The socio-economic and environmental impacts of tourism development on the Okavango Delta, North–Western Botswana. J. Arid. Environ. 2003, 54, 447–467. [Google Scholar] [CrossRef]
  9. Dilek, S. The relationship tourism, economic growth and environmental quality: Panel data analysis. Ktisadi Ye-Nilik Derg. 2018, 3, 123–132. [Google Scholar]
  10. Petrosillo, I.; Zurlini, G.; Grato, E.; Zaccarelli, N. Indicating fragility of socio-ecological Tourism-Based Systems. Ecol. Indic. 2006, 6, 104–113. [Google Scholar] [CrossRef]
  11. Lacitignola, D.; Petrosillo, I.; Cataldi, M.; Zurlini, G. Modelling socio-ecological tourism-based systems for sustainability. Ecol. Model. 2007, 206, 191–204. [Google Scholar] [CrossRef]
  12. Shi, H.Y. Research on the prediction and regulation of coordinated development of urban environment and economy in Guangzhou. Geogr. Sci. 1994, 14, 136–143. [Google Scholar]
  13. Chong, B.L. Quantitative evaluation of environmental and economic coordination development and its classification system. Trop. Geogr. 1999, 19, 171–177. [Google Scholar]
  14. Ying, X.X. Study on the coordination of tourism economy and ecological environment based on coupled model. J. Commer. Econ. 2014, 6, 138–140. [Google Scholar]
  15. Sha, Y.S.; Hui, Q.Y.; Jing, D.W. Comparison on coupling relationship between tourist economy and ecological environment in China’s ten major urban agglomerations. Stat. Decis. 2017, 22, 131–134. [Google Scholar]
  16. Sheng, W.W.; Dong, L.Z. Study on the coupled and harmonious development of ecological environment and regional economy in anhui province. J. Shandong Agric. Eng. Univ. 2020, 37, 59–65. [Google Scholar]
  17. Yang, G.X.; Qing, M.X.; Shan, D.Z.; Zhong, M.Q.; Yi, L.B. Coordination effect and dynamic relationship of urban ecological environment and tourism economy: A case study of Qujing. Econo. Geo. 2020, 40, 231–240. [Google Scholar]
  18. Ting, S.; You, L.S. A Study on the coordinative development of population-economy-eco-environment coupling. J. Hebei Univ. Environ. Eng. 2019, 29, 60–63. [Google Scholar]
  19. Hong, C.S.; Cheng, G.; Jie, Z.Z. Research on the coordinated development of population-resources-environment-economy in western China from the perspective of space-time evolution. Eco. Econo. 2022, 38, 168–175. [Google Scholar]
  20. Feng, L.G.; Jing, W.J.; Ming, Y.J.; Ming, C.G. Analysis and prediction of the coupled and coordinated development of resource utilization-ecological environment-economic growth: A case study of provinces along the Silk Road Economic Belt. Eco. Econo. 2021, 37, 191–200. [Google Scholar]
  21. Yong, M.; Xia, L.L.; Jie, R. Coordination development research among the tourism economy-traffic condition-ecological environment in Shengnongjia Forest District. Econo. Geo. 2017, 37, 215–220, 227. [Google Scholar]
  22. Ying, X.; Ling, L.C. Coordinated of tourism-economy-ecological system in Zhangjiajie City. China Popul. Resour. Environ. 2014, 24, 246–250. [Google Scholar]
  23. Jie, L.K. Research on Coupling and Coordinated Development of Tourism, Urbanization and Ecological Environment in Henan Province. Master’s Thesis, Henan Normal University, Xinxiang, China, 2019. [Google Scholar]
  24. Hui, M.W. Study on the Coupling and Coordinated Development of Tourism Economy and Ecological Environment in Yishui County, Shandong Province. Master’s Thesis, Chengdu University of Technology, Chengdu, China, 2019. [Google Scholar]
  25. Yi, L.B.; Zhong, M.Q.; Yang, G.X.; Meng, L.M. Study on spatial and temporal differences of coupling coordination between ecological civilization construction and tourism industry in Yunnan province. Resour. Dev. Mark. 2018, 34, 391–396. [Google Scholar]
  26. Xiao, S.; Ying, L. Analysis on coupling relationship and coordinated development of tourism economy and ecological environment in Heilongjiang. J. Xinjiang Univ. (Nat. Sci. Ed. Chin. Engl.) 2018, 35, 228–234. [Google Scholar]
  27. Long, X.Y. Study on the Coupling and Coordination of Tourism Economic Development and Ecological Environmental Protection in Southwest China. Master’s Thesis, Guizhou University of Finance & Economics, Guiyang, China, 2022. [Google Scholar]
  28. Ran, H.J.; Juan, Y. The coordinated development of tourism economy and ecological environment in five northwest provinces (regions). Tour. Res. 2021, 13, 85–98. [Google Scholar]
  29. Zi, C.Y.; Jing, R.; Wei, L.X. Research on evaluation and driving force factors of economic green growth in three northeast provinces of China. Eco. Econo. 2019, 35, 50–56. [Google Scholar]
  30. Wei, W. Evaluation of tourism-economy-ecological environment coordination development in Yangtze River Economic Zone and its influencing factors. J. Cap. Norm. Univ. (Nat. Sci. Ed.) 2018, 39, 81–88. [Google Scholar]
  31. Nian, T.J.; Xiang, M.Z.; Jie, Y. Evaluation of the coupling coordination degree between tourism economy and ecological environment in the Yellow River Basin and the influencing factors. Resour. Dev. Mark. 2020, 36, 591–598. [Google Scholar]
  32. Xia, W.Y.; Yu, C.B.; Lei, Z. Coupling and coordination situation and driving factors of social economy and eco-environment in Yellow River basin. Bull. Soil Water Conserv. 2021, 41, 240–249. [Google Scholar]
  33. Zi, T.; Bo, S.C.; Na, Z. Spatial-temporal coupling of tourism economy and ecological environment in Heilongjiang province: From the perspective of “Harmonious Coexistence between Human Being and Nature”. Commer. Res. 2018, 1, 1–9. [Google Scholar]
  34. Jing, Z.; Juan, X.D. Study on the coordinated development of ecological environment and tourism economy in Shaanxi province. J. Shanxi Norm. Univ. (Nat. Sci. Ed.) 2020, 34, 38–43. [Google Scholar]
  35. Zhi, Y.Y.; Jun, L. A comprehensive evaluation study on the development of tourism-ecology-economy system in Inner Mongolia. J. Beijing Second. Foreign Lang. Inst. 2010, 3, 73–78. [Google Scholar]
  36. Xia, Z.; Yi, H.L. Analysis of the coupled tourism-economy-ecological environment coordinated development in Guangdong Province. Trop. Geogr. 2012, 32, 568–574. [Google Scholar]
  37. Lan, Z.H.; Ping, Y.X.; Fang, H.; Hui, S.; Rong, W.C.; Jiao, G.J. Analysis and forecast of coupling situation among tourism industry-economic development-ecological environment in Xinjiang. Arid. Land Geogr. 2020, 43, 1146–1154. [Google Scholar]
  38. Elgazzar, R.F.; El-Gazzar, R. Smart Cities, Sustainable Cities, or Both?—A Critical Review and Synthesis of Success and Failure Factors. In Proceedings of the 6th International Conference on Smart Cities and Green ICT Systems, Porto, Portugal, 22–24 April 2017; pp. 250–257. [Google Scholar]
  39. Elkington, J. Accounting for the Triple Line. Meas. Bus. Excell. 1998, 2, 18–22. [Google Scholar] [CrossRef]
  40. Taghvaee, V.M.; Nodehi, M.; Saber, R.M.; Mohebi, M. Sustainable development goals and transportation modes: Analyzing sustainability pillars of environment, health, and economy. World Dev. Sustain. 2022, 1, 100018. [Google Scholar] [CrossRef]
  41. Li, Q.; Wei, C.X.; Qiao, X.R. Study on the coordination degree of coupling industrialization, urbanization and agricultural modernization in Chinese regions and its influencing factors. Inq. Into Econ. Issues 2012, 11, 10–17. [Google Scholar]
  42. Ping, C. The selection of coordinative development pattern between economy and Ecological Environment. Qilu J. 2005, 4, 154–157. [Google Scholar]
  43. Yan, Z.; Hua, X.J.; Gang, Z. Construction and empirical study on the evaluation model of tourism-economy-ecosystem sustainable and coordinated development-Guangxi Guilin as an Example. Tour. Sci. 2008, 22, 31–35. [Google Scholar]
  44. Feng, C. Coordinated development degree of tourism economy and ecological environment in Shanghai. China Popul. Resour. Environ. 2008, 18, 64–69. [Google Scholar]
  45. Bin, L.Y.; Dong, L.R.; Feng, S.X. Coupling degree of urbanization and ecological environment in China. J. Nat. Resour. 2005, 20, 105–111. [Google Scholar]
  46. Yan, H.H.; Yan, Y.; Cheng, H.Z. Model and empirical study on measuring the internationalization level of Silk Road Economic Belt cities. Manag. World 2018, 8, 180–181. [Google Scholar]
  47. Wu, S.; Liu, L.; Liu, Y.; Gao, J.; Dai, E.; Feng, A.; Wang, W. The Belt and Road: Geographical pattern and regional risks. J. Geogr. Sci. 2019, 29, 483–495. [Google Scholar] [CrossRef] [Green Version]
  48. Dong, S.G. A Study on the Coupling Relationship between Provincial Innovation Capability and Employment Quality in Silk Road Economic Belt. Master’s Thesis, Shihezi University, Shihezi, China, 2019. [Google Scholar]
  49. Chuang, L.F.; Xue, G.C.; Long, W.L. Theory of coupling circle between urbanization and ecological environment and regulation of coupler. J. Geogr. 2019, 12, 2529–2546. [Google Scholar]
  50. Yao, B.L.; Ren, D.L.; Xue, F.S. Linkage analysis of regional urbanization and ecological environment coupling in China. J. Geogr. 2005, 2, 237–247. [Google Scholar]
  51. Yan, J.L.; Jing, L.; Cui, H.; Yuan, F. Evolution of the coupling relationship between regional development intensity and resource and environment level in China. Geogr. Res. 2013, 3, 507–517. [Google Scholar]
  52. Cui, N. Study on the Coordination of Population, Economy and Environment Coupling in Yangtze River Economic Belt. Master’s Thesis, Minzu University of China, Beijing, China, 2020. [Google Scholar]
Figure 1. Tourism–economy–ecological environment coordination mechanism process.
Sustainability 14 13838 g001
Figure 2. Location map of China’s Silk Road Economic Belt Provinces.
Sustainability 14 13838 g002
Figure 3. Development level evaluation value of Silk Road Economic Belt tourism subsystem.
Sustainability 14 13838 g003
Figure 4. Evaluation value of the development level of the economic subsystem in the Silk Road Economic Belt.
Sustainability 14 13838 g004
Figure 5. Evaluation value of the development level of the Silk Road Economic Belt environment subsystem.
Sustainability 14 13838 g005
Figure 6. Silk Road Economic Belt TEE system comprehensive evaluation value.
Sustainability 14 13838 g006
Figure 7. Coupling degree value of TEE System of Silk Road Economic Belt.
Sustainability 14 13838 g007
Figure 8. Coupling and coordination value of TEE system in the Silk Road Economic Belt.
Sustainability 14 13838 g008
Figure 9. Distribution of TEE system coupling coordination in the Silk Road Economic Belt. (A) Distribution of TEE system coupling coordination in the Silk Road Economic Belt in 2015. (B) Distribution of TEE system coupling coordination in the Silk Road Economic Belt in 2019.
Sustainability 14 13838 g009aSustainability 14 13838 g009b
Table 1. The evaluation index system and the weights in the tourism–economy–environment system.
System SubsystemIndex LevelUnitWeightNature of Index
Tourism–economic–ecological environmentTourism subsystemTotal tourism revenue as a percentage of GDP%0.0486Positive
Domestic tourism revenueBillion0.0946Positive
Foreign exchange earnings from tourismMillion USD0.1128Positive
Tourism catering revenueBillion0.1303Positive
Tourism accommodation incomeBillion0.0855Positive
Per capita spending of overnight visitorsRMB/person day0.0394Positive
Number of domestic touristsMillion people0.0812Positive
Number of inbound touristsMillion people0.1299Positive
Ticket revenueBillion0.0739Positive
Passenger turnoverPeople km0.0574Positive
Number of A-class tourist attractionsPCS0.0526Positive
Number of travel agenciesPCS0.0451Positive
Number of star-rated hotelsPCS0.0485Positive
Economic subsystemGDP per capitaCNY0.048Positive
Primary industry value addedBillion0.0914Positive
Secondary industry value addedBillion0.0982Positive
Tertiary industry value addedBillion0.0885Positive
Local general public budget revenueBillion0.0788Positive
Total retail sales of social consumer goodsBillion0.1018Positive
Total post and telecommunications businessBillion0.129Positive
Average annual wage of employees on duty in all social unitsCNY0.045Positive
Annual disposable income per inhabitantCNY0.0345Positive
Unemployment rate of urban population%0.0466Negative
Total imports and exports as a percentage of GDP%0.062Positive
Existing built-up areaSquare kilometers0.0661Positive
Square kilometers with road areaKPE0.1102Positive
Ecological subsystemComprehensive utilization of industrial solid wasteMillion tons0.0962Positive
Industrial pollution control investmentMillion CNY0.0899Positive
Natural disaster damageBillion0.0256Negative
Harmless disposal rate of domestic waste%0.0162Positive
Fertilizer application per unit of arable land areaTons/hectare0.0674Negative
Sewage treatment rate%0.0191Positive
Greening coverage of built-up areas%0.0464Positive
Green space per capitaSquare meter0.0495Positive
Average regional noisedB(A)0.0444Negative
Forest cover%0.1427Positive
The proportion of nature reserves in the area of the jurisdiction%0.1957Positive
Natural water reserves in the territoryMillion cubic Meter0.1468Positive
Number of days to meet the annual ambient air quality standardsDay0.0601Positive
Table 2. Explanation of the formulas.
SymbolExplanation
w j The weight of each tourism system index
w j The weight of each economic system index
w j The weight of each ecological environment system index
x i The normalized value of each tourism system index
y i The normalized value of each economic system index
z i The normalized value of each ecological environment system index
f ( x ) The comprehensive evaluation value of the tourism system
g ( y ) Indicates the comprehensive evaluation value of the economic system
h ( z ) Indicates the comprehensive evaluation value of the ecological environment system
The values obtained for f(x), g(y), and h(z) are all between 0 and 1.
Table 3. Coupling coordination level classification system and its discriminatory criteria table.
Disorder Recession TypeCoordination Develop
D-Value Interval of Coupling Coordination DegreeCoordination LevelD-Value Interval of Coupling Coordination DegreeCoordination Level
0–0.10Extreme disorder0.51–0.60Reluctantly coordination
0.11–0.20Severe disorder0.61–0.70Primary coordination
0.21–0.30Moderate disorder0.71–0.80Intermediate coordination
0.31–0.40Mild disorder0.81–0.90Good coordination
0.41–0.50Verge of disorder0.91–1.00High-quality coordination
Table 4. The development level evaluation values of the Silk Road Economic Belt tourism subsystem.
Province20152016201720182019
Guangxi0.33730.38220.44150.52790.6072
Chongqing0.35040.39870.41280.41970.4618
Sichuan0.53760.58090.59090.64730.7289
Yunnan0.45600.51010.58260.65130.7080
Shaanxi0.41120.45860.51450.58970.6348
Gansu0.16110.17750.19860.22010.2481
Qinghai0.04560.03970.05710.06710.0693
Ningxia0.02800.03460.03490.03900.0330
Xinjiang0.16770.18590.20580.23870.3255
Average Value0.27720.30760.33760.37790.4241
Table 5. The development level evaluation values of the Silk Road Economic Belt economic subsystem.
Province20152016201720182019
Guangxi0.32520.37030.41920.45850.4963
Chongqing0.40080.44510.49180.55680.6239
Sichuan0.48040.55820.64490.74250.8439
Yunnan0.22020.26930.31020.35200.4283
Shaanxi0.31290.35870.41580.47480.5144
Gansu0.14300.17200.17310.19240.2004
Qinghai0.05440.08820.10030.12060.1492
Ningxia0.11350.14550.16450.18090.2015
Xinjiang0.22580.26040.28590.31830.3496
Average Value0.25290.29640.33400.37740.4230
Table 6. The development level evaluation values of the Silk Road Economic Belt environment subsystem.
Province20152016201720182019
Guangxi0.51550.47920.44510.46140.4878
Chongqing0.38200.37800.38270.39850.4055
Sichuan0.48970.49610.52160.52710.5564
Yunnan0.51890.50310.49110.47470.6594
Shaanxi0.38990.34650.29720.31230.3880
Gansu0.32730.34980.35700.33600.3839
Qinghai0.47490.48750.48260.50720.5528
Ningxia0.31040.36460.31900.32700.3452
Xinjiang0.32930.37180.36390.38920.4111
Average Value0.41530.41960.40670.41480.4656
Table 7. TEE system coordination level of the Silk Road Economic Belt.
Province20152016201720182019
Coupling DegreeCoupling Coordination DegreeCoupling DegreeCoupling Coordination DegreeCoupling DegreeCoupling Coordination DegreeCoupling DegreeCoupling Coordination DegreeCoupling DegreeCoupling Coordination Degree
Guangxi0.97750.61960.99330.63860.99970.65960.99790.69390.99500.7265
Chongqing0.99850.61420.99770.63740.99440.65320.98900.67330.98350.6992
Sichuan0.99880.70850.99780.73750.99620.76390.99030.79540.98560.8364
Yunnan0.93760.61120.95990.64060.96690.66790.96910.69100.97690.7647
Shaanxi0.99320.60730.99210.62040.97540.63170.96720.66620.98020.7087
Gansu0.93170.44280.94470.46920.94970.48030.97120.49220.96310.5170
Qinghai0.55110.32500.58280.34580.65770.37460.69120.40010.69540.4229
Ningxia0.66100.31550.67440.34990.70810.34980.72470.36350.68250.3631
Xinjiang0.96240.48150.96100.51190.97370.52700.98050.55610.99520.6003
Average Value0.89020.52510.90040.55010.91350.56760.92010.59240.91750.6265
Table 8. Types and constraints of coordinated TEE development in the Silk Road Economic Belt.
Province 20152019
f(x)g(y)h(z)Coupling Coordination ValueCoordination TypeConstraintsf(x)g(y)h(z)Coupling Coordination ValueCoordination TypeConstraints
Sichuan0.53760.48040.48970.7085Intermediate coordinationEconomy, Ecological environment0.72890.84390.55640.8364Good coordinationTourism, Ecological environment
Guangxi0.33730.32520.51550.6196Primary coordinationTourism, Economy0.60720.49630.48780.7265Intermediate coordinationEconomy, Ecological environment
Chongqing0.35040.40080.38200.6142Primary coordinationTourism, Ecological environment0.46180.62390.40550.6992Primary coordinationTourism, Ecological environment
Yunnan0.45600.22020.51890.6112Primary coordinationTourism, Economy0.70800.42830.65940.7647Intermediate coordinationEconomy, Ecological environment
Shaanxi0.41120.31290.38990.6073Primary coordinationEconomy, Ecological environment0.63480.51440.38800.7087Intermediate coordinationEconomy, Ecological environment
Xinjiang0.16770.22580.32930.4815Verge of disorderTourism, Economy0.32550.34960.41110.6003Primary coordinationTourism, Economy
Gansu0.16110.14300.32730.4428Verge of disorderTourism, Economy0.24810.20040.38390.517Reluctantly coordinationTourism, Economy
Qinghai0.04560.05440.47490.325Mild disorderTourism, Economy0.06930.14920.55280.4229Verge of disorderTourism, Economy
Ningxia0.02800.11350.31040.3155Mild disorderTourism, Economy0.03300.20150.34520.3631Mild disorderTourism, Economy
Note: The provinces are listed in descending order of coupling coordination. Among them, f(x), g(y), and h(z) denote the comprehensive evaluation indices of tourism, economic, and environmental systems, respectively. The two smaller of the three are the constraints with reference to the studies of Liu [51], Nan [52], and other scholars.
Publisher’s Note: MDPI stays neutral with regard to jurisdictional claims in published maps and institutional affiliations.

