Article

Microstructure and Tensile Strength of an Al-Si-Fe-V Alloy: Vanadium and Solidification Thermal Parameters as Recycling Strategies

1
Department of Manufacturing and Materials Engineering, University of Campinas–UNICAMP, Campinas 13083-860, SP, Brazil
2
Federal Institute of Education, Science and Technology of São Paulo, IFSP, Bragança Paulista 12903-000, SP, Brazil
*
Author to whom correspondence should be addressed.
Sustainability 2022, 14(21), 13859; https://doi.org/10.3390/su142113859
Submission received: 5 October 2022 / Revised: 21 October 2022 / Accepted: 23 October 2022 / Published: 25 October 2022
(This article belongs to the Section Sustainable Engineering and Science)

Abstract

:
One of the greatest challenges facing the recycling of Al-based alloys is handling Fe incorporation. The formation of Fe-rich phases has negative impacts on the mechanical behavior and may limit the usage of recycled alloys. In this context, V addition is regarded as a potential solution since it can inhibit the formation of such phases. However, the microstructure evolution of V-modified Al-based alloys is not fully understood, especially when different solidification cooling regimes are considered. Thus, this work investigates the microstructure and tensile properties of an Al-7Si-1Fe [wt.%] alloy modified with a 0.5 wt.%V addition. Directionally solidified samples were produced and subjected to microstructure analysis and tensile tests. It was found that the addition of V reduces the fraction of β-AlFeSi particles because of the formation of new V-rich phases. This was determinant to improve the tensile properties for faster cooling conditions during solidification. For moderate and slow cooling regimes, however, the V-containing alloy had a less favorable mechanical behavior due to the formation of larger β-AlFeSi particles. Finally, quantitative relationships are proposed for the prediction of tensile properties from microstructural parameters using multiple linear regression analysis.

1. Introduction

With each passing year, the recycling of Al-based alloys is getting even more attractive. From a techno-economic-environmental perspective, such practice is extremely advantageous. To begin with, the production of recycled alloys is considerably less expensive and requires less energy than that of primary alloys [1]. In addition, there is the benefit of avoiding discarding such material as waste. This is therefore an area of particular interest for Al-Si alloys. Due to their superior mechanical strength, excellent thermal stability, and strong corrosion resistance, Al-Si alloys are used in a wide range of engineering applications [2]. Prime examples of automotive parts made of such alloys are pistons and break cylinders [3]. Unfortunately, some Fe amounts (~0.5–2 wt.%) are inevitably incorporated during the recycling of these alloys, which impacts the mechanical behavior negatively.
Dealing with Fe incorporation during recycling can be quite challenging, especially because Fe contamination leads to the formation of intermetallic compounds (IMCs) that may limit the usage of recycled Al-Si alloys. According to Kashyap et al. [4], a small Fe amount of 0.08 wt.% is already enough to compromise the mechanical behavior of an Al-7Si [wt.%] alloy. They also claimed that the elongation decreases mainly due to the formation of β-AlFeSi IMCs (which are brittle and hard). Because of their needle-like morphology, such IMCs are characterized by stress concentration at their sharp points, which serve to nucleate cracks [5]. That is why β-AlFeSi IMCs are highly undesirable when a combination of high tensile strength with good ductility is required. β-AlFeSi IMCs also promote microcracks and higher wear [6].
One of the most important alternatives to inhibit the formation of β-AlFeSi IMCs in recycled Al-Si alloys is proper chemical modification. Through the incorporation of strategic alloying elements, proper microstructural changes can be induced aiming at improving the microstructure features and mechanical properties. For instance, Tiryakioǧlu et al. [5] proved that the addition of Mn, Cr, Sr, Be, Co, Mg, Li, and other transition metals can be used for such a purpose. Wan et al. [7] observed that an addition of 0.3 wt.%Y is capable to promote β-AlFeSi particles with a lower size in an Al-7Si-0.3Mg-1Fe [wt.%] alloy. Tillová et al. [8] found that additions of Sr until 0.05 wt.% can increase the absorbed energy in impact tests.
Microstructure features and mechanical properties of an Al-9Si-0.8Fe [wt.%] alloy alloyed with different Mn contents (0.1, 0.2, 0.4, and 0.7 wt.%) were analyzed by Baldan et al. [9]. They noted that the fraction of the α-AlFeSi phase—less deleterious than the β-AlFeSi phase—increased with increasing Mn content. On the other hand, the mechanical properties remained almost the same for the entire range of Mn content. Canté et al. [10] investigated the role of Ni in the microstructure and tensile properties of a Fe-contaminated Al-9 wt.%Si alloy. They observed that the addition of Ni promoted lower fraction and more compacted Fe-bearing IMCs, reducing the deleterious effect on the alloy’s tensile strength.
Another potential mitigation of the negative impacts of Fe-rich phases consists of the addition of Vanadium (V). Even small V amounts (<1 wt.%) can be beneficial to the mechanical properties and thermal conductivity, as reported by Qin et al. [11], for an Al-Si-Cu-Mg-Fe alloy. They observed that the incorporation of V decreased the length of the needle-like β-AlFeSi phase and promoted the formation of short rod-like α-Fe phase which led to improved mechanical properties and thermal conductivity. Elongation was found to be the most affected property, increasing up to 70% in relation to the unmodified alloy.
Lin et al. [12] studied the formation of Fe-rich IMCs and mechanical properties of V-modified A356 cast alloys with 1.5 wt.%Fe. According to them, a proper V content can be beneficial for enhancing the mechanical behavior of A356 cast alloys contaminated with high Fe content. Apparently, V content had no influence on the α-Al grain size. On the other hand, it did induce the formation of Chinese script or block α-Fe phases, refined needle-like β-AlFeSi (Al5FeSi), and reduced porosities. The authors also argue that care should be taken with excessive amounts of V, since it deteriorates mechanical properties of alloys due to the formation of VSi2 particles, large sized iron-rich IMCs, and increased porosities. However, the effects of the addition of V are not fully understood, especially considering different cooling regimes during solidification.
Additionally, recent works have focused on more alternatives to improve the mechanical properties of Fe-containing Al-Si-V alloys. Sahoo and Pathak [13], for example, studied the effects of thermo-mechanical processing and modification with a Ni-Mg master alloy on the mechanical properties of such alloys. They observed that the chemical modification induced proper microstructural changes, including the formation of particles capable of increasing the ultimate tensile strength (UTS). Positive impacts of hot rolling were also reported. Moreover, Szymczak et al. [14] investigated the microstructure of EN AC-46000 alloy with different Cr, Mo, V, and/or W contents. They demonstrated that the Al15(FeMnM)3Si2 intermetallic absorbs part of the high melting point elements at the initial stages of solidification. Consequently, the concentrations of these elements reduced at the solidification front. Essari et al. [15] also performed a study about Mg addition, heat treatment, Mg modification and SiCP reinforcement in an Al-8Si-8Fe-1.4V alloy. They concluded that adding 1.5 wt.%Mg combined with 6 h of heat treatment increased the hardness substantially.
It must be stressed that recycled Al-Si-based alloys may go through casting processes such as permanent casting, gravity die casting and sand mold. That means solidification is intrinsically involved in their manufacturing route. Because of that, the optimized design of Al-Si alloys is much more complex than simply selecting the alloy composition. It also requires a detailed understanding of the microstructure evolution during solidification, as proved in numerous works [16,17,18]. In view of that, this work aims to investigate the microstructure, hardness, and tensile properties of an Al-7Si-1Fe-0.5V [wt.%] alloy using a directional solidification technique. For comparison purposes, Al-7Si-1Fe alloy samples are characterized under the same conditions. In summary, the main contributions of this work are:
  • A new knowledge of the combined effects of V and cooling conditions on the formation of V-containing IMCs during solidification;
  • Application of a concept of average solidification thermal parameters to investigate the microstructure coarsening in Al-Si-Fe(-V) alloys;
  • Determination of quantitative relationships for the prediction of mechanical properties from microstructural parameters.

2. Materials and Methods

2.1. Alloys Preparation

In this work, the studied Al-7Si-1Fe and Al-7Si-1Fe-0.5V [wt%] alloys were produced using commercially pure metals, whose chemical compositions are given in Table 1. For the V-containing alloy, a V-Fe master alloy was used, as well.
For each desired alloy, 800 g of Al were put in a SiC crucible (internally coated with alumina) and then melted at 800 °C in a muffle furnace. After that, the required amount of Si was added to the liquid Al, and the resulting mixture was mechanically homogenized using a stainless-steel stick coated with alumina. The next step was to put the crucible back into the furnace for about 45 min. The same procedure was adopted to incorporate Fe and V. Furthermore, the molten alloy was mechanically homogenized three more times. Finally, possible gases trapped inside the liquid were removed through Ar injection for approximately 2 min.
It is worth mentioning that Al-7Si alloy samples were also considered. Such samples were the same for previous studies by some of the present authors [19], in which microstructural features, solidification thermal parameters and mechanical behavior were correlated. The previously found results are taken as reference for the associated analysis.

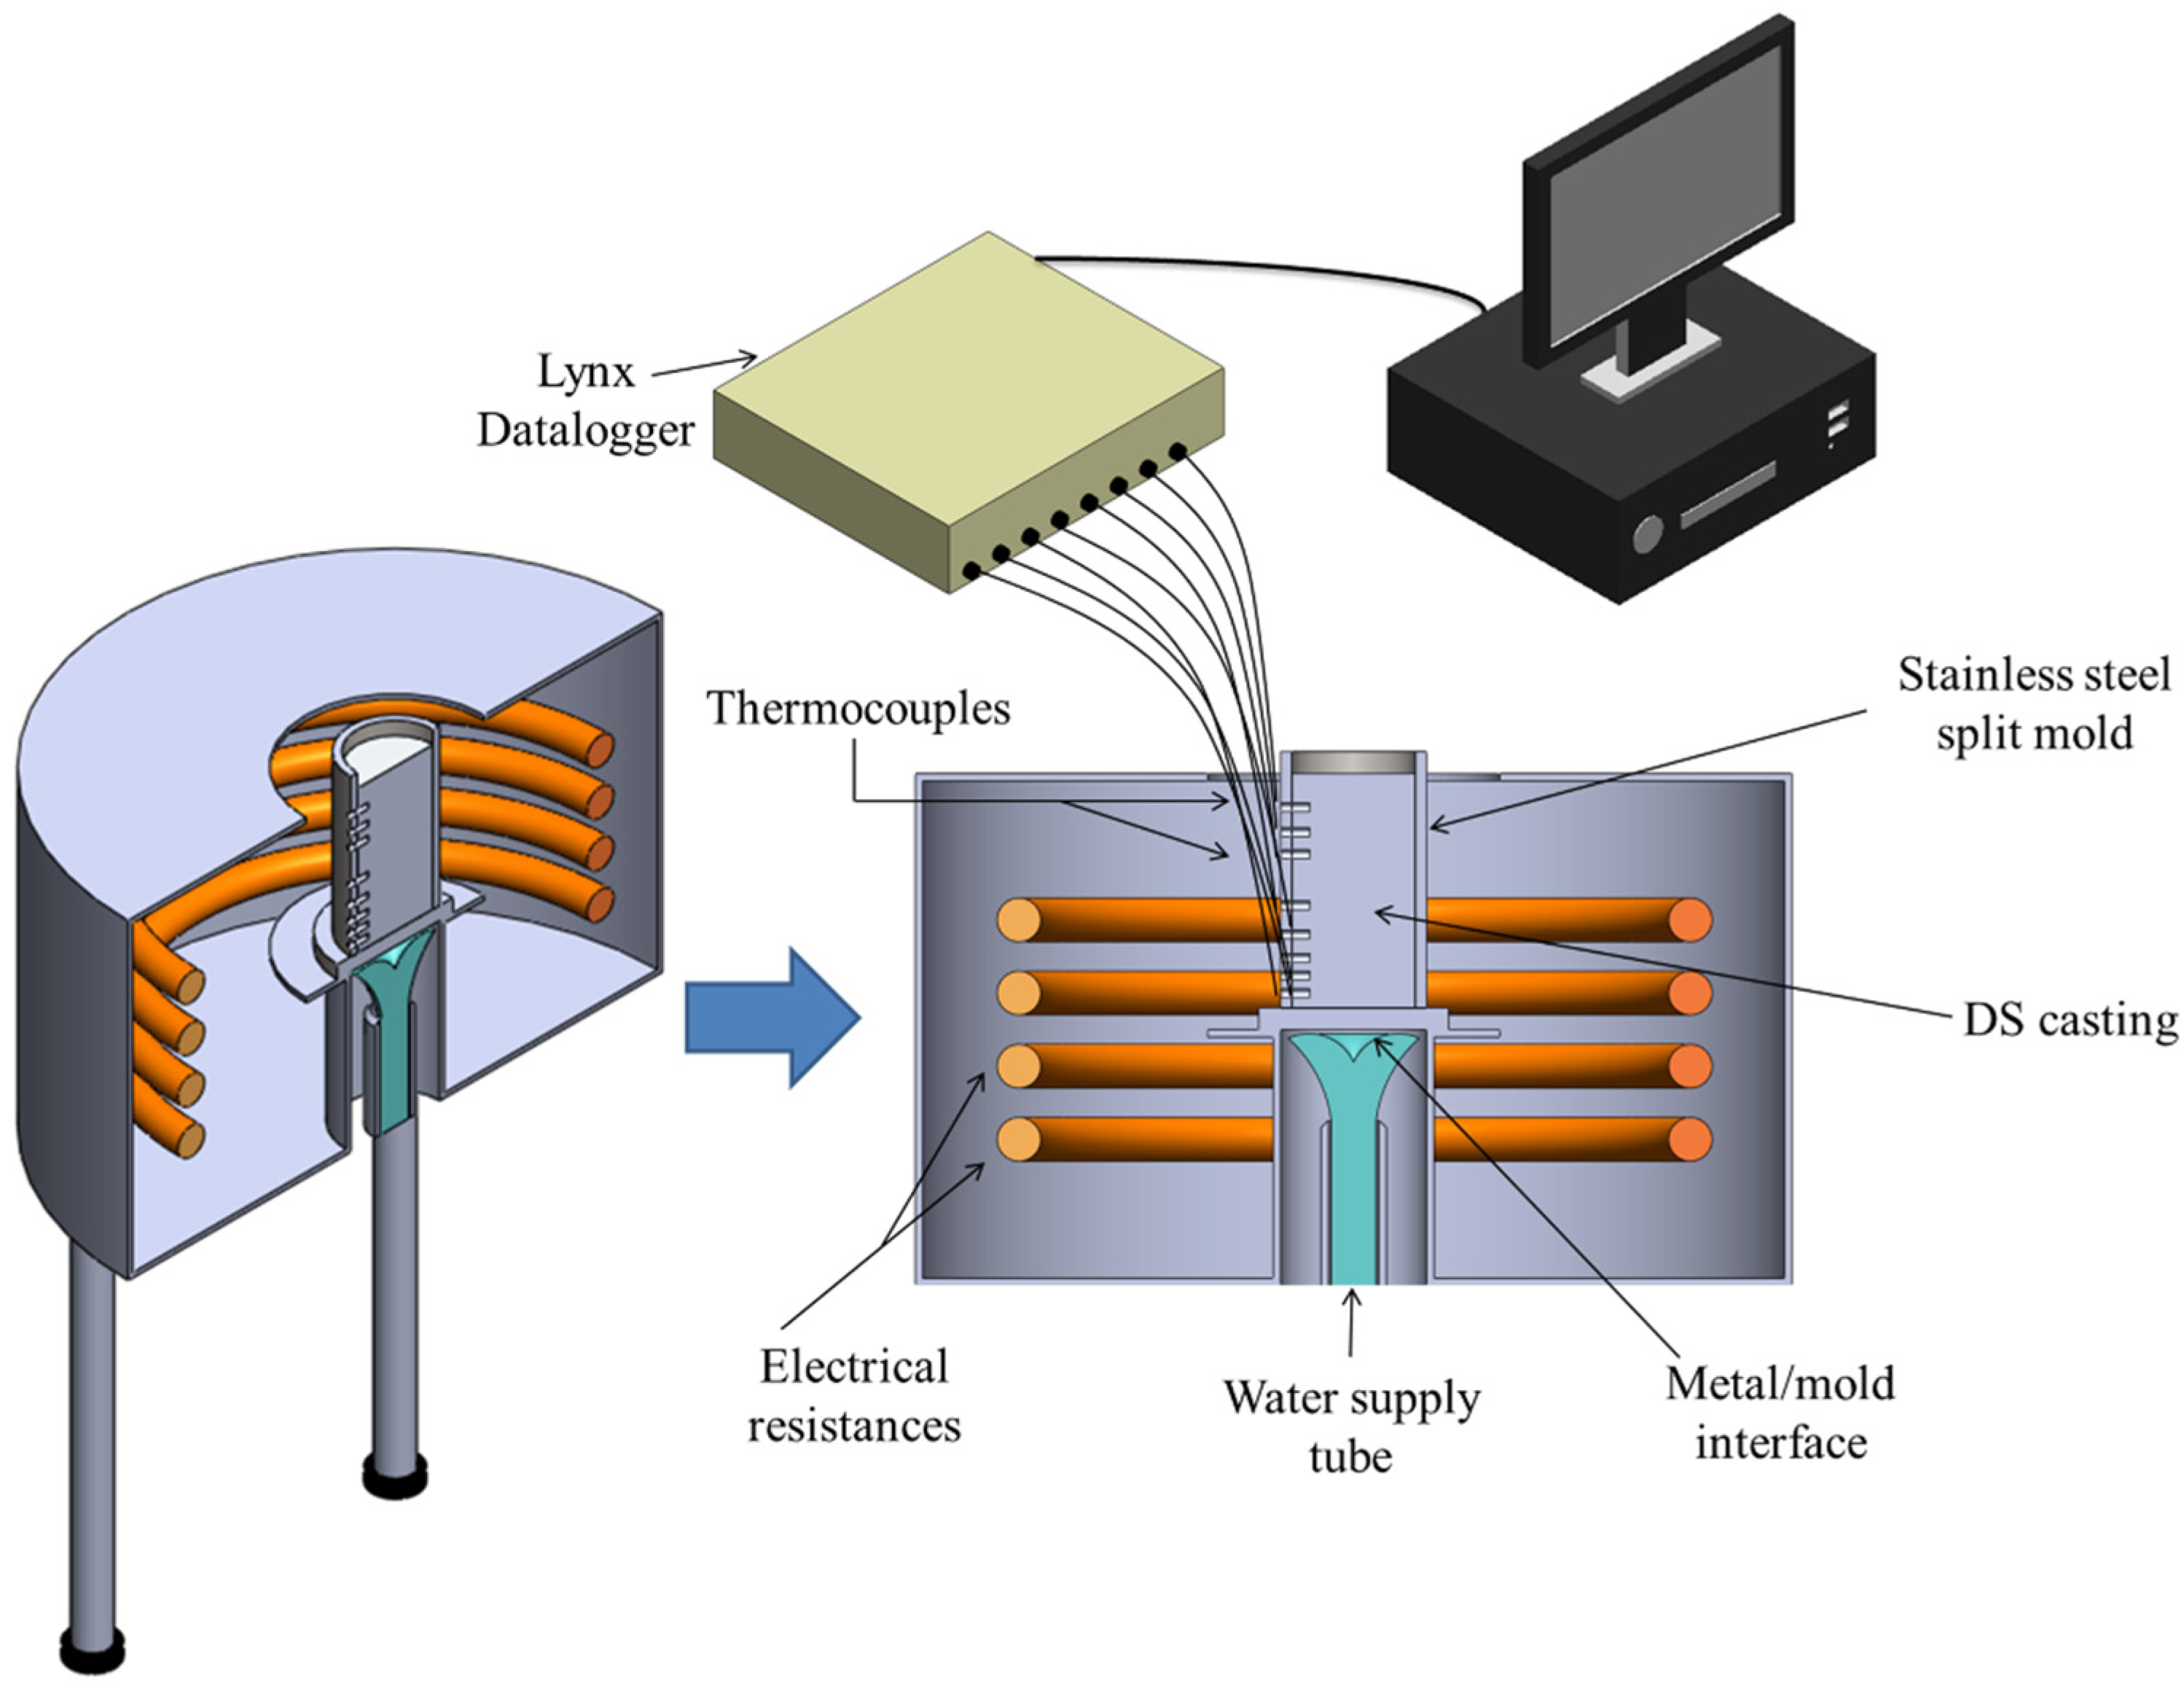
2.2. Directional Solidification

A split cylindrical mold of 60 mm diameter and 150 mm height made of stainless-steel was used in the directional solidification (DS) experiments. First, the mold was assembled inside the casting chamber of the DS apparatus, as schematically shown in Figure 1, and the heating system was turned on. The next step was the pouring of the molten alloy. It is worth mentioning that the mold was internally coated with alumina, so that radial heat losses could be minimized, and the removal of the resulting casting facilitated. The only inner surface of the mold without any alumina coating was the mold bottom-part. At this location, the contact condition between the molten alloy was standardized with 1200 grit SiC abrasive paper finishing.
Eight K-type thermocouples (Ø 1.6 mm) were inserted at different distances with respect to the metal–mold interface. This allowed for the real-time temperature monitoring along the length of the DS casting. As soon as the thermocouple closest to the metal–mold interface registered a temperature of 10% above the alloy liquidus temperature, the electric heaters were turned off and the water flow (at a rate of 20 L/min) started at the bottom of the mold. This allowed the solid to grow vertically upwards. The experimental thermal histories (temperature-time data) were recorded by a LynxADS1000 datalogger at a frequency of 5 Hz.

2.3. Calculation of Solidification Thermal Parameters

The experimental cooling curves allowed for the determination of the following solidification thermal parameters: liquidus growth rate ( v L ) ,   liquidus cooling rate ( T ˙ L ), average solidification velocity ( v a v e ) , and average solidification cooling rate ( T ˙ a v e ).
v L values were computed using the times ( t L ) at which the liquidus isotherm passed by each thermocouple position (P). P × t L experimental equations were determined and their first derivatives with respect to time provided the v L values. Regarding T ˙ L values, they were determined by fitted regression lines that represented the general tendency of the temperature-time data in a region around the liquidus temperature. A more detailed explanation of these techniques can be found in previous papers [20,21].
To determine v a v e and T ˙ a v e , which correspond to average growth and cooling rates during solidification, respectively, the thermal data obtained during the entire solidification interval (temperature range between the liquidus and eutectic isotherms) were used. That means such parameters consider all transformations involved during solidification. Thus, they are more adequate to represent the intensity of cooling, as well as its changes with time for a given relative position in the DS casting. Using the mean value theorem for integrals, v a v e and T ˙ a v e can be expressed as:
v a v e = 1 t L t e u t t e u t t L f t d t
T ˙ a v e = 1 t L t e u t t e u t t L g t d t
where:
t L and t e u t : time of the liquidus and eutectic isotherms passage, respectively.

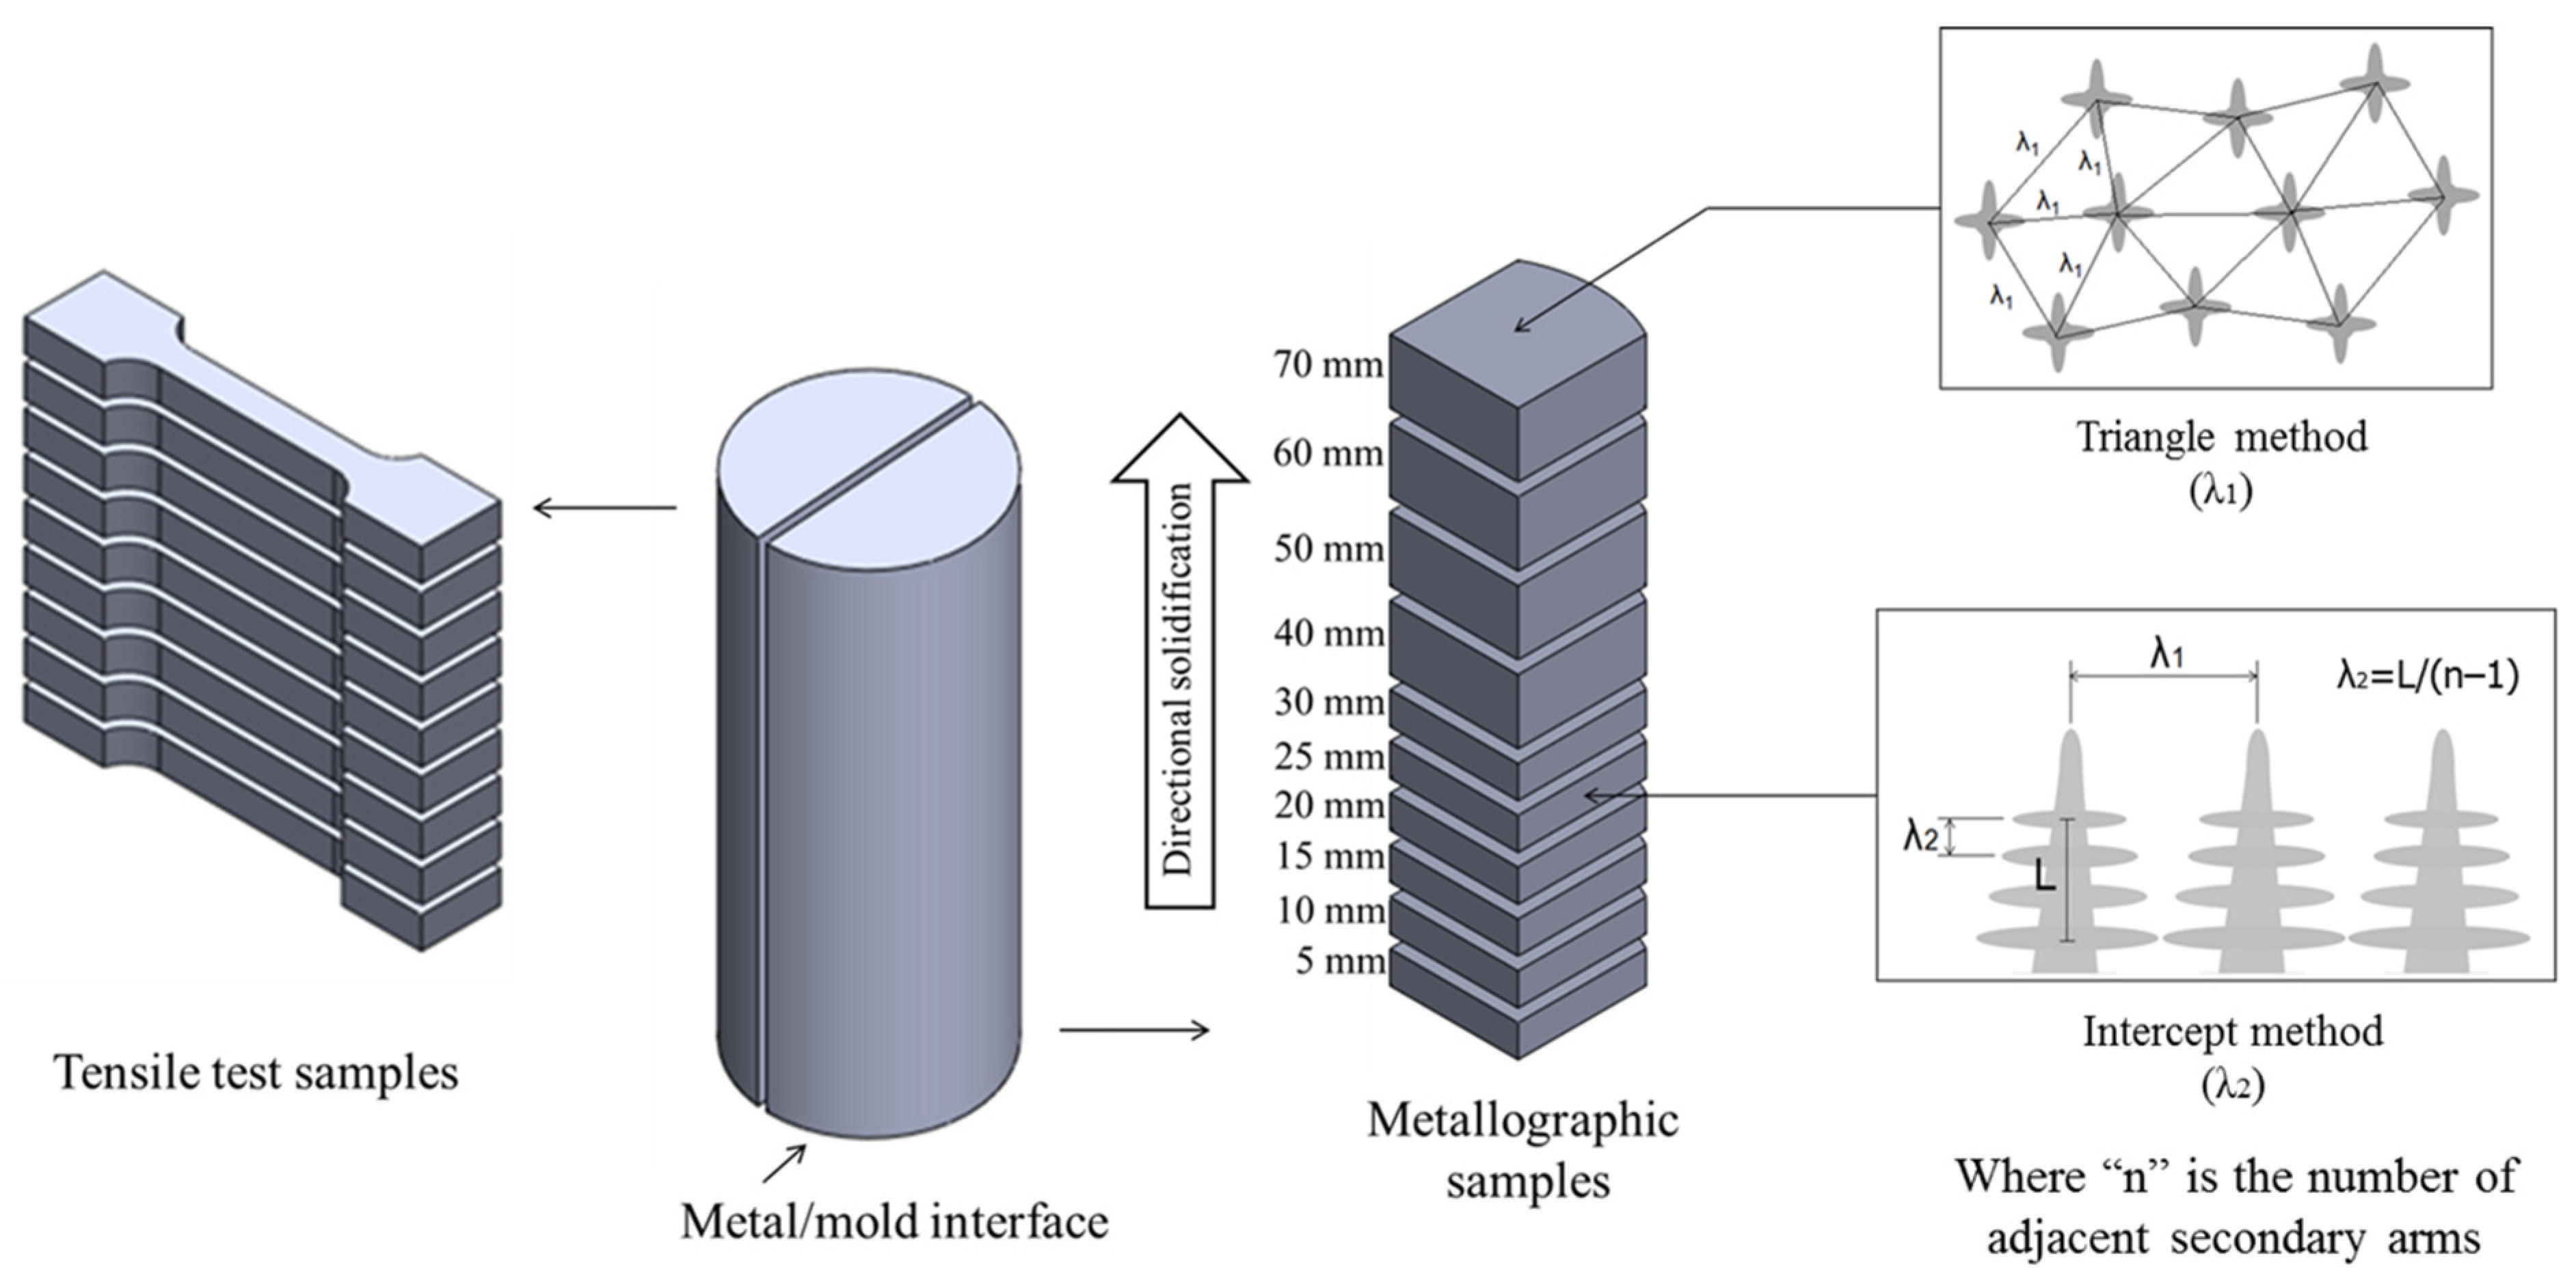
2.4. Macro and Microstructural Characterization

Figure 2 provides an overview of the experimental procedure performed for the analysis of the directionally solidified casting. For macrographic examination, the resulting directionally solidified casting was cut into two equal pieces parallel to its length. One of the half-cylinders was properly ground with 100- to 1200-grit SiC abrasive papers and chemically etched with an aqua regia reagent (3 HCl: 1 HNO3). For microstructural characterization, longitudinal and transverse samples were then extracted along the length of the casting. The analyzed relative positions were: 5, 10, 15, 20, 25, 30, 40, 50, 60 and 70 mm from the metal–mold interface (cooled surface). SiC abrasive papers from 100 up to 1200 mesh were used to prepare the samples, which were posteriorly polished with 3 and 1-μm diamond pastes.
Optical images acquired using an Olympus Inverted Metallurgical Microscope (model 41GX) were used for measuring the microstructural spacings. The primary dendrite arm spacing (λ1) was measured on images of transverse sections using the triangle method, whereas the secondary dendrite arm spacing (λ2) was quantified employing the linear intercept method on images of longitudinal sections. Both measurements methods were performed according to the procedures described in previous works [22], as shown in Figure 2. The length of the β-AlFeSi particles was measured by tracing a line from one extreme to the other of the β-AlFeSi needle.
Scanning electron microscopy (SEM) images were collected using an Inspect F50 coupled with an energy dispersive X-ray spectrometer (EDS) (Oxford-X-MAX). Such SEM images were processed on the ImageJ software to analyze aspect ratio, area size, and fraction of the β-AlFeSi particles. X-ray diffractometric (XRD) patterns were obtained using three cross-sectioned samples that corresponded to fast, intermediate, and slow cooling regimes. XRD analyses were conducted with a voltage of 45 kV, a current of 40 mA and a scan interval of 20° ≤ 2θ ≤ 90°.

2.5. Mechanical Testing

Tensile tests were carried out according to the ASTM E8M [23] standard specification using a WDW-100E universal testing machine. Such tests were repeated three times. Following the standard ASTM E384 [24], measurements of Vickers hardness were performed using a Shimadzu HMV-2 model hardness tester. The test load and dwell time were 0.5 kgf and 15 s, respectively. At least 20 measurements were carried out and the average value was adopted to represent the hardness of the sample.

2.6. Multiple Linear Regression (MLR) Analysis

Fits relating the mechanical properties (dependent variables) to the microstructural spacings (predictor variables) were determined by using multi linear regression (MLR) analysis. The analysis of the output was performed taking significance F, p-values and correlation coefficient (R2) into consideration. Only significance F < 0.05 was considered acceptable. Only a p-value lower than 0.05 was considered statistically significant [25]. R2 allowed for the examination of the fitness of the regression model. The closer R2 to 1, the better the regression line fits the data.

3. Results

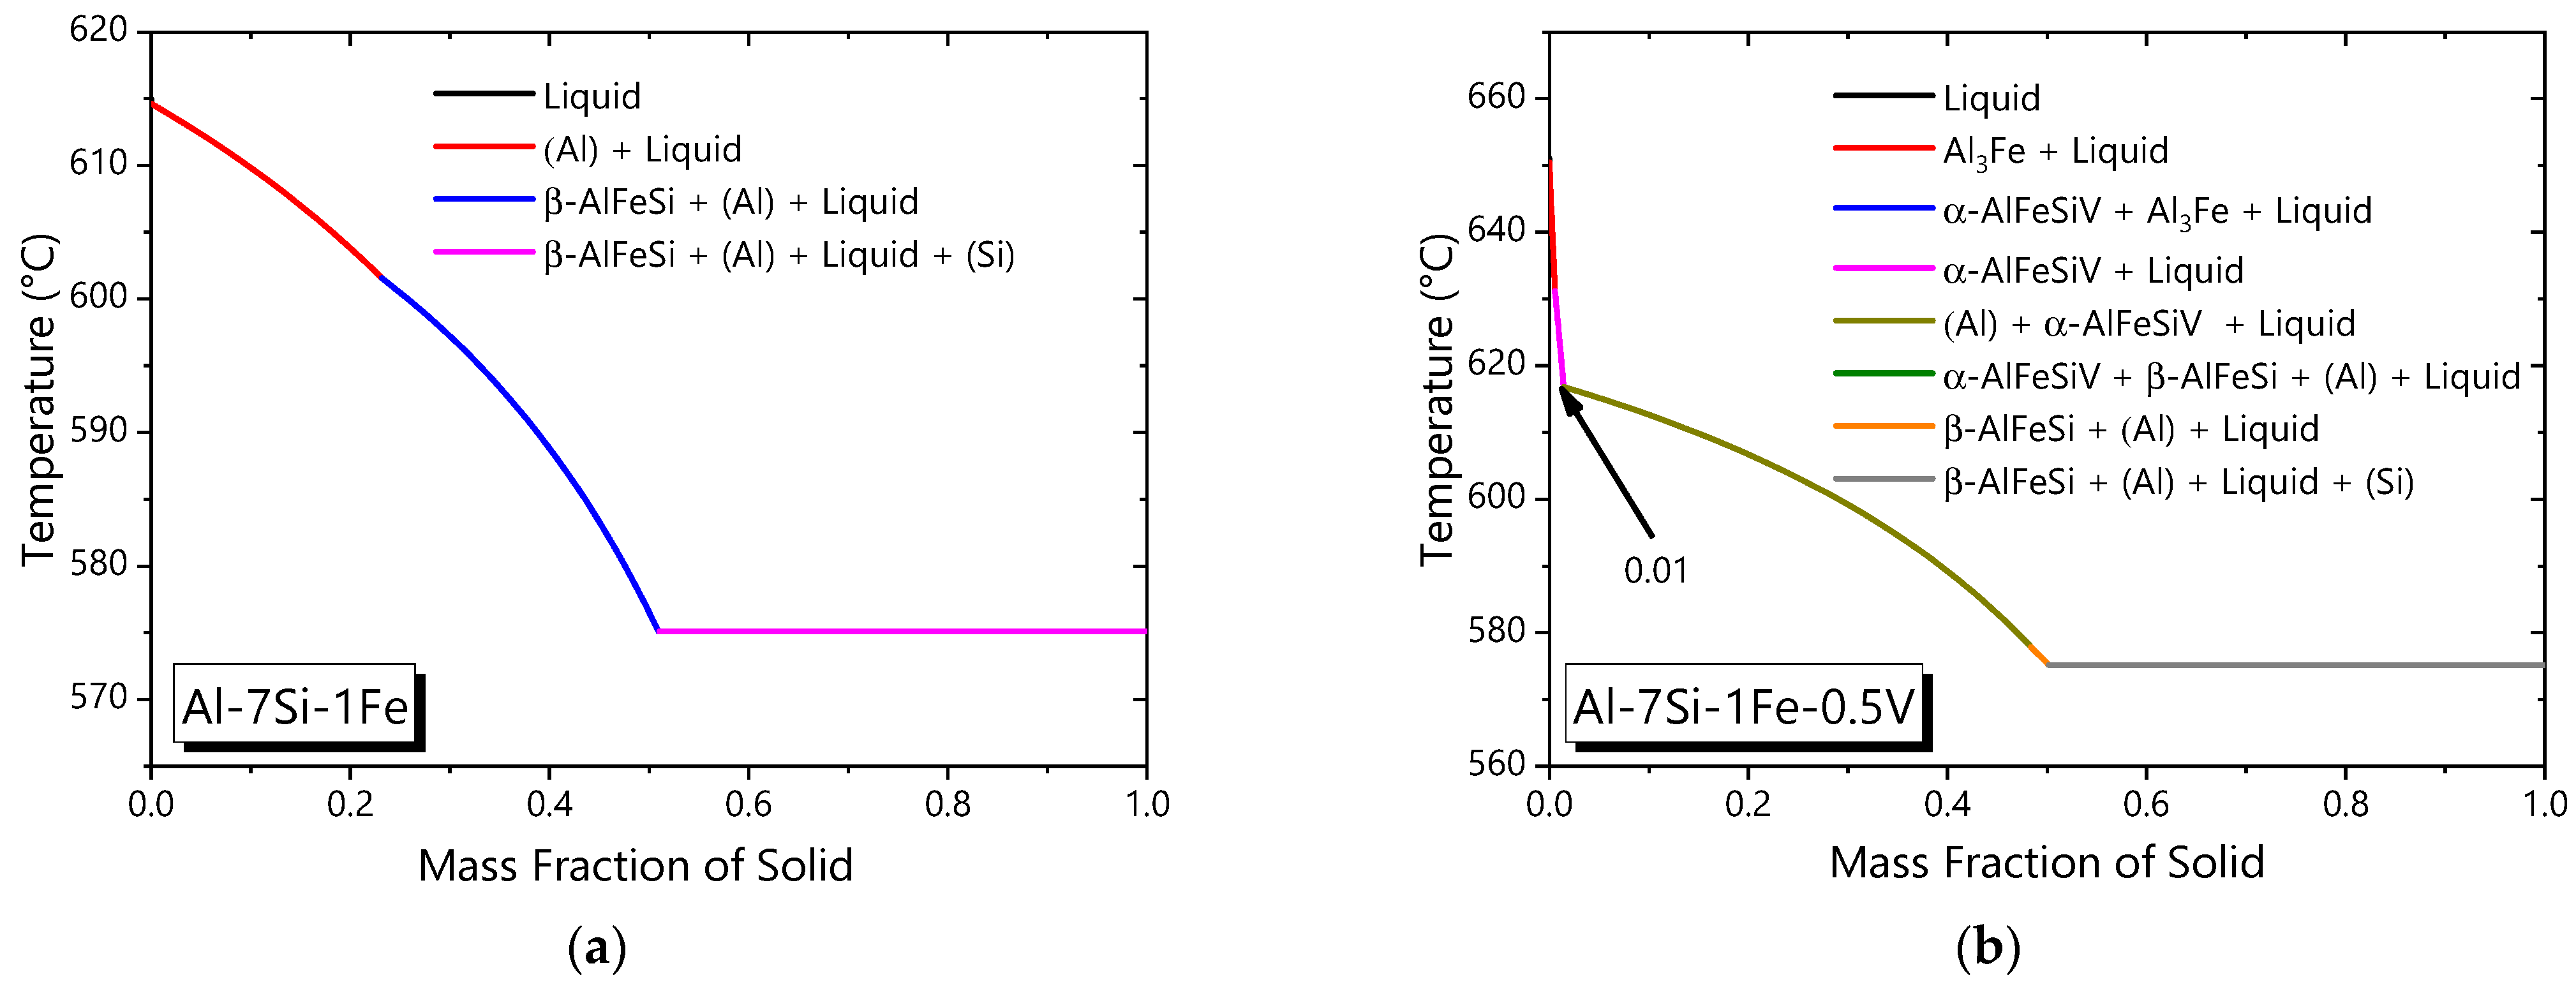
3.1. Thermo-Calc Simulations

Figure 3 provides Thermo-Calc property diagrams (TTAL5 database), where the molar phase fraction of each stable phase of the Al-7Si-1Fe and Al-7Si-1Fe-0.5V alloys is plotted against the temperature range of 200–700 °C. As can be noticed, solidification of the ternary alloy commences with the formation of the primary (Al) phase at 617 °C. At 600 °C, the formation of the β-AlFeSi phase takes place too. The last step is a eutectic reaction at 575 °C, through which the (Si) phase is formed. Under equilibrium conditions, therefore, the solidification microstructure of the Al-7Si-1Fe alloy is expected to be composed of an Al-rich matrix surrounded with Si and β-AlFeSi particles. It must be stressed that the β-AlFeSi phase is considered detrimental to the tensile properties [4,11]. An alternative to overcome such issue is the addition of V, as it will be discussed as follows.
When 0.5 wt.%V is added to the Al-7Si-1Fe alloy, the liquidus temperature becomes 650 °C which represents an increase of 33 °C in relation to that of the ternary alloy. Another important fact is that the first solid to be formed is the Al3Fe phase. Only after that, the α-AlSiFeV phase occurs. Both phases serve as nucleation sites for the formation of the primary (Al) phase at 617 °C. At this point, the α-AlSiFeV phase continues growing. When the eutectic reaction is reached at 575 °C, the (Si) phase is formed as well. Therefore, equilibrium solidification is completed with no formation of β-AlFeSi particles. This indicates that the addition of 0.5 wt.%V to the Al-7Si-1Fe alloy might be a mitigation to the formation of β-AlFeSi particles. However, a solid-state transformation at 305 °C leads to the formation of the Al3V phase through the consumption of the α-AlSiFeV phase. Additionally, at 217 °C, the β-AlFeSi phase is expected to be formed.
For better understanding of the non-equilibrium solidification of the studied alloys, Figure 4 plots their Scheil–Gulliver solidification paths. These graphs were also calculated using the Thermo-Calc software with the TTAL5 database. Some assumptions are fast cooling with total diffusion in the liquid phase and no diffusion in the solid phase, as well as local equilibrium at the solid–liquid interface. It can be observed that the Al-7Si-1Fe alloy solidification has three different steps, which are: (1) nucleation of the (Al) phase, (2) formation of the β-AlFeSi phase, and (3) formation of (Si) particles. On the other hand, the addition of 0.5 wt.%V makes the solidification path more complex. The property diagrams reveal that the liquidus temperature changes from 617 to 650 °C. Such rise in the liquidus temperature can be attributed to the formation of IMCs, starting with the Al3Fe phase, which is expected to be turned into the α-AlSiFeV phase. All the associated reactions precede the formation of the (Al) phase at 617 °C. However, it is worth mentioning that the fraction of Al3Fe IMCs is substantially low, representing only~0.01% of the solid fraction. The (Al), α-AlSiFeV, and liquid phases coexist in a significant part of the solidification range. At 578 °C, however, the α-AlSiFeV phase is converted into the β-AlFeSi phase, which prevails until the end of solidification.
The Scheil model may provide more appropriate predictions for the interpretation of non-equilibrium solidification. However, the way that different cooling regimes stimulate or inhibit the formation of V-containing IMCs during solidification is not yet fully understood.

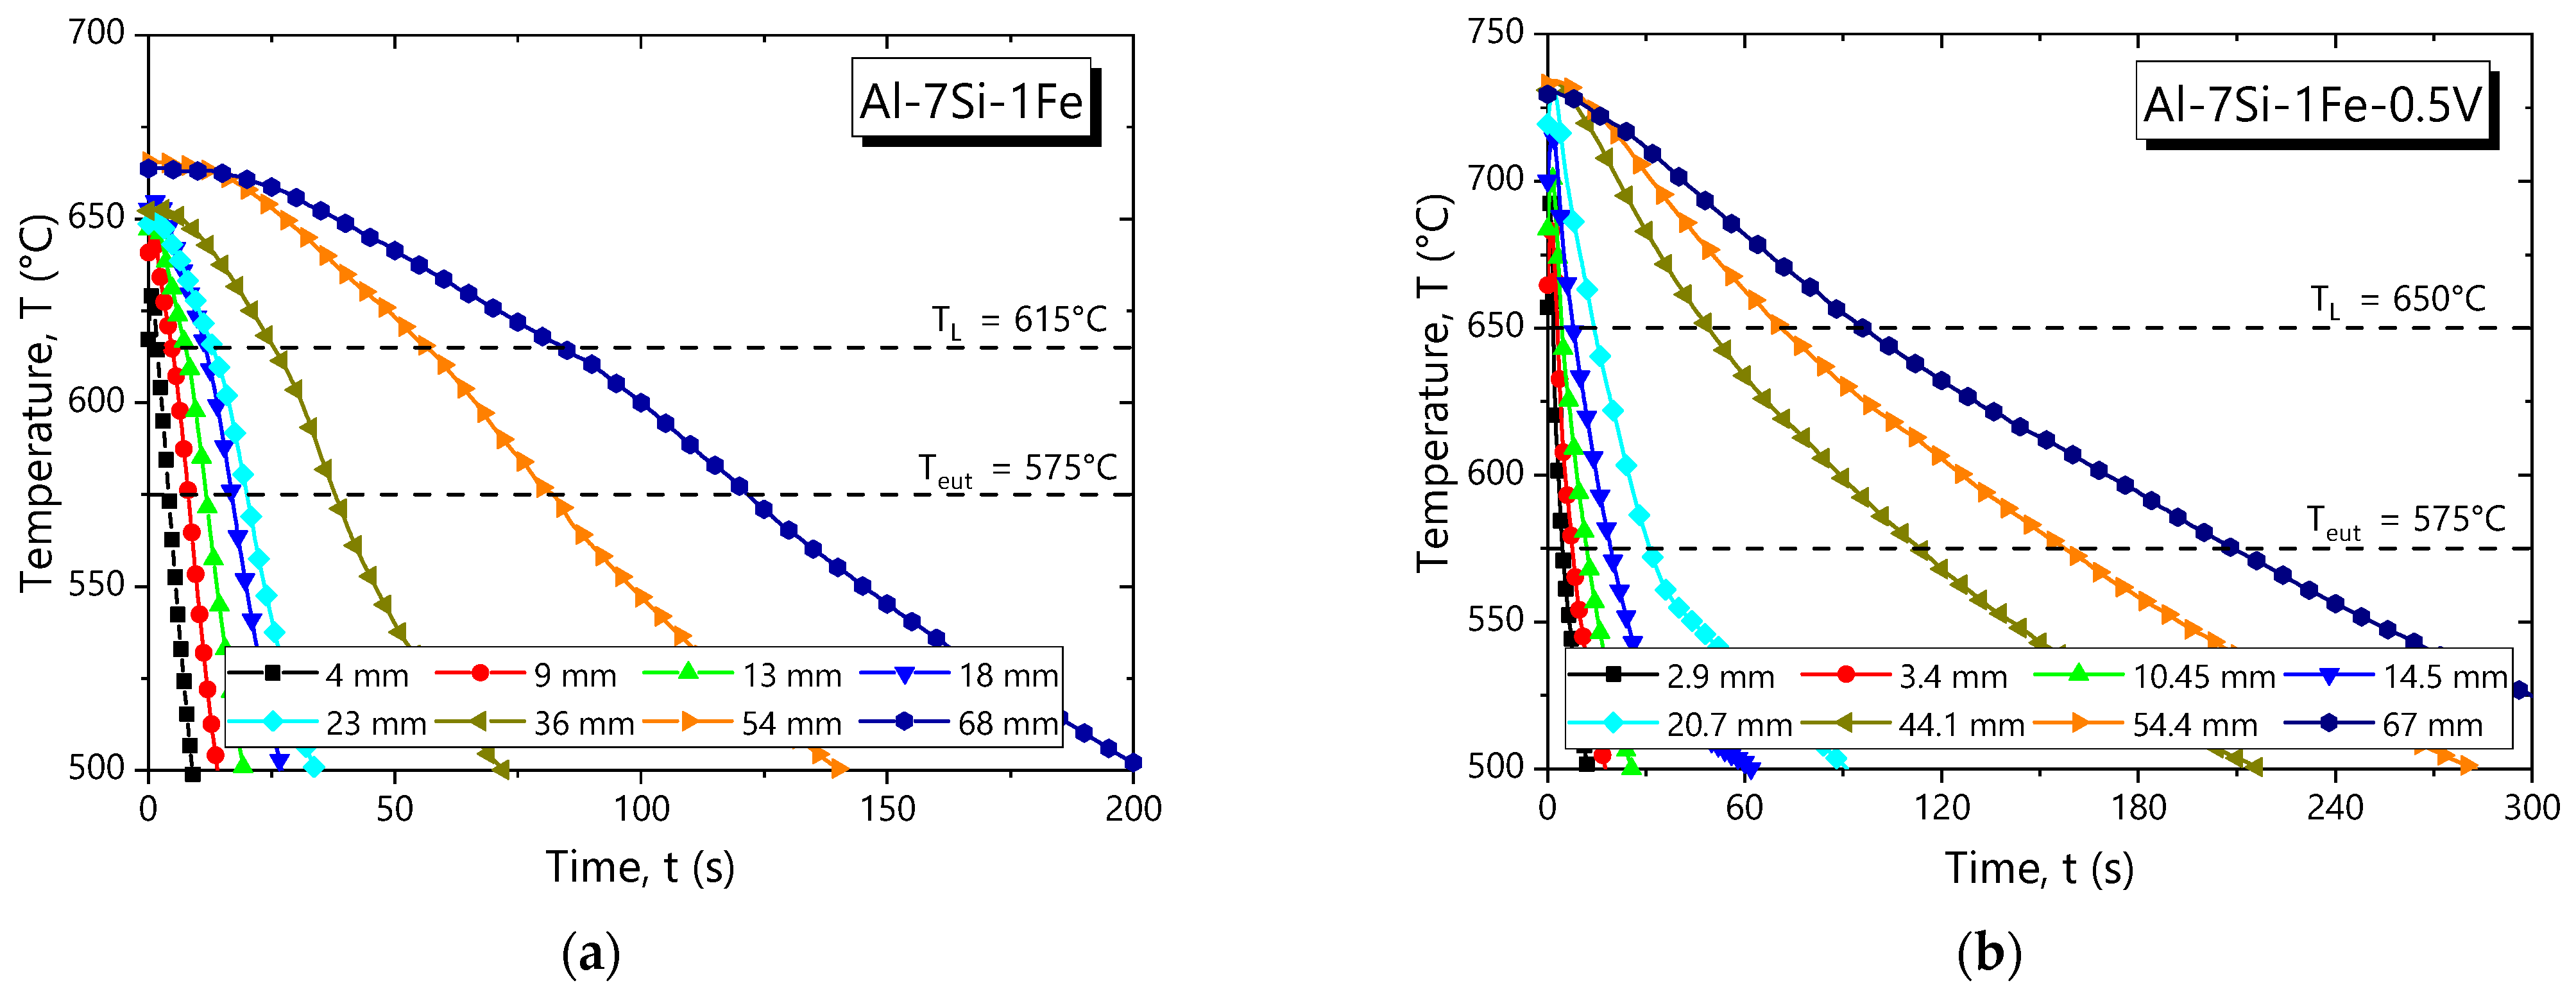
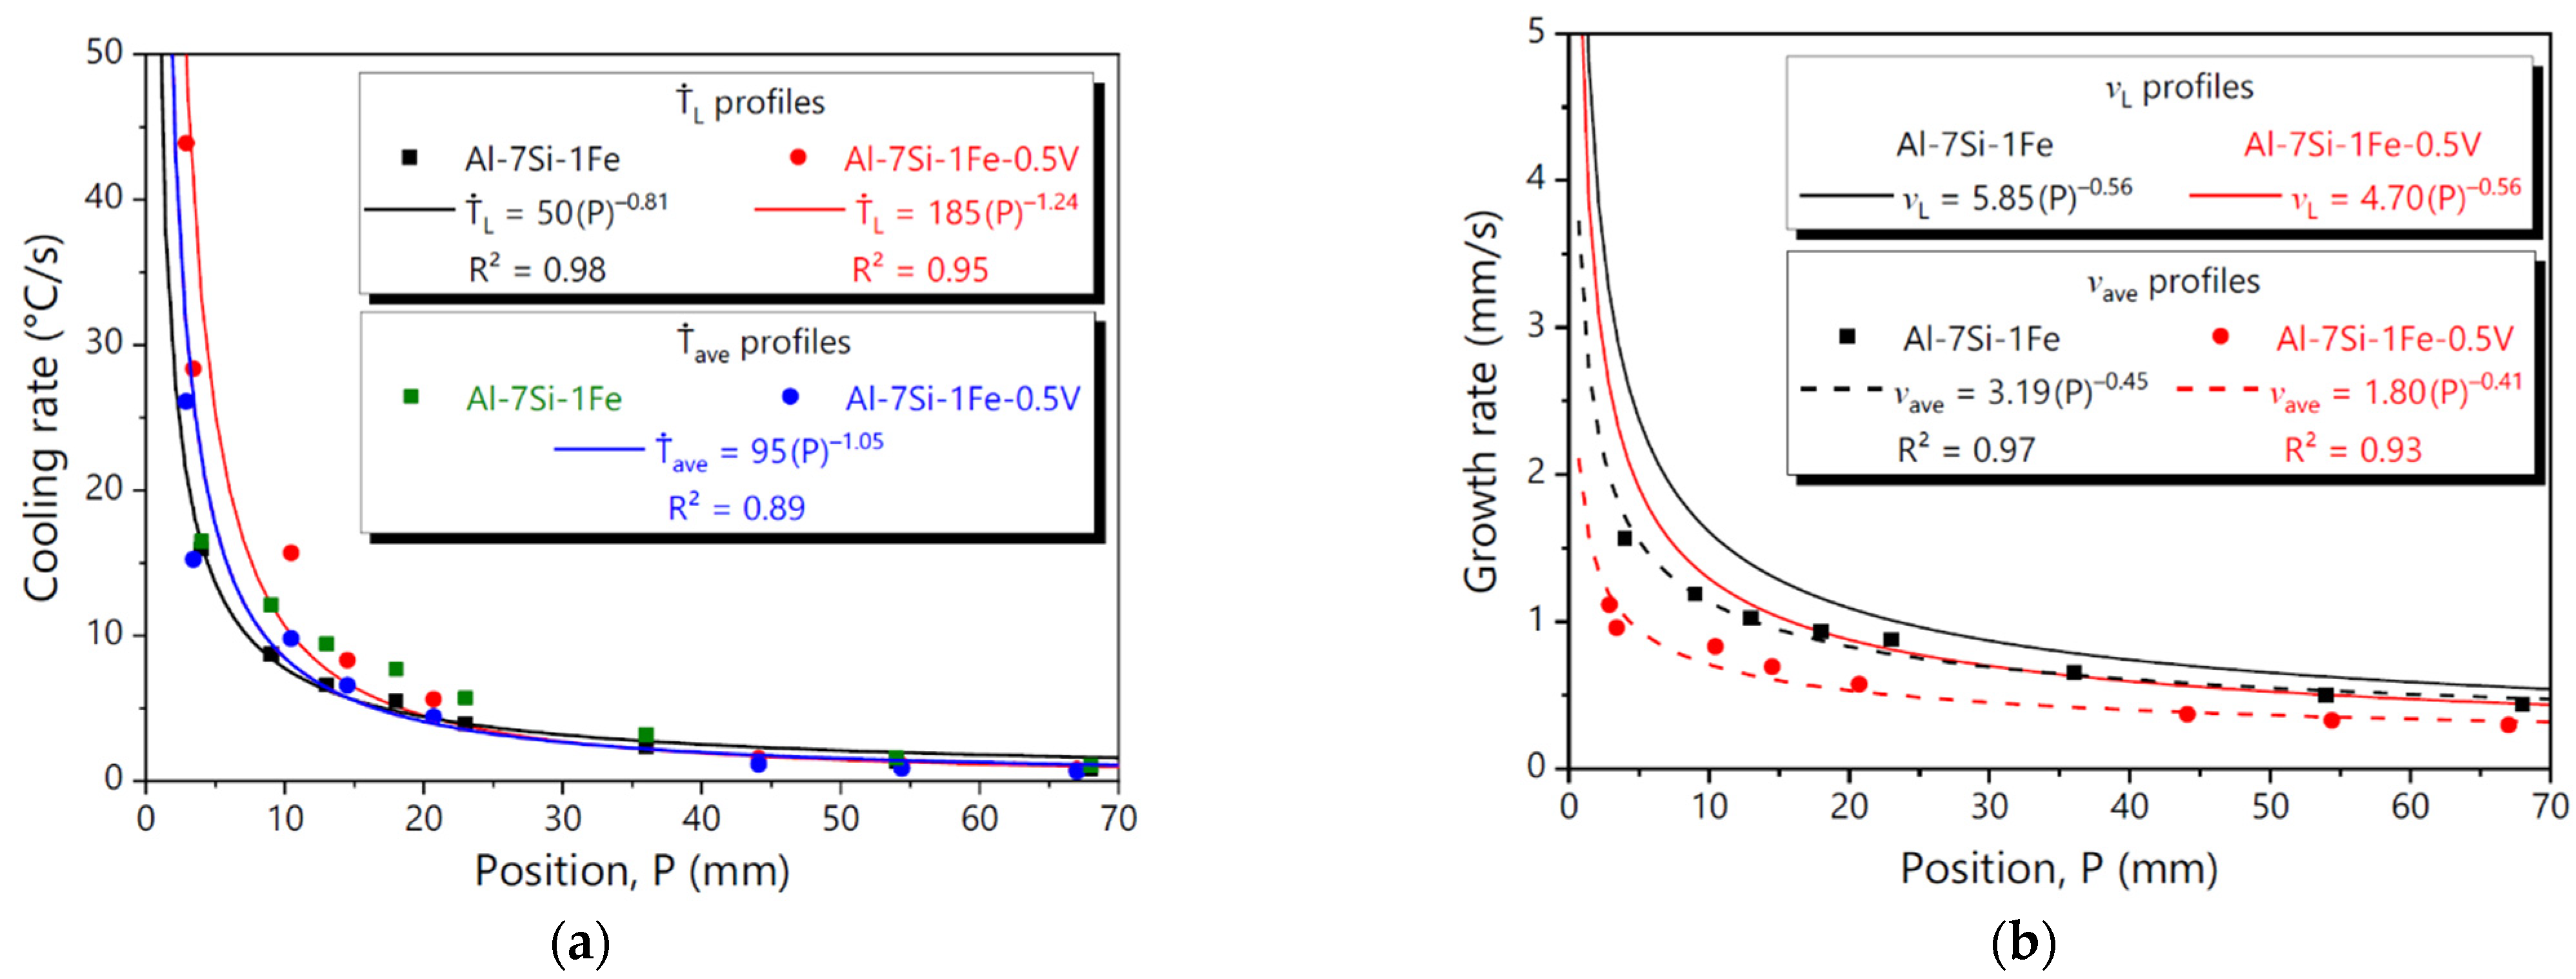
3.2. Solidification Thermal Parameters

Cooling curves collected along the length of the Al-7Si-1Fe and Al-7Si-1Fe-0.5V alloys castings are given in Figure 5. Each cooling curve corresponds to a thermocouple location with respect to the cooled interface. Horizontal dashed lines represent the liquidus (TL) and solidus (TS) temperatures of each studied alloy. Overall, temperature drops are more intense for regions in the casting closer to the bottom. However, such variations in temperature over time decreases progressively towards the inner of the casting. Such behavior can be interpreted through the growth and cooling rate profiles given in Figure 6. As can be seen, the liquidus growth rate ( v L ), liquidus cooling rate ( T ˙ L ), average solidification velocity ( v a v e ), and average solidification cooling rate ( T ˙ a v e ) decrease with increasing distance from the metal–mold interface. This is directly associated with the increase in the thermal resistance promoted by growth of the solidified layer. There is also a strong influence of the thermal resistance at the metal–mold interface, which increases with the advance of solidification. The more expressive differences in the solidification thermal parameters are observed until 20 mm in the casting. After that, a quasi-stationary regime is reached.
It is worth noting that the addition of 0.5 wt.%V resulted in a higher T ˙ L profile. As previously mentioned, the liquidus temperature of the Al-7Si-1Fe-0.5V alloy is 33 °C is higher than that of the ternary alloy due to the formation of the Al3Fe and α-AlSiFeV IMCs before the primary (Al) phase. However, such IMCs represent only~0.01% of solid fraction, as shown in Figure 4b, which means the temperature range closer to the liquidus temperature of the Al-7Si-1Fe-0.5V alloy is characterized by a higher liquid fraction as compared to that of the ternary alloy. Consequently, this favors a better interfacial contact at the metal–mold interface, so does the convective heat transfer in the molten alloy. That means favorable conditions for a more rapid heat extraction during the first stage of solidification, which explains the increase in T ˙ L with the incorporation of 0.5 wt.%V.
Unlike T ˙ L , T ˙ a v e points have close profiles. In fact, a single equation fits the T ˙ a v e values very well. It must be stressed that T ˙ a v e contemplates the entire solidification range. In other words, while T ˙ L corresponds to an instantaneous cooling rate at a given liquidus temperature, T ˙ a v e considers the thermal behavior associated with all transformations during solidification. Thus, T ˙ a v e is more representative of the whole process. Some T ˙ a v e points (particularly those of the positions between 15 and 30 mm) might suggest a slight effect of the addition of 0.5 wt.%V on the modifications in the alloy’s thermophysical properties. This agrees with the study of Qin et al. [11]. According to them, the addition of V impacts negatively the thermal conductivity of an Al-Si-based alloy.
Both v L and v a v e reduce towards the top of the DS castings, as expected. Interestingly, the Al-7Si-1Fe alloy is associated with a higher v L profile. That means the opposite to that found for T ˙ L . A possible reason for that is a difference in the thermal gradients ahead of the solidification front ( G L ). Since T ˙ L = G L   v L , it can be concluded that the addition of 0.5 wt.%V decreases G L . The same idea can be extended to the average thermal parameters, i.e., T ˙ a v e = G a v e   v a v e . Since a single equation describes their T ˙ a v e profiles and v a v e is higher for the Al-7Si-1Fe alloy, G a v e must have decreased with the addition of 0.5 wt.%V. In view of these considerations, it seems to be more adequate to relate the microstructural parameters to T ˙ a v e , since it not only represents the thermal aspect of the whole solidification process but also carries the information of both G a v e and v a v e , thus providing a more complete interpretation.

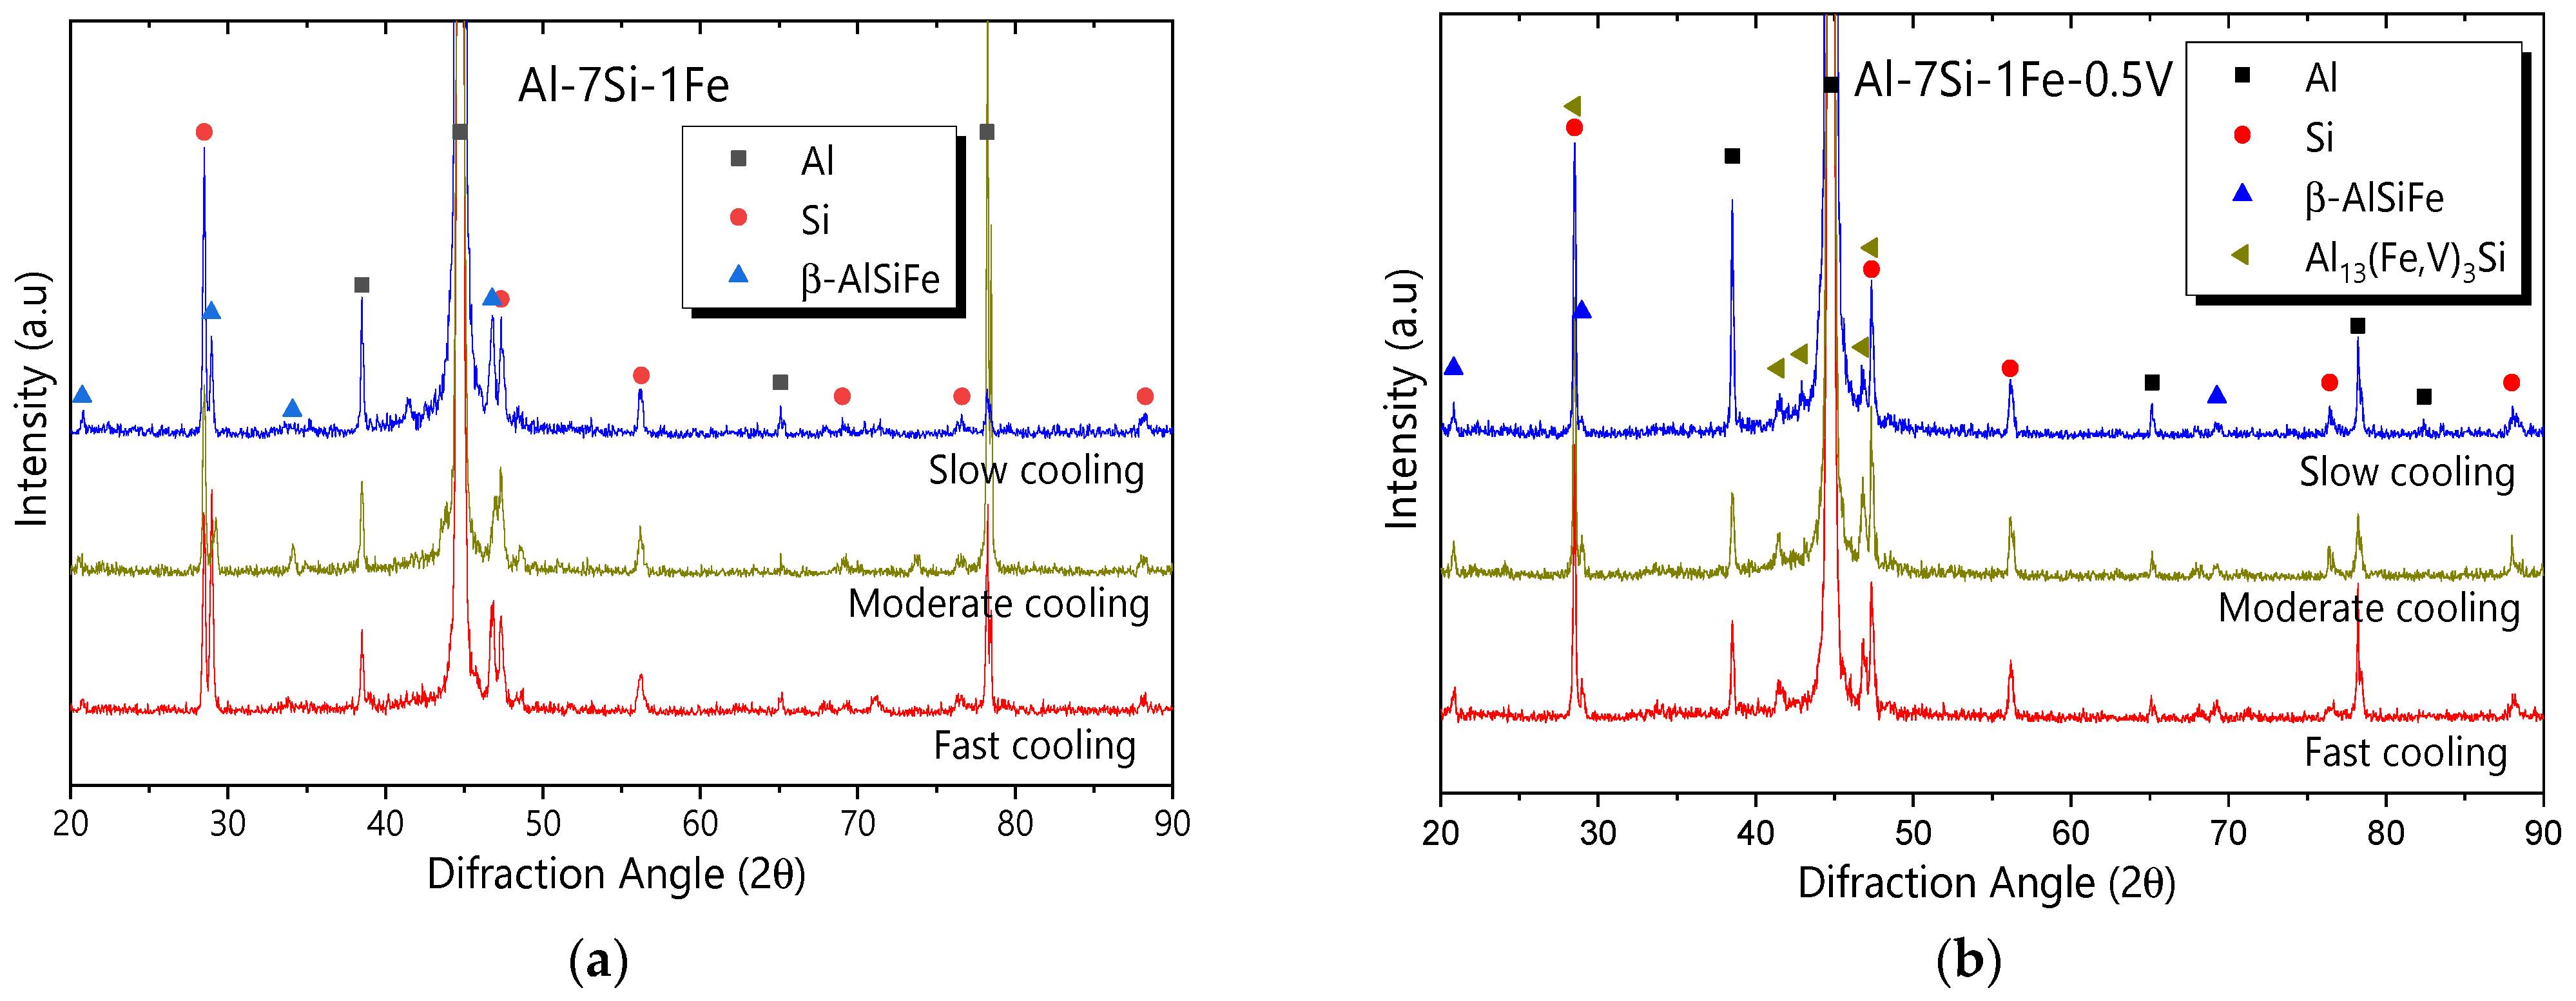
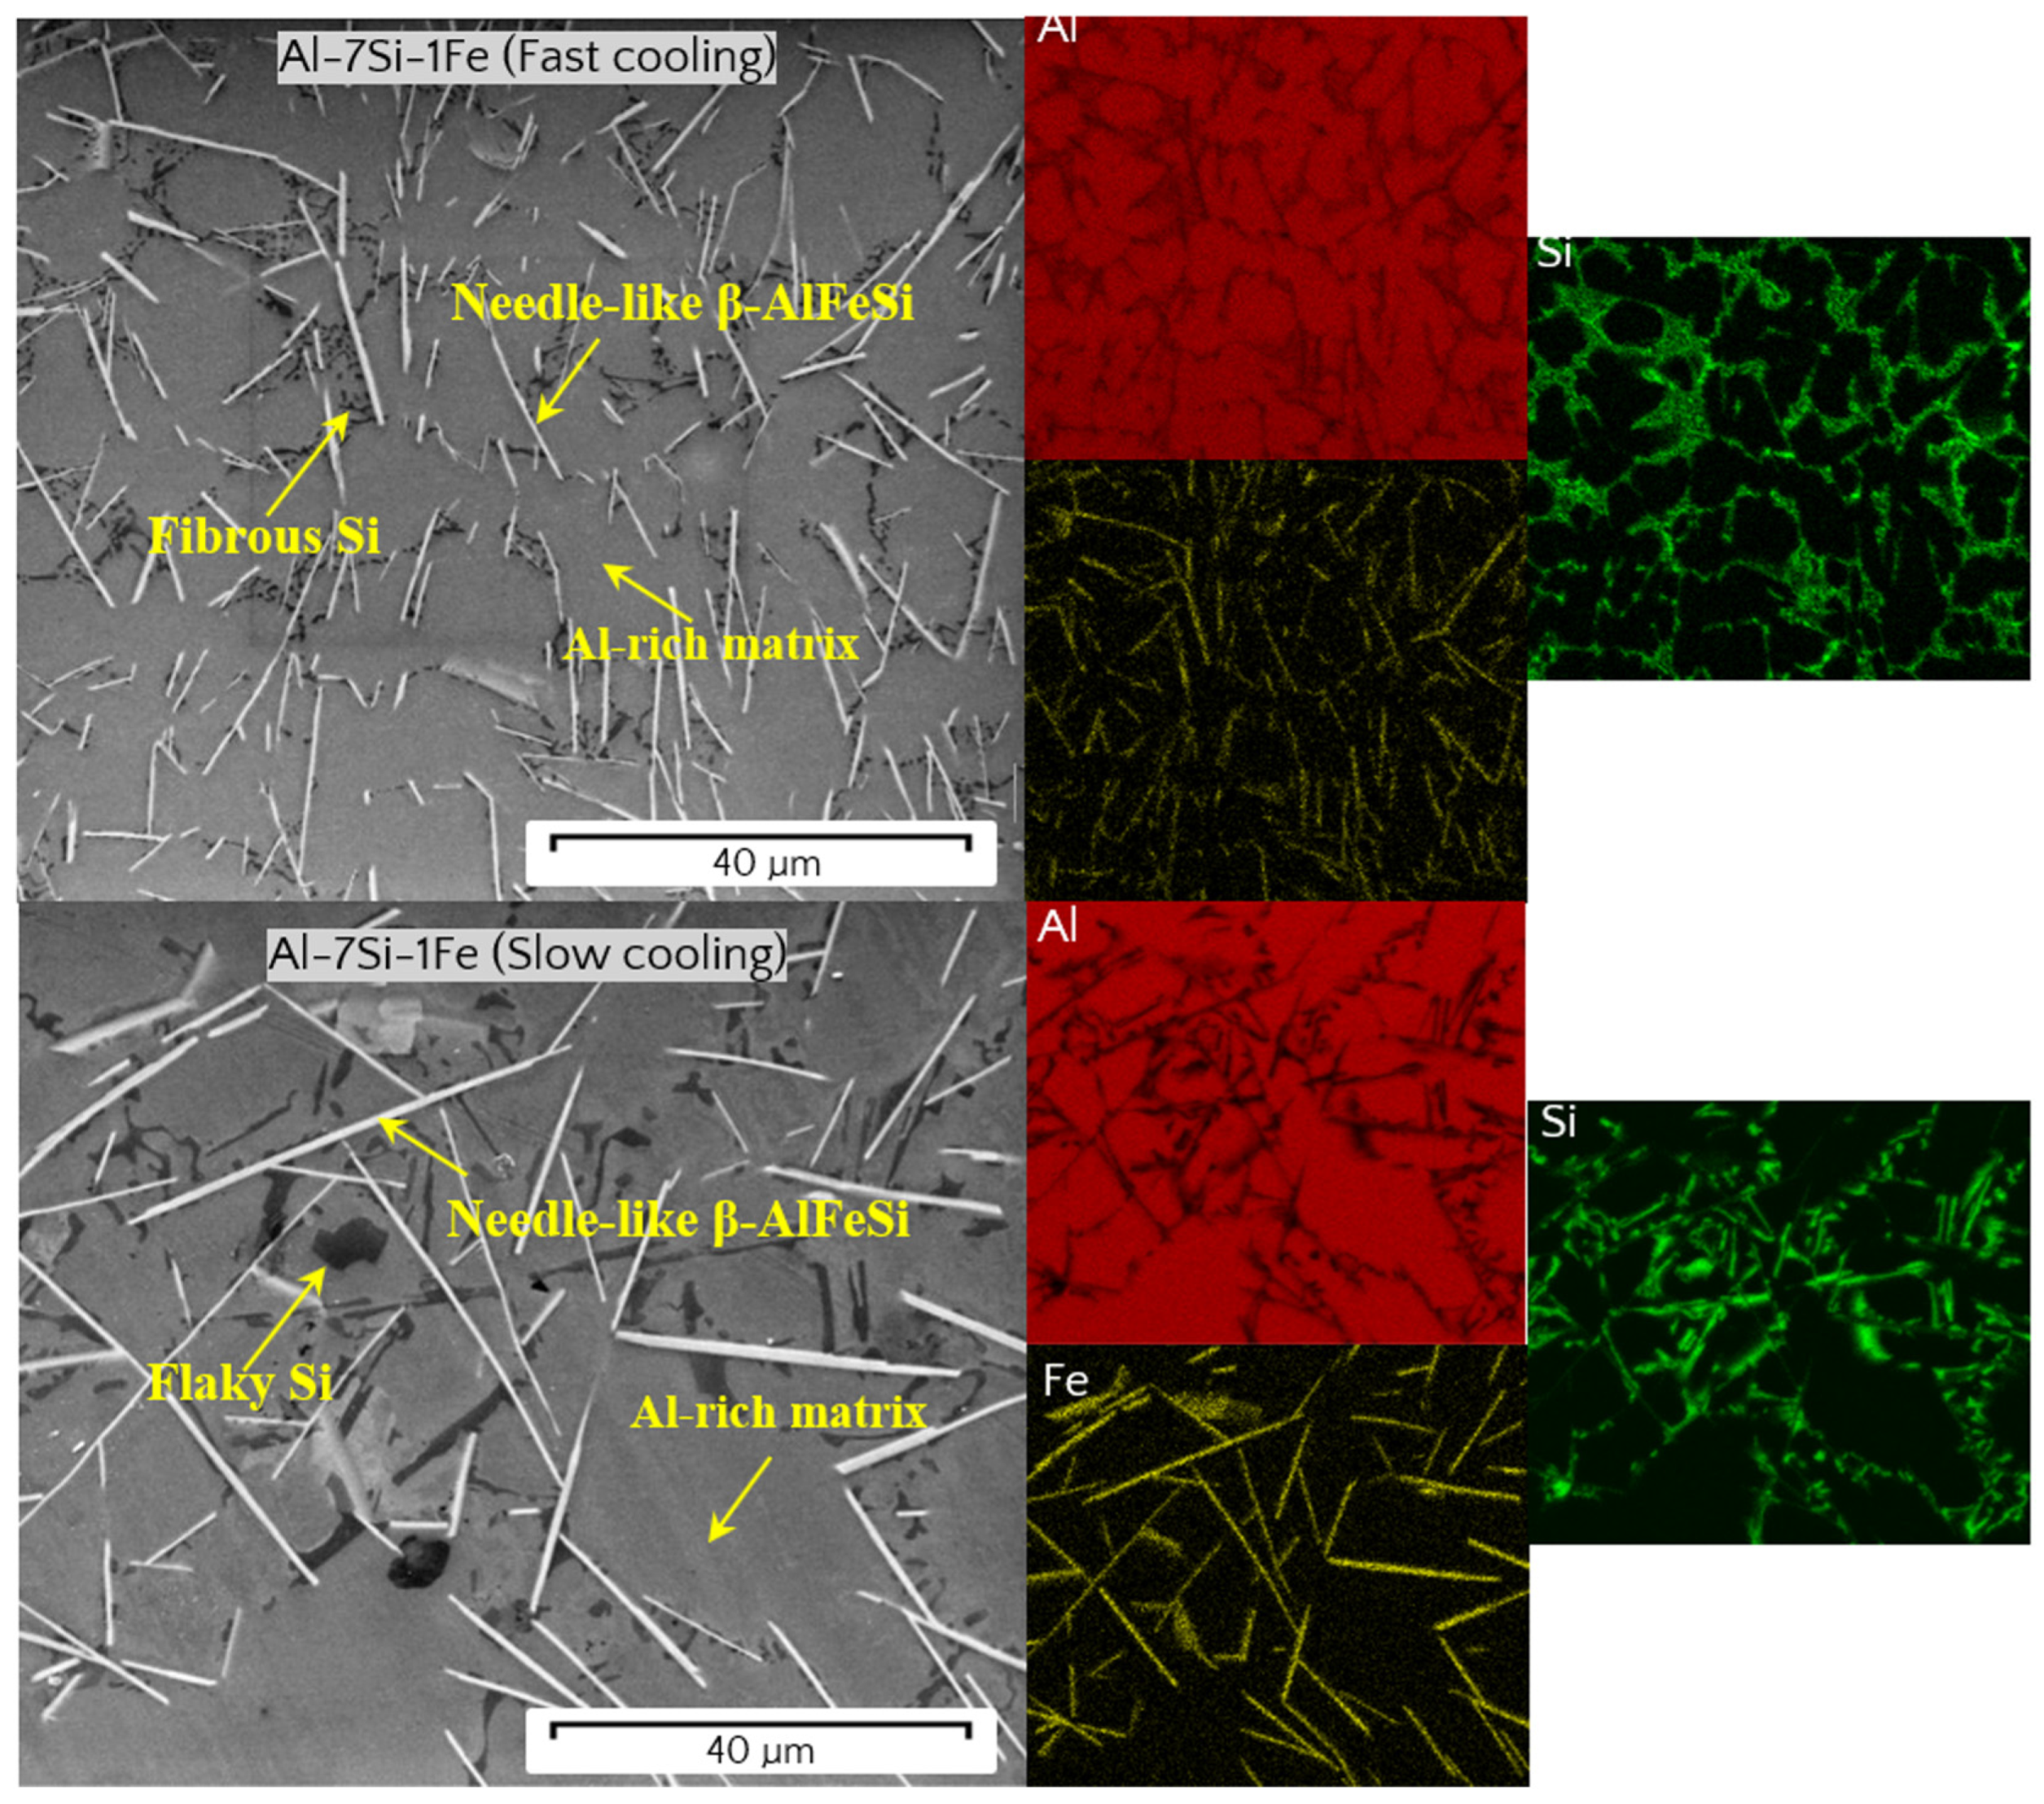
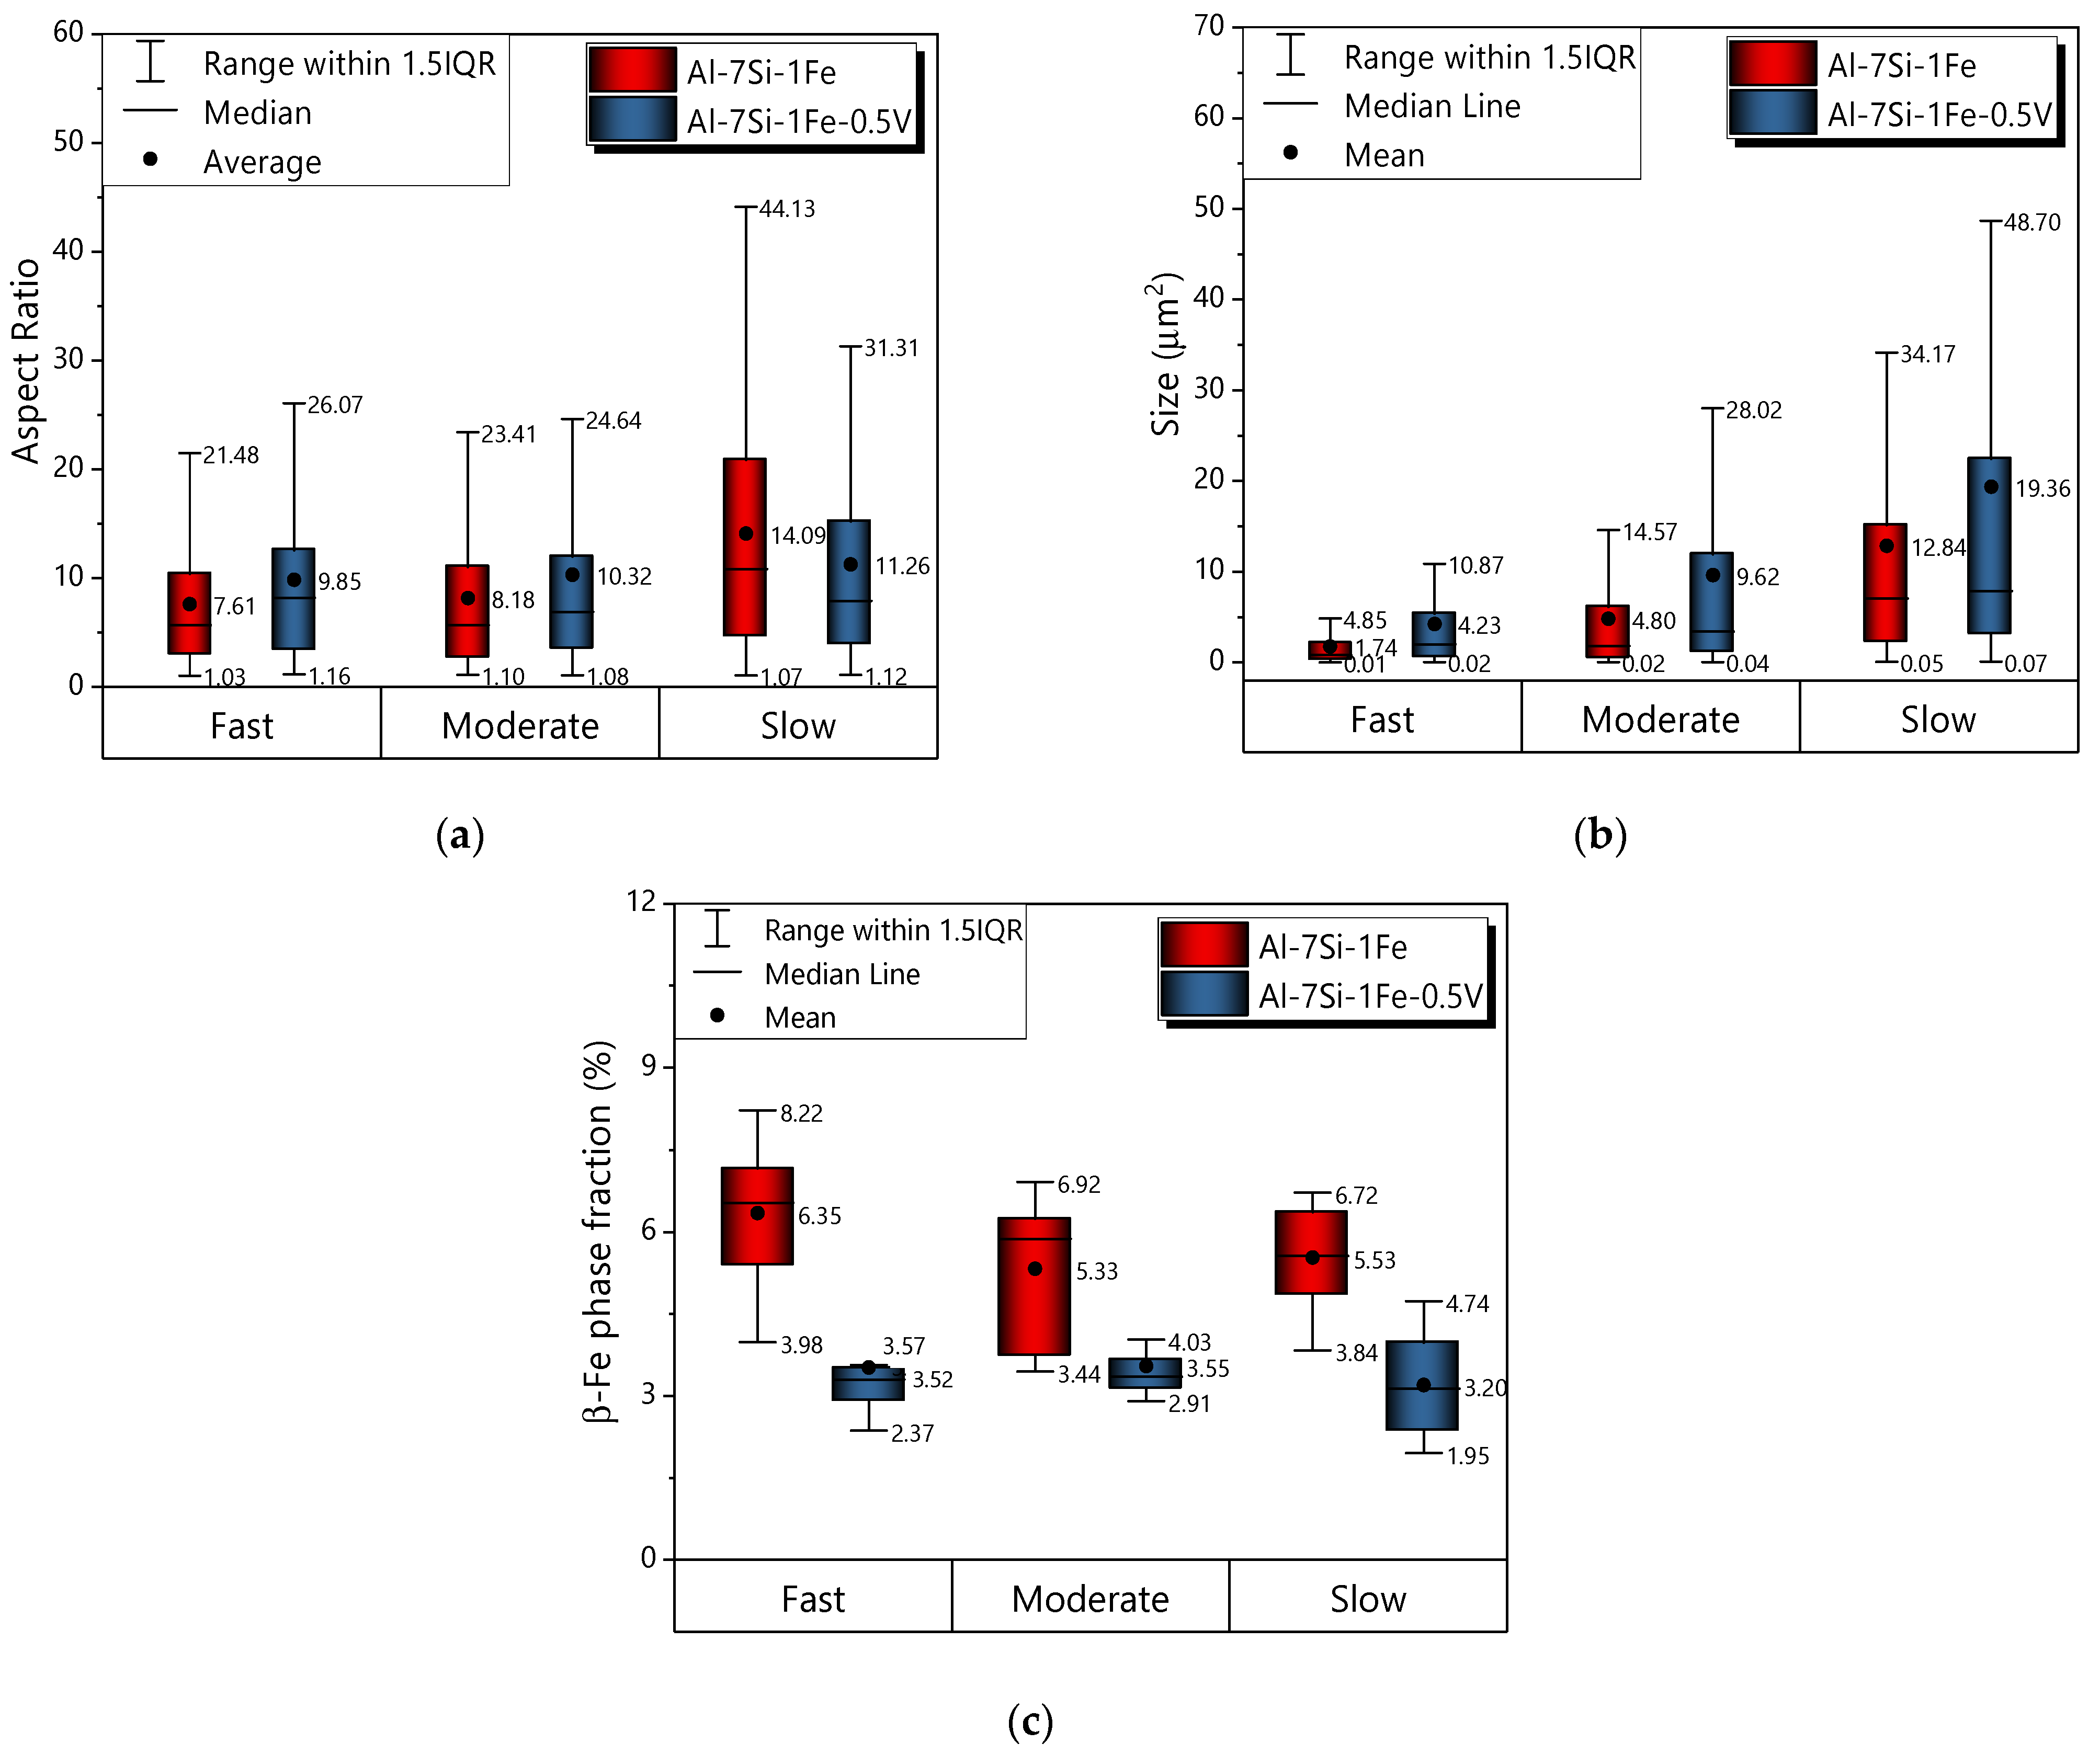
3.3. Microstructural Phases

Figure 7 shows the XRD patterns for Al-7Si-1Fe(-0.5V) alloys samples solidified at T ˙ a v e ~15, 5 and 0.5 °C/s, which correspond to fast, moderate, and slow cooling regimes, respectively. For the Al-7Si-1Fe alloy, the peaks evidence the formation of the (Al), (Si) and β-AlFeSi phases. The XRD patterns of the V-containing alloy reveals extra peaks that correspond to the α-AlSiFeV phase. Apparently, an incomplete consumption of the α-AlSiFeV due to the transient heat flow conditions of the solidification experiment may occur. This might have led such a phase to a metastable state.
Figure 8 displays typical SEM images of the Al-7Si-1Fe alloy with respective EDS elemental maps. The microstructure of such alloys was basically the same along the entire DS casting. It was composed of Al-rich dendrites surrounded by Si and β-AlFeSi particles. All β-AlFeSi particles were characterized by a needle-like morphology. Commonly denoted as Al5SiFe or Al9Si2Fe2, β-AlFeSi particles are needle- or platelet-shaped [26,27]. Regarding the Si particles, they were fibrous for higher cooling regime and flaky for slow cooling. According to Hearn et al. [28], Si fibrous morphology consists of a combination of rounded and sharp features, whereas Si flaky morphology is blocky, elongated, and not rounded.
Characteristics SEM images of the Al-7Si-1Fe-0.5V alloy solidified at fast and slow cooling regimes are given in Figure 9 with the corresponding EDS elemental maps. Overall, Al-rich dendrites are surrounded with V-containing particles (α-AlSiFeV and Al3V), fibrous/flaky Si, and needle-like β-AlFeSi. The main difference as compared to the ternary alloy is the presence of the α-AlSiFeV phase, which assumed Chinese-script morphology for slow cooling and block-like for fast cooling. Additionally, some blocky Al3V particles were observed to occur for fast cooling, though they were not detected by XRD (probably because of their low quantity).
It is worth noting that V has a body-centered cubic crystal structure like that of Fe (below 910 °C), despite their similar atomic radii [29]. Thus, it is plausible to assume that the stability of the α-AlSiFeV phase is a result of V substituting Fe in the α-AlFeSi phase. Such a mechanism is like that of Mn on Fe-rich IMCs [12]. Analyzing different Al-Si-Fe-Mn alloys solidified at different cooling rates, Becker et al. [30] observed that a higher Mn content combined with a proper cooling rate can suppress the formation of plate-shaped IMCs through the formation of the cubic 𝛼c-Al15(Fe, Mn)3Si2 phase, which nucleates with a Chinese-script morphology. Hence, it seems that the formation of the α-AlSiFeV phase can favor the same through a partial suppression of needle-like β-AlFeSi particles. For fast cooling, however, V had no proper conditions to transform the β-AlFeSi into α-AlSiFeV. V only interacted with Al leading to the formation of Al3V.
Statistical analyses of aspect ratio, area size, and fraction are shown in Figure 10 for the β-AlFeSi particles. For a better interpretation, the cooling regime was classified into three categories, just like the methodology adopted by Silva et al. [31]. The categories are: i—fast ( T ˙ a v e > 8.5   ° C s 1 ); ii—moderate ( 8.5   ° C s 1 T ˙ a v e > 1.6   ° C s 1 ); and iii—slow ( T ˙ a v e 1.6   ° C s 1 ). Figure 10a demonstrates that the Al-7Si-1Fe-0.5V alloy only has β-AlFeSi particles with a lower aspect ratio for slow cooling. Moreover, Figure 10b shows that such an alloy has β-AlFeSi IMCs with greater size, no matter the cooling regime. Qin et al. [11] observed that the length of β-AlFeSi particles depends on the V content added to Al-Si hypoeutectic alloys. Herein, it is shown that the addition of 0.5 wt.%V to the Al-7Si-1Fe alloy induces larger β-AlFeSi particles. Figure 10c shows that the addition of 0.5 wt.%V reduces at least 1.8% of area fraction, indicating that V suppresses partially the formation of the harmful β-AlFeSi phase.
Figure 10 shows that, under transient solidification, this can change. The addition of V promotes the reduction in area fraction of the β-AlFeSi phase. The difference is even more pronounced for fast cooling. It seems that V plays a role similar to that of Mn. Wang et al. observed that the addition of Mn combined with higher cooling rates promoted the formation of the α -phase in the A380 alloy, thus decreasing the β-fraction. They concluded that it occurs because Mn has an atomic ratio like that of Fe, and then can replace it on Fe-rich intermetallics, thus favoring the α -Fe formation instead of β-AlFeSi. The same idea can be extended to V considering the formation of the α-AlSiFeV phase.

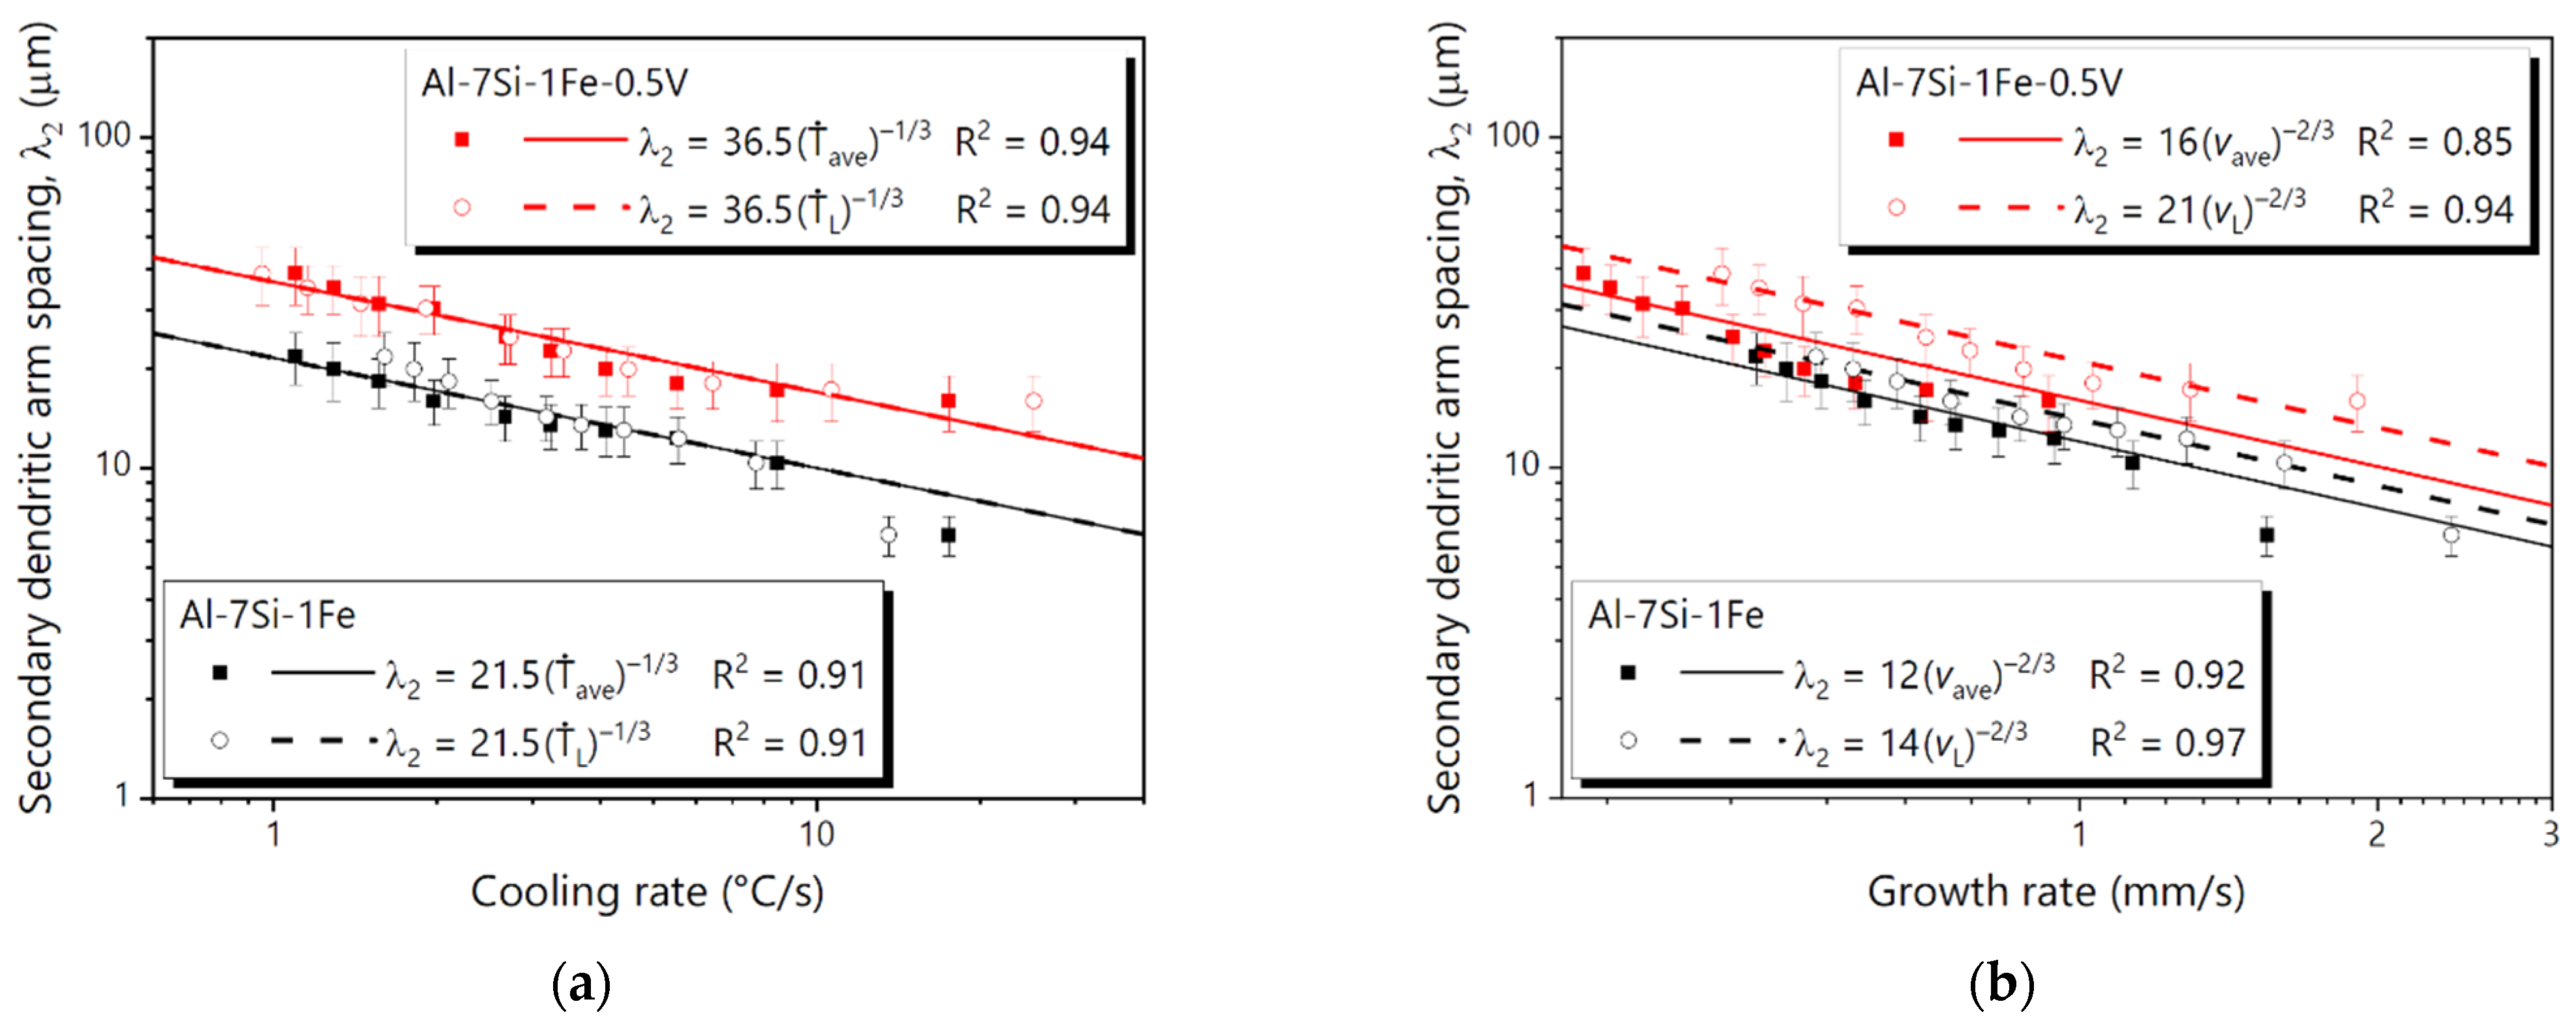
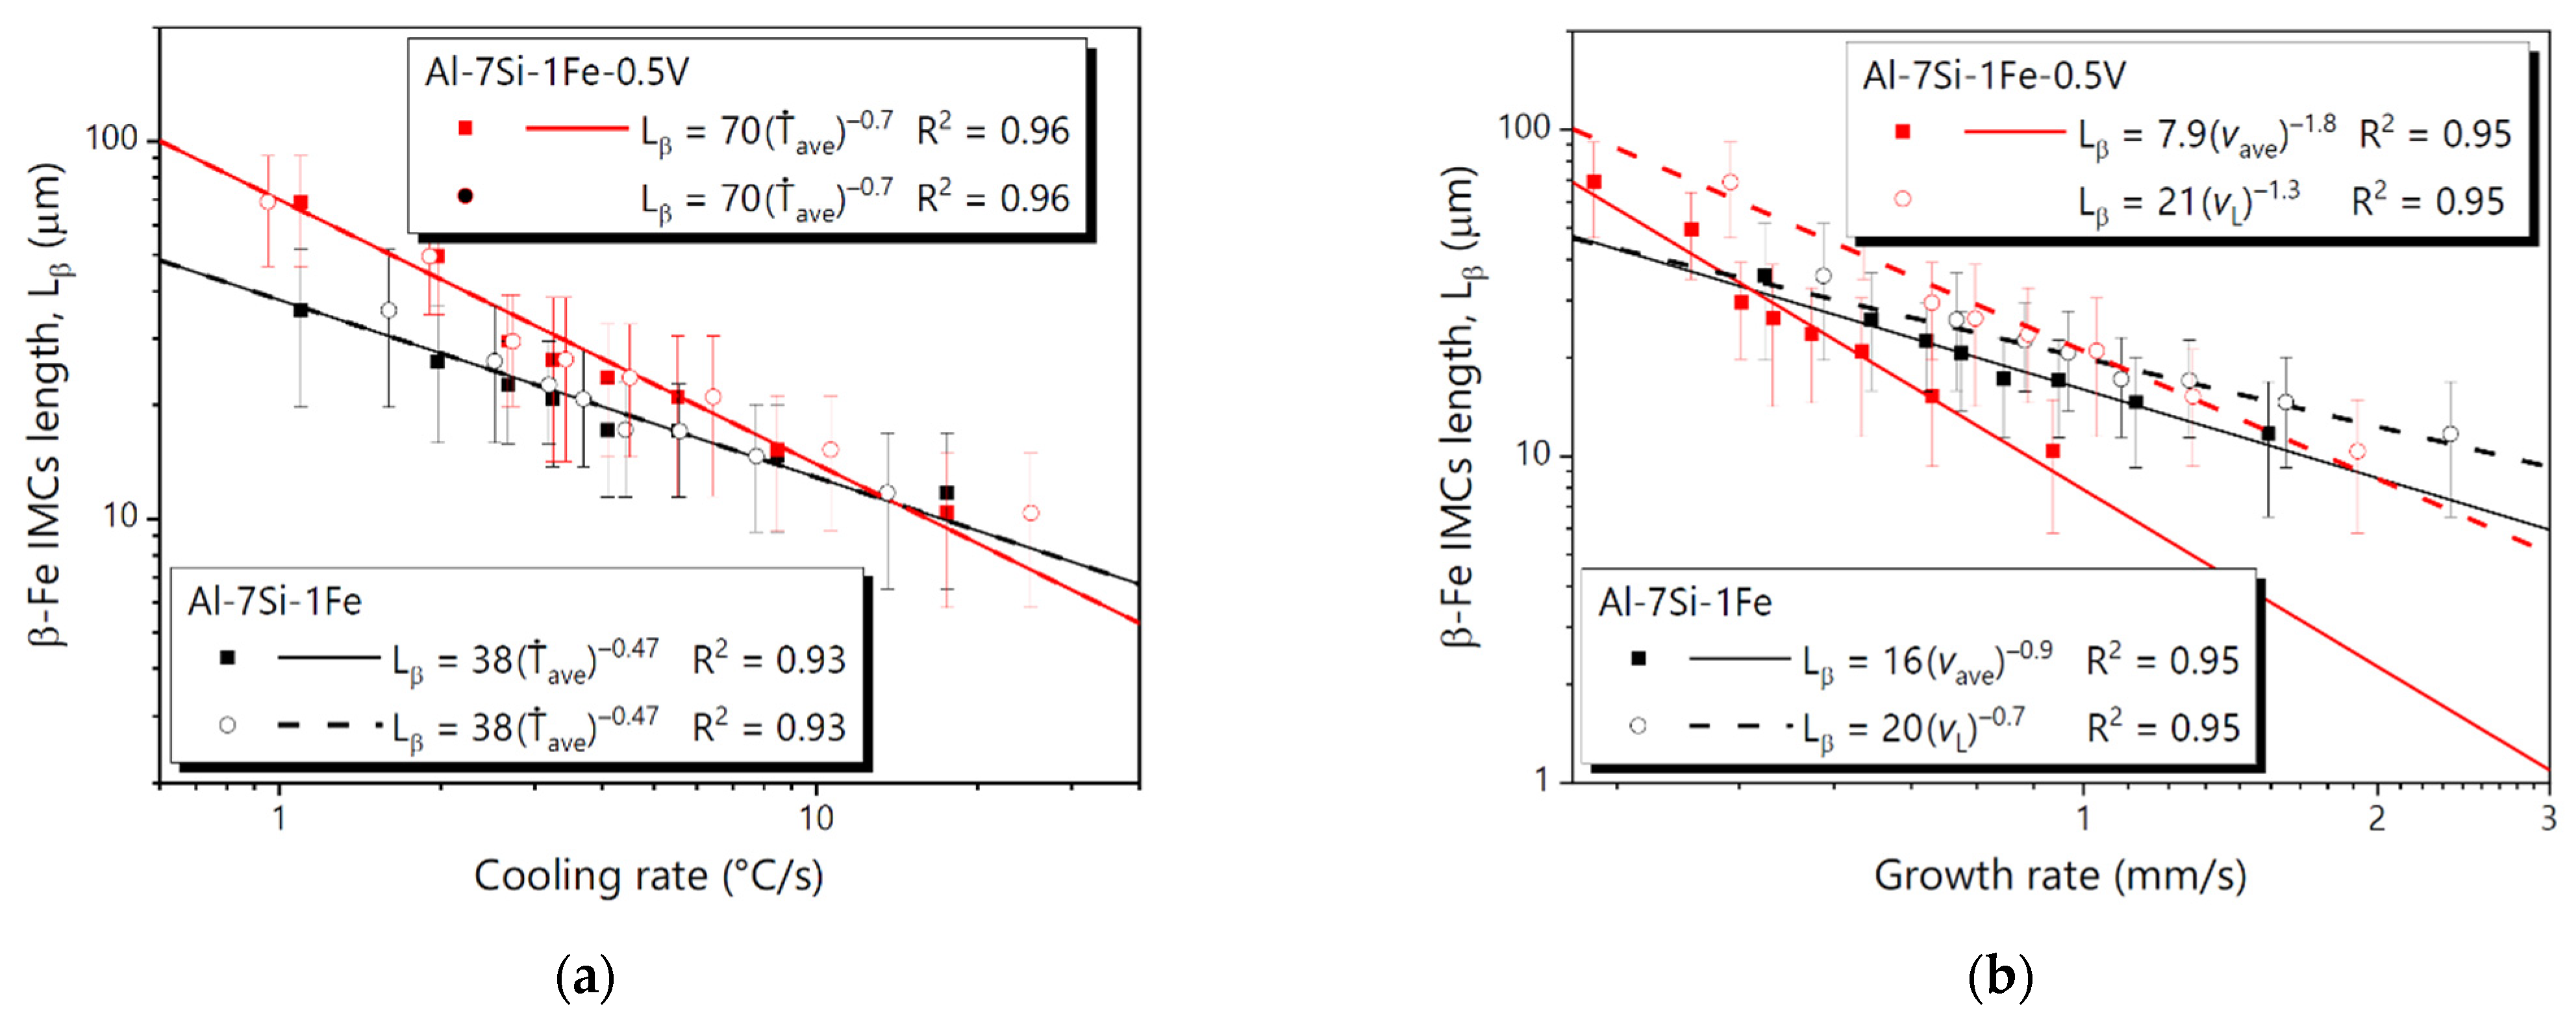
3.4. Microstructural Growth Laws

Representative optical micrographs of cross and longitudinal sections of the directionally solidified Al-7Si-1Fe and Al-7Si-1Fe-0.5V alloys are given in Figure 11. Overall, the faster the cooling conditions, the finer the microstructure. As the cooling attenuates, the dendritic microstructure becomes coarser, which is to be expected. Consequently, it is possible to measure the dendritic arm spacings and associate them with the solidification thermal parameters.
The primary (λ1) and secondary (λ2) dendrite arm spacings are plotted versus the solidification thermal parameters in Figure 12 and Figure 13, respectively. Note that the exponents were set to be the same values previously reported for several Al-based alloys, i.e., −0.55 and −1.1 exponents in experimental laws to correlate λ1 with cooling rate and growth rate, respectively, and −1/3 and −2/3 to correlate λ2 with cooling rate and growth rate, respectively, which proved to be effective for several binary and ternary alloys solidified under unsteady-state conditions [31,32,33]. Interestingly, the conclusions are the same either using the equation with liquidus or with average thermal parameters. In fact, the equations are the same for T ˙ L and T ˙ a v e . For a given T ˙ a v e , the addition of 0.5 wt.%V to the Al-7Si-1Fe alloy increases λ1 and reduces λ2.
Figure 14 relates the length of β-AlFeSi particles (Lβ) to cooling and growth rates. Although the experimental dataset is quite close, Lβ clearly tends to increase when the addition of 0.5 wt.%V is combined with a slow cooling regime (lower cooling and growth rates) during solidification. The experimental equations based on cooling rates also indicate that Lβ decreases with the addition of V only if cooling is more intense.

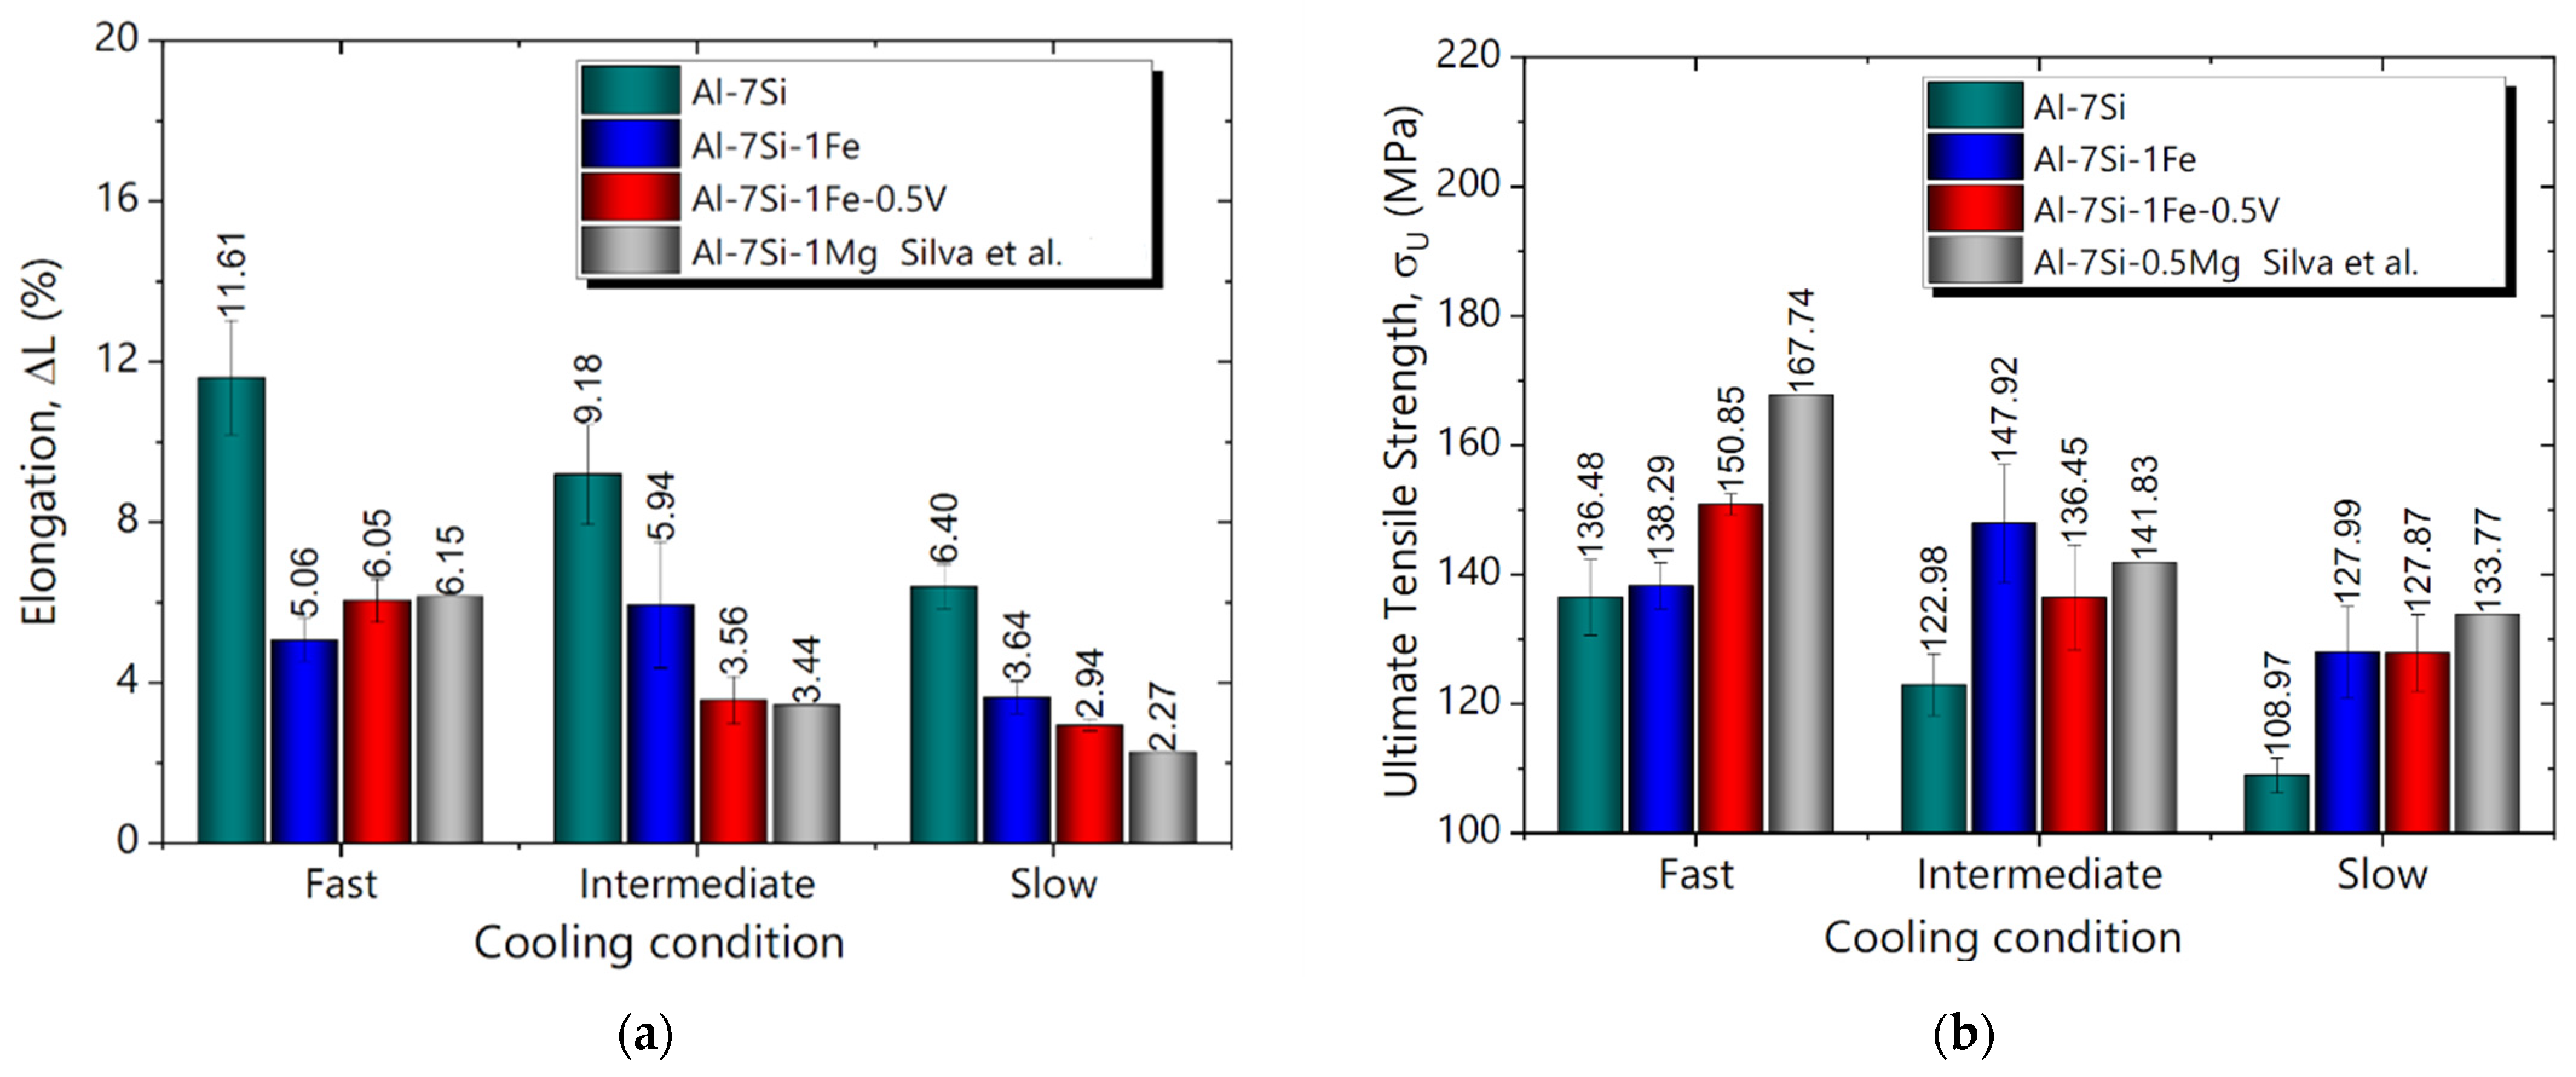
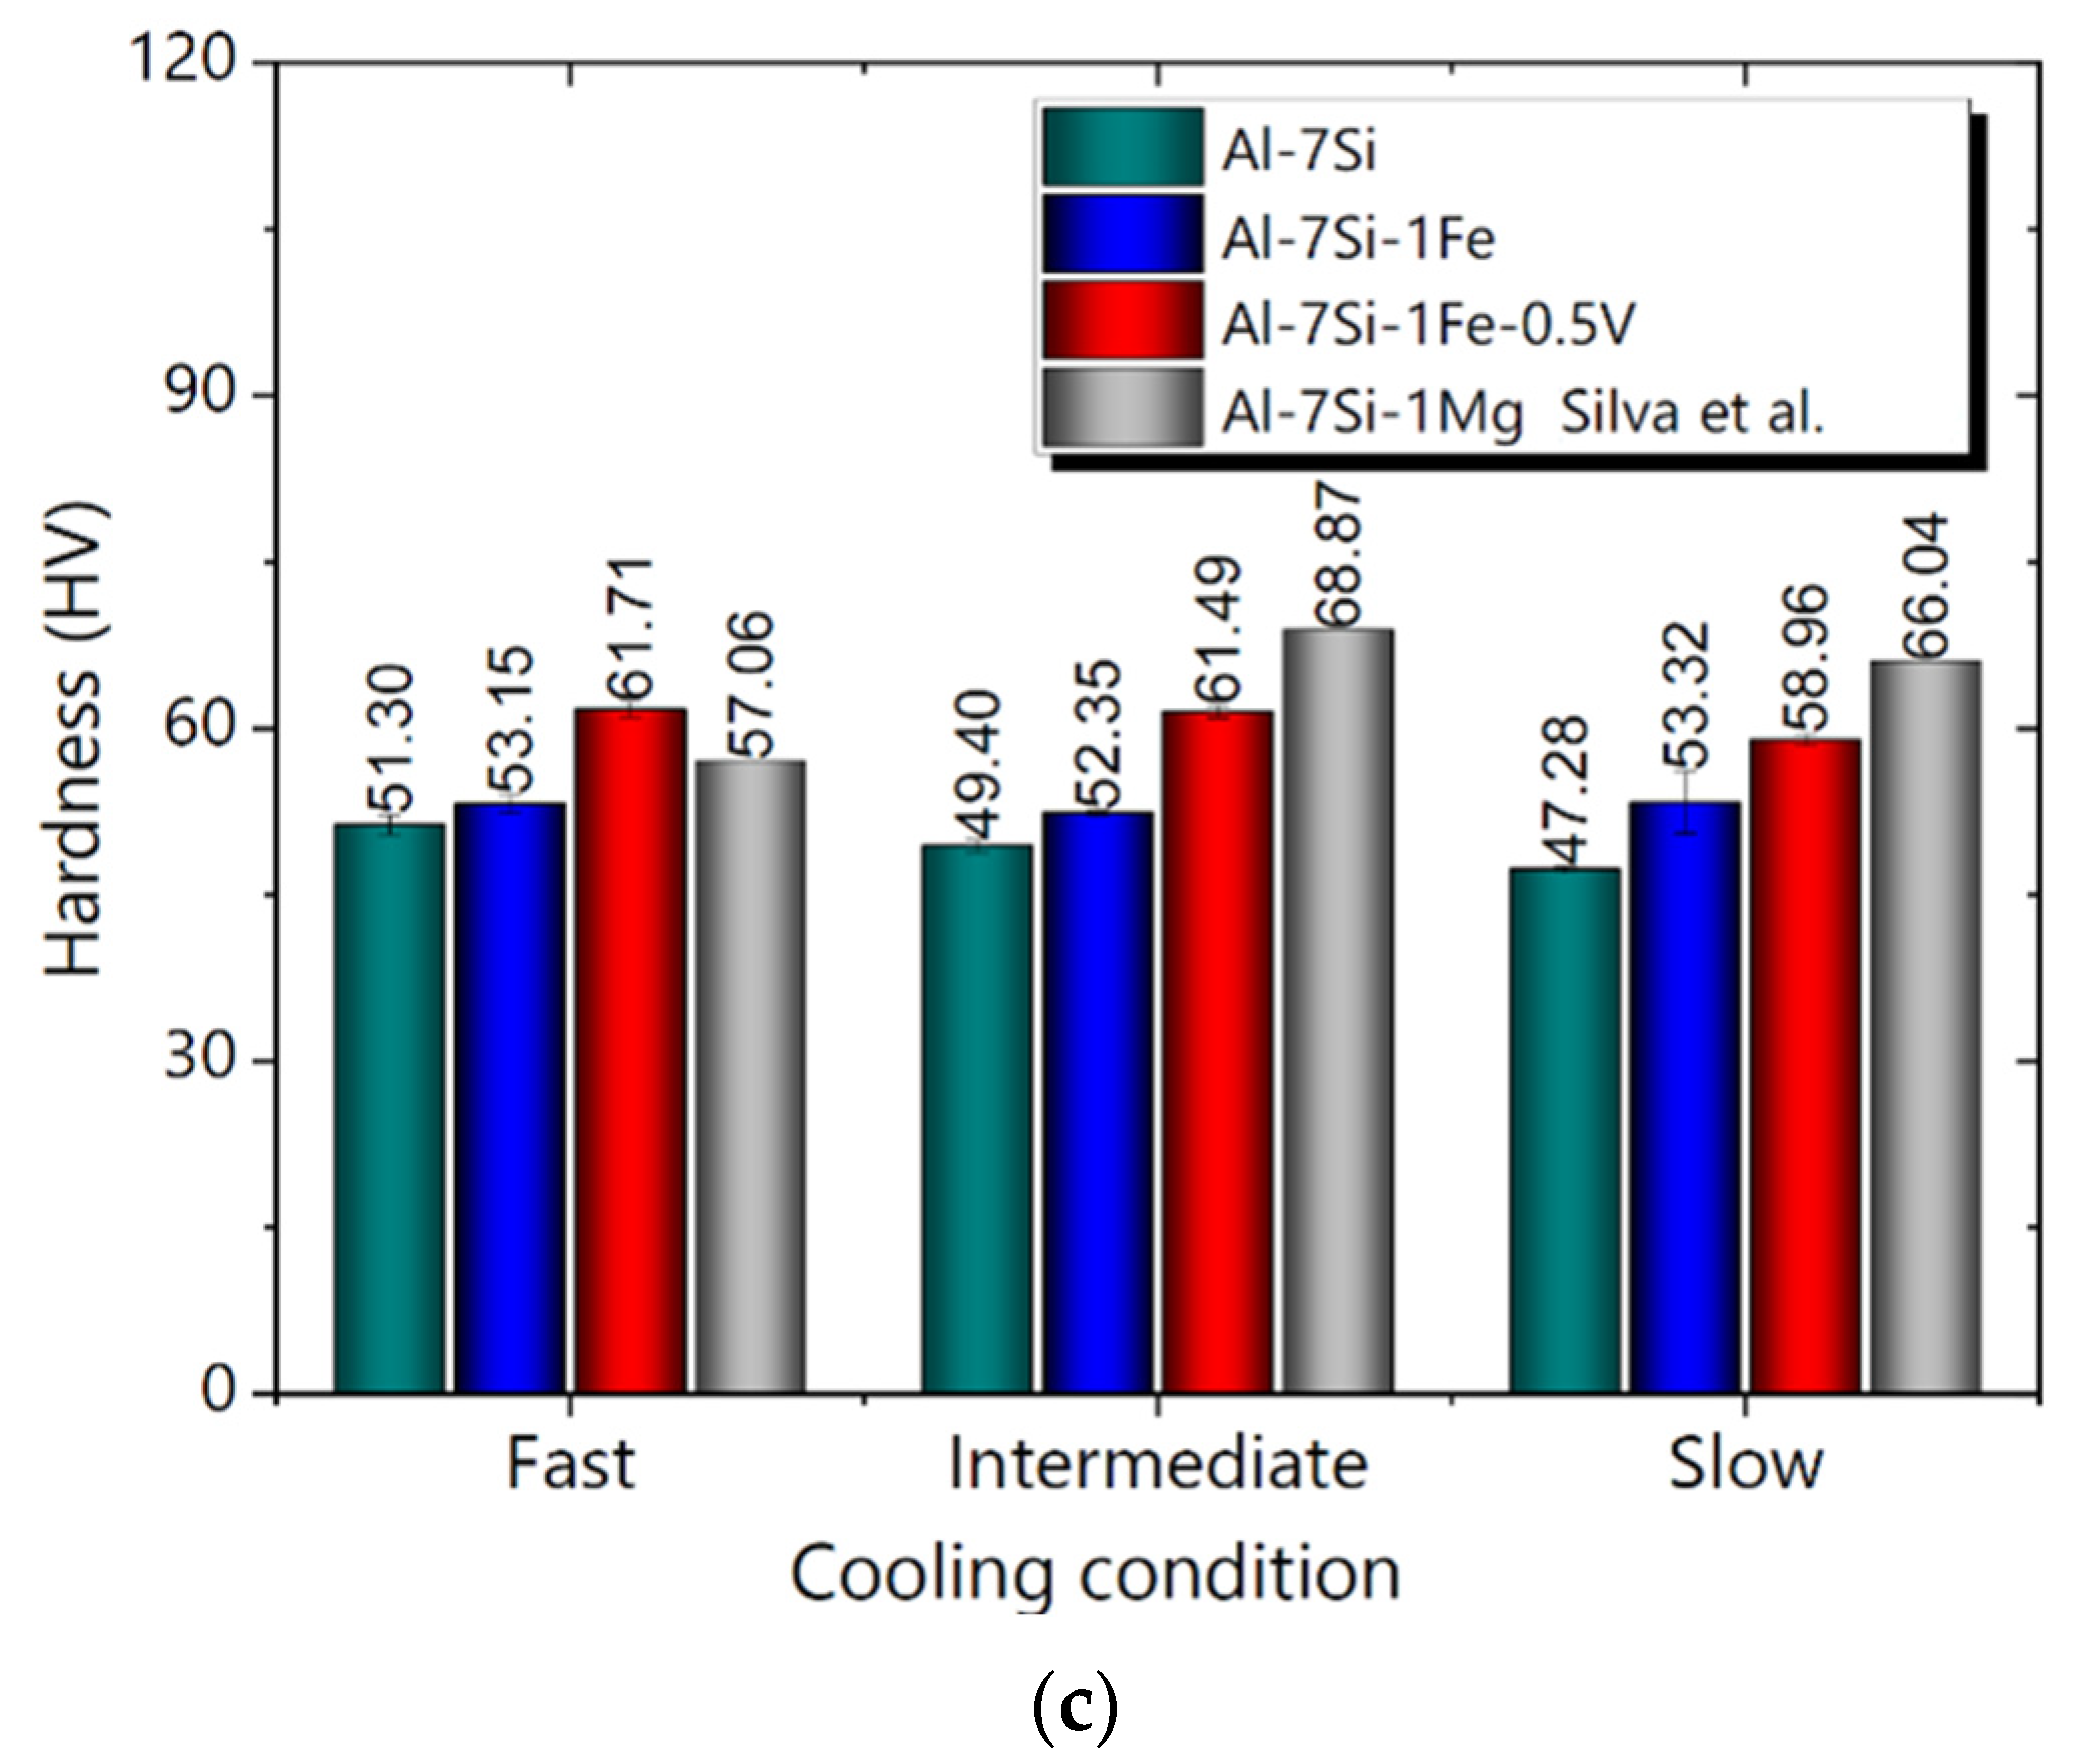
3.5. Mechanical Properties and Cooling Regime

Figure 15a,b associate elongation ( Δ L) and ultimate tensile strength ( σ U ) with the cooling regime, respectively. The cooling conditions were divided into three categories just like the methodology adopted by Silva et al. [31]. As previously stated, a detailed description of microstructure evolution of the Al-7Si alloy can be found in reference [19]. Herein, the focus is on their mechanical behavior. Clearly, the Al-7Si alloy possesses higher Δ L and lower σ U . Furthermore, both tensile properties tend to improve as cooling intensifies. Overall, when 1 wt.%Fe is incorporated, Δ L decreases and σ U increases. This is directly associated with the presence of needle-like β-AlFeSi particles, which act as a reinforcement, but at the same time, impact Δ L negatively. Interestingly, moderate cooling induces a better combination of such properties for the ternary alloy. For fast cooling, the high fraction of β-AlFeSi phase fragilizes the alloy. For slow cooling, the aspect ratio of β-AlFeSi particles become determinant, instead of their fraction. Larger particles with high aspect ratio contribute to magnify deleterious effects on Δ L and σ U . Moderate cooling seems to promote the optimal combination of phase fraction, area size and aspect ratio. Figure 15c shows that the hardness of all studied alloys is practically unaffected by the cooling regime.
Apparently, the addition of 0.5 wt.%V to the Al-7Si-1Fe alloy is only advantageous when associated with fast cooling conditions. In that case, both Δ L and σ U are improved due to the reduction in the fraction of the β-AlFeSi phase. This happens due to the formation of V-containing phases, especially Al3V and α -AlFeSiV. For moderate and slow cooling, the addition of V increases the aspect ratio. That means the aspect ratio of the microstructural particles is a key factor, as observed for the Al-7Si-1Fe alloy. Compared to the Al-7Si-0.5Mg alloy investigated by Silva et al. [31], the Al-7Si-1Fe-0.5V alloy has close Δ L and σ U values. Therefore, the addition of 0.5 wt.%V is a potential alternative for the recycling of the Al-7Si-1Fe alloy for casting technologies associated with faster cooling conditions, such as strip casting. On the other hand, such addition of V cannot be attractive for sand casting since it involves quite slower cooling conditions.

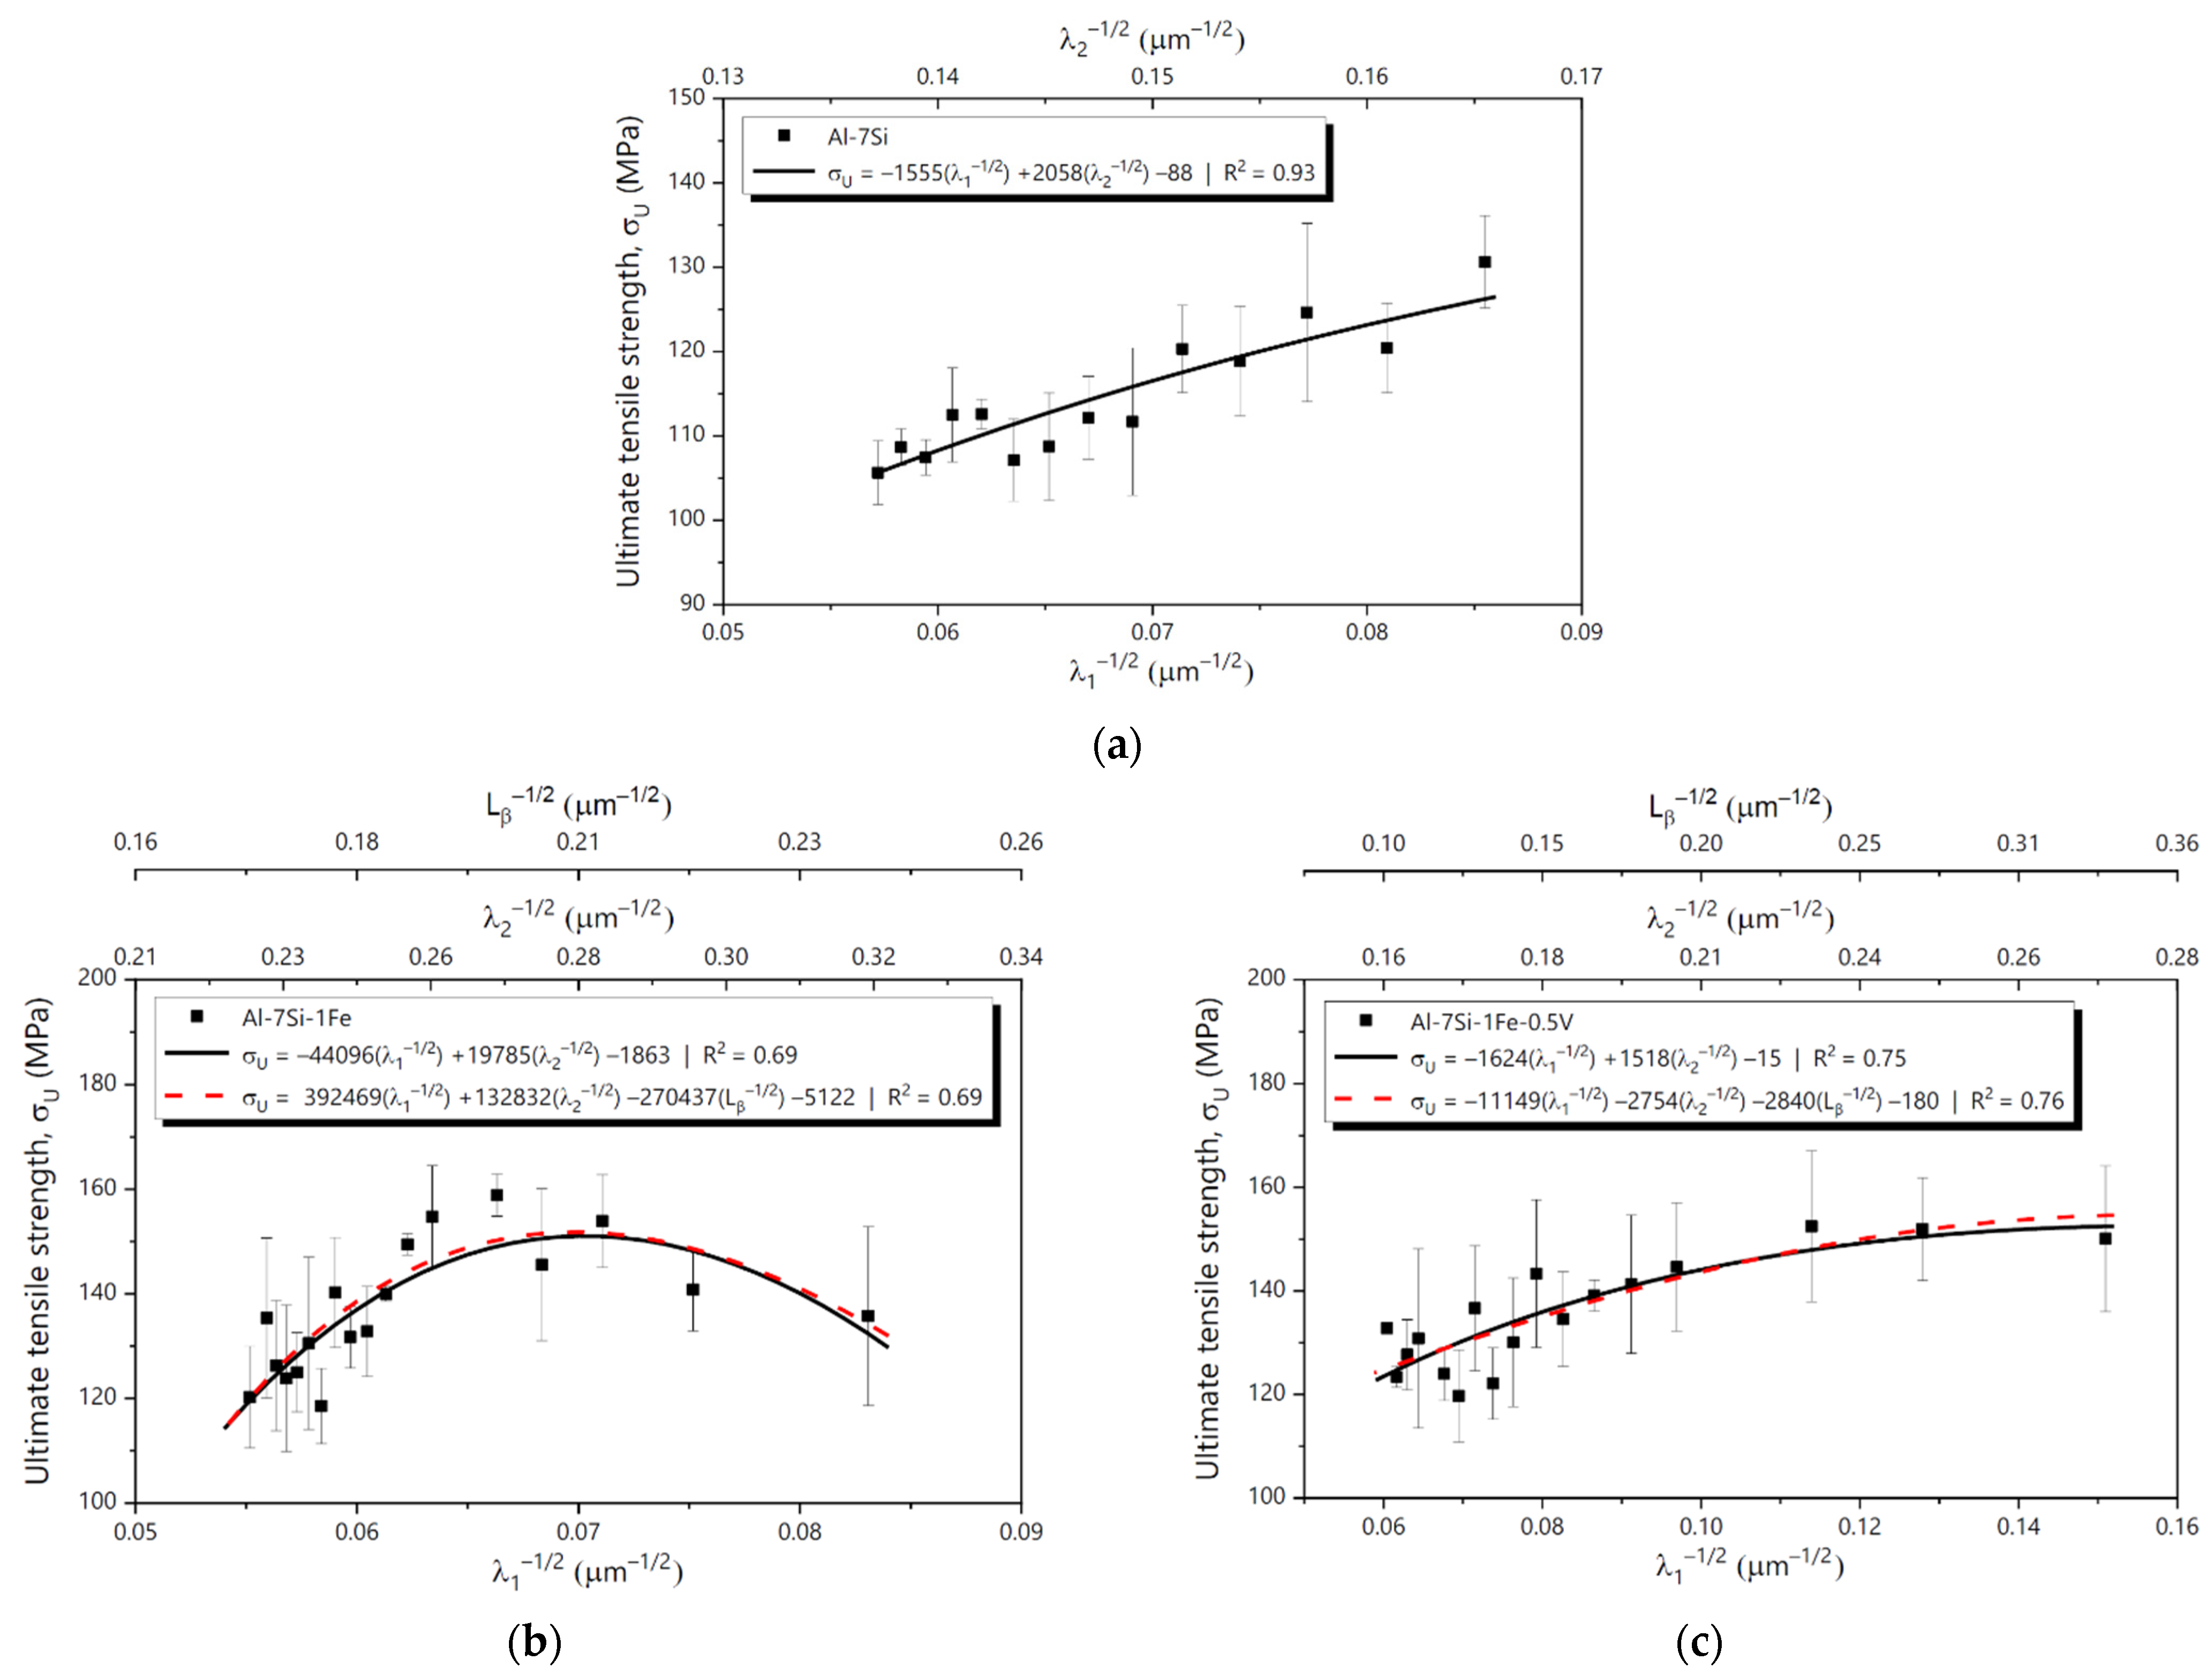
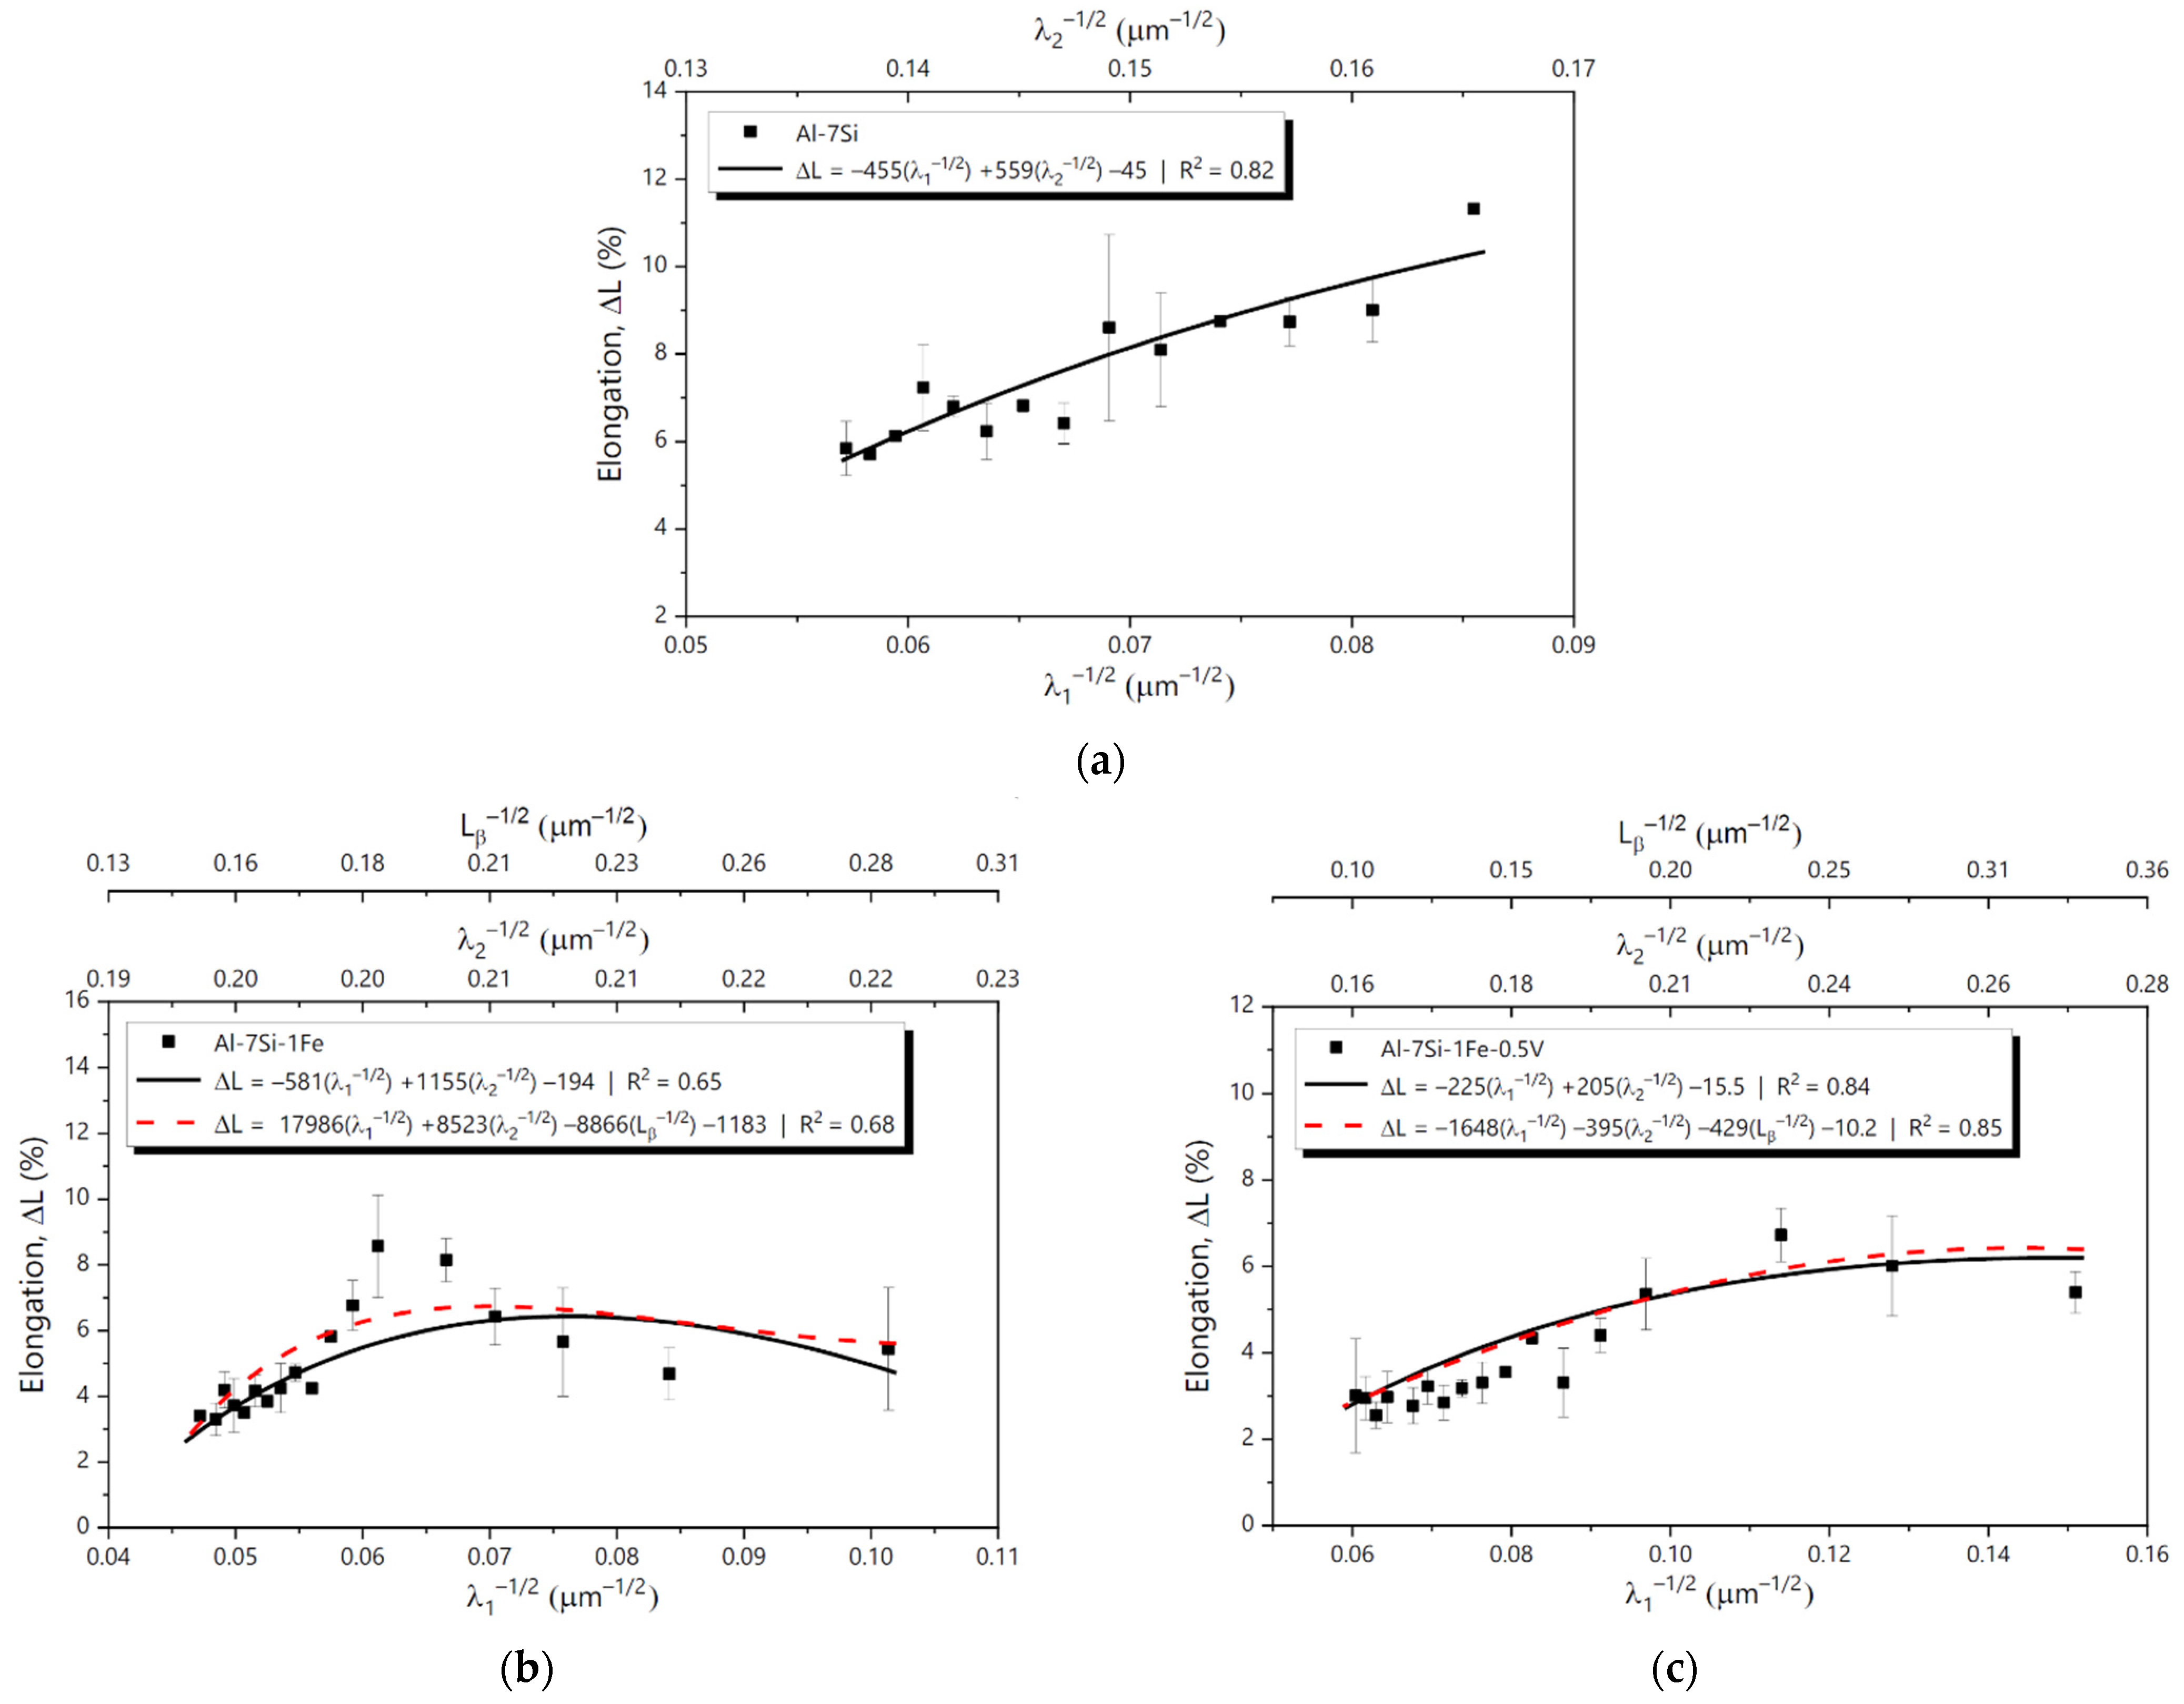
3.6. Tensile Behavior and MLR Analysis

Hall-Petch-type equations relating the ultimate tensile strength ( σ U ) of the studied alloys to the inverse of the square root of λ1, λ2 and Lβ are shown in Figure 16 in the form of MLR plots. Extra horizontal axes were added to the MLR graphs, so that all the microstructural spacings could be represented. Unlike the Al-7Si alloy, the Al-7Si-1Fe(−0.5V) alloys have two proposed equations. One equation considers only λ1 and λ2 and the other includes Lβ. Overall, σ U of the Al-7Si and Al-7Si-1Fe-0.5V alloys tend to increase with the reduction in the microstructural spacings, while σ U of the Al-7Si-1Fe alloy achieves a maximum value with the microstructure refinement and then starts decreasing. This is because the aspect ratio of β-AlFeSi particles is determinant at slow cooling conditions, while the fraction of β-AlFeSi particles is the key-factor for fast cooling. That means there is a point with a more adequate combination of such features. It is worth noting that changes in λ1 are directly associated with shifts in λ2 and Lβ, thus characterizing multicollinearity during the MLR analysis. On the other hand, multicollinearity does not interfere in the usefulness of the regression equations.
Figure 17 presents Hall-Petch-type equations relating the elongation (ΔL) of the investigated alloys to the inverse of the square root of λ1, λ2 and Lβ through MLR plots. Again, two equations are proposed for the Al-7Si-1Fe(−0.5V) alloys (one equation involves only λ1 and λ2 and the other incorporates Lβ). For the Al-7Si and Al-7Si-1Fe-0.5V alloys, ΔL improves with the microstructure refinement. For the Al-7Si-1Fe alloy, however, ΔL reaches a maximum and then starts decreasing. This behavior is like that observed for σ U . Again, there is an optimum point. Overall, the equations that consider only λ1 and λ2 already fit the experimental data very well. No significant changes in the curves were experienced with the inclusion of Lβ as an independent variable. In both cases, the R2 values are almost the same. However, it must be stressed that p-values for equations with Lβ are high (see Table 2). A possible reason for that is the multicollinearity, which is apparently interfering in the analysis of individual contributions. The microstructural spacings are correlated among themselves, including Lβ. Thus, the incorporation of many independent variables that are associated with each other, may turn the coefficients very sensitive to small shifts in the model. Consequently, the p-values related to Lβ cannot be decisive to interpret if such a microstructural feature is statistically significant or not. That is, the withdrawal of Lβ does not mean that the β phase had no influence. In fact, the discussion associated with Figure 10 demonstrates clearly that the features of the β phase are crucial. Aspect ratio, size (area) and fraction (%) were not included in the MLR analysis just because they cannot be put in terms of Hall-Petch format, i.e., they are not microstructural spacings that can be accounted for as their inverse values in square root. Additionally, their inclusion would make the model more complex. As previously stated, λ1 and λ2 were already enough to be used as independent variables. As previously stated, the hardness of the studied alloys was practically constant for the different cooling regimes. That is why no MLR fit was proposed for hardness.

4. Conclusions

The following conclusions can be drawn from this investigation:
  • The microstructure of the Al-7Si-1Fe alloy was shown to be composed of Al-rich dendrites surrounded by fibrous/flaky Si and needle-like β-AlFeSi particles. With 0.5V addition, the microstructure consisted of Al-rich dendrites surrounded with V-containing particles (α-AlSiFeV and Al3V), fibrous/flaky Si, and needle-like β-AlFeSi.
  • Experimental growth laws relating the dendritic arm spacings (λ1 and λ2) to solidification thermal parameters were determined using characteristic exponents previously reported for several binary and ternary Al-based alloys. The addition of 0.5 wt.%V to the Al-7Si-1Fe alloy was shown to increase λ1 and reduce λ2.
  • The addition of 0.5 wt.%V to the Al-7Si-1Fe alloy was shown to be only advantageous when associated with fast cooling conditions, with both elongation ( Δ L) and ultimate tensile strength ( σ U ) being improved. Therefore, the addition of 0.5 wt.%V was shown to be a potential alternative for the recycling of the Al-7Si-1Fe alloy for casting technologies associated with faster cooling conditions. The hardness of all studied alloys was shown to be practically unaffected by the cooling regime.
  • Hall-Petch-type equations relating σ U and ΔL of the studied alloys to the inverse of the square root of λ1, λ2 and the length of β-AlFeSi particles (Lβ) were proposed in the form of MLR plots. Overall, σ U of the Al-7Si and Al-7Si-1Fe-0.5V alloys were shown to increase with the reduction in the microstructural spacings, whereas σU of the Al-7Si-1Fe alloy achieved a maximum value with the microstructure refinement and then started decreasing. For the Al-7Si and Al-7Si-1Fe-0.5V alloys, ΔL improved with the microstructure refinement. For the Al-7Si-1Fe alloy, however, ΔL reached a maximum and then started decreasing.

Author Contributions

All authors contributed substantially to the conception and design of the study. First, alloys preparation, solidification experiments, data collection and analysis were carried out by C.S., A.B. and T.S. Characterization and analysis of the microstructures were conducted by C.S., R.K., T.S. and A.B. Accomplishment and interpretation of mechanical testing were carried out by C.S., A.V.R. and A.B. N.C. and A.G. critically revised the work for important intellectual content. The first draft of the manuscript was written by C.S., A.B., A.V.R. and N.C. All authors have read and agreed to the published version of the manuscript.

Funding

FAPESP-São Paulo Research Foundation, Brazil (grant 2021/11439-0); FAPEAM-Amazonas State Research Support Foundation; CNPq-National Council for Scientific and Technological Development, Brazil; CAPES-Coordenação de Aperfeiçoamento de Pessoal de Nível Superior, Brazil (Finance Code 001); and FAEPEX/UNICAMP-Fundo de Apoio ao Ensino, à Pesquisa e à Extensão (grants 2162/21 and 2549/22).

Institutional Review Board Statement

Not applicable.

Informed Consent Statement

Not applicable.

Data Availability Statement

Not applicable.

Acknowledgments

This research used facilities of the Brazilian Nanotechnology National Laboratory (LNNano), part of the Brazilian Centre for Research in Energy and Materials (CNPEM), a private non-profit organization under the supervision of the Brazilian Ministry for Science, Technology, and Innovations (MCTI). The SEM–FIB staff is acknowledged for the assistance during the experiments (SEM–FIB–C1–20210595).

Conflicts of Interest

The authors declare no conflict of interest.

References

  1. Løvik, A.N.; Modaresi, R.; Müller, D.B. Long-Term Strategies for Increased Recycling of Automotive Aluminum and Its Alloying Elements. Environ. Sci. Technol. 2014, 48, 4257–4265. [Google Scholar] [CrossRef] [PubMed]
  2. Jarfors, A.E.; Du, A.; Yu, G.; Zheng, J.; Wang, K. On the Sustainable Choice of Alloying Elements for Strength of Aluminum-Based Alloys. Sustainability 2020, 12, 1059. [Google Scholar] [CrossRef] [Green Version]
  3. Yılmaz, T.G.; Tüfekçi, M.; Karpat, F. A Study of Lightweight Door Hinges of Commercial Vehicles Using Aluminum Instead of Steel for Sustainable Transportation. Sustainability 2017, 9, 1661. [Google Scholar] [CrossRef] [Green Version]
  4. Kashyap, K.T.; Murali, S.; Raman, K.S.; Murthy, K.S.S. Casting and Heat Treatment Variables of Al-7Si-Mg alloy. Mater. Sci. Technol. 1993, 9, 189–203. [Google Scholar]
  5. Tiryakioǧlu, M.; Staley, J.T.; Campbell, J. Evaluating Structural Integrity of Cast Al-7%Si-Mg Alloys via Work Wardening Char-acteristics II. A New Quality Index. Mater. Sci. Eng. A 2004, 368, 231–238. [Google Scholar] [CrossRef]
  6. Kaiser, M.S.; Sabbir, S.H.; Kabir, M.S.; Soummo, M.R.; Al Nur, M. Study of Mechanical and Wear Behaviour of Hyper-Eutectic Al-Si Automotive Alloy Through Fe, Ni and Cr Addition. Mater. Res. 2018, 21. [Google Scholar] [CrossRef] [Green Version]
  7. Wan, B.; Chen, W.; Liu, L.; Cao, X.; Zhou, L.; Fu, Z. Effect of Trace Yttrium Addition on the Microstructure and Tensile Properties of Recycled Al–7Si–0.3Mg–1.0Fe Casting Alloys. Mater. Sci. Eng. A 2016, 666, 165–175. [Google Scholar] [CrossRef]
  8. Tillová, E.; Chalupová, M.; Borko, K.; Kuchariková, L. Changes of Fracture Surface in Recycled A356 Cast Alloy. Mater. Today Proc. 2016, 3, 1183–1188. [Google Scholar] [CrossRef]
  9. Baldan, R.; Malavazi, J.; Couto, A.A. Microstructure and Mechanical Behavior of Al9Si0.8Fe Alloy with Different Mn Contents. Mater. Sci. Technol. 2017, 33, 1192–1199. [Google Scholar] [CrossRef]
  10. Canté, M.V.; Lima, T.S.; Brito, C.; Garcia, A.; Cheung, N.; Spinelli, J.E. An Alternative to the Recycling of Fe-Contaminated Al. J. Sustain. Met. 2018, 4, 412–426. [Google Scholar] [CrossRef]
  11. Qin, R.; Yan, R.F.; Guan, Z.P.; Zhang, G.Q.; Song, J.W.; Ren, M.W.; Wang, J.G. Effect of Vanadium on Fe-rich Phase, Mechanical Properties and Thermal Conductivity of Hypoeutectic Al–Si Alloy. Mater. Res. Express 2021, 8, 026518. [Google Scholar] [CrossRef]
  12. Lin, B.; Li, H.; Xu, R.; Xiao, H.; Zhang, W.; Li, S. Effects of Vanadium on Modification of Iron-Rich Intermetallics and Mechanical Properties in A356 Cast Alloys with 1.5 wt.% Fe. J. Mater. Eng. Perform. 2018, 28, 475–484. [Google Scholar] [CrossRef]
  13. Sahoo, K.L.; Pathakb, B.N. Solidification Behavior, Microstructure and Mechanical Properties of High Fe-Containing Al–Si–V Alloys. J. Mater. Process. Technol. 2009, 209, 798–804. [Google Scholar] [CrossRef]
  14. Szymczak, T.; Gumienny, G.; Klimek, L.; Goły, M.; Pacyniak, T. Microstructural Characteristics of AlSi9Cu3(Fe) Alloy with High Melting Point Elements. Metals 2020, 10, 1278. [Google Scholar] [CrossRef]
  15. Essari, A.M.; Ghidhan, S.B.; Kawan, F.A. The Influence of Heat Treatment, Mg Modification and SiCp Reinforcement on Hardness of Al-8Si-8Fe-1.4V Alloy. J. Sci. Technol. (Eng. Appl. Sci.) 2018, 2, 106–112. [Google Scholar]
  16. Rui, C.H.E.N.; Shi, Y.F.; Xu, Q.Y.; Liu, B.C. Effect of Cooling Rate on Solidification Parameters and Microstructure of Al-7Si-0.3Mg-0.15Fe Alloy. Trans. Nonferrous Met. Soc. China 2014, 24, 1645–1652. [Google Scholar]
  17. Lima, J.; Barbosa, C.; Magno, I.; Nascimento, J.; Barros, A.; Oliveira, M.; Souza, F.; Rocha, O. Microstructural evolution during unsteady-state horizontal solidification of Al-Si-Mg (356) alloy. Trans. Nonferrous Met. Soc. China 2018, 28, 1073–1083. [Google Scholar] [CrossRef]
  18. Septimio, R.S.; Costa, T.A.; Silva, C.A.; Vida, T.A.; de Damborenea, J.; Garcia, A.; Cheung, N. Correlation Between Unsteady-State Solidification Thermal Parameters and Micro-structural Growth of Zn–8 mass% Al and Zn–8 mass% Al–XBi Tribological Alloys. J. Therm. Anal. Calorim. 2020, 139, 1741–1761. [Google Scholar] [CrossRef]
  19. Peres, M.; Siqueira, C.; Garcia, A. Macrostructural and microstructural development in Al–Si alloys directionally solidified under unsteady-state conditions. J. Alloy. Compd. 2004, 381, 168–181. [Google Scholar] [CrossRef]
  20. Oliveira, R.; Kakitani, R.; Ramos, L.R.; Gonçalves, D.L.; Garcia, A.; Cheung, N. The Roles of Mn and Ni Additions to Fe-Contaminated Al in Neutralizing Fe and Stabilizing the Cellular α-Al Microstructure. J. Sustain. Met. 2019, 5, 561–580. [Google Scholar] [CrossRef]
  21. Kakitani, R.; Oliveira, R.; Reyes, R.V.; Rodrigues, A.V.; Bertelli, F.; Garcia, A.; Spinelli, J.E.; Cheung, N. Metal/Mold Thermal Conductance Affecting Ultrafine Scale Microstructures in Alu-minum Eutectic Alloys. Case Stud. Therm. Eng. 2021, 26, 101144. [Google Scholar] [CrossRef]
  22. Gündüz, M.; Çadirli, E. Directional Solidification of Aluminium–Copper Alloys. Mater. Sci. Eng. A 2002, 327, 167–185. [Google Scholar] [CrossRef]
  23. ASTM E8; ASTM E8/E8M Standard Test Methods for Tension Testing of Metallic Materials 1. Annual Book of ASTM Standards 4 2010; ASTM International: West Conshohocken, PA, USA, 2021; pp. 1–27.
  24. ASTM E384-17; ASTM E384-17 Standard Test Method for Microindentation Hardness of Materials. ASTM International: West Conshohocken, PA, USA, 2017; pp. 1–40.
  25. Kistler, N.A.; Corbin, D.J.; Nassar, A.R.; Reutzel, E.W.; Beese, A.M. Effect of processing conditions on the microstructure, porosity, and mechanical properties of Ti-6Al-4V repair fabricated by directed energy deposition. J. Mater. Process. Technol. 2018, 264, 172–181. [Google Scholar] [CrossRef]
  26. Zhang, L.; Gao, J.; Damoah, L.N.W.; Robertson, D.G. Removal of Iron from Aluminum: A review. Miner. Process. Extr. Metall. Rev. 2012, 33, 99–157. [Google Scholar] [CrossRef]
  27. Dinnis, C.M.; Taylor, J.A.; Dahle, A.K. As-cast morphology of iron-intermetallics in Al–Si foundry alloys. Scr. Mater. 2005, 53, 955–958. [Google Scholar] [CrossRef]
  28. Hearn, W.; Bogno, A.-A.; Spinelli, J.; Valloton, J.; Henein, H. Microstructure Solidification Maps for Al-10 Wt Pct Si Alloys. Met. Mater. Trans. A 2019, 50, 1333–1345. [Google Scholar] [CrossRef]
  29. Mahta, M.; Emamy, M.; Daman, A.; Keyvani, A.; Campbell, J. Precipitation of Fe rich intermetallics in Cr- and Co-modified A413 alloy. Int. J. Cast Met. Res. 2005, 18, 73–79. [Google Scholar] [CrossRef]
  30. Becker, H.; Bergh, T.; Vullum, P.E.; Leineweber, A.; Li, Y. Effect of Mn and Cooling Rates on α-, β-and δ-Al–Fe–Si Intermetallic Phase Formation in a Secondary Al–Si Alloy. Materialia 2019, 5, 100198. [Google Scholar] [CrossRef]
  31. Silva, C.; Barros, A.; Vida, T.; Garcia, A.; Cheung, N.; Reis, D.A.P.; Brito, C. Assessing Microstructure Tensile Properties Relationships in Al-7Si-Mg Alloys via Multiple Regression. Metals 2022, 12, 1040. [Google Scholar] [CrossRef]
  32. Brito, C.; Costa, T.A.; Vida, T.A.; Bertelli, F.; Cheung, N.; Spinelli, J.E.; Garcia, A. Characterization of Dendritic Microstructure, Intermetallic Phases, and Hardness of Direc-tionally Solidified Al-Mg and Al-Mg-Si Alloys. Metall. Mater. Trans. A 2015, 46, 3342–3355. [Google Scholar] [CrossRef]
  33. Duarte, R.N.; Faria, J.D.; Brito, C.; Verissimo, N.; Cheung, N.; Garcia, A. Length scale of the dendritic microstructure affecting tensile properties of Al–(Ag)–(Cu) alloys. Int. J. Mod. Phys. B 2016, 30, 1550261. [Google Scholar] [CrossRef]
Figure 1. Water-cooled upward directional solidification apparatus.
Sustainability 14 13859 g001
Figure 2. Extraction of samples for the quantification of the length scale of dendritic microstructure and tensile tests.
Sustainability 14 13859 g002
Figure 3. Plots of equilibrium phase fractions versus temperature for the: (a) Al-7Si-1Fe and (b) Al-7Si-1Fe-0.5V alloys.
Sustainability 14 13859 g003
Figure 4. Scheil-Gulliver solidification paths generated by the Thermo-Calc (TTAL5 database) software for: (a) Al-7Si-1Fe and (b) Al-7Si-1Fe-0.5V alloys.
Sustainability 14 13859 g004
Figure 5. Cooling curves recorded along the length of the DS castings: (a) Al-7Si-1Fe and (b) Al-7Si-1Fe-0.5V alloys.
Sustainability 14 13859 g005
Figure 6. Cooling rate (a) and growth rate (b) profiles as a function of the relative position in the DS casting for the investigated alloys.
Sustainability 14 13859 g006
Figure 7. XRD patterns of the directionally solidified alloys for three colling regimes: (a) Al-7Si-1Fe and (b) Al-7Si-1Fe-0.5V.
Sustainability 14 13859 g007
Figure 8. Typical SEM images with EDS mapping detailing the phases present in the Al-7Si-1Fe alloy solidified at fast and slow cooling regimes.
Sustainability 14 13859 g008
Figure 9. Two SEM images with EDS mapping detailing the phases present in the Al-7Si-1Fe-0.5V alloy solidified at fast and slow cooling regimes.
Sustainability 14 13859 g009
Figure 10. (a) aspect ratio, (b) size and (c) area fraction of β-AlFeSi particles of both studied alloys considering three different cooling regimes.
Sustainability 14 13859 g010
Figure 11. Typical optical images of longitudinal and cross sections of the DS Al-7Si-1Fe(-0.5V) alloys castings for three different T ˙ a v e values.
Sustainability 14 13859 g011
Figure 12. Variation of λ1 with: (a) cooling rate and (b) growth rate for both alloys studied herein.
Sustainability 14 13859 g012
Figure 13. Effect of the addition of 0.5 wt.%V to the Al-7Si-1Fe alloy on λ2 values: (a) λ2 vs. cooling rate and (b) λ2 vs. growth rate.
Sustainability 14 13859 g013
Figure 14. Influence of the addition of 0.5 wt.%V addition to the Al-7Si-1Fe alloy on the length of β-AlFeSi: (a) λ2 vs. cooling rate and (b) λ2 vs. growth rate.
Sustainability 14 13859 g014
Figure 15. (a) Elongation, (b) ultimate tensile strength and (c) hardness of the Al-7Si-1Fe(-0.5V) alloys considering three different cooling conditions [31].
Sustainability 14 13859 g015aSustainability 14 13859 g015b
Figure 16. MLR plots of ultimate tensile strength for: (a) Al-7Si, (b) Al-7Si-1Fe, and (c) Al-7Si-1Fe-0.5V alloys.
Sustainability 14 13859 g016
Figure 17. MLR plots of elongation for the (a) Al-7Si, (b) Al-7Si-1Fe, and (c) Al-7Si-1Fe-0.5V alloys.
Sustainability 14 13859 g017
Table 1. Chemical compositions [wt.%] of the metals used in the preparation of the studied alloys.
MetalsAlSiFeVMgCuPbZnCPS
AlBalance0.0060.073-0.0010.010.0060.005---
Si0.109Balance0.316--------
Fe--Balance----<0.02---
V-Fe0.040.9616.7681.9----0.280.040.02
Table 2. Results of the MLR analysis for the studied Al-7Si, Al-7Si-1Fe, and Al-7Si-1Fe-0.5V alloys.
Alloy and Mechanical PropertyStatistical VariableStatistical Values
Al-7Si
σu
R20.93-
F1.79 × 10−9-
Interceptλ1−1/2λ2−1/2Interceptλ1−1/2λ2−1/2Lβ−1/2
Coefficient−88.35−1555.462058.07----
p-value0.007110.00008980.000012----
Al-7Si
ΔL
R20.82-
F2.47 × 10−6-
Interceptλ1−1/2λ2−1/2Interceptλ1−1/2λ2−1/2Lβ−1/2
Coefficient−45.22−454.76558.90----
p-value0.000270.000350.00011----
Al-7Si-1Fe
σu
R20.690.69
F0.0001640.000767
Interceptλ1−1/2λ2−1/2Interceptλ1−1/2λ2−1/2Lβ−1/2
Coefficient−1863.1−44,096.319,785.01−5122.54392,468.74132,831.98−270,436.78
p-value0.000510.000400.000340.72580.84070.79290.8231
Al-7Si-1Fe
ΔL
R20.650.68
F0.0003850.00091
Interceptλ1−1/2λ2−1/2Interceptλ1−1/2λ2−1/2Lβ−1/2
Coefficient−194.25−581.591155.09−1182.7017,986.268522.66−8865.95
p-value0.001190.002180.001110.18750.28010.20140.2655
Al-7Si-1Fe-0.5V
σu
R20.750.76
F0.00002910.000129
Interceptλ1−1/2λ2−1/2Interceptλ1−1/2λ2−1/2Lβ−1/2
Coefficient−14.88−1624.331518.88180.7111,163.26−2759.05−2843.66
p-value0.69640.007040.002980.54060.55970.66620.5047
Al-7Si-1Fe-0.5V
ΔL
R20.840.85
F1.02 × 10−65.56 × 10⁻⁶
Interceptλ1−1/2λ2−1/2Interceptλ1−1/2λ2−1/2Lβ−1/2
Coefficient−15.51−224.59204.7510.231647.77−395.27−429.34
p-value0.001890.003160.001030.76230.50280.61530.4473
Publisher’s Note: MDPI stays neutral with regard to jurisdictional claims in published maps and institutional affiliations.

