Article

Parametric Study on the Behavior of Steel Tube Columns with Infilled Concrete—An Analytical Study

by
Fattouh M. F. Shaker
1,
Mohammed S. Daif
1,
Ahmed Farouk Deifalla
2,* and
Nehal M. Ayash
1,*
1
Civil Engineering Department, Faculty of Engineering at Mataria, Helwan University, Cairo 11718, Egypt
2
Structural Engineering and Construction Management, Future University in Egypt, New Cairo 11835, Egypt
*
Authors to whom correspondence should be addressed.
Sustainability 2022, 14(21), 14024; https://doi.org/10.3390/su142114024
Submission received: 3 September 2022 / Revised: 1 October 2022 / Accepted: 9 October 2022 / Published: 28 October 2022

Abstract

:
Concrete-filled steel tube (CFST) columns are used in tall buildings and bridges, and they provide more rigidity and higher bearing capacity, but buckling affects their behavior. There is an exceptional need to study the behavior of these columns under various conditions. The numerical method is beneficial in supplementing the experimental works and is used to explore the effects of various parameters because of the limitations in cost, apparatus, and time of the experimental program. The various parameters, such as the different slenderness ratios, i.e., column-height-to-cross-section-dimension (H/D), different steel-tube-thickness-to-column-dimension (D/t), and different compressive strength of concrete to yield strength of steel tube ratio (fc/fy) under concentric axial loading are considered in this current study. Firstly, a finite element model used the “ANSYS” software program and was constructed to validate the results of the experimental works. The extensive numerical models were carried out to extensively widen the study in this field. The numerical work was conducted on sixty-four specimens. Moreover, the analytical calculations from the different international codes/standards were compared with the numerical results to test their reliability in predicting the ultimate carrying loads. The study provided results that show the improvement effect of CFST columns with the high compressive strength of infilled concrete, while no remarkable enhancement effect with the high yield strength of steel tube was observed. Increasing the columns’ diameter is more effective in enhancing the load capacity (about three times more) than increasing the tube thickness (about 1.3 times). Ring stiffeners for long CFST columns (H/D > 12) do not lead to any enhancement of the column behavior due to yielding occurring firstly at the location of the rings. ECP205-2007 is the most conservative design code in predicting the load capacity of CFST columns, while the AIJ design code is good at predicting the ultimate load failure compared to the other codes/standards. Eurocode 4 provides underestimation values of the load-carrying capacity of CFST columns.

1. Introduction

Compared to conventional reinforced concrete columns, in concrete-filled steel tubes (CFSTs), the steel tube lies at the outer perimeter, enhances the stiffness, and has a much greater modulus of elasticity than the concrete. Additionally, it confines the concrete core, which increases the compressive strength and the ductility of the column. While the infilled concrete forms an ideal core to withstand the compressive load, it also delays and often prevents local buckling of the steel. Concrete-filled steel tube columns (CFSTs) were used for many decades as a composite structural element due to their numerous structural advantages, such as high strength, high ductility, fire resistance, and considerable energy absorption capacities. Nowadays, composite structures are considered to be an advantageous system for carrying loads in different building structures, such as bridges, high-rise buildings, subway stations, workshop buildings, electricity pylons and poles, and other types of structures. The sustainability of this type of construction has been investigated by many researchers [1,2,3,4]. In addition, the columns are subjected to concentric or non-concentric compressive forces, which are areas of extensive research studies using various experimental, numerical, or artificial intelligence methods [5,6,7,8]. Moreover, numerical modeling has shown a lot of promise in the area of composite elements under various loadings [9,10,11].
Composite columns of steel tubes filled with concrete provide more rigidity and higher bearing capacities, so several design methods and many studies have been developed to study the behavior of CFST columns under different loads. Their behavior has been investigated previously in a lot of past research. Stephen [12] tested fourteen specimens with different parameters to investigate the effect of the thickness of steel tubes and their shape on the ultimate strength of CFST columns, such as (L/D) and D/t. Susantha [13] investigated the complete stress–strain curve of concrete columns confined by different steel shapes (circular, box, and octagonal cross-sections) subjected to axial load and lateral pressure by using FEM analysis. The study showed that the circular-shaped columns were significantly confined in comparison to the box columns. Huang [14] examined the behavior of concrete-filled steel tube columns subjected to axial load and analytically verified the test results by using the nonlinear finite element analysis method. They noticed that the stiffening scheme enhanced and improved the confinement of the steel tube on the concrete core, and The Eurocode 4 specifications supplied a preservative estimate of the ultimate strength of circular CFST columns and even for D/t ≥ 150. Hsuan [15] showed that in circular CFST columns, the tubes could provide good restriction to the concrete essentially when the ratio of the width-to-thickness was small, D/t < 40, and the steel local buckling of the tube was not likely to occur. Giokoumelis and Lam [16] carried out tests on fifteen circular concrete-filled steel tube columns under axial loading. The study examined the effects of the bonding strength between the concrete infill and the tubular steel and the thickness of steel tubes in confinement. The experimental results were compared with the different code equations, such as Eurocode 4, the Australian standard, and American codes. It was found that the ratio between the experimental axial loading and the axial loading value calculated by Eurocode 4 was around unity, and it was noticed that Eurocode 4 supplied a good prediction for CFST columns. Zeghiche and Chaoui [17] investigated an experimental study on twenty-seven specimens of concrete-filled steel tube columns, and different parameters were considered. In this study, it is concluded that the increase in CFST columns’ slenderness ratio decreased the load-carrying capacity, and the use of high-strength concrete enhanced the load-carrying capacity of the tested columns, but the use of normal-strength concrete decreased the load-carrying capacity by a high rate. All of the tested CFST columns failed due to global buckling without any sign of local buckling. Zhi-Wu [18] carried out an experimental investigation on the behavior of circular concrete-filled steel tubular columns under concentric loading. Seventeen specimens of circular CFST columns with self-compacting concrete (SCC) and normal concrete (NC) were tested, and the study concluded that: an increase in concrete strength (SCC, NC) caused the development of an increase in load capacity but almost preserved a constant value in load capacity after failure. The measured axial load with strain ratio curves of the CFST columns proposed that a good confinement effect was presented for specimens after the load extended to the ultimate load capacity of columns. Liang and Fragomeni [19] prepared an analytical study on Circular CFST short columns subjected to axial loading by using nonlinear analysis methods to study their behavior (strength, ductility, and confining) and making a comparison between the analytical results with the experimental data. The study showed that increasing the ratio of diameter-to-thickness reduces the ultimate strength and the ductility of the axial performance of the CFST columns. It was found that proportionally increasing the compressive strength of concrete increased the ultimate loads, reducing the section and axial performance ductility of the CFST columns, and it was found that the axial loads of the CFST columns increased proportionally with the increasing yield strength of the steel tube. Goode [20] presented a study on concrete-filled steel tube columns to investigate their behavior under different loadings. The study concluded that Eurocode 4 predicted a safe method of strength estimation for long slender columns subjected to axial load and moment. They showed that the limitation of the code on concrete strength could be extended safely to 75 for circular CFST columns and noticed that in CFST columns that had thin tube thickness, the local buckling limits could be used if a factor of 0.75 was applied to the predicted resistance of Eurocode 4. Lai and Ho [21] studied the behavior of uniaxially loaded concrete-filled steel tube columns confined by external rings on thirty-five specimens experimentally and verified theoretically by calculations. The CFST columns specimens were categorized into groups according to the specimens that have the same parameters, such as concrete strength, the thickness and the diameter of the steel tube, and the heights of the columns. It was concluded from the study that the external stiffeners could resist the lateral dilation of CFST and develop the bonding condition. The external steel rings were more effective in restricting the lateral deformation of the core concrete and steel tube columns. Gupta and H. Singh [22] prepared an analytical study on the behavior of concrete-filled steel tube short columns by using the finite element software program ABAQUS Vr.6.9 against the experimental data. The study concluded that the change in effective length was not affected by the response of the CFST stub columns under axial compression load. The study noticed that the maximum pressure confinement value obtained by the ABAQUS v6.9 models was higher than the value obtained previously by the experimental test. Abdulhadi and Abbas [23] presented an experimental and analytical investigation for studying the behavior of concrete-filled steel tube columns under axial concentric loading. The study showed that the compressive strength of concrete was an important factor affecting the load deflection for CFST columns. Tiwary and Gupto [24] carried out an analytical study against an experimental work on CFST columns by using the finite element program ABAQUS/CAE to study their behavior. The study showed that the capacity of the CFST columns was increased with increasing column diameter. The deformation of the CFST columns was increased linearly when the ratio between the column length and the cross-section dimension (l/D) ranged from 4 to 6. It was also noticed that the CFST columns stresses were decreased with the increase in the outer steel tube thickness. Deifalla [25] developed an experimental study for twenty-seven specimens of CFST columns to study their behavior under concentric loading. Two loading methods were used on the CFST columns with different parameters that affect CFST columns, such as the global and local slenderness ratios, adding stiffeners, and the different ratios between the outer diameter of the tubes and their thickness to obviate local buckling, and these ratios were compared with the different limits of the maximum D/t ratio submitted by different codes. As a result, in this study, two failure modes of CFST columns occurred, yielding for short columns and global buckling for long columns; the ratios of columns’ diameters to their thickness and the ratios of the columns length to the cross-section dimension were inversely proportional to the ultimate load values. Alatshan [26] proposed an analytical study on circular CFST short columns that are confined by an external or spiral stiffener subjected to axial loading. They noticed that under axial loading, the circular CFST columns with external steel confinement supplied a better performance than increasing the steel tube thickness. The study demonstrated that the increase in the concrete compressive strength and the yield strength of steel, external confinement strength, and the decrease in the cross-section-to-thickness ratio provided the performance of circular CFST columns under axial loading. Abdel-zaher [27] carried out an analytical study and numerical investigation to study the behavior of CFST columns with different parameters, such as cross-sections and the ratios between the dimensions of column width-to-thickness. The study showed that when the slenderness ratio of CFST columns increased, the ultimate load, hardness, and ductility decreased. Azad and Uy [28] investigated the effect of concrete infill on the local buckling capacity on a hollow circular tube, and the study indicated different ratios of cross-section dimension, such as diameter-to-thickness, to verify whether member yielding or local buckling occurred first. The study presented that the concrete infill tube has little change in the tube at failure due to the local buckling failure mode, but the local buckling occurred largely in the hollow circular tube. Süleyman Ipek [29] developed an experimental and analytical study on CFST columns with different cross-sections to investigate their behavior against axial load; the study focused on the elliptical sections, and the study showed that three types of failure occurred in the elliptical section, shear failure, local buckling failure, and phenomena of the elephant foot buckling, which occurred nearly of the top and bottom of the CFST columns; finally, the study showed that the design codes formula of AISC and EC4 for (rectangular and circular) section were modified to be capable of expecting the axial load value for the elliptical section of the CFST columns. Lei Zhang [30] carried out an experimental study on CFST narrow rectangular columns to study their behavior under axial compressions loading. Twenty-four experimental specimens were tested to involve the behavior of CFST columns with a narrow rectangular section, The study showed that the local buckling failure of CFST occurred near the buckling ring, and the study demonstrated that when the ratios of D/B decreased, D/t increased the ductility index and the strength index improved remarkably; finally the study showed that more different codes have a good predictor to the safe design loads. Grzeszykowski and Szmigiera [31] conducted an experimental study on 21 CFST columns with square sections to investigate the vertical ductility of CFST columns subjected to axial load, a novel and vertical ductility was measured for the study. The study showed that the ductility of square CFST columns depends on the failure mode of these columns and demonstrated that when the volume of material increased, the ability of CFST columns to dissipate the energy loaded increased, and the study showed that the specimens that have a local failure mode were higher in comparison for ductility than the columns that have global failure. Erdoğan [32] presented an analytical study on CFST columns by using finite element modeling to investigate the ultimate strength of CFST columns; some parameters were studied, such as the thickness of the tube, the ratio of the cross-section dimension to thickness, concrete core compressive strength, and steel yielding strength. The study showed that the FE model is more effective than the empirical models in predicting the ultimate axial strength and demonstrated that the FE models have a good performance for CFST columns and close error values of the ultimate strength compared by the different design codes such as AIJ and EC4.

2. Research Significant

All of the previous studies focused on CFST short columns subjected to axial loads, but these did not cover CFST long columns when their height-to-cross-section-dimension ratios increased from the limitations of their dimension ratios. Accordingly, the current study presents an analytical verification against experimental data on the behavior of concrete-filled steel tube columns, which were subjected to concentric loading using the finite element software program ANSYS v19.0 [33]. The study will investigate the influence of different parameters on CFST columns when their height-to-cross-section dimension ratios increase from the limitation of their dimension ratios in different codes and make a comparison between the codes because these ratios vary from code to code. Some parametric studies were considered, such as the compressive strength of concrete, steel yield strength, the ratio of cross-section dimension to thickness D/t, the ratio of column length to cross-section dimension H/D, and the stiffener distribution along the specimen length.

3. Verification Study

Experimental work is a good technique for investigating and studying the behavior of any structure, but it is more expensive than analytical and numerical work. In recent decades, researchers have worked with computers for this analysis due to the expensive cost of the experimental work. In this research, the ANSYS V19.0 program was used to simulate three-dimensional finite element models to extend the study to the behavior of concrete-filled steel tube columns under various parameters. The finite element models’ results were compared and verified with the experimental data stated in the literature. This verification represents the model capabilities of the behavior of concrete-filled steel tube columns in the parametric study.

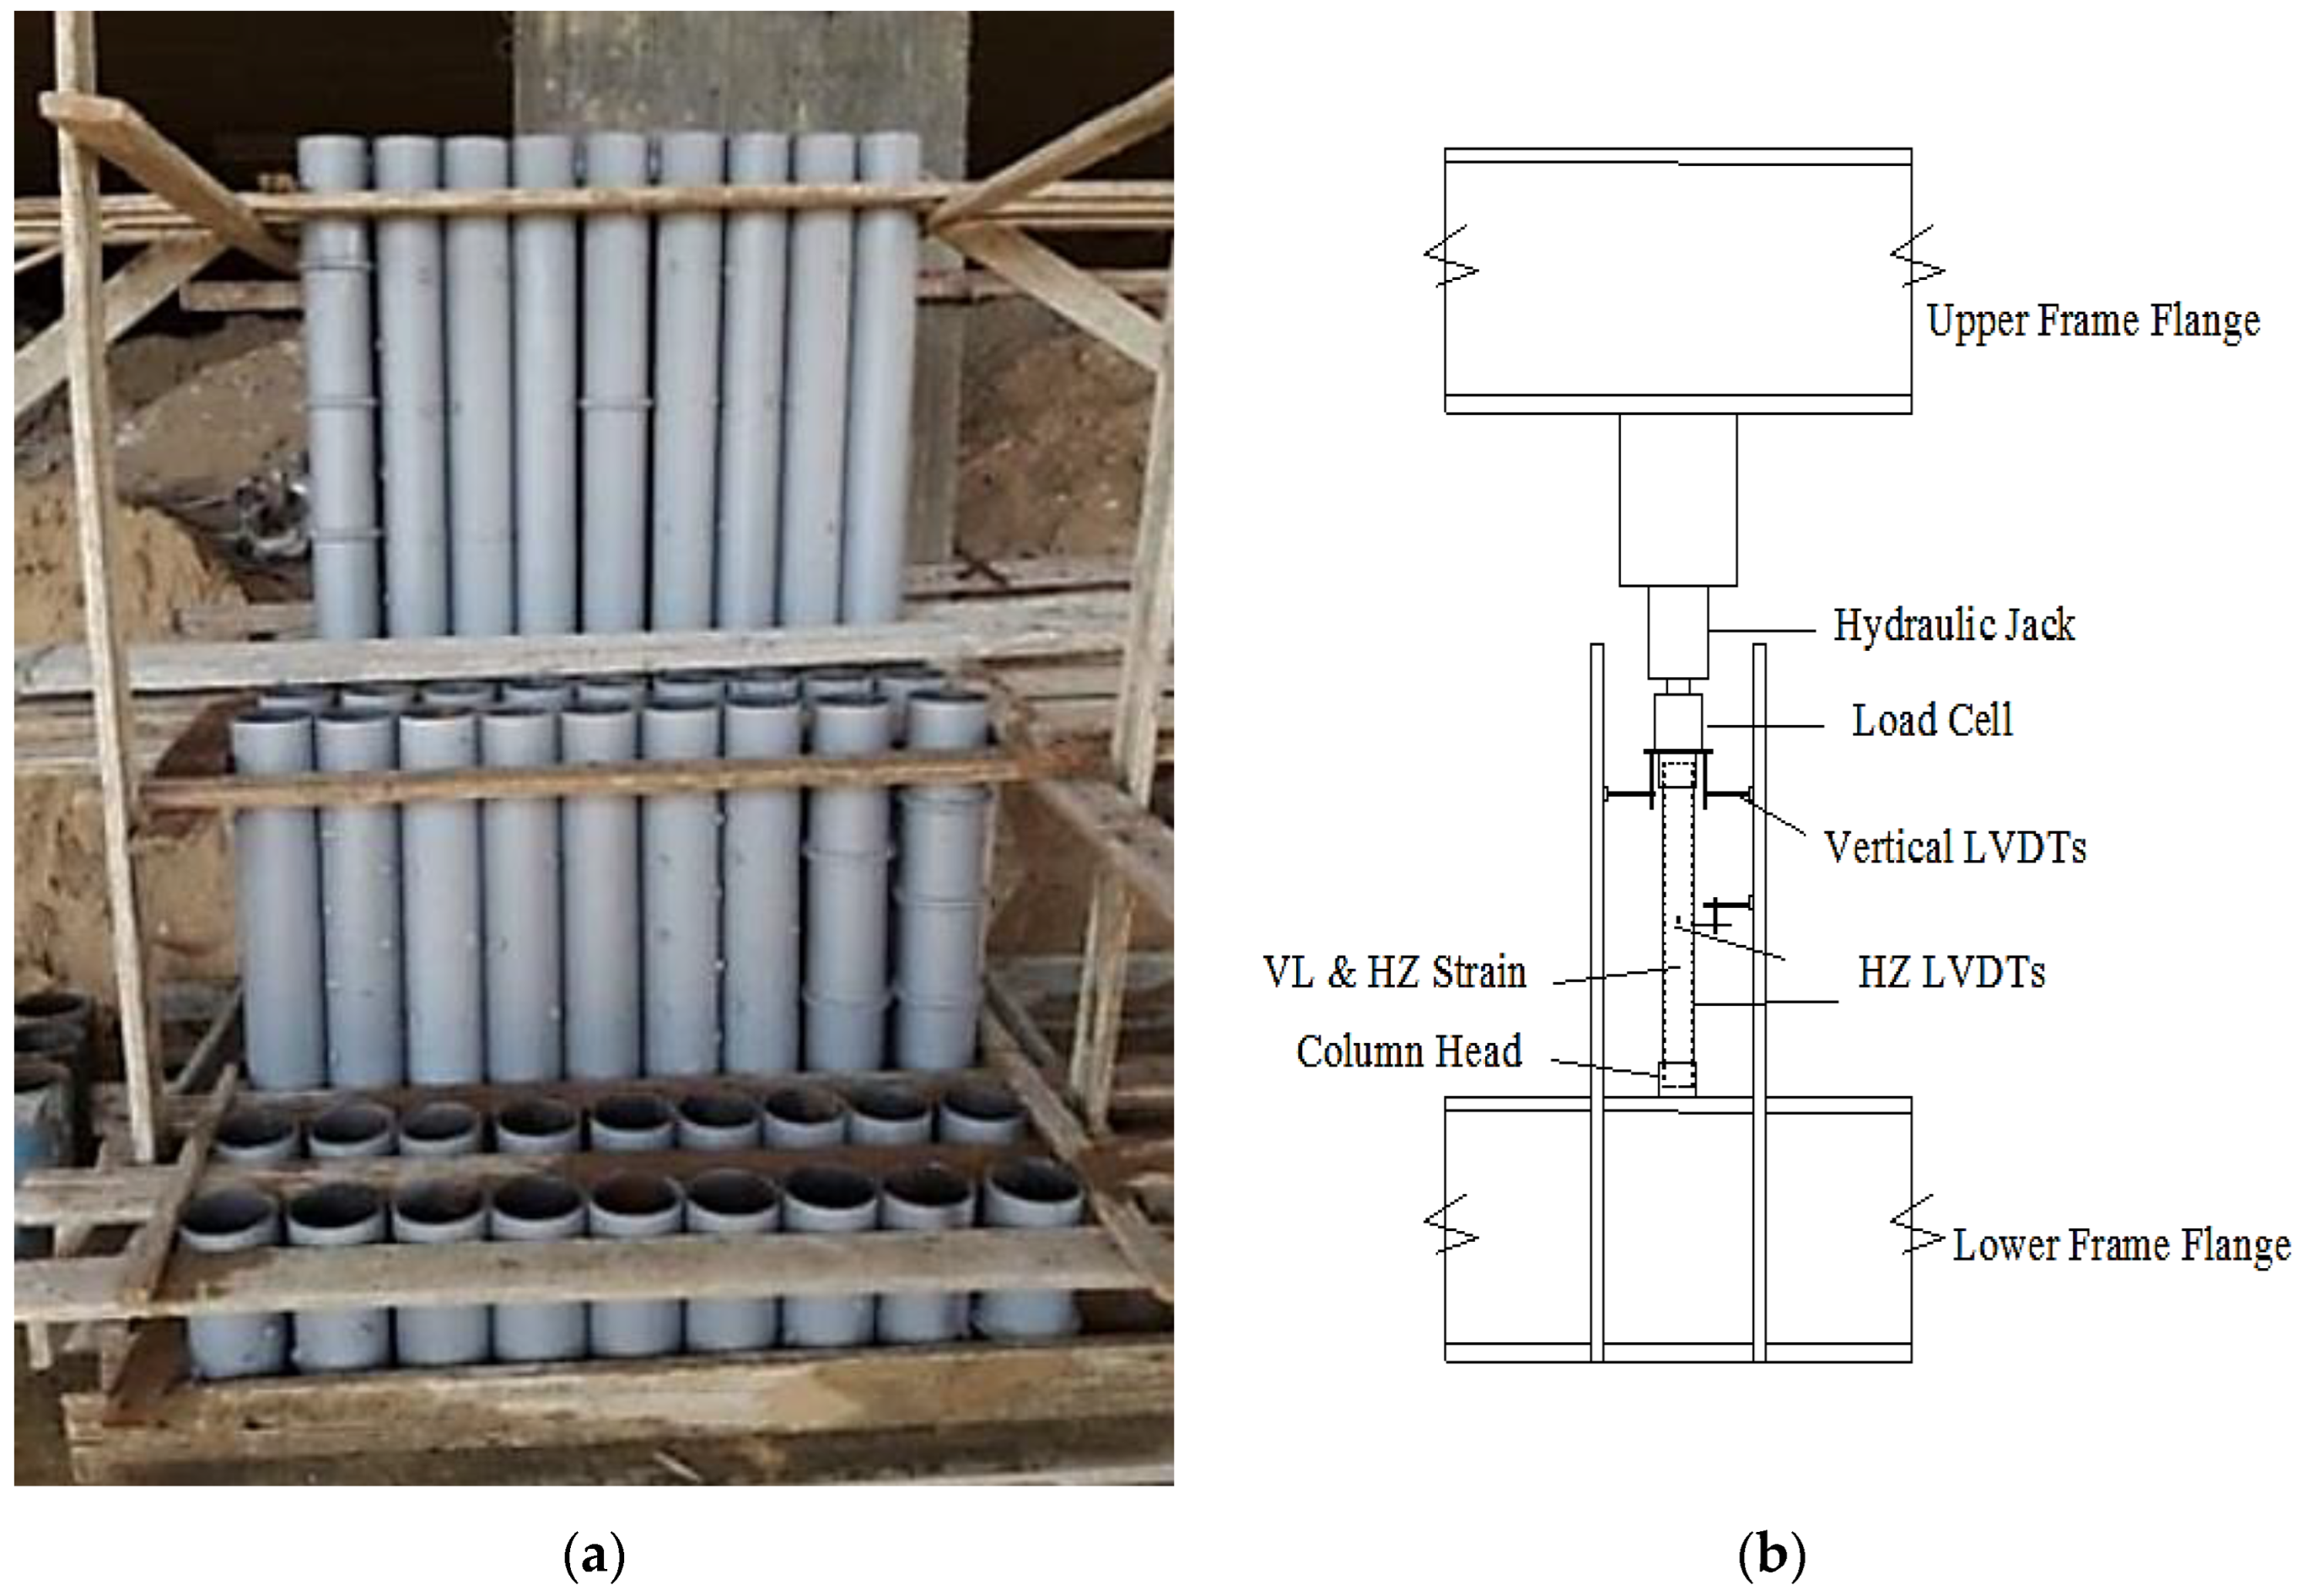
3.1. Previous Experimental Work

Deifalla [25] experimentally tested twenty-seven circular concrete-filled steel tube (CFST) column specimens subjected to concentric load. The outer diameter of the pipes was 127 mm, with a thickness of 2 mm and 4 mm, having D/T ratios equal to 63.5 and 31.8, respectively. The specimens’ lengths were 400 mm, 1000 mm, and 2000 mm, which corresponded to the H/D ratios of 3.14 (short columns), 7.874 (medium columns), and 15.748 (long columns), respectively.
The unstiffened columns consisted of 15 specimens, and the stiffened columns consisted of 12 specimens, as shown in Figure 1a. All of the stiffeners used in the stiffened specimens were square cross-sections of 10.5 mm × 10.5 mm, and the stiffener distribution along the lengths of the specimens had a spacing of 0.25 H and 0.5 H for columns with D/T equaling 63.5 and 31.8 and at 0.125, 0.167, and 0.33 H for columns with a D/T equal to 63.5.
Six specimens of steel tube without any concrete filling with D/T equal 63.5 and 31.8 were used as a control. Fifteen specimens filled with concrete; six for unstiffened columns with a D/T equal to 63.5 and 31.8, six for stiffened columns with a D/T equal to 63.5, and three for stiffened columns with a D/T equal to 31.8; and loaded on both the concrete core and the steel tube. Lastly, six specimens with a D/T ratio equal to 63.5, three for unstiffened columns and three for stiffened columns, consisted of sections filled with concrete and loaded through the steel shell only.
The study included two loading methods on the CFST sections: on the steel only and on the composite (i.e., both steel and infilled concrete). The case of loading on steel only is carried out by filling the tubes with concrete, except for 10 mm at both ends. The loading frames consisted of a horizontal I-section beam fixed with two I-section columns resting on the floor, as shown in Figure 1b. The specimens were positioned vertically, and the upper and lower ends were hinged at a strong frame. The loading was applied using a load cell with a capacity of 2000 kN.
Test coupons, according to DIN 50125 (2016), were conducted to establish the constitutive properties of the steel pipes. The obtained steel tube properties equaled 352 MPa for yielding strength (fy) and 418 MPa for ultimate strength (fu). The modulus of elasticity, Es, was 200,000 MPa.
The properties of the concrete were determined using standard concrete cubes and cylinders to achieve the mean compressive strength. Six cubes with dimensions of 150 mm × 150 mm × 150 mm and six standard cylinders with a 150 mm diameter and 300 mm height were tested after 7 and 28 days. The average cube and cylinder strengths after 28 days were 42 MPa and 32.1 MPa, respectively.

3.2. Analytical Model

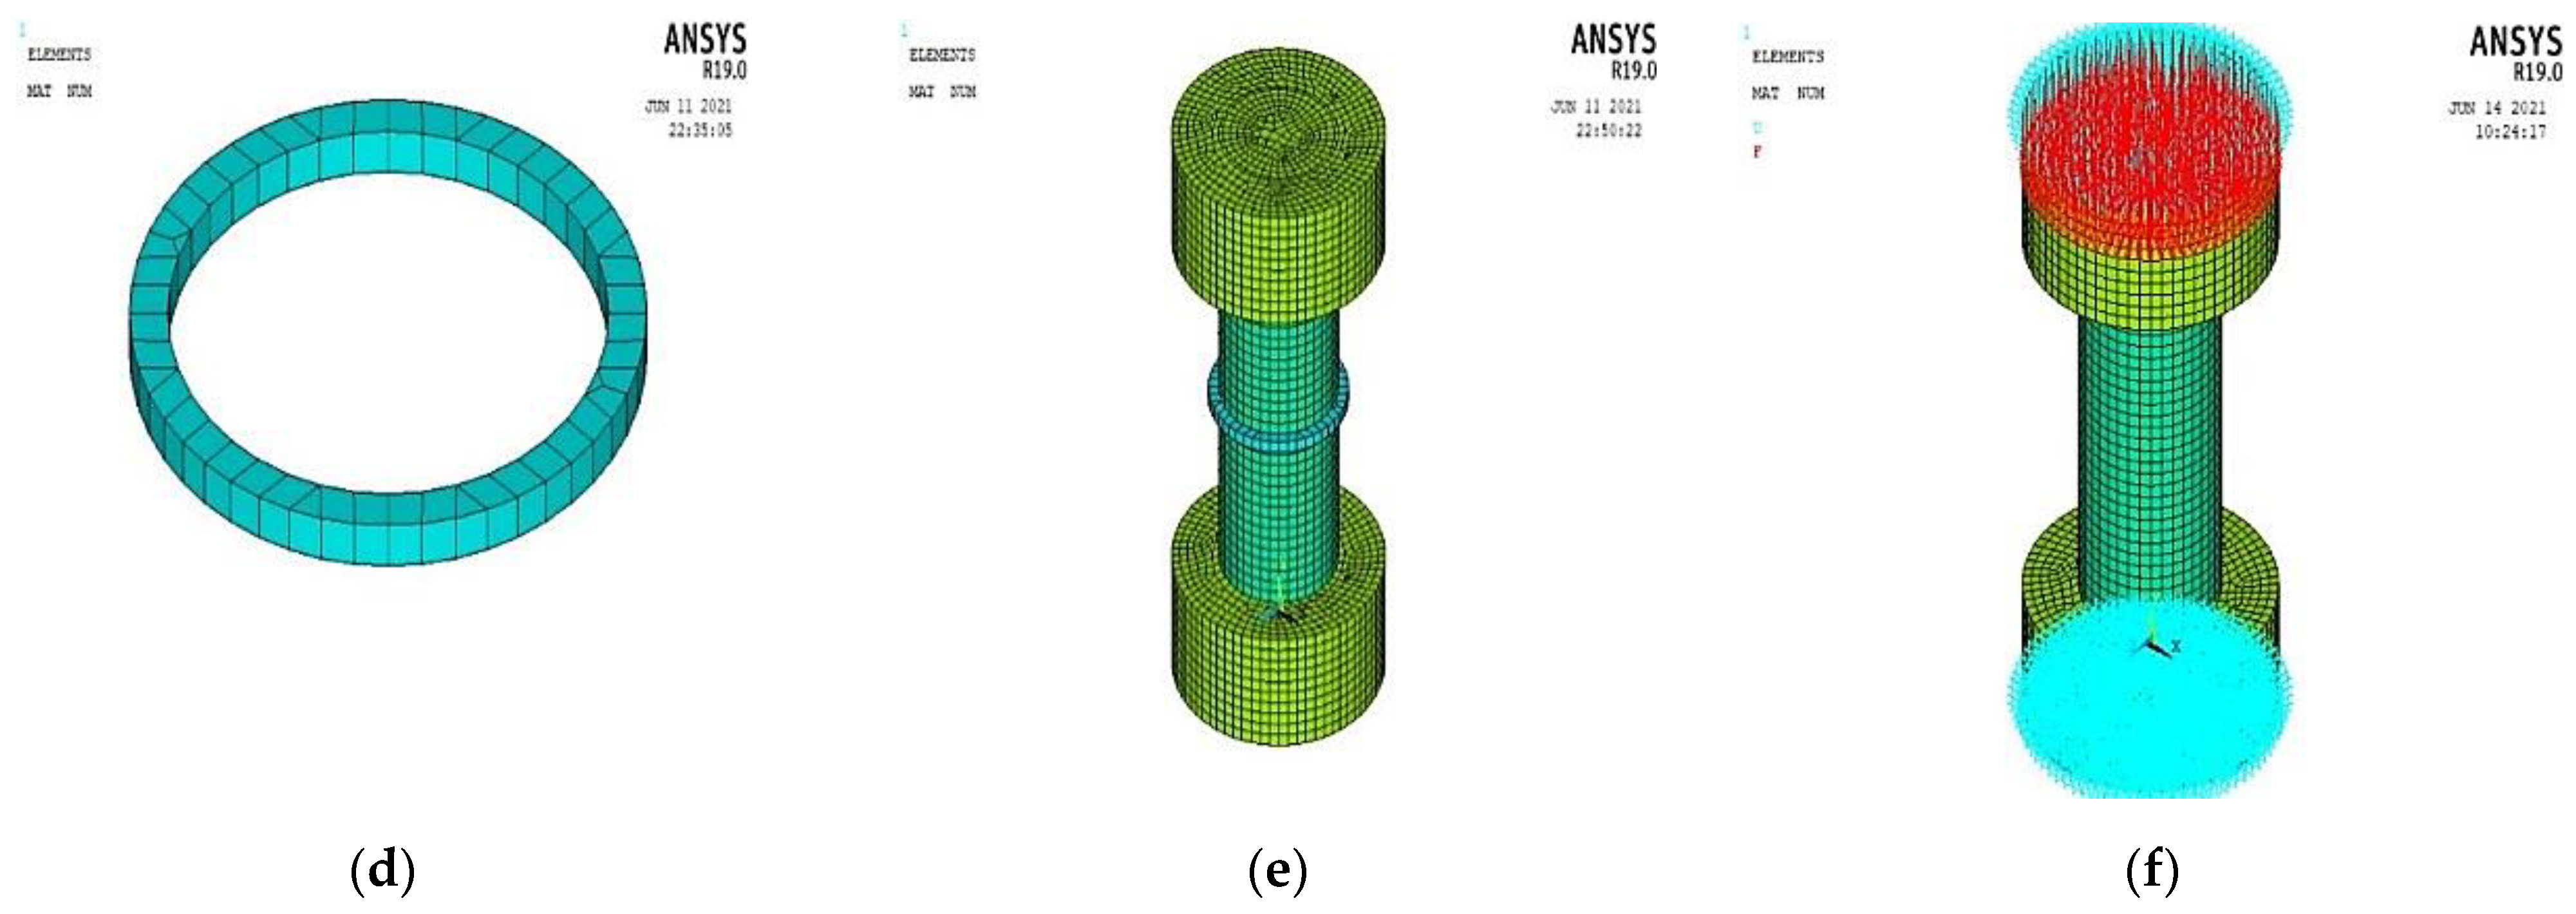
3.2.1. Element Types

The concrete core was modeled using the Solid65 element, and this was defined by eight nodes, and each node has three degrees of freedom: translations of nodes in the x, y, and z directions. This element type is suitable and capable of plastic deformation and cracking in a three-dimensional direction. Solid45 was used for the steel tube, and this was defined by eight nodes, and each node has three degrees of freedom: translations of nodes in the x, y, and z directions. The steel-plate loading and supporting were modeled using the Solid185 element, and this was defined by eight nodes, and each node has three degrees of freedom: translations of nodes in the x, y, and z directions.

3.2.2. Material Properties
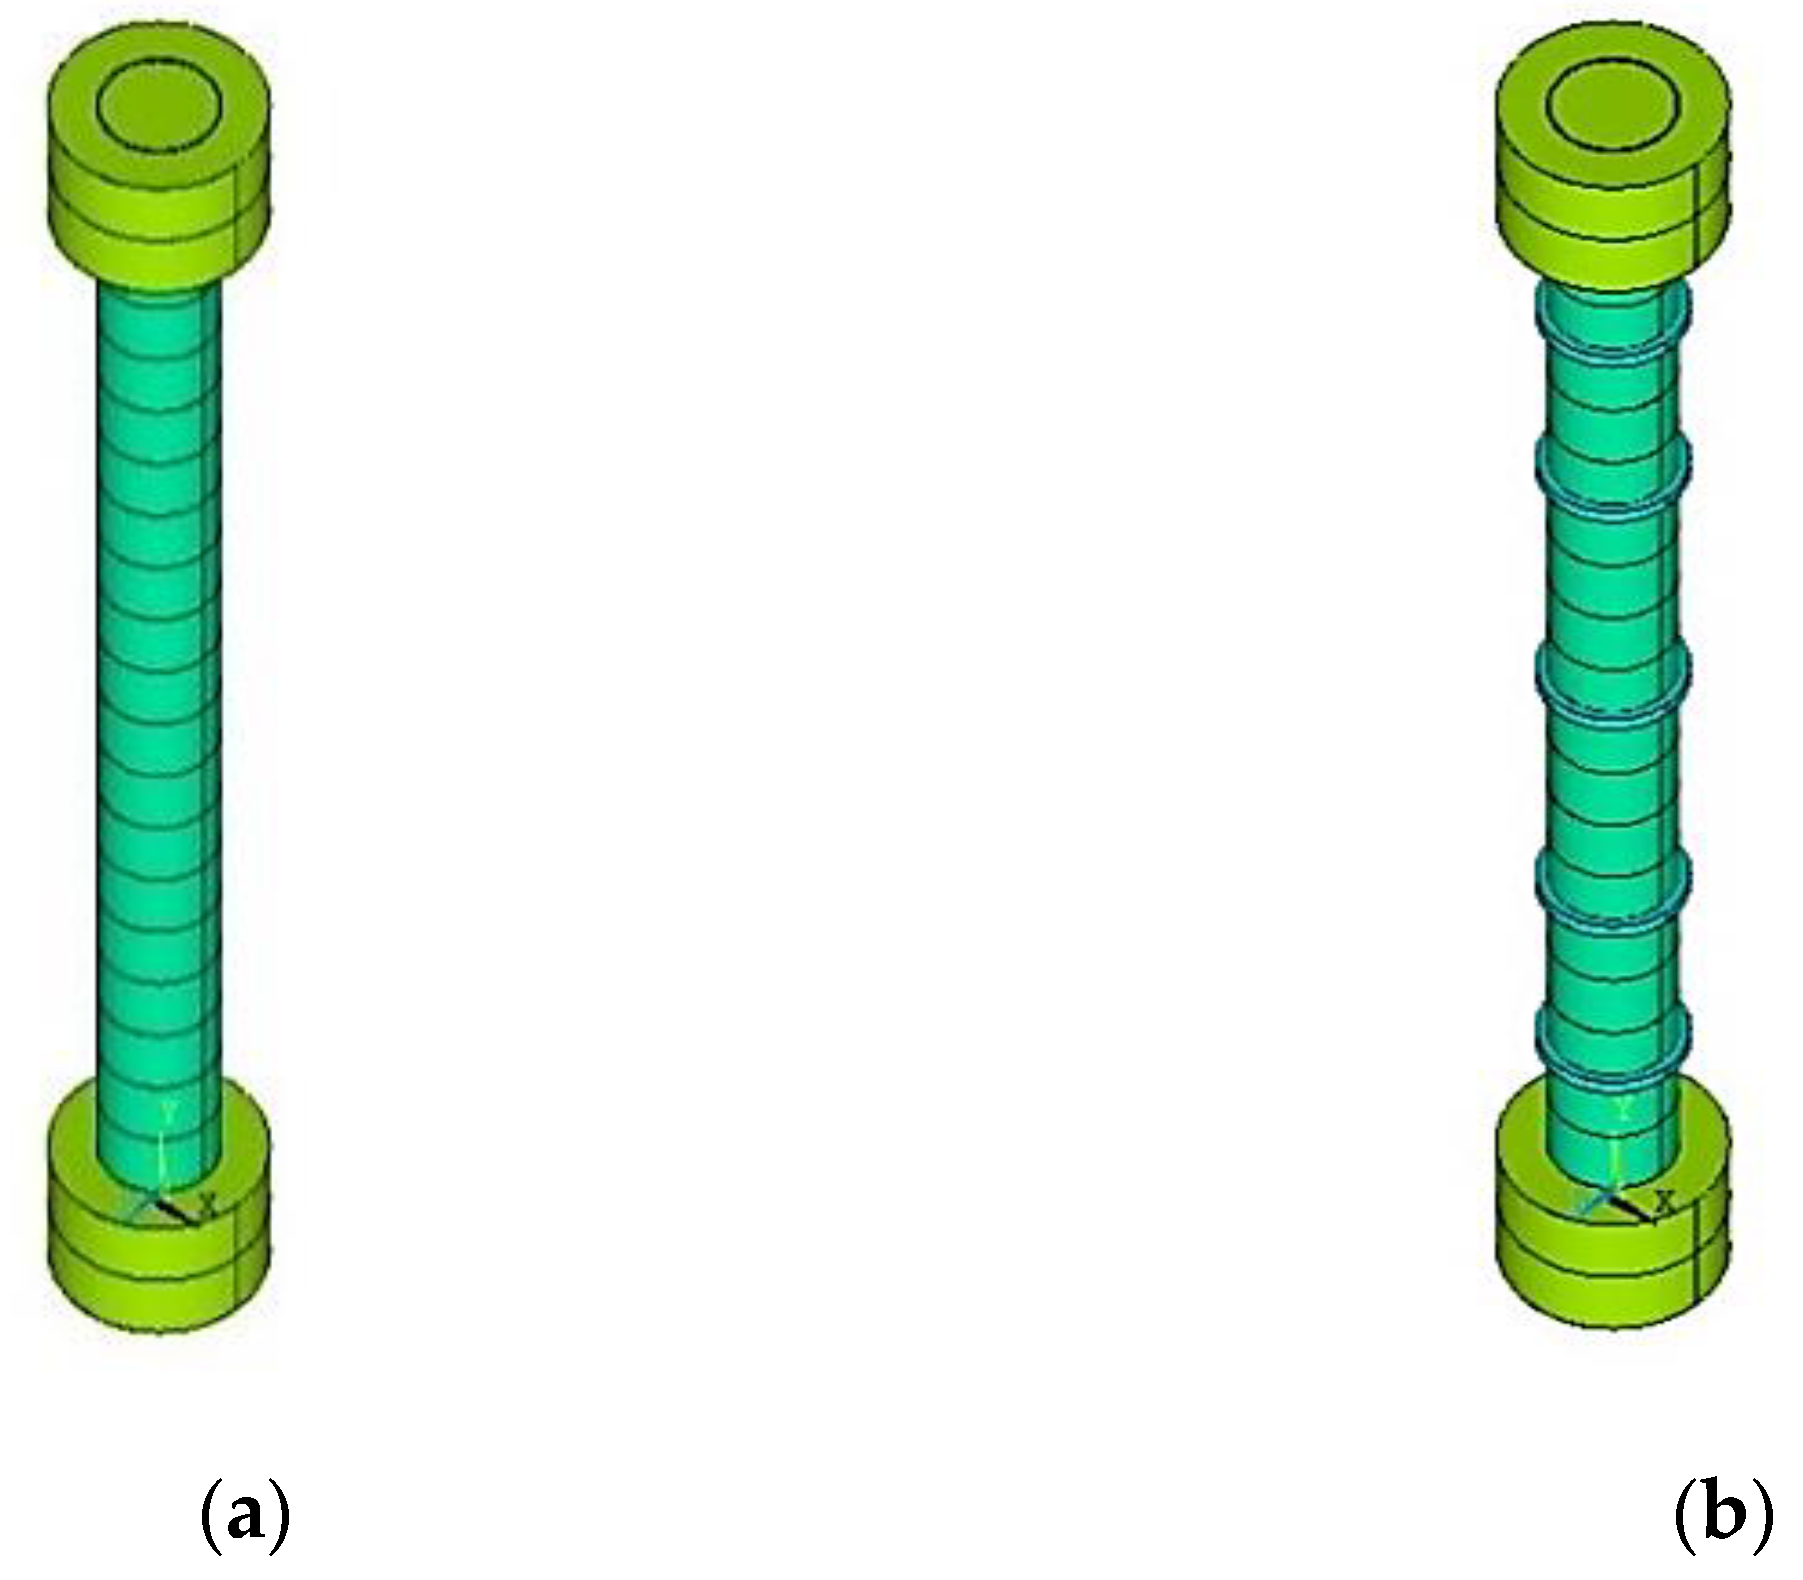
Solid65 is the element type of the concrete core and requires linear and multilinear isotropic material for definition, as listed in Table 1. The concrete modulus of elasticity Ex was calculated as Ex = 4400 f cu , and fcu is the specified cube compressive strength of the concrete and Poisson’s ratio for linear properties. The stress–strain curve of the concrete was used to develop the multilinear isotropic functions. The compressive stress–strain relationship for the concrete consisted of two parts. The first part shows the linear zone up to a point with stress equal to 0.3 f c . The second part shows the elastic–plastic zone at the maximum compressive stress of the concrete material, which was obtained from stress f = E c   ε 1 + ( ε ε o ) 2 , where the strain is at the ultimate compressive strength ε o = 2 f c E c . The end point of the curve is defined at f c and ε o . In addition, the uniaxial cracking stress was determined using fctr = 0.6 f cu .
It is required to specify the appropriate values of shear transfer in cases of open and closed cracks. The values of the open and closed shear transfer coefficients are between 0 and 1.0 [33]. The value of the closed shear transfer coefficient must be greater than the value of the open shear transfer coefficient. Several preliminary analyses were attempted with various values for the shear transfer coefficient within a range equal to 0.1 to 0.2 for open cracks, and 0.7 to 1 for closed cracks up to no deviation of results is observed. Therefore, the shear transfer coefficients for the open and closed cracks used in this study were equal to 0.2 and 0.9, respectively.
In Table 2, Solid45 is the element type of steel tube and requires linear and multilinear isotropic material for definition. The steel modulus of elasticity is EX and Poisson’s ratio for the linear properties. The stress–strain curve of steel was used to develop the multilinear isotropic functions, where the strain hardening modulus Et (after yielding stage up to the ultimate stage) is assumed to be the 0.1 initial moduli of elasticity Es.
Solid185 is the element type of the loading and supporting steel plates and requires linear and multilinear isotropic material for definition. The steel modulus of elasticity is EX, and it is equal to 2 × 10⁸ MPa, and the Poissons’ ratio is PRXY and was assumed to be 0.3. Figure 2 shows the stress–strain curve for the (a) infilled concrete and (b) steel tube.

3.2.3. Modeling

The columns and the loading plates were modeled as volumes. The models of the CFST columns were created with different heights equal to 400, 1000, and 2000 mm, and the tube diameter was equal to 127 mm, with a thickness equal to 2 and 4 mm. For the stiffened columns, the external stiffeners have a cross-section of 10.5 mm × 10.5 mm. The loading and supporting steel plates were modeled with a diameter, thickness, and depth equal to 227 mm, 50 mm, and 50 mm, respectively, as shown in Figure 3.

3.2.4. Meshing, Boundary Conditions and Loading

A good result was obtained for Solid65, Solid45, and Solid185 in the model of the CFST column, and the Hex Sweep meshing was used. The mesh of the concrete core of the CFST column model in ANSYS is shown in Figure 4. The convergence of results is achieved by increasing the mesh density until it has a negligible effect on the results. So, the used element mesh size did not exceed 20 mm, which is less time-consuming and provides accurate results compared with previous experimental works. A full bond is assumed between the steel tube and the infilled concrete core, which represents the confinement of the steel tube to the concrete core.
The load on the columns was applied vertically and concentric as pressure over the column surface area. The displacement boundary conditions are provided to constrain the column’s support; at the bottom of the column, the degree of freedom of all nodes Ux, Uy, Uz = 0, and at the top of the column, the degree of freedom of Ux, Uz = 0, and is Uy simulated to be free in this direction. The load and supporting conditions of the CFST column model in ANSYS are shown in Figure 4f.

3.2.5. Analysis Type

The nonlinear static analysis type is performed using the Full Newton–Raphson method with a sufficiently large number of sub-steps during the loading process to capture the cracking, yielding, and failure stages. A convergence tolerance of 0.05 is assumed based on the displacement degree of freedom for concrete problems. The automatic time stepping is set to OFF to constrain the constant load sub-step. The typical commands for the nonlinear static analysis are listed in Table 3.

3.2.6. Results of Verification Study

Von Mises stresses are developed to compare the failure mode between the finite element models using ANSYS and the experimental specimens by Deifalla [25], as shown in Figure 5, Figure 6, Figure 7, Figure 8, Figure 9, Figure 10 and Figure 11. It is noted that the FE models can capture the failure mechanisms and the associated deformed shape for the tested specimens, either local buckling failure for short columns, “elephant foot buckling at top or bottom end [18]”, as shown in Figure 5, or global buckling failure for slender columns. The existence of stiffeners with variable distributions has the same failure mode for short or slender columns. The yielding failure is shown for specimen C40-2-St2 (Figure 8) and global failure for specimen C100-2-St5 (Figure 9) based on the specimen height. In C200-2-St7, both yielding and global buckling was observed (Figure 10). As can be seen from these figures, the failure location in the FE models indicated by the max values of Von Mises stresses coincided with what occurred in the experimental ones.
Figure 12 shows the load–vertical deformation relationship for the unstiffened and stiffened CFST columns with (a) H/D = 3.14, (b) H/D = 7.87, and (c) H/D = 15.75 in both analytical end experimental tests, respectively. The comparisons between the failure loads obtained from the experimental tests and the finite element models by ANSYS are listed in Table 4. It is obvious that there is acceptable convergence for the load–vertical deformation relationships between the experimental and analytical results, especially in the first stage, for all of the tested columns, which are linear up to cracking load, while analytically, after this stage up to failure load, there are larger deformations corresponding to the approximate failure loads obtained from the experimental results by average differences, approximately 21%, 34%, and 45% for H/D = 3.14, 7.87, and 15.75, respectively. Additionally, from Table 4, it can be noted that the failure-load difference between the analytical and experimental specimens ranged from +13% to −11% for the CFST columns that are composite-loaded and ranged from +14% to −10% for the steel tube columns. However, for the CFST columns that are loaded on the steel tube, the differences ranged from +19% to −20%. Hence, the experimental tests for the CFST columns that are composite-loaded (the main core for this more extensive study) validate those which resulted from the FE ANSYS models and can be used for further parametric studies.

4. Parametric Study

Based on the verification study using ANSYS software to simulate the behavior of the CFST columns, the FE analysis with the same procedures is used widely to discuss the different parameters that cannot be permitted to be considered in a laboratory due to limited possibilities and may affect the behavior of the CFST columns under concentric loading.
Sixty-four finite element models of CFST columns with different parameters were modeled and analyzed by using the finite element program ANSYS version 19.0. The different parameters that were studied in this research are:
  • Column-height-to-cross-section-dimension ratio (H/D), which (H) varied by 3000, 4000, and 5000 mm and (D) varying between 200 and 400 mm;
  • Compressive strength of concrete to yield strength of steel tube (fc’/fy); (fc’) in a range of 40, 50, and 60 MPa, and (fy) in a range of 360, 420, and 520 MPa;
  • Cross-section dimension to steel tube thickness (D/t); where (t) varied by 4, 8, and 12 mm;
  • Stiffener distribution. The stiffeners were distributed over the column length every 250, 500, and 1000 mm.
In ANSYS, the material models for studying the effect of different concrete and steel material properties are listed in Table 5 and Table 6. Because of missing test information for the steel material, the ultimate strength fu was determined using Equation (1) or Equation (2) obtained from [34].
f u = [ 1.6 2 × 10 3 ( f y 200 ) ]   f y   if   200   MPa     f y 400   MPa
f u = [ 1.2 3.75 × 10 4 ( f y 400 ) ]   f y   if   400   MPa     f y 800   MPa
According to Table 7 and Table 8, the dimensions of the studied columns were selected based on the ECP205, EC4, and AIJ specifications to be a D/t range between 25 and 100 and a H/D range between 7.5 and 25 to be classified as the medium and long columns. Table 9 shows the limitations of the concrete compressive strengths under different codes of practice.
Table 10 summarizes the FE analysis results for the CFST columns with different parameters. The results are measured by failure mode, failure load, and vertical deformation at the failure stage. There are measurements calculated to judge the results, such as pre-yielding stiffness, post-yielding stiffness, and ductility. The stiffness can be defined as the slope of the load–deflection curve. The pre-yield stiffness (K1) and the post-yield stiffness (K2) are given by Equations (3) and (4). Ductility is the ability of an element to change its shape without losing its strength or breaking. The ductility can be defined as the ratio between the deflection of the yield load to the deflection of the ultimate load. The ductility index ( μ Δ ) can be calculated as shown in Equation (5).
K 1 = P y Δ y
K 2 = P u   P y Δ u Δ y
μ Δ = Δ u Δ y
where: K1 = Pre–yield “Initial” Stiffness (kN/mm), Py = Yielding Load (kN), Δ y = Yielding Deflection (mm), K2 = Post–yield Stiffness “Effective” Stiffness (kN/mm), Pu = Ultimate Load (kN), and Δ u = Ultimate Deflection (mm).

4.1. The Effect of Infilled Concrete Compressive Strength

Different values of concrete compressive strength were used to study the behavior of the CFST columns with a normal compressive strength of 40 Mpa and high compressive strength of 50 and 60 Mpa. The effect of the compressive strength of the infilled concrete on failure load and vertical deformation for columns that have a D/t equal to 25, 50, and 100 and a H/D equal to 7.5, 12.5, 15, and 25 are shown in Figure 13. Figure 14 presents the column stiffness and ductility index for the CFST columns with different values of infilled concrete compressive strength.
It is shown that the effect of the concrete compressive strength on the CFST columns increased the load capacity of the CFST columns ([6,7,8,12,15]) by an average of 1.13 and 1.20 times for concrete compressive strength (fcu) = 50 N/mm2 and 60 N/mm2 when compared with the case of fcu = 40 N/mm2. On the other hand, the vertical deformation is slightly increased by an average of 1.13 times for fcu = 50 N/mm2 and 1.05 times for fcu = 60 N/mm2 when compared with fcu = 40 N/mm2. In general, by increasing the compressive strength of the infilled concrete, the load capacity of the columns increased but reduced the vertical deformation due to the increase in column stiffness.
The pre-yielding stiffness increased by an average of 1.04 and 1.11 times, and the post-yielding stiffness is significantly increased by an average of 0.65 and 1.13 times for concrete compressive strength (fcu) = 50 N/mm2 and 60 N/mm2 when compared with the case of fcu = 40 N/mm2. The column ductility is reduced by 1.01 and 0.95 times for concrete compressive strength (fcu) = 50 N/mm2 and 60 N/mm2 when compared with the case of fcu = 40 N/mm2.

4.2. The Effect of Steel Tube Yield Strength

Different values of steel yield strength were used to study the behavior of the CFST columns, normal steel yield strength of 360 MPa, and high steel-yield strength of 420 and 520 MPa. The effect of the yield strength of the steel tube on failure load and vertical deformation for columns that have D/t equal to 25, 50, and 100 and a H/D equal to 7.5, 12.5, 15, and 25 are shown in Figure 15. Figure 16 presents the column stiffness and ductility index for the CFST columns with different values of steel tube yield strength. It is obvious that the effect of the steel tube yield strength on the CFST columns is not remarkable (opposite to finding in [8,15]); the increase in the yield strength of the steel tube led to a slight increase in the failure load for about 1.02 for fy = 420 N/mm2 and 1.04 for fy = 520 N/mm2 when compared with fy = 360 N/mm2. In addition, the same observation in the vertical deformation can be noted, i.e., the changes are about 1.01 for fy = 420 N/mm2 and 1.03 for fy = 520 N/mm2 when compared with fy = 360 N/mm2.
The pre-yielding stiffness is not affected by the material properties of the steel tube while the post-yielding stiffness is slightly decreased from 1.16 to 1.11 times for the steel-yielding strength (fy) = 420 N/mm2 and 520 N/mm2 when compared with the case of fy = 360 N/mm2. The column ductility is slightly increased from 0.93 to 0.94 times for the steel-yielding strength (fy) = 420 N/mm2 and 520 N/mm2 when compared with the case of fy = 360 N/mm2.

4.3. The Effect of D/t Ratio

Firstly, the effect of changing the tube thickness and maintaining the tube diameter constant is focused. Different values of tube thickness were used (4, 8, and 12 mm) with an outer diameter equal to 400 mm and D/t ratios equal to 33.3, 50, and 100, respectively. In addition, the CFST columns with tube thicknesses equal to 4 and 8 mm are used for columns with an outer diameter equal to 200 mm, which have D/t ratios equal to 25 and 50. The effect of tube thickness on the failure load and vertical deformation for columns that have a H/D equal to 7.5, 12.5, 15, and 25 are shown in Figure 17. Figure 18 represents the column stiffness and ductility index for the CFST columns with different values of tube thickness.
It is shown that the increase in the tube thickness with constant column diameter increases, i.e., the D/t value is reduced, the failure load and the vertical deformation of the CFST columns are largely [13,14,15] for H/D = 7.5, 12.5, 15, and H/D = 25 due to the increase in steel tube stiffness. The failure load is increased by 1.30, 1.25, and 1.60 for D/t = 25, 33.3 and 50, respectively when compared with D/t = 100. The vertical deformation is the same for D/t = 50 and there is amplification by 1.25 when D/t = 33.3 when compared with D/t = 100.
In addition, the effect of changing the tube diameter while maintaining the tube thickness constant is focused. Different values of the outer diameter were used (200 and 400 mm) with a constant tube thickness equal to 4 and 8 mm, i.e., the D/t ratio increased from 25 to 50 and 100. The effect of the outer diameter on the failure load and vertical deformation for columns that have a H/D equal to 7.5 and 15 for columns with a 3000 mm height, a H/D equal to 10 and 20 for columns with a 4000 mm height, and a H/D equal to 12.5 and 25 for columns with a 5000 mm height are shown in Figure 19. Figure 20 shows the column stiffness and ductility index for CFST columns with different values in tube diameter.
It is noted that increasing the outer diameter of the CFST columns while maintaining the tube thickness is constant, i.e., D/t is increased, leading to the increase in the failure load [15] by 2.77 when doubling the tube diameter, but the vertical deformation decreased by 8% for a column with a 3000 mm height, and by 12% for a column with 4000 and 5000 mm heights when doubling the tube diameter due to the increase in column stiffness (k = EA/L) by increasing the column cross-section (A).

4.4. The Effect of H/D Ratio

Different values of height were used to study the behavior of the CFST columns (3000, 4000, and 5000 mm) with tube thicknesses equal to 4 and 8 mm that have a D/t ratio equal to 25, 50, and 100, respectively. The compressive strength equals 40 MPa, and the steel-yield strength equals 360 Mpa. The effect of heights on the failure load and vertical deformation is shown in Figure 21. The column stiffness and ductility index for the CFST columns with different values of tube heights are shown in Figure 22.
It is shown that with increasing the column height while maintaining the column diameter and tube thickness constant, i.e., H/D increased from 7.5 to 25; the failure load is not different remarkably, while the deformation increased from 1.05 to 1.69 for different ratios of H/D when compared with the case with HD = 7.5. This is because decreasing the column stiffness (k = EA/L) by increasing the column height (L) is inversely proportional to deformation [16].

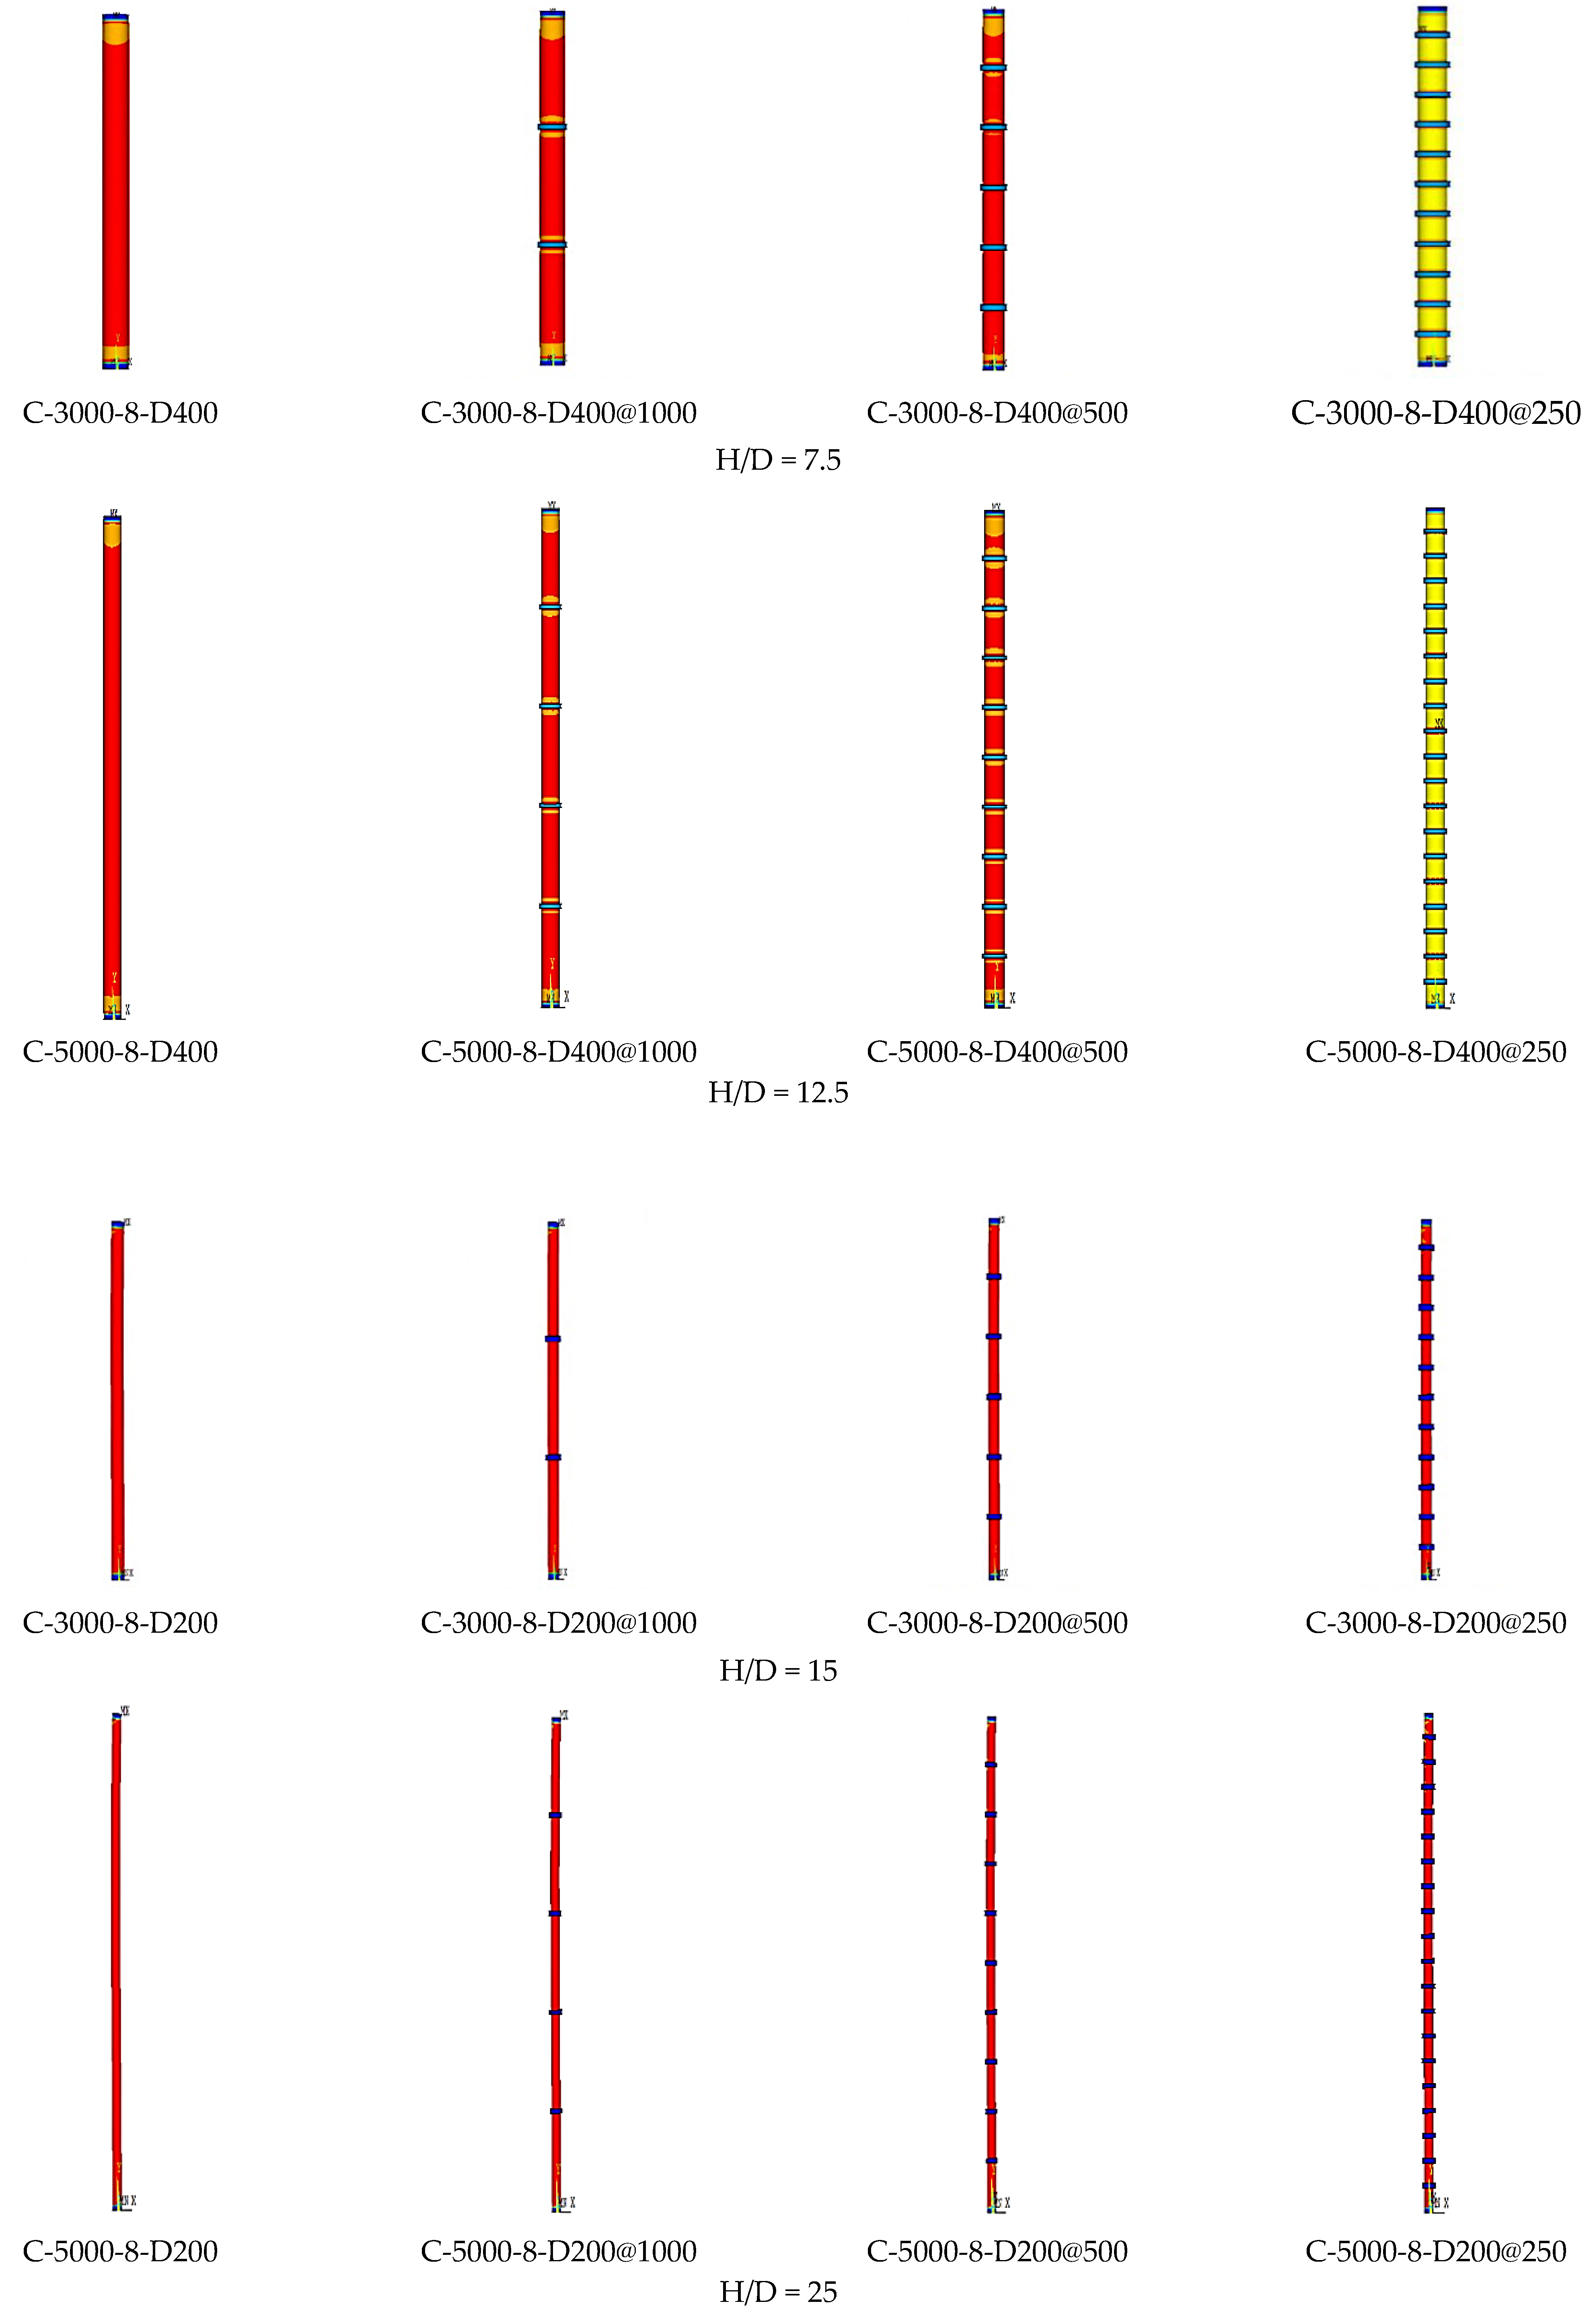
4.5. The Effect of Stiffeners Distribution

To study the effect of stiffener distribution on the CFST column behavior, the stiffener is a ring with a thickness of 40 mm transverse to the column length with a width of 40 mm parallel to the column length. The stiffeners are distributed along the column length at 250 mm, 500 mm, and 1000 mm. The columns have maintained constant values of the concrete compressive strength equal to 40 MPa, and the steel-yield strength equals 360 MPa. The studied specimens have different ratios of D/t equal to 25 and 50 and different ratios of H/D equal to 2.5, 5, 7.5, 12.5, 15, and 25 to study the efficiency of stiffeners in enhancing the load capacity of the CFST columns. Figure 23 shows the failure load–vertical deformation relationships for the CFST columns, unstiffened and stiffened, each 0.25, 0.5, and 1.0 m, with different values of H/D. Figure 24 shows the Von Mises stresses for the columns with different ratios of H/D that have no stiffeners, the stiffeners each 1.0 m, 0.5 m, and 0.25 m.
It is observed that the stiffened specimens are not affected by the development of the failure load and increased compared to the specimens that are unstiffened; for the short columns with H/D = 2.5, the failure load increased by 1% but decreased by 3% for the columns that have a stiffener every 500 mm and 250 mm, respectively. For H/D = 5, the failure load does not change for the columns that have a stiffener every 500 m but increases by 3% for columns that have a stiffener every 250 mm. At H/D = 7.5 and 12.5, with stiffener distribution along the column length, the failure load did not change and remained constant at distribution every 500 mm and 1000 mm, respectively, but the failure load decreased by 9% at a distribution of 250 mm compared to the unstiffened columns. At H/D = 15 and 25, the failure load does not change for every 250 mm, 500 mm, and 1000 mm.
In addition, the vertical deformation decreased [10], but not remarkably, for H/D = 2.5, 5, 7.5, 12.5, 15, and H/D 25 compared to the specimens that are unstiffened.
It can be considered from the behavior that the failure happened earlier than the unstiffened samples, and earlier too, for the stiffened specimens that have a stiffener every 250 mm compared to the unstiffened specimens, the earlier failure happened due to the failure in the stiffener [19] near the loading plate.
For the long columns, where H/D is more than 15, the stiffening with rings with different spacing between them along the column height does not enhance the behavior of the CFST column. It is suggested for future studies to stiffen CFST long columns with longitudinal steel strips.

5. Different Codes Provisions in Designing CFST Columns

Four different international code provisions addressing the design of the CFST columns were used. The following international standards are considered; American Standard-AISC-LRFD “AISC (2010) [35]”, The Egyptian Code of Practice for Steel Construction—Load and Resistance Factor Design “ECP 205-2007 (LRFD) [36]”, Eurocode 4 (EC4) [36] and Architectural Institute of Japan standards “AIJ (1997) [37]” and presented a full comparison between the failure load obtained by using the finite element program ANSYS version 19.0 and the different design codes.

5.1. International Codes Provisions

The AISC (2010) [35] code developed a formula that can be used to design and calculate the ultimate loads of the CFST columns (Pn). The ultimate load (Pn) can be calculated as follows:
P e   0.44   P o   :   P n = P o [   0.658 ( P o   / P e ) ]
P e   0.44   P o :   P n = 0.877   P e  
where:
P e   =   π 2   EI eff / ( KL ) 2
EI eff =   E s   I s   + 0.5 E s   I sr   + C 1   E c     I c  
C 1   = 0.6 + 2 [ A s   / ( A c   + A s   ) ]           0.9
P o =   A s   F y +   A sr   F yr +   C 1   A c   f c
where: E I eff : effective stiffness of the CFST member in N. mm2; I s   : the moment of inertia of the steel shape; I sr   : the moment of inertia of the reinforcing bars;   I c   : the moment of inertia of the concrete section; E c   : the modulus of elasticity of the concrete; E s   : the modulus of the elasticity of the steel; A s   : the area of the steel section; A c   : the area of the concrete; P n : the nominal axial compressive strength; P e   : the elastic critical Euler buckling load; P o : the nominal axial strength without consideration of the length effects; K: the buckling length factor according to the end conditions; L: the length of the column, and C 1   : 0.95 for circular section.
ECP 205-2007(LRFD) [38] computes the design strength, ΦcPn, for symmetric axially loaded composite columns as:
P u   =   Φ c   P n =   Φ c A s   F cr
λ m   < 1.1 :   F cr = ( 1 0.348   λ m   2 )   F ym
λ m     1.1 :   F cr = 0.648   F ym / λ m   2
F ym =   F y +   C 1   F yr ( A r   / A s   ) +   C 2 F cu ( A c   / A s   )
λ m   =   L b   ( F ym / E m   ) 0.5   / π .   r m  
where: r m   : the radius of gyration; F ym : yield stress; E m   : Young’s modulus; C 2   : numerical coefficient for tube and equal to 0.68; and Φ c : strength reduction factor for compression members and equal to 0.8.
Eurocode 4 [36] for the column’s slenderness ratio ( λ   ) 0.5 and the confinement effects are considered in the following equations:
Confinement   neglected   N PLRD   = A a   .   f y / g γ a   + A c   .   f ck / γ c   + A s   f sk
Confinement   considered   N PLRD   = η 2   A a   .   f y / γ Ma   + [ 1 + η 1   . ( t / D ) .   ( f y / f ck ) ]   A c   .   f ck / γ c  
η 1   =   η 10   = 4.9 18.5   λ   + 17   λ   2           0
η 2   =   η 20   = 0.25 ( 3 +   λ   2 )                                       1
λ = ( ( N PLRD   / N cr   ) 0.5
N cr   =   π 2 ( EI ) e / L K   2
( EI ) e =   E s   I s   + 0.8   E cm     I c  
E cm   = 22   ( f ck + 8 )   1 / 3
where: A a : cross-sectional area of the steel; A c : concrete sections; A s : the area of the reinforced bars; f y : the yield strength of the steel; f ck : the compressive strength of the concrete cylinder; f sk : the yield strength of the reinforcing bars; γ Ma : the safety factor on the steel section and is taken to be 1.00; γ c : the safety factor of the concrete section and is assumed to be 1.00, N PLRD : the plastic compressive resistance with unity safety factors; N cr : the elastic critical load. ( EI ) e : the effective elastic flexural stiffness of the cross-section; E s : modulus of elasticity of the steel tube; E cm : modulus of elasticity of the concrete core; I s : moment of inertia of the steel tube; and I c : moment of inertia of the concrete core.
In AIJ (1997) [37]; the compressive strength of the CFST columns is calculated as shown:
Short   column   l K / D 4 N C 1 = cN C + ( 1 + η ) sN C
Medium   column   4 < l K / D 12 N c 2 = N C 1 0.125 × [ N C 1 N C 3 ] × [ ( l K / D ) 4 ]
Long   column   l K / D > 12 N C 3 = cN C + sN C
l K   / D       4                         cN C =   cA .   cf C =   cA   ×   F c   / V c  
l K   / D > 12                         cN C =   cN Cr / V c   = ( cA .   c σ Cr ) / V c  
cf C = F c / V c c λ 1 1             c σ Cr = 2 / [ 1 + ( c λ 1 4 + 1 ) 0.5 ] cr u F c
c λ 1   > 1                   c σ Cr = 0.83 exp   [ C c   ( 1 c λ 1   ) ] .   cr u .   F c  
c λ 1   = ( c λ / π )   ( c ɛ u )   0.5
ɛ u = 0.93 ( cr u .   F c   ) 0.25 .   10   3   C c   = 0.568 + 0.00612 F c      
l K   / D       4                       sN C =   sA .   sf C =   sA   ×   F / sV
l K   / D > 12   and   s λ       Λ             cN C =   sA   [ 1 0.4 ( s λ / Λ )   2 ] ×   F / sV
s λ   >   Λ             cN C =   sA   ( 0.6   F ) / ( s λ / Λ )   2 ×   sV
Λ   =   π   ( sE / 0.6   F )   0.5
where: l K   : the effective length of the CFST columns; η: is a constant and equal to zero for rectangular and 0.27 for circular CFST column; N C 1 ,   N c 2 ,   N C 3 : are the allowable strengths of CFST column; c N C : the allowable strength of concrete column; cA: the cross-sectional area of the concrete column; c f C : the allowable compressive stress of concrete; F c   : the design standard strength of filled concrete; V c   : the safety factor of the concrete section and is equal to 1.00; c σ Cr : the critical stress of the concrete column; c λ : the slenderness ratio of the concrete column; s N C : the allowable strength of the steel tube column; sA: the cross-sectional area of the steel tube column; s f C : the allowable compressive stress of the steel tube column; s λ : the effective slenderness ratio of the steel tube column; Λ: the critical slenderness ratio; sE: the modulus of elasticity of the steel tube column; F: the design standard strength of the steel tube column, and sV = 1.00.

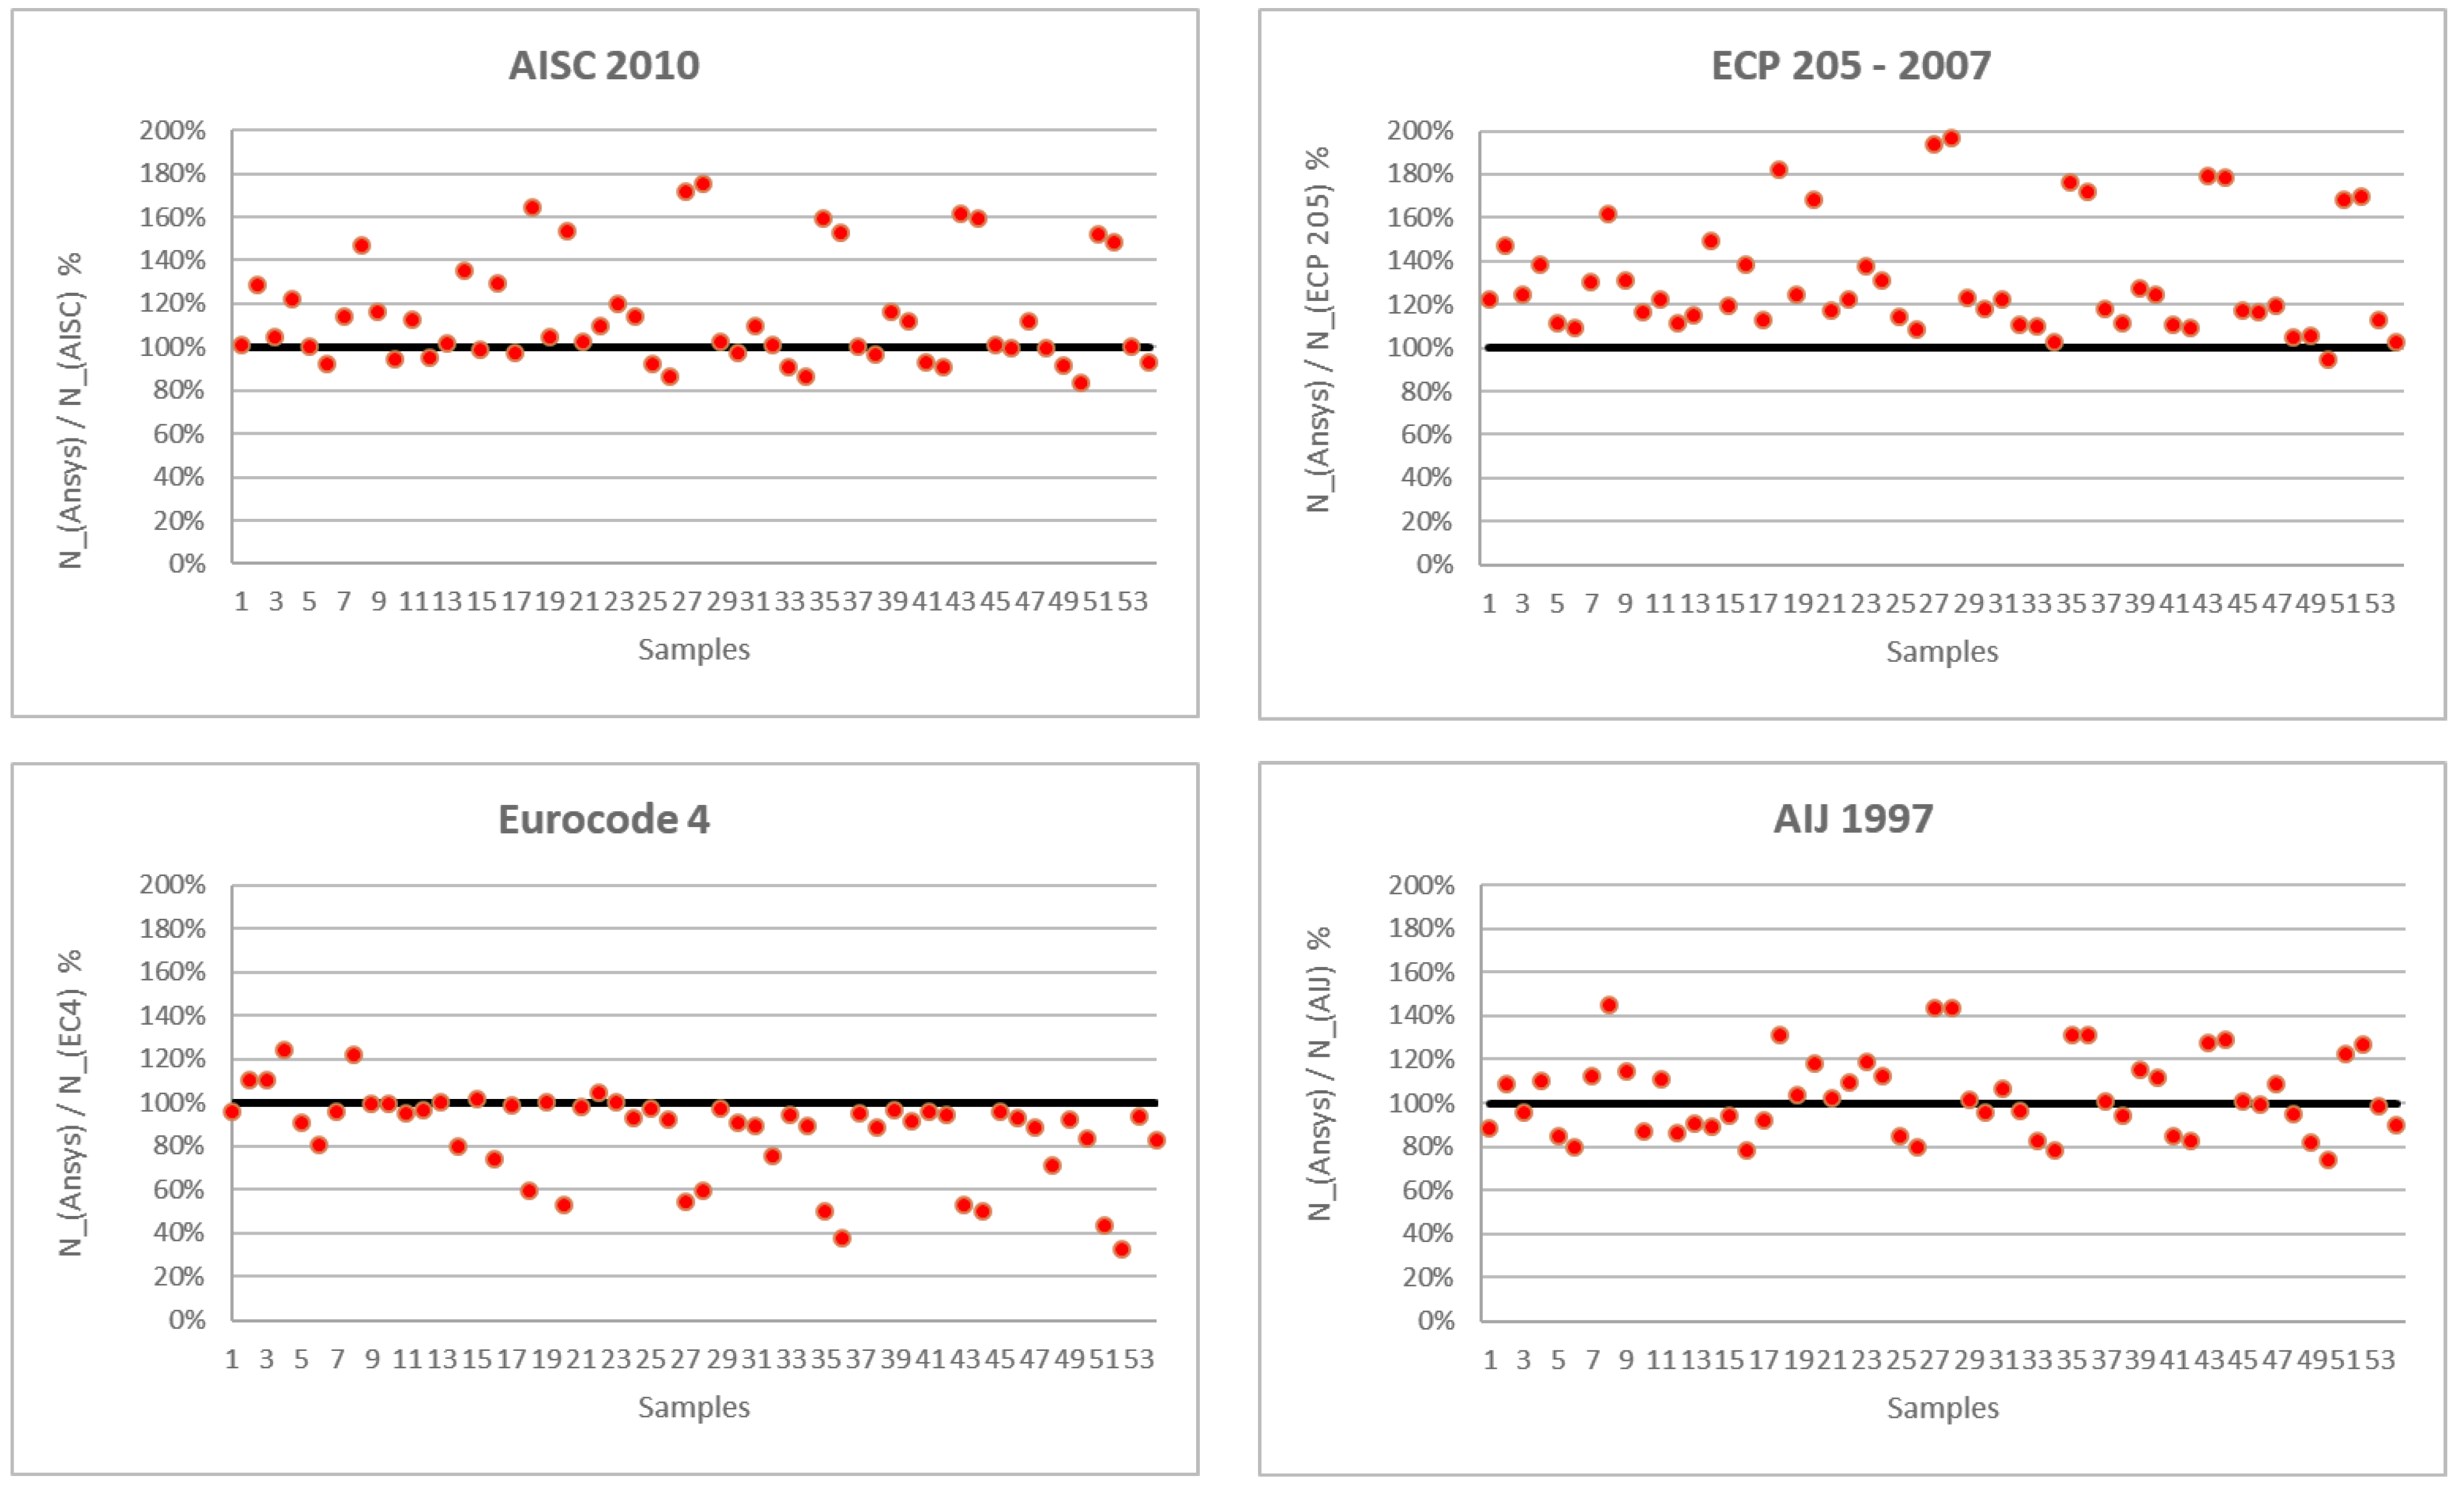
5.2. Comparisons of the Analytical Results of Axial Loads with Different Codes

The different values of the axial loads obtained analytically by ANSYS and those obtained by the different design codes are listed in Table 11.

5.2.1. Discussion for Results from AISC (2010) [35]

The comparison values of the AISC (2005) and the values obtained by the ANSYS results for columns with fcu = 40 MPa and fy = 360 MPa; at D/t = 25, the values of Pn equals the ANSYS failure load for H/D = 5, and increased by 13%, 29%, and 54% for H/D = 15, 20, and 25, respectively. At D/t = 33.3, the values of Pn increased by 1% and 10% for H/D = 7.5 and 12.5, respectively. At D/t = 50, the values of Pn decreased by 8% for H/D = 2.5 and decreased by 5%, and 3%, and increased by 2% for H/D = 7.5, 10, and 12.5, respectively, and the values of Pn increased by 16%, 35%, and 65% for H/D = 15, 20, and 25, respectively. In addition, at D/t = 100, the values of Pn decreased by 5%, and 1%, and increased by 5% for H/D = 7.5, 10 and 12.5, respectively.
At D/t = 25, in the case of fcu = 50 MPa, the values of Pn increased by 16% and 62% for H/D = 15 and 25, respectively. For the case of using concrete with an fcu = 60 MPa as infill, the values of Pn increased by 12% and 59% for H/D = 15 and 25, respectively. In the case of fy = 420 MPa, the values of Pn increased by 13% and 52% for H/D = 15 and 25, respectively, and for case of fy = 520 MPa, the values of Pn equals the ANSYS failure load for H/D = 15 and increased by 48% for H/D = 25, respectively.
At D/t = 50, in the case of fcu = 50 MPa, the values of Pn decreased by 7% and increased by 1% for H/D = 7.5 and 12.5, respectively, and increased by 20% and 76% for H/D = 15 and 25, respectively. For case of using concrete with an fcu = 60 MPa as infill, the values of Pn decreased by 9% and 1% for H/D 7.5 and 12.5, respectively, and increased by 14% and 71% for H/D = 15 and 25, respectively. In the case of fy = 420 MPa, the values of Pn decreased by 9% and 0% for H/D = 7.5 and 12.5, respectively, and the values of Pn increased by 10% and 59% for H/D = 15 and 25, respectively, and for case of fy = 520 MPa the values of Pn decreased by 17% and 7% for H/D = 7.5 and 12.5, respectively, and the values of Pn increased by 1% and 53% for H/D = 15 and 25, respectively.
At D/t = 100, in the case of fcu = 50 MPa, the values of Pn decreased by 8% and increased by 3% for H/D = 7.5 and 12.5, respectively. For the case of using concrete having fcu = 60 MPa as infill, the values of Pn decreased by 14% and 2% for H/D 7.5 and 12.5, respectively, in the case of fy = 420 MPa, the values of Pn decreased by 9% and increased by 1% for H/D = 7.5 and 12.5, respectively, and for the case of fy = 520 MPa, the values of Pn decreased by 14% and 4% for H/D = 7.5 and 12.5, respectively.
It is noted that the AISC (2005) equations are more conservative for the slender sections (D/t = 100) than the compact sections (D/t = 25). The AISC (2005) equations are more conservative when the increasing column-height-to-diameter (H/D) ratio for compact sections and less conservative for slender sections. AISC (2005) equations are more conservative when increasing infill concrete and steel tube strengths for compact or slender sections. Finally, the failure load predicted from AISC (2005) code compared to analytical results from ANSYS ranges between (−17%) and (+76%) with an average ratio of 114.70%.

5.2.2. Discussion for Results from ECP 205-2007(LRFD) [38]

When comparing the analytical results from ANSYS with those obtained from the ECP 205-2007 code equations, it is found that at D/t = 25, the values of Pn increased by 11% for H/D = 5, and increased by 22%, 39%, and 68% for H/D = 15, 10, and 25, respectively. In the case of D/t = 33.3, the values of Pn increased by 15% and 22% for H/D = 7.5 and H/D 12.5 m, respectively. At D/t = 50, the values of Pn increased by 9% for H/D = 2.5 and increased by 11%, 13%, and 19% for H/D = 7.5, 10 and 12.5, respectively, and the values of Pn increased by 31%, 49%, and 82% for H/D = 15, 20 and 25, respectively. In addition, at D/t = 100, the values of Pn increased by 16%, 20%, and 24% for H/D = 7.5, 10, and 12.5, respectively.
At D/t = 25, for the case of using concrete with fcu = 50 MPa, the values of Pn increased by 28% and 80% for H/D = 15 and 25, respectively. For the case of using concrete with fcu = 60 MPa as infill, the values of Pn increased by 24% and 79% for H/D = 15 and 25, respectively. In the case of fy = 420 MPa, the values of Pn increased by 20% and 68% for H/D = 15 and 25, respectively, and for the case of fy = 520 MPa, the values of Pn increased by 5% and 69% for H/D = 15 and 25, respectively.
At D/t = 50, for the case of fcu = 50 MPa, the values of Pn increased by 11% and 17% for H/D = 7.5 and 12.5, respectively, and increased by 37% and 69% for H/D = 15 and 25, respectively. In addition, when fcu = 60 MPa, the values of Pn increased by 9%, and 16% for H/D = 7.5 and 12.5, respectively, and increased by 31% and 94% for H/D = 15 and 25, respectively. For the steel tube with fy = 420 MPa, the values of Pn increased by 5% and 13% for H/D = 7.5 and 12.5, respectively, and the values of Pn increased by 22% and 76% for H/D = 15 and 25, respectively. In the case of a steel tube with fy =520 MPa, the values of Pn decreased by 5% and increased by 3% for H/D = 7.5 and 12.5, respectively, and the values of Pn increased by 10% and 72% for H/D = 15 and 25, respectively.
At D/t = 100 and in the case of fcu = 50 MPa, the values of Pn increased by 15% and 23% for H/D = 7.5 and 12.5, respectively. For the case of using concrete with fcu = 60 MPa as infill, the values of Pn increased by 7% and 18% for H/D 7.5 and 12.5, respectively. In the case of a steel tube with fy = 420 MPa, the values of Pn increased by 10% and 18% for H/D = 7.5 and 12.5, respectively, and for the case of fy = 520 MPa the values of Pn increased by 3% and 11% for H/D = 7.5 and 12.5, respectively.
It can be obvious that the ECP 205-2007(LRFD) equations are more conservative for the slender sections (D/t = 100) than the compact sections (D/t = 25). With increasing (H/D), the ECP 205 equations are more conservative for compact sections and less conservative for slender sections. The ECP 205 equations are more conservative when increasing the infill concrete and steel tube strengths for the compact or slender sections. The failure load predicted from the ECP 205-2007 code compared to the analytical results from ANSYS ranges between (−5%) and (+96%), with an average ratio of 129.30%. These values are underestimated more than those obtained from the previous codes AISC (2005).

5.2.3. Discussion for Results from Eurocode 4 [36]

Comparing the analytical results from ANSYS with those obtained from the Eurocode 4 equations, it is found that for the case of using concrete with an fcu equal to 40 MPa and a steel tube with an fy equal to 360 MPa, and at D/t = 25, the values of failure load with respect to that obtained from ANSYS are decreased by 10% for H/D = 5 and decreased by 5%, 26%, and 47% for H/D = 15, 20, and 25, respectively, and at D/t = 33.3 the values of failure load increased by 0% and 5% for H/D = 7.5 and 12.5, respectively. In addition, at D/t = 50, the values of failure load decreased by 20% for H/D = 2.5 and decreased by 4%, 1% and 2% for H/D = 7.5, 10, and 12.5, respectively, and the values of failure load decreased by 1%, 20%, and 41% for H/D = 15, 20, and 25, respectively. In addition, at D/t = 100, the values of failure load decreased by 1% and increased by 2% and 0% for H/D = 7.5, 10 and 12.5, respectively.
At D/t = 2, 5 and with concrete of fcu = 50 MPa, the values of failure load are decreased by 4% and 47% for H/D = 15 and 25, respectively. For the case of concrete with fcu = 60 MPa as infill, the values of failure load decreased by 8% and 50% for H/D = 15 and 25, respectively. In the case of steel tube with fy = 420 Mpa, the values of the failure load decreased by 15% and 56% for H/D = 15 and 25, respectively, and for the case of fy = 520 MPa, the values of the failure load decreased by 29% and 68% for H/D = 15 and 25, respectively.
At D/t = 50, and with concrete of fcu = 50 MPa, the values of failure load are decreased by 4% for both H/D = 7.5 and 12.5, respectively, and decreased by 0% and 41% for H/D = 15 and 25, respectively, and at fcu = 60 MPa, the concrete infill values of failure load decreased by 5%, and 7% for H/D = 7.5 and 12.5, respectively, and decreased by 7% and 45% for H/D = 15 and 25, respectively. For fy = 420 MPa, the steel tube values of failure load decreased by 8% and 6% for H/D = 7.5 and 12.5, respectively and decreased by 11% and 50% for H/D = 15 and 25, respectively, and at fy = 520 Mpa, the values of failure load decreased by 16% and 17% for H/D = 7.5 and 12.5, respectively, and decreased by 24% and 61% for H/D = 15 and 25, respectively.
At D/t = 100, the values of failure load decreased by 3% for both H/D = 7.5 and 12.5, respectively. For the case of using concrete with fcu = 60 MPa as infill, the values of the failure load decreased by 8% and 10% for H/D 7.5 and 12.5, respectively. In the case of a steel tube with fy = 420 MPa, the values of failure load decreased by 6% and 5% for H/D = 7.5 and 12.5, respectively, and for the case of fy = 520 MPa, the values of the failure load decreased by 11% and 22% for H/D = 7.5 and 12.5, respectively.
It can be noted that the EC4 equations are more conservative for slender sections (D/t = 100) than compact sections (D/t = 25). The EC4 equations are more conservative when increasing the column-height–to-diameter (H/D) for the compact sections and less conservative for slender sections. The EC4 equations are more conservative when increasing the infill concrete and steel tube strengths for compact or slender sections. The failure load predicted from the Eurocode 4 code compared to analytical results from ANSYS ranges between (−68%) and (+24%) with an average ratio of 86.10%. These values are underestimated more than that obtained from the previous codes AISC (2005) and ECP 205-2007(LRFD).

5.2.4. Discussion for Results from AIJ (1997) [37]

For the case of using concrete with an fcu equal to 40 MPa and a steel tube with an fy equal to 360 MPa, it is found that at D/t = 2,5 the values of failure load with respect to that obtained from ANSYS are decreased by 15% for H/D = 5 and increased by 11% and decreased by 22% for H/D = 15 and 25, respectively, and for H/D = 20 increased by 18%, and at D/t = 33.3 the values of failure load decreased by 9% and increased by 9% for H/D = 7.5 and 12.5, respectively. In addition, at D/t = 50, the values of failure load decreased by 20% for H/D = 2.5 and decreased by 14% and 8% and increased by 2% for H/D = 7.5, 10, and 12.5, respectively, the values of failure load increased by 15%, and decreased by 11%, and increased by 31% for H/D = 15, 20 and 25, respectively, and at D/t = 100 the values of failure load decreased by 13%, 6%, and 2% for H/D = 7.5, 10 and 12.5, respectively.
At D/t = 25 and with concrete having fcu = 50 MPa the values of failure load with respect to that obtained from ANSYS are increased by 15% and 20% for H/D = 15 and 25, respectively. For the case of using high-strength concrete with fcu = 60 MPa as infill, the values of failure load increased by 12% and 29% for H/D = 15 and 25, respectively. In the case of fy = 420 MPa, the values of failure load increased by 8% and 22% for H/D = 15 and 25, respectively, and for the case of fy = 520 MPa, the values of failure load decreased by 5% and increased by 27% for H/D = 15 and 25, respectively.
At D/t = 50, and with concrete having fcu = 50 MPa, the values of the failure load with respect to that obtained from ANSYS are decreased by 15% and increased by 1% for H/D = 7.5 and 12.5, respectively, and increased by 19% and 44% for H/D = 15 and 25, respectively, and at fcu = 60 MPa as a high-strength concrete, the values of failure load decreased by 17% and 1% for H/D = 7.5 and 12.5, respectively, and increased by 13% and 44% for H/D = 15 and 25, respectively. In the case of fy = 420 MPa for the steel tube, the values of failure load decreased by 18% and 9% for H/D = 7.5 and 12.5, respectively and increased by 7% and 31% for H/D = 15 and 25, respectively and at fy = 520 MPa the values of failure load decreased by 26% and 10% for H/D = 7.5 and 12.5, respectively and decreased by 4% and increased by 31% for H/D = 15 and 25, respectively.
At D/t = 10,0 and in case of fcu = 50 MPa, the values of failure load decreased by 15% and increased by 2% for H/D = 7.5 and 12.5, respectively. For cases using high-strength concrete with fcu = 60 MPa as in-fill, the values of failure load decreased by 20% and 4% for H/D 7.5 and 12.5, respectively, in case of fy = 420 MPa, and the values of failure load decreased by 17% and increased by 1% for H/D = 7.5 and 12.5, respectively, and for cases of fy = 520 MPa the values of failure load decreased by 22% and 6% for H/D = 7.5 and 12.5, respectively.
It can be observed that the AIJ (1997) equations are more conservative for the compact sections (D/t = 25 and 33) more than the slender sections (D/t = 50 and 100); opposite to the previous codes in 5.3.1, 5.3.2, and 5.3.3. In addition, the AIJ equations are more conservative for high values of concrete and steel strength in cases of short or long columns but with ratios less than that obtained from the previous codes in 5.3.1, 5.3.2, and 5.3.3. The average ratio of the failure load obtained by ANSYS compared to the AIJ code is 103.26%, and this demonstrated that the results obtained by the ANSYS program are in good agreement with AIJ, ranging between −26% and +45%.

5.2.5. Summary of Codes Provisions Comparisons

Figure 25 represents the comparisons of the analytical results with the results predicted by the AISC, ECP205, EC4, and AIJ Codes.
It is shown that the AIJ (1997) design code has good convergence compared to the other studied codes that cover the various ratios of the tube-diameter-to-thickness, column-height-to-diameter, and various values of the concrete infill material properties and steel tube material properties compared to the results obtained by the ANSYS models of the CFST columns. The load-carrying capacity of the CFST columns calculated from the Eurocode 4 design code underestimated the values, while the AISC and ECP 205 design codes overestimated them. The most divergent design code is ECP 205 when compared to the other studied codes.
For all of the studied codes, it was found that the equations are more conservative for the slender sections than for the compact sections. In addition, they are more conservative when increasing the column-height–to–diameter (H/D) ratio for the compact sections and less conservative for the slender sections. The different codes are more conservative for the high values of infill concrete strength and steel tube strength for either the compact or slender sections.

6. Conclusions

This paper discusses the behavior of concrete-filled tubes extensively. The main studied parameters are the H/D ratio, D/t ratio, the concrete and steel tube material properties, and the use of stiffeners with different spacings. The validation with the different code provisions is discussed. Analytical work, including sixty-four specimens, was carried out, and the main conclusions can be drawn as:
(1)
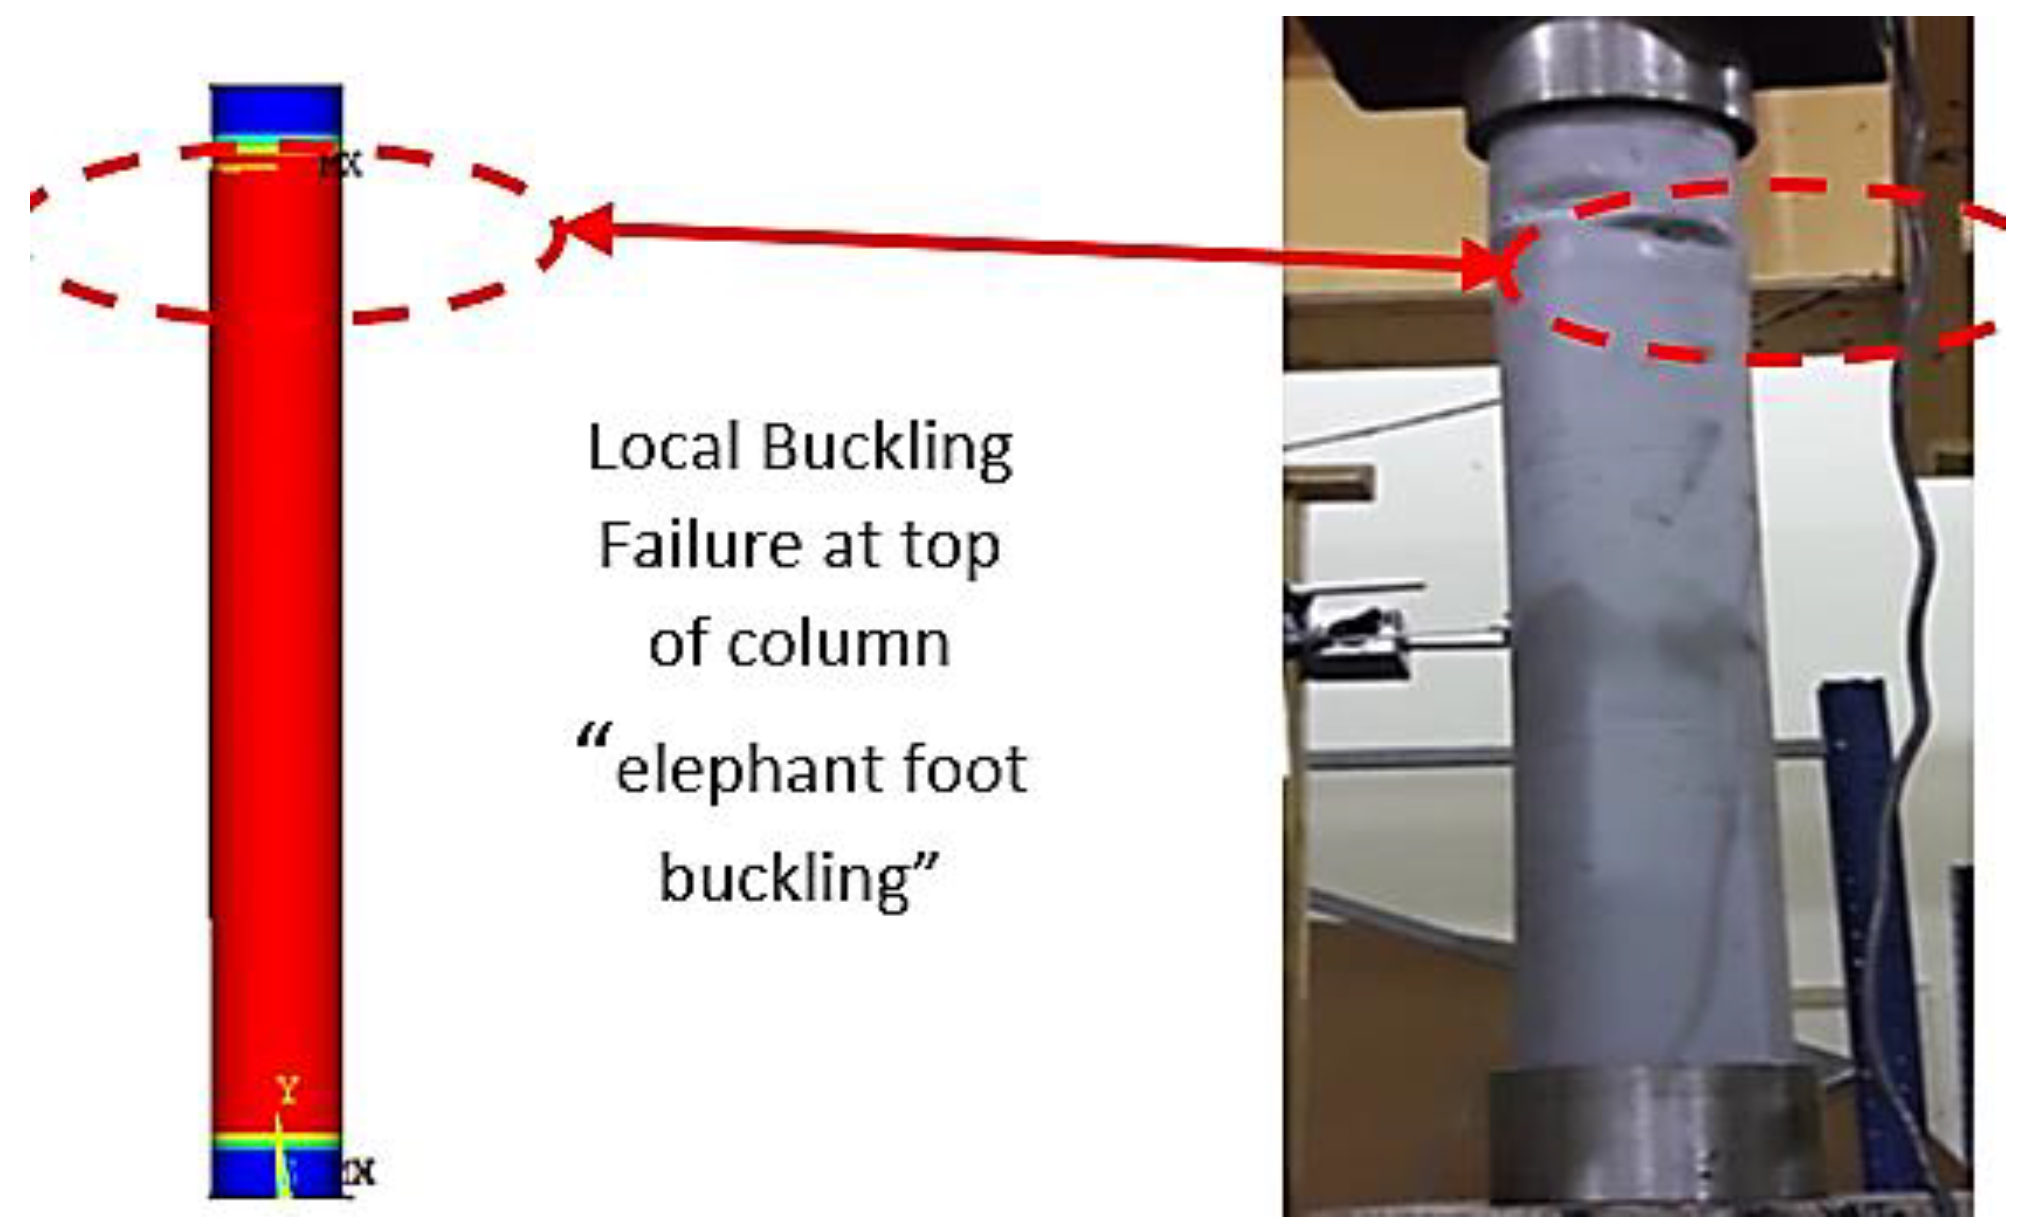
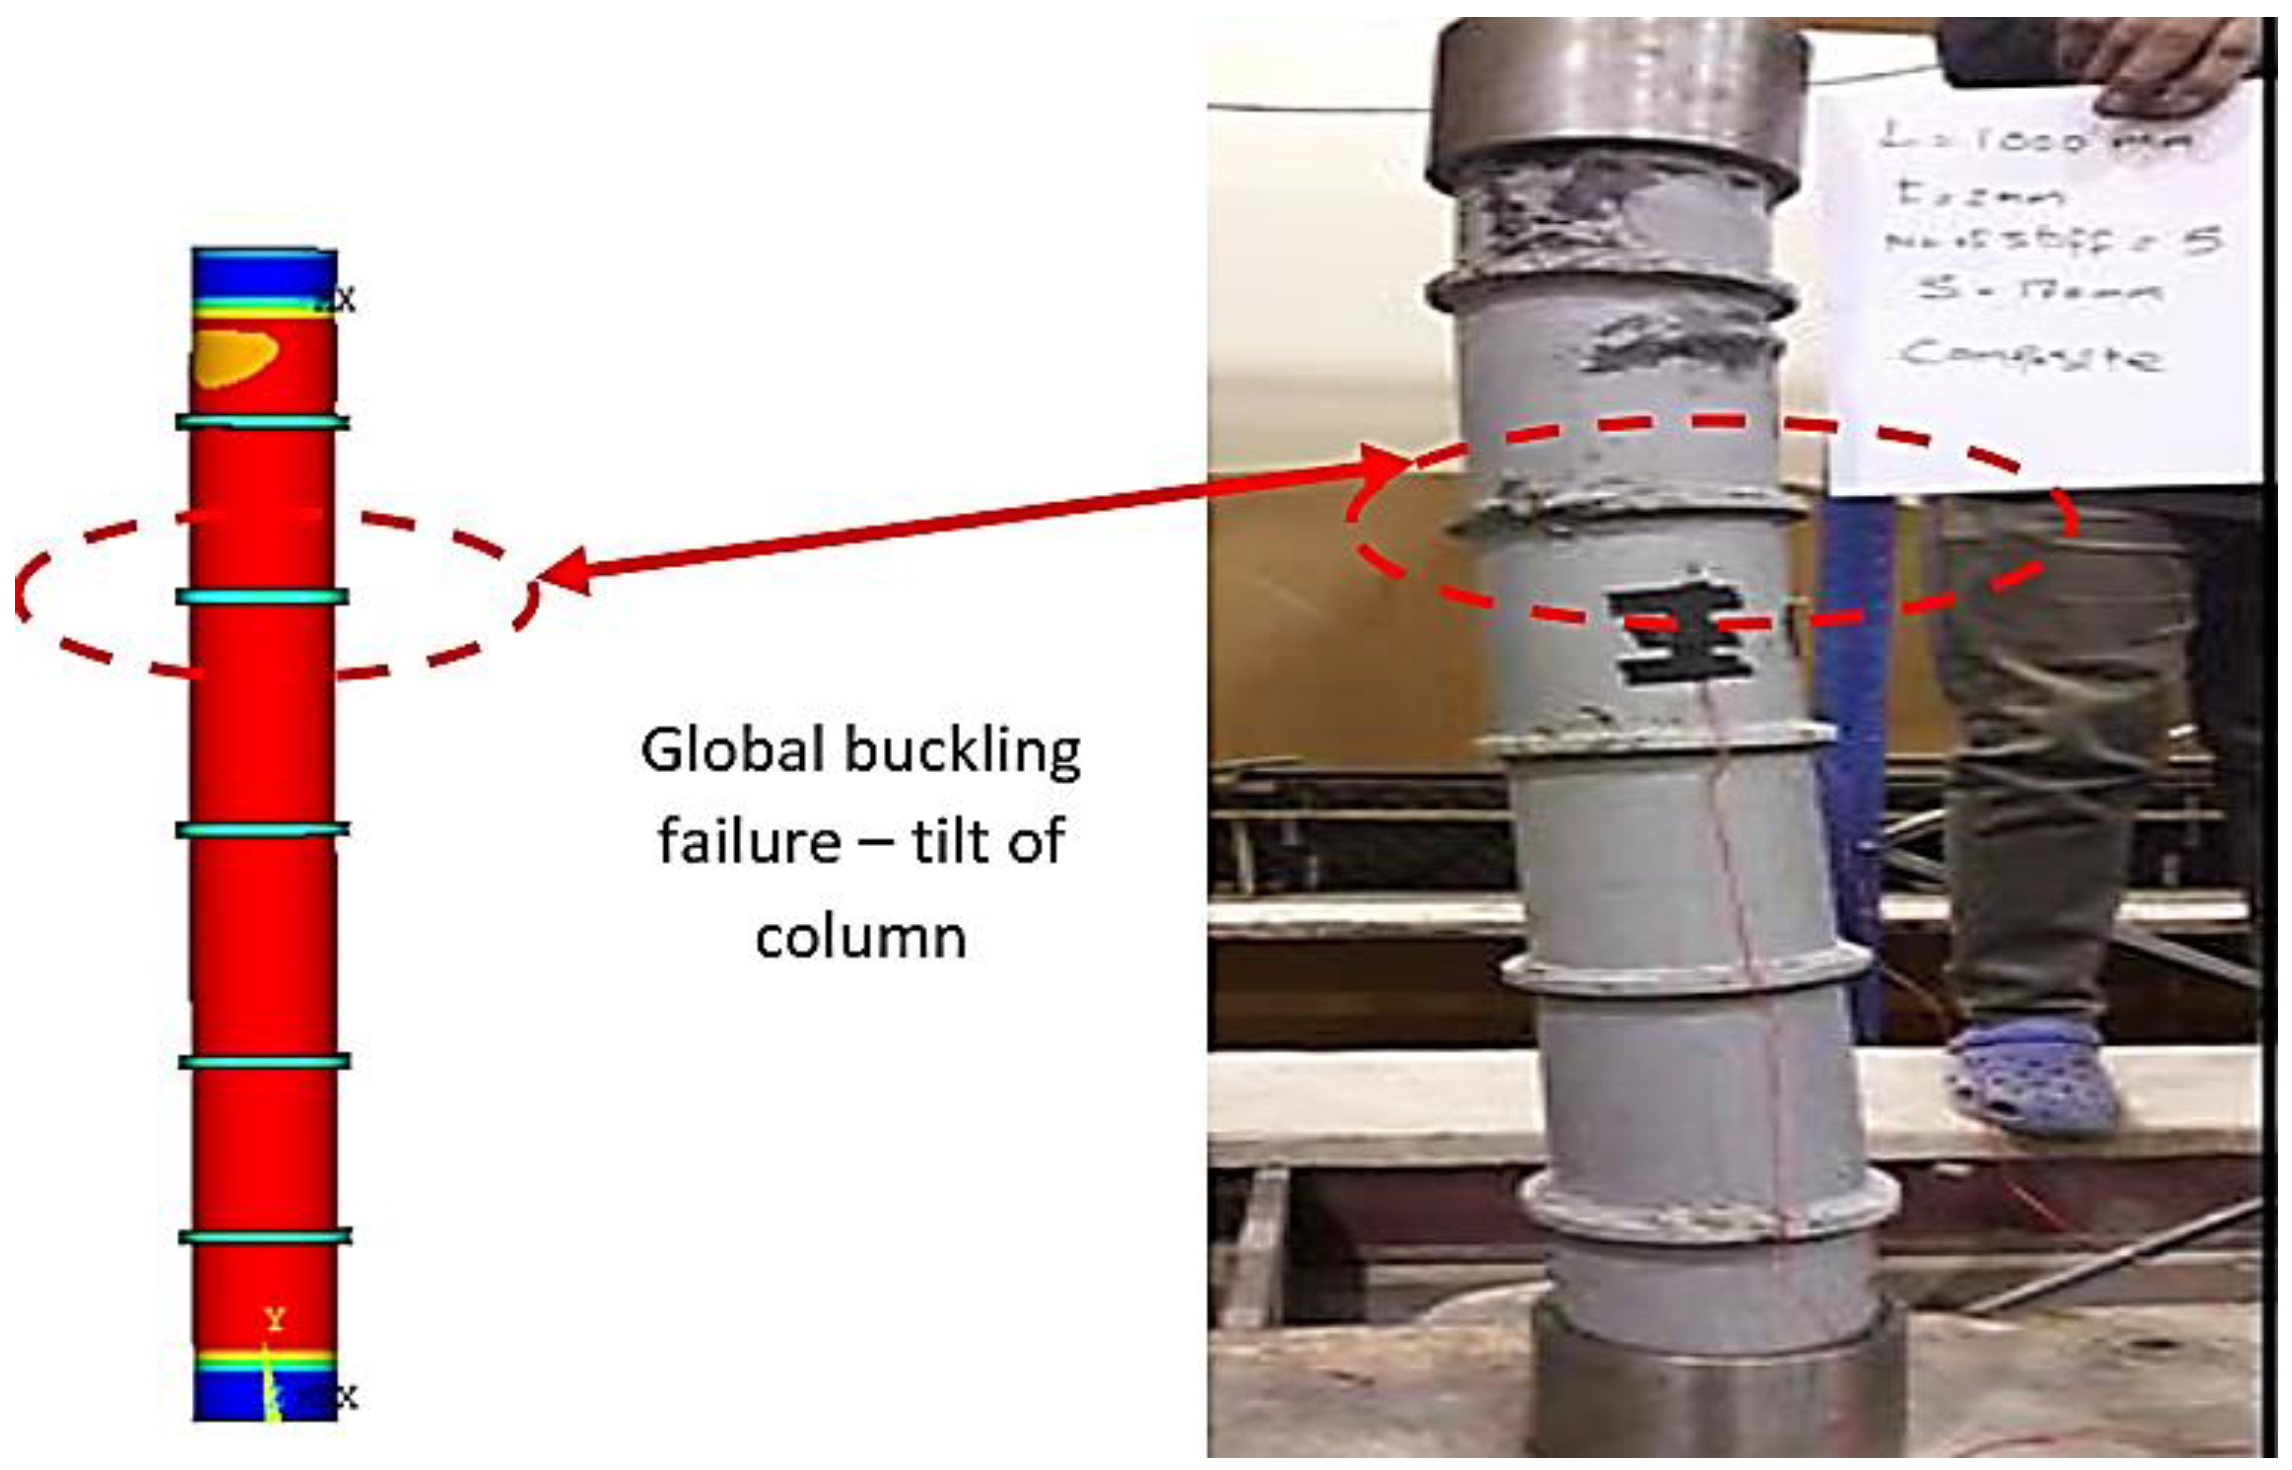
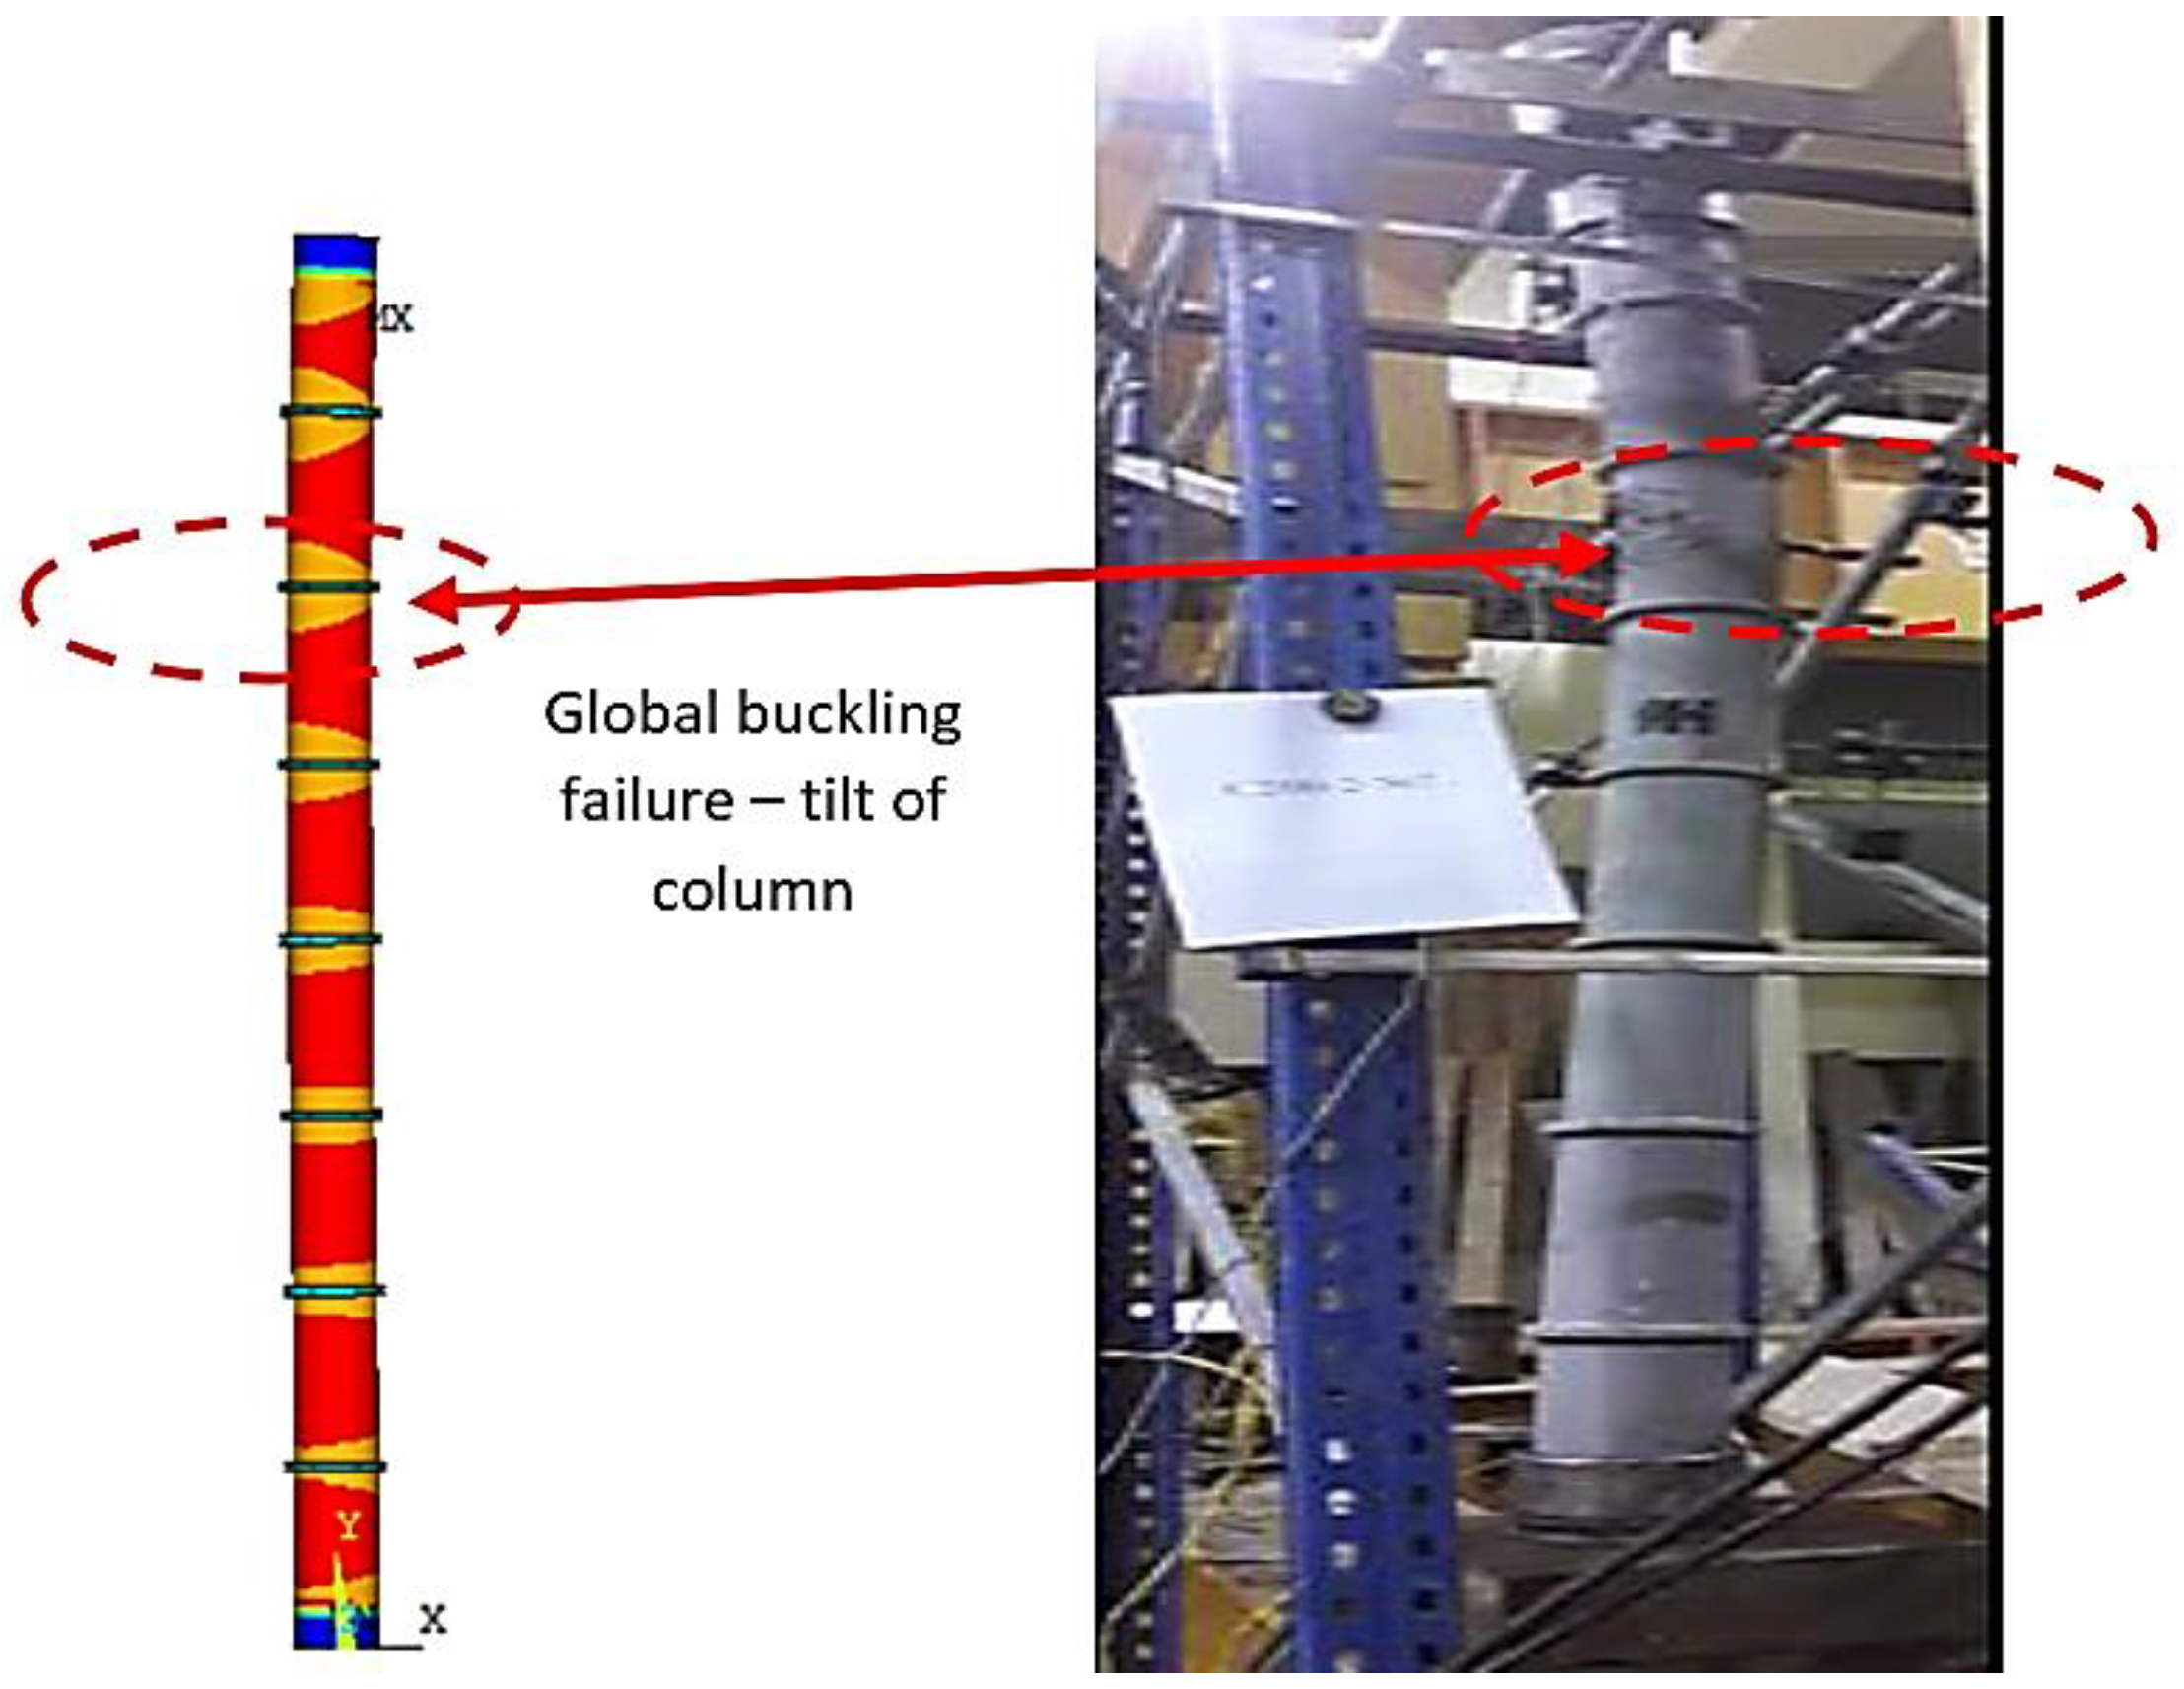
The ANSYS analytical models are in a good convergence to present the behavior and the failure modes of concrete-filled steel tube columns, either the yielding failure “the elephant foot buckling” for short ones or global buckling for long ones.
(2)
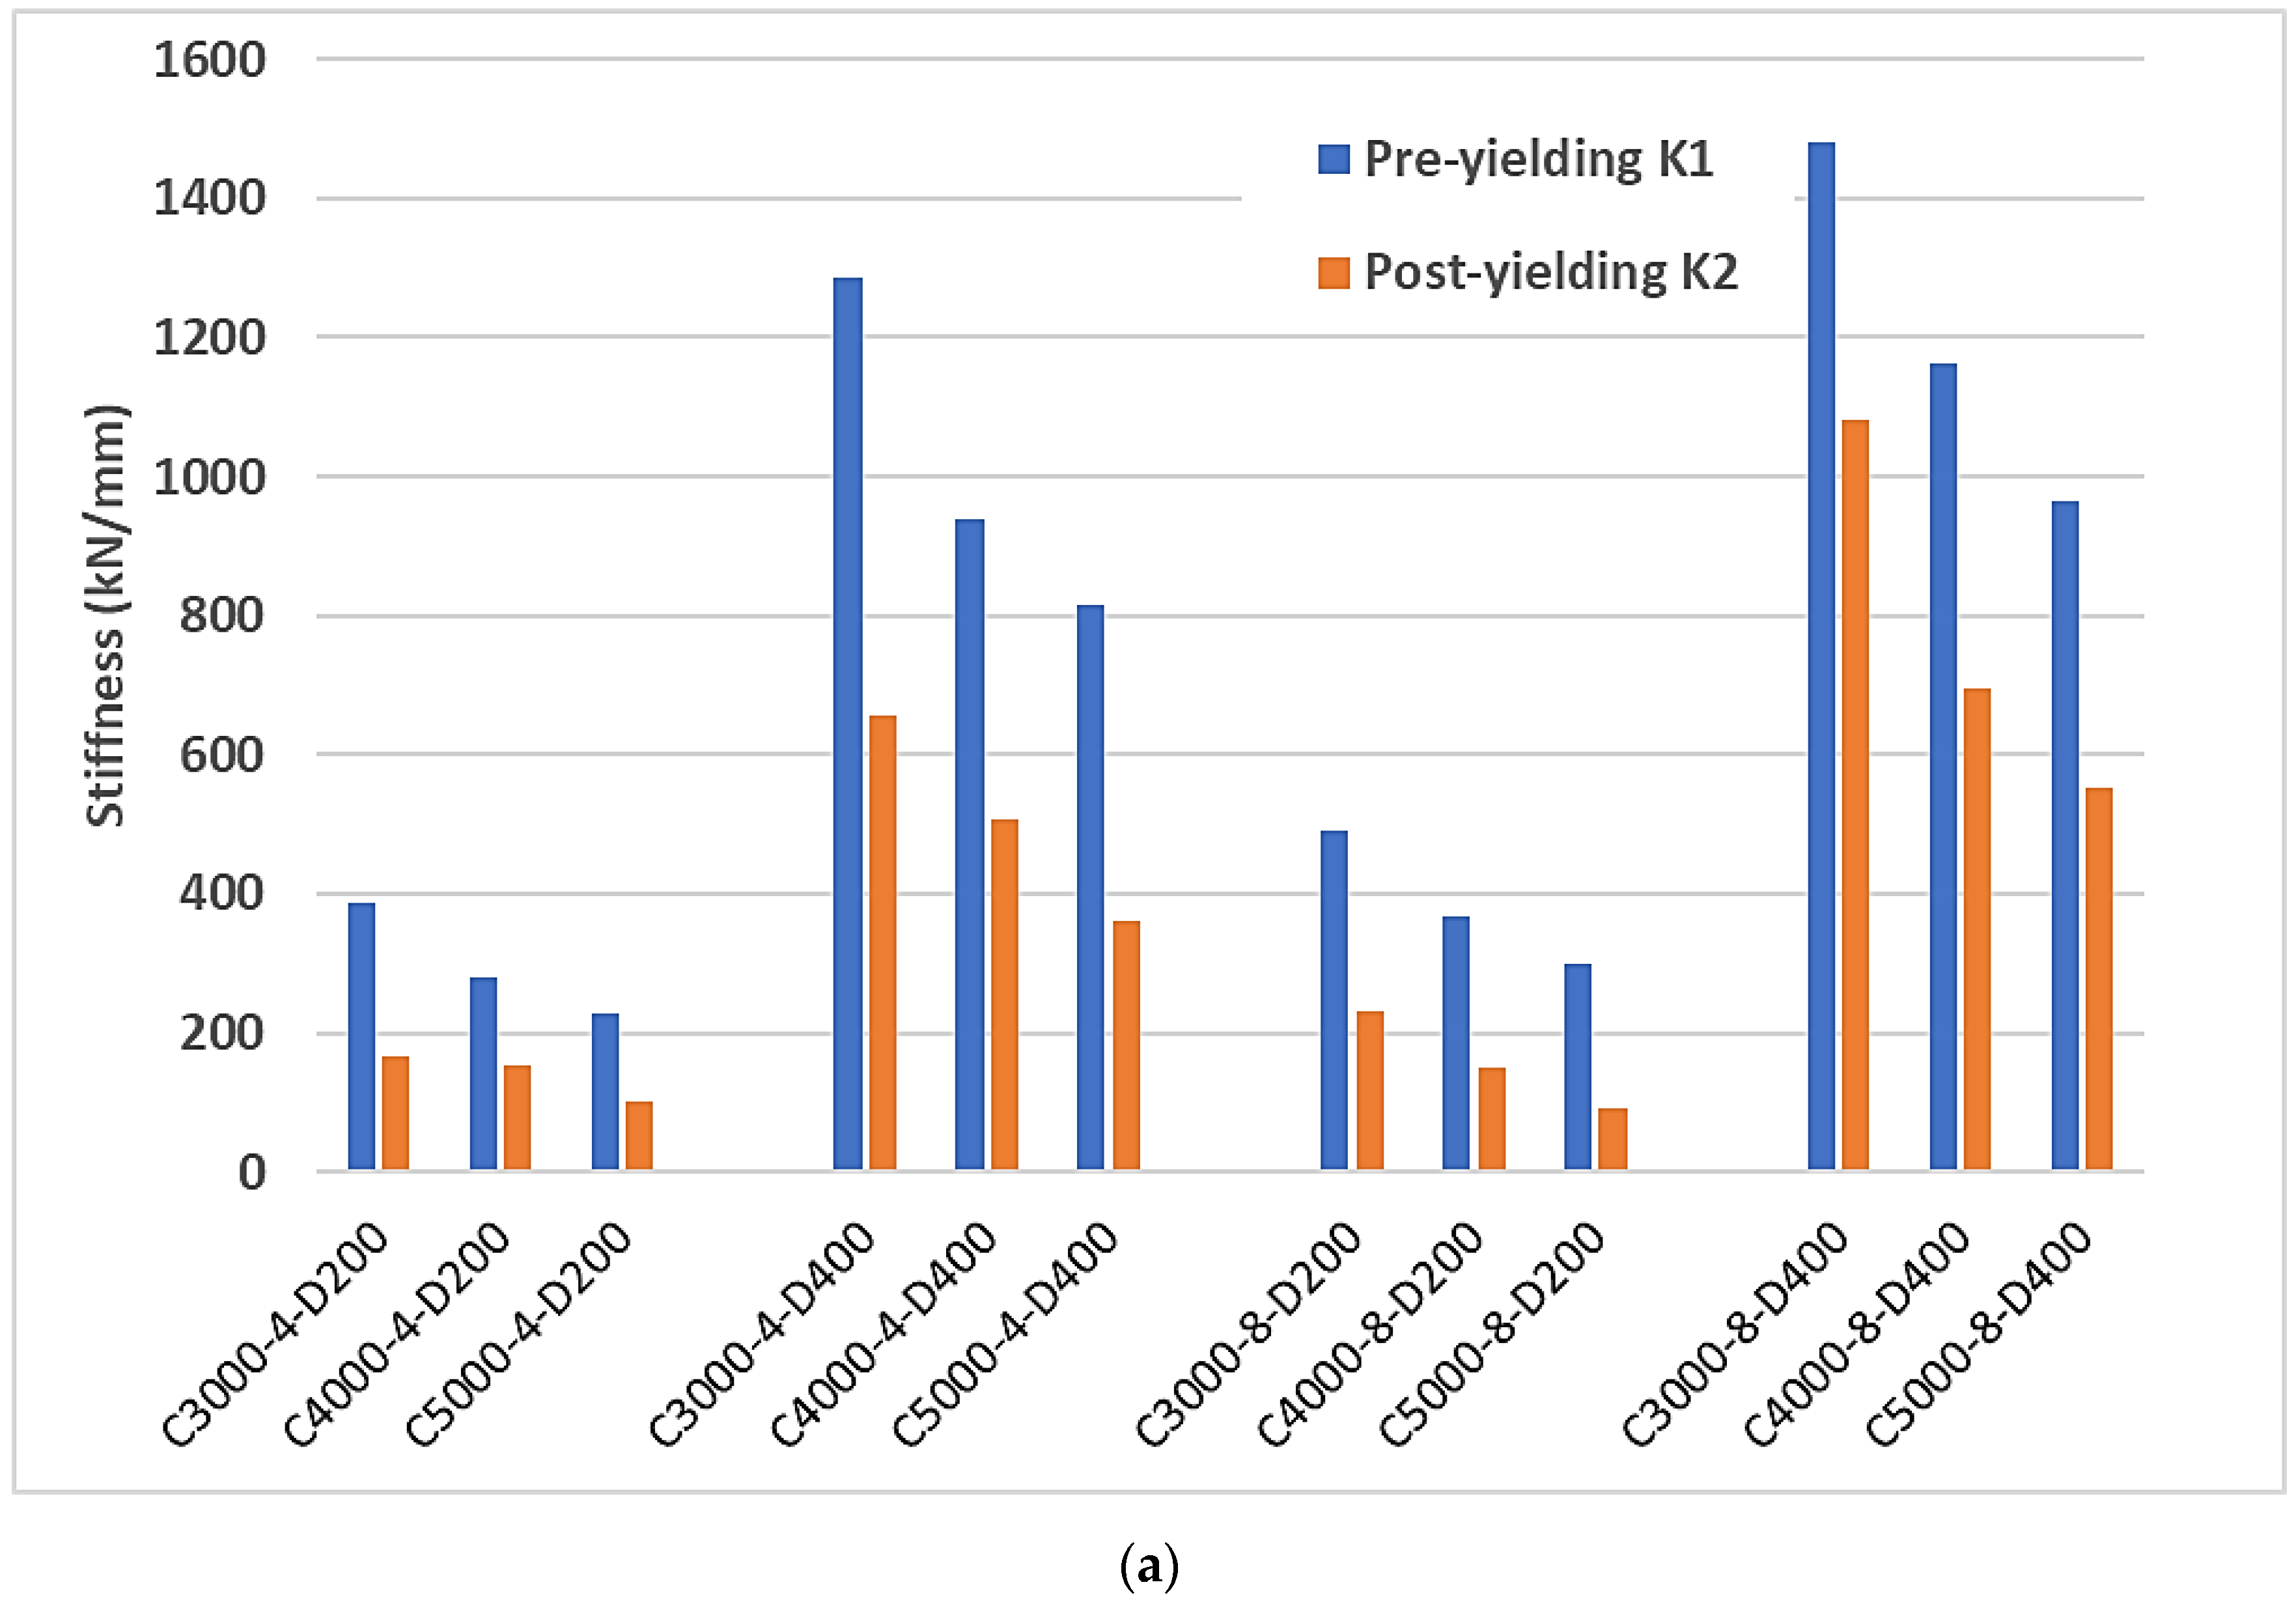
The effect of the compressive strength of the infilled concrete develops the behavior of the CFST columns gradually by increasing their load capacity but reducing the vertical deformation due to the increasing column stiffness.
(3)
The effect of the yielding strength of the steel tube on the CFST columns is not remarkable; the increase in the steel yield strength led to slight changes in failure load and vertical deformation.
(4)
The increase in the tube thickness of the CFST columns while maintaining the column diameter as a constant, i.e., D/t is reduced, the failure load is increased by 26–37%, but the vertical deformation is slightly affected by the tube thickness (about ± 6%).
(5)
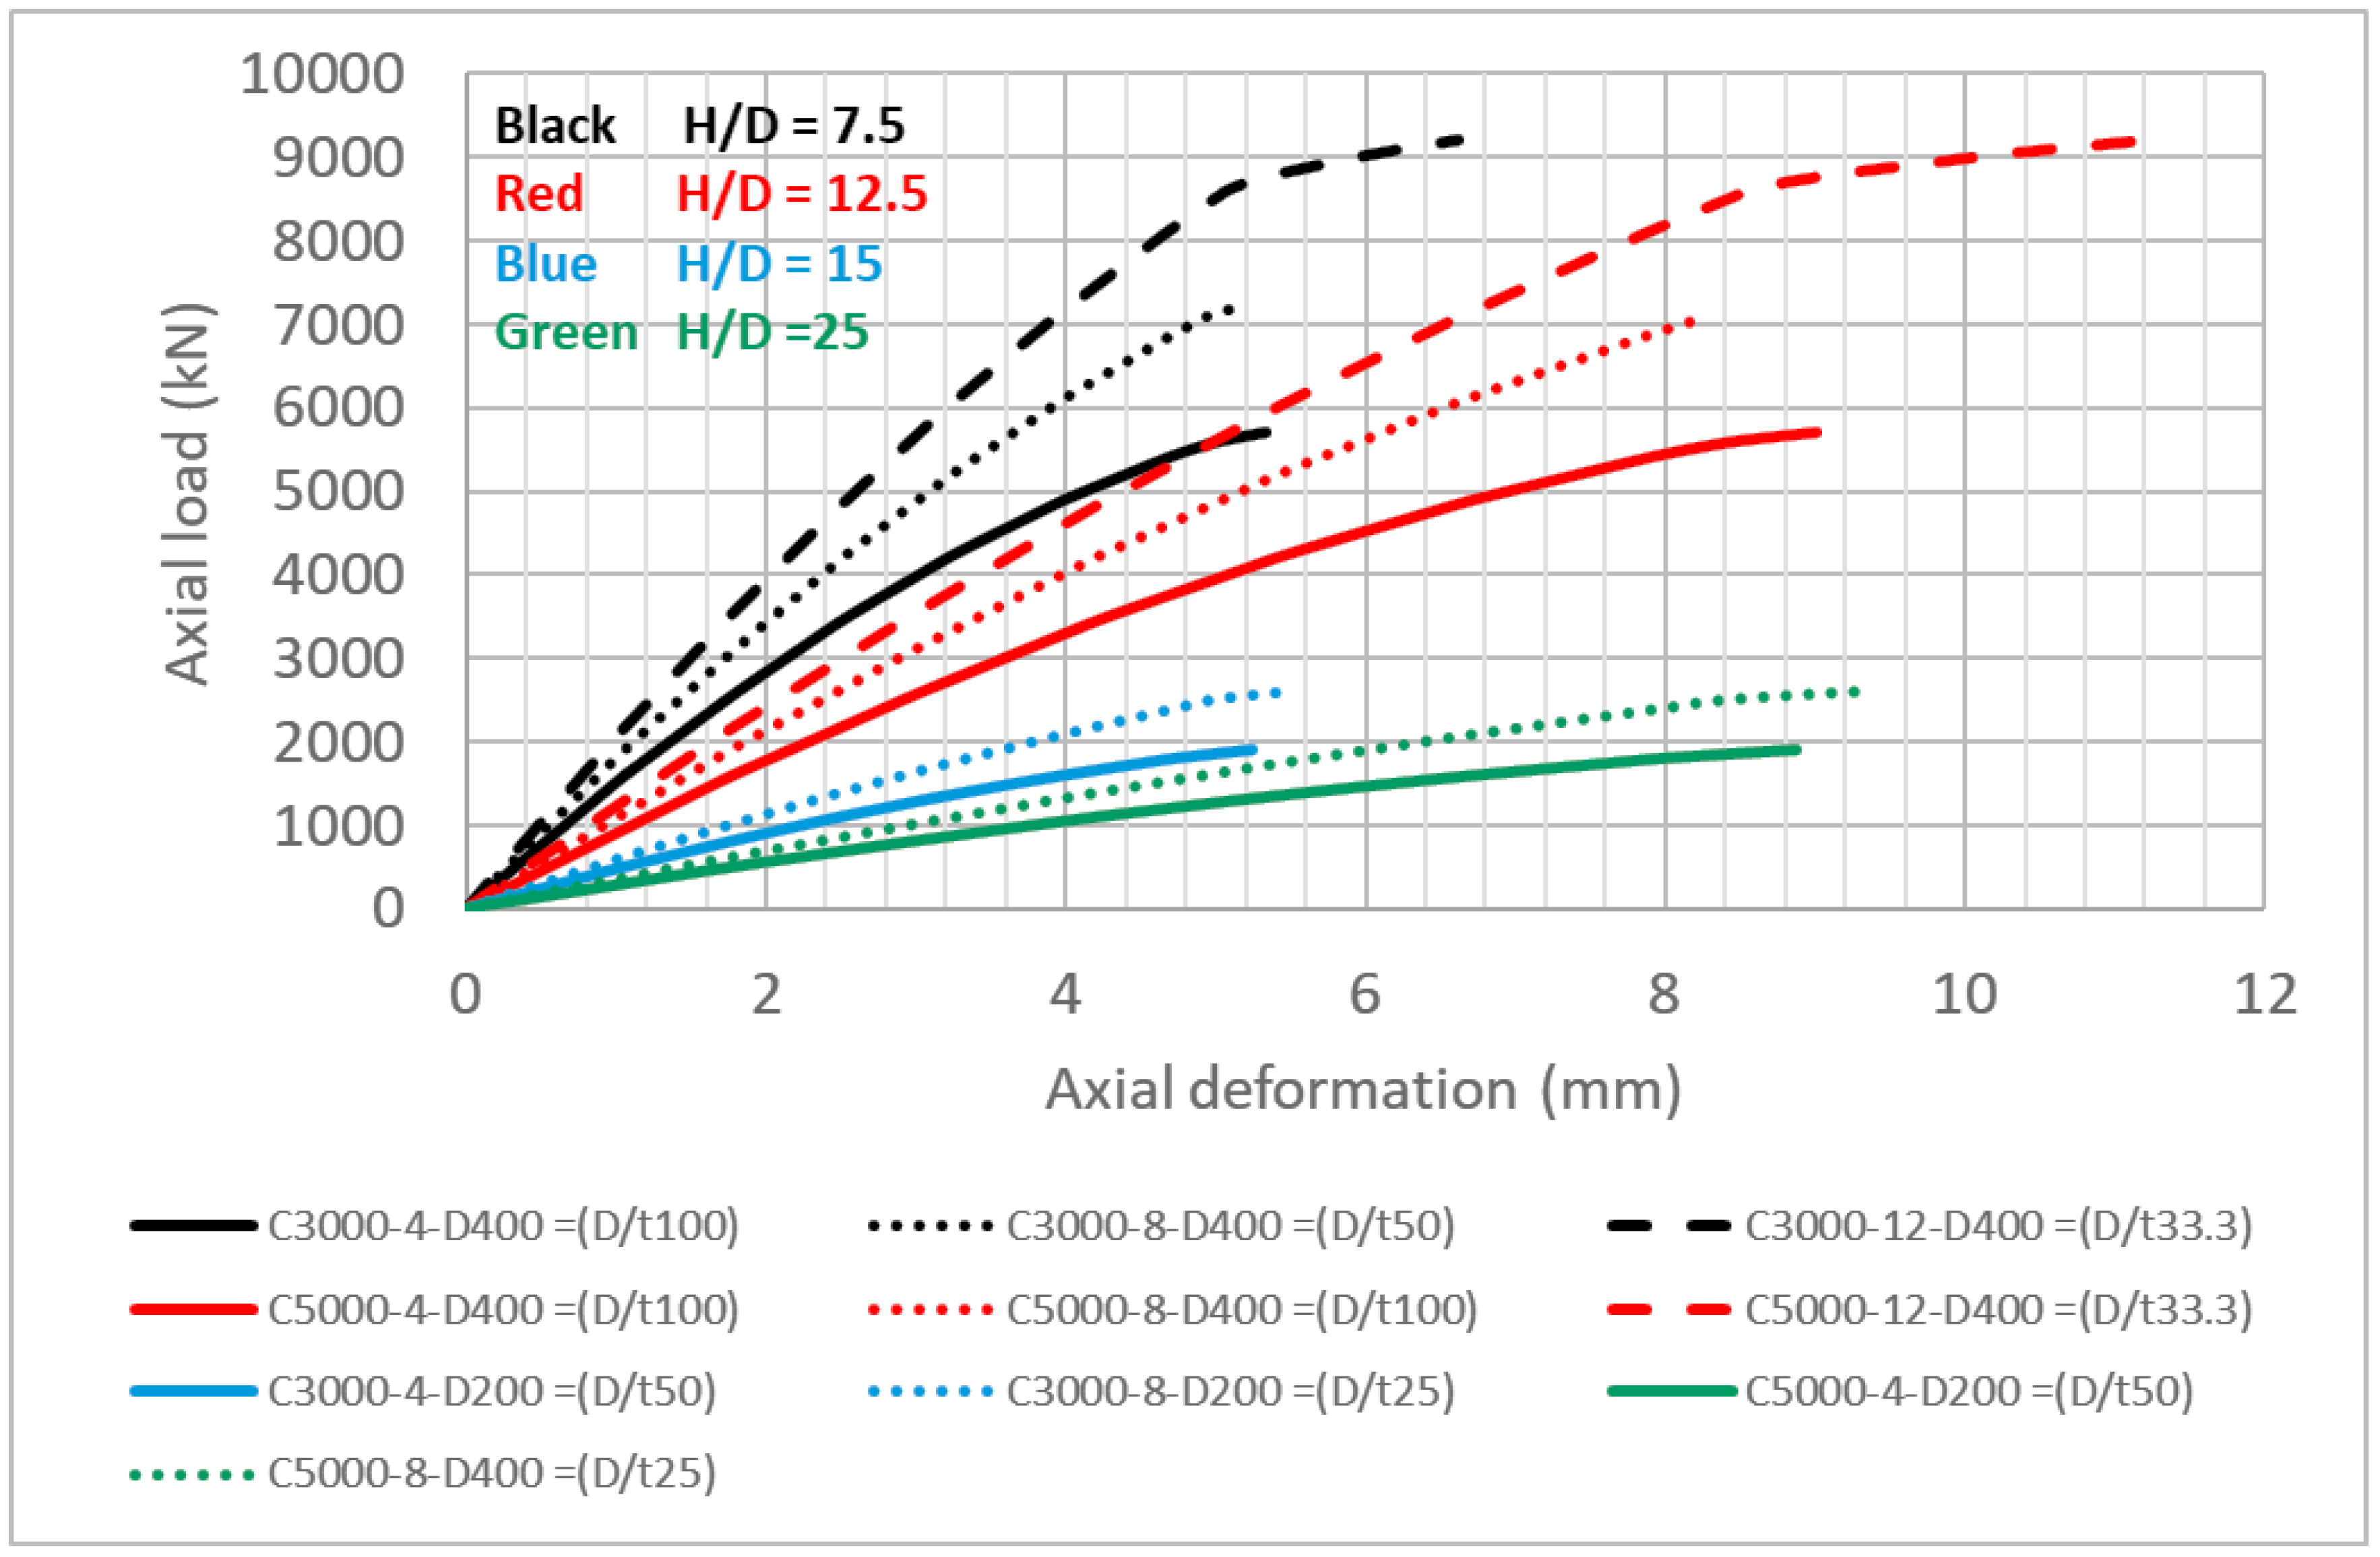
Increasing the diameter of the CFST columns while maintaining the tube thickness is constant, i.e., D/t is increased, significantly increasing the load-carrying capacity by 2.7–3.00 times as doubling the column diameter but decreasing the vertical deformation due to the increase in column stiffness. These decreases in the vertical deformation is more markable in long columns (H/D > 12) than for the medium (4 < H/D < 12) and short columns (H/D < 4).
(6)
The vertical deformation increased, but the failure load is not remarkably different when increasing the column height-to-diameter ratio (H/D) while maintaining the column diameter and tube thickness as constants. This is because decreasing the column stiffness by increasing the column height is inversely proportional to the deformation.
(7)
The stiffened CFST long columns (H/D > 12) using rings as stiffeners do not increase the failure load sufficiently but may reduce the column capacity compared to the unstiffened CFST columns. This is due to the steel tube yielding first at the location of the rings.
(8)
The stiffened CFST long columns using rings with close spacing between them failed prior to those with widely spaced rings. This earlier failure happened due to the failure of the stiffeners near the loading plate.
(9)
For long columns (H/D > 12), stiffening with rings with different spacings between them along the column height did not enhance the behavior of the CFST column.
(10)
The load capacity obtained from the AISC (2010), ECP 205-2007 (LRFD), Eurocode 4, and AIJ (2008) codes/standards varied from (−17% to +76%), (−5% to +96%), (−68% to +24%), and (−26% to +45%), respectively, when compared with that which are obtained from ANSYS.
(11)
ECP205-2007 is the most conservative design code in predicting the load capacity of CFST columns compared to the other studied codes/standards, with differences averaging 29.3% when compared to that are obtained from ANSYS.
(12)
The Eurocode 4 design code has the most underestimation values of the load-carrying capacity for the CFST columns.
(13)
The AIJ (1997) design code closely predicts the load capacity of the CFST columns compared to the other studied codes/standards with the differences when compared to that which are obtained from ANSYS by an average of 3.3% for various studied parameters that cover the various ratios of the tube-diameter-to-thickness, column-height-to-diameter, and various values of concrete infill material properties and steel tube material properties.
(14)
All of the studied codes/standards are more conservative for slender sections than compact sections. In addition, they are more conservative when increasing column height–to–diameter (H/D) for compact sections and less conservative for slender sections. The different codes are more conservative for the high values of infill concrete strength and steel tube strength for either compact or slender sections.

7. Future Works

Different shapes of CFST columns can be studied. Double-skin tubular columns filled with concrete can be studied, as can different types of stiffeners for long CFST columns; for example, using shear connectors and using through bolts. The effect of the eccentricity of axial load on the CFST columns can be considered. Finally, the effect of the biaxial moment in addition to axial load in the CFST beam columns can be studied.

Author Contributions

Conceptualization, F.M.F.S.; methodology, F.M.F.S. and N.M.A.; software, M.S.D. and N.M.A.; validation, M.S.D. and N.M.A.; formal analysis, F.M.F.S. and A.F.D.; investigation, A.F.D. and M.S.D.; resources, N.M.A.; data curation, N.M.A. and M.S.D.; writing—original draft preparation, N.M.A. and M.S.D.; writing—review and editing, A.F.D.; visualization, N.M.A.; supervision, F.M.F.S. and N.M.A.; project administration, A.F.D. and F.M.F.S.; funding acquisition, A.F.D. All authors have read and agreed to the published version of the manuscript.

Funding

This research received no external funding.

Institutional Review Board Statement

Not applicable.

Informed Consent Statement

Not applicable.

Data Availability Statement

All data related to the study are reported within the study.

Conflicts of Interest

The authors declare that there are no conflict of interest.

References

  1. Ye, J.; Jiang, L. Simplified Analytical Model and Shaking Table Test Validation for Seismic Analysis of Mid-Rise Cold-Formed Steel Composite Shear Wall Building. Sustainability 2018, 10, 3188. [Google Scholar] [CrossRef] [Green Version]
  2. Kim, H.-J.; Hu, J.-W.; Hwang, W.-S. Cyclic Testing for Structural Detail Improvement of CFT Column-Foundation Connections. Sustainability 2015, 7, 5260–5281. [Google Scholar] [CrossRef] [Green Version]
  3. Lv, J.; Zhou, T.; Li, K. Investigation and Application of a New Low-Carbon Material (Preplaced Aggregate Concrete) in Concrete-Filled Steel Tube Stub Columns. Sustainability 2020, 12, 1768. [Google Scholar] [CrossRef] [Green Version]
  4. Cao, B.; Zhu, L.; Jiang, X.; Wang, C. An Investigation of Compression Bearing Capacity of Concrete-Filled Rectangular Stainless Steel Tubular Columns under Axial Load and Eccentric Axial Load. Sustainability 2022, 14, 8946. [Google Scholar] [CrossRef]
  5. Shaker, F.M.F.; Ghanem, G.M.; Deifalla, A.F.; Hussein, I.S.; Fawzy, M.M. Influence of loading method and stiffening on the behavior of short and long CFST columns. Steel Compos. Struct. 2022, 44, 281–293. [Google Scholar] [CrossRef]
  6. Li, Y.; Zhang, Q.; Kamiński, P.; Deifalla, A.F.; Sufian, M.; Dyczko, A.; Ben Kahla, N.; Atig, M. Compressive Strength of Steel Fiber-Reinforced Concrete Employing Supervised Machine Learning Techniques. Materials 2022, 15, 4209. [Google Scholar] [CrossRef]
  7. Khan, M.A.; Aslam, F.; Javed, M.F.; Alabduljabbar, H.; Deifalla, A.F. New prediction models for the compressive strength and dry-thermal conductivity of bio-composites using novel machine learning algorithms. J. Clean. Prod. 2022, 350, 131364. [Google Scholar] [CrossRef]
  8. Shen, Z.; Deifalla, A.F.; Kamiński, P.; Dyczko, A. Compressive Strength Evaluation of Ultra-High-Strength Concrete by Machine Learning. Materials 2022, 15, 3523. [Google Scholar] [CrossRef]
  9. Amin, S.; Elwan, S.; Elzeiny, S.; Hamad, M.; Deifalla, A. Numerical modeling the effect of an opening on the behavior of exterior beam-column connections under cyclic loading. J. Build. Eng. 2021, 40, 102742. [Google Scholar] [CrossRef]
  10. Deifalla, A.; Awad, A.; Seleem, H.; Abdelrahman, A. Investigating the behavior of lightweight foamed concrete T-beams under torsion, shear, and flexure. Eng. Struct. 2020, 219, 110741. [Google Scholar] [CrossRef]
  11. Deifalla, A.; Awad, A.; Seleem, H.; Abdelrahman, A. Experimental and numerical investigation of the behavior of LWFC L-girders under combined torsion. Structures 2020, 26, 362–377. [Google Scholar] [CrossRef]
  12. Schneider, S.P. Axially Loaded Concrete-Filled Steel Tubes. J. Struct. Eng. 1998, 124, 1125–1138. [Google Scholar] [CrossRef]
  13. Susantha, K.; Ge, H.; Usami, T. Uniaxial stress–strain relationship of concrete confined by various shaped steel tubes. Eng. Struct. 2001, 23, 1331–1347. [Google Scholar] [CrossRef]
  14. Huang, C.S.; Yeh, Y.-K.; Liu, G.-Y.; Hu, H.-T.; Tsai, K.C.; Weng, Y.T.; Wang, S.H.; Wu, M.-H. Axial Load Behavior of Stiffened Concrete-Filled Steel Columns. J. Struct. Eng. 2002, 128, 1222–1230. [Google Scholar] [CrossRef] [Green Version]
  15. Hu, H.-T.; Huang, C.-S.; Wu, M.-H.; Wu, Y.-M. Nonlinear Analysis of Axially Loaded Concrete-Filled Tube Columns with Confinement Effect. J. Struct. Eng. 2003, 129, 1322–1329. [Google Scholar] [CrossRef] [Green Version]
  16. Giakoumelis, G.; Lam, D. Axial capacity of circular concrete-filled tube columns. J. Constr. Steel Res. 2004, 60, 1049–1068. [Google Scholar] [CrossRef]
  17. Zeghiche, J.; Chaoui, K. An experimental behaviour of concrete-filled steel tubular columns. J. Constr. Steel Res. 2005, 61, 53–66. [Google Scholar] [CrossRef]
  18. Yu, Z.-W.; Ding, F.-X.; Cai, C. Experimental behavior of circular concrete-filled steel tube stub columns. J. Constr. Steel Res. 2007, 63, 165–174. [Google Scholar] [CrossRef]
  19. Liang, Q.Q.; Fragomeni, S. Nonlinear analysis of circular concrete-filled steel tubular short columns under axial loading. J. Constr. Steel Res. 2009, 65, 2186–2196. [Google Scholar] [CrossRef]
  20. Goode, C.D.; Kuranovas, A.; Kvedaras, A.K. Buckling of Slender Composite Concrete-Filled Steel Columns. J. Civ. Eng. Manag. 2010, 16, 230–236. [Google Scholar] [CrossRef]
  21. Lai, M.; Ho, J. Confinement effect of ring-confined concrete-filled-steel-tube columns under uni-axial load. Eng. Struct. 2014, 67, 123–141. [Google Scholar] [CrossRef]
  22. Gupta, P.; Singh, H. Numerical study of confinement in short concrete filled steel tube columns. Lat. Am. J. Solids Struct. 2014, 11, 1445–1462. [Google Scholar] [CrossRef] [Green Version]
  23. Ajel, H.A.; Abbas, A. Experimental and Analytical Investigations of Composite Stub Columns. 2015. Available online: https://www.semanticscholar.org/paper/Experimental-and-Analytical-Investigations-of-Stub-Ajel-Abbas/dc9fd06c0f8de939828a7b36db239b885d7a663b (accessed on 14 August 2021).
  24. Tiwary, A.K.; Gupta, A.K. Nonlinear analysis of circular concrete filled steel tube columns under axial loading. Int. J. Innov. Technol. Explor. Eng. 2019, 8, 688–692. [Google Scholar] [CrossRef]
  25. Deifalla, A.F.; Fattouh, F.M.; Fawzy, M.M.; Hussein, I.S. Behavior of Stiffened and Unstiffened CFT under Concentric Loading. An Experimental Study. 2019. Available online: https://www.dbpia.co.kr/Journal/articleDetail?nodeId=NODE10697177 (accessed on 25 December 2019).
  26. Alatshan, F.; Osman, S.A.; Mashiri, F.; Hamid, R. Explicit Simulation of Circular CFST Stub Columns with External Steel Confinement under Axial Compression. Materials 2020, 13, 23. [Google Scholar] [CrossRef] [PubMed] [Green Version]
  27. Abdel-Zaher, A.S.; Abdel-Hafez, L.M.; Tawfic, Y.R.; Abdel-Fattah, M.E. Theoretical Investigation of Concrete Filled Steel Hollow Section Columns. J. Adv. Eng. Trends 2020, 39, 63–76. [Google Scholar] [CrossRef] [Green Version]
  28. Azad, S.K.; Uy, B. Effect of concrete infill on local buckling capacity of circular tubes. J. Constr. Steel Res. 2020, 165, 105899. [Google Scholar] [CrossRef]
  29. Ipek, S.; Erdoğan, A.; Güneyisi, E.M. Compressive behavior of concrete-filled double skin steel tubular short columns with the elliptical hollow section. J. Build. Eng. 2021, 38, 102200. [Google Scholar] [CrossRef]
  30. Zhang, L.; Yang, S.-L.; Fu, B.; Tong, G.-S.; Tong, J.-Z.; Jing, T. Behavior and design of concrete-filled narrow rectangular steel tubular (CFNRST) stub columns under axial compression. J. Build. Eng. 2021, 37, 102166. [Google Scholar] [CrossRef]
  31. Grzeszykowski, B.; Szmigiera, E.D. Experimental Investigation on the Vertical Ductility of Rectangular CFST Columns Loaded Axially. Materials 2022, 15, 2231. [Google Scholar] [CrossRef]
  32. Erdoğan, A.; Güneyisi, E.M.; Süleyman, İ.P.E.K. Finite Element Modelling of Ultimate Strength of CFST Column and Its Comparison with Design Codes. Bilecik Şeyh Edebali Üniversitesi Fen Bilimleri Dergisi 2022, 9, 324–339. [Google Scholar] [CrossRef]
  33. ANSYS R19.0; Release 19.1 Documentation for ANSYS. 19.0 ed. ANSYS: Canonsburg, PA, USA, 2019.
  34. Yu, L.; Leng, G.; Python, A.; Peng, J. A Comprehensive Evaluation of Latest GPM IMERG V06 Early, Late and Final Precipitation Products across China. Remote Sens. 2021, 13, 1208. [Google Scholar] [CrossRef]
  35. AISC360-10; Specification for Structural Steel Buildings. American Institute of Steel Construction, 2010. Available online: https://www.scirp.org/(S(vtj3fa45qm1ean45vvffcz55))/reference/ReferencesPapers.aspx?ReferenceID=2280991 (accessed on 14 August 2021).
  36. European Committee for Standardization. Design of Composite Steel and Concrete Structures. Part 1-1: General Rules and Rules for Buildings. InEurocode. 1994. Available online: https://standards.iteh.ai/catalog/standards/cen/5831a352-53ea-4e99-8453-2720d42f0f12/en-1994-1-1-2004-ac-2009 (accessed on 14 August 2021).
  37. AIJ, B. Recommendations for Design and Construction of Concrete Filled Steel Tubular Structures; Architectural Institute of Japan (AIJ): Tokyo, Japan, 1997. [Google Scholar]
  38. Egyptian Code of Practice for Steel Construction (Load and Resistance Factor Design). Code No. (205)-Ministerial Decree No. 359-2007—First Edition. 2008. Available online: https://www.scribd.com/document/344244019/Egyptian-Code-of-Steel-LRFD-2008-pdf (accessed on 14 August 2021).
Figure 1. (a) Experimental CFST column specimens and (b) test setup.
Sustainability 14 14024 g001
Figure 2. Stress–strain curve for (a) infilled concrete and (b) steel tube.
Sustainability 14 14024 g002
Figure 3. Volume’s geometry in ANSYS of CFST columns models (a) without stiffeners and (b) with stiffeners.
Sustainability 14 14024 g003
Figure 4. Meshing of CFST columns (a) Concrete core (b) Steel tube (c) Loading and Supporting Plates (d) External Stiffener (e) Full Model of CFST (f) Full Model with degree of freedom restrains and load application.
Sustainability 14 14024 g004aSustainability 14 14024 g004b
Figure 5. The yielding failure of S40-2 and Experimental Specimen.
Sustainability 14 14024 g005
Figure 6. The yielding failure of C40-2 and Experimental Specimen.
Sustainability 14 14024 g006
Figure 7. The yielding failure of C100-2 and Experimental Specimen.
Sustainability 14 14024 g007
Figure 8. The yielding failure of C200-2 and Experimental Specimen.
Sustainability 14 14024 g008
Figure 9. The yielding failure of C40-2-St2.
Sustainability 14 14024 g009
Figure 10. The Global failure of C100-2-St5 and Experimental Specimen.
Sustainability 14 14024 g010
Figure 11. The combined failure of C200-2-St7 and Experimental Specimen.
Sustainability 14 14024 g011
Figure 12. Load–deformation curve comparisons between ANSYS results and test results for unstiffened and stiffened CFST columns with (a) H/D = 3.14, (b) H/D = 7.87 and (c) H/D = 15.75.
Sustainability 14 14024 g012aSustainability 14 14024 g012b
Figure 13. The failure load and vertical deformation curve for H/D of (a) 7.5, (b) 12.5, (c) 15, and (d) 25 in CFST columns with different values of infilled concrete compressive strength.
Sustainability 14 14024 g013
Figure 14. (a) The column stiffness and (b) ductility index for CFST columns with different values of infilled concrete compressive strength.
Sustainability 14 14024 g014
Figure 15. The failure load and vertical deformation curve for H/D of (a) 7.5, (b) 12.5, (c) 15, and (d) 25 in CFST columns with different values of steel tube yielding strength.
Sustainability 14 14024 g015
Figure 16. (a) The column stiffness and (b) ductility index for CFST columns with different values of steel tube yielding strength.
Sustainability 14 14024 g016
Figure 17. The failure load and vertical deformation curve for H/D = 7.5, 12.5,15, and 25 in CFST columns with different values of tube-diameter-to-thickness ratio by remaining constant diameter.
Sustainability 14 14024 g017
Figure 18. (a) The column stiffness and (b) ductility index for CFST columns with different values of tube thickness.
Sustainability 14 14024 g018aSustainability 14 14024 g018b
Figure 19. The failure load and vertical deformation curve for H/D = 7.5, 12.5,15, and 25 in CFST columns with different values of tube-diameter-to-thickness ratio by remaining constant tube thickness.
Sustainability 14 14024 g019
Figure 20. (a) The column stiffness and (b) ductility index for CFST columns with different values of tube diameter.
Sustainability 14 14024 g020aSustainability 14 14024 g020b
Figure 21. The failure load and vertical deformation curve for D/t = 25, 50 and 100 in CFST columns with different values of column-height-to-tube diameter (H/D).
Sustainability 14 14024 g021
Figure 22. (a) The column stiffness and (b) ductility index for CFST columns with different values of tube heights.
Sustainability 14 14024 g022aSustainability 14 14024 g022b
Figure 23. The failure load and vertical deformation curve for unstiffened and stiffened each 250, 500, 1000 mm in CFST columns with different values of H/D. (a) H = 1000 mm; (b) H = 3000 mm; (c) H = 5000 mm.
Sustainability 14 14024 g023
Figure 24. The Von Mises stresses for different ratios of H/D having no stiffeners, stiffeners each 1.0 m, 0.5 m, and 0.25 m, respectively.
Sustainability 14 14024 g024aSustainability 14 14024 g024b
Figure 25. Comparisons of analytical results with Results Predicted by AISC, ECP205, EC4, and AIJ Codes.
Sustainability 14 14024 g025
Table 1. Material properties of infilled concrete.
Linear Isotropic
EX28,555 MPa
PRXY0.2
Multilinear Isotropic
PointStrainStress (MPa)
10.0000000.00
20.00035310.08
30.00060416.16
40.00085421.53
50.00110525.83
60.00135529.04
70.00160531.27
80.00185632.66
90.00235733.60
Concrete
Shear Transfer Coef. for Opened Cracks0.2
Shear Transfer Coef. for Closed Cracks0.9
Uniaxial tensile Stress3.89 MPa
Uniaxial compressive Stress42 MPa
Table 2. Material properties of steel tube and stiffeners by.
Material TypePropertyValue
Linear IsotropicEX200,000 MPa
PRXY0.3
Multilinear IsotropicPointStrain Stress (MPa)
10.000.00
20.00176352
30.00506418
Table 3. Commands used to control nonlinear static analysis.
Analysis OptionsSmall Displacement Static
Calculate prestress effectsNo
Time at end of load step2000
Automatic time steppingOff
Time step size200
Min time step100
Max time step10000
FrequencyWrite every sub step
Write items to result fileAll solution items
Table 4. Comparisons of ultimate axial loads calculated by ANSYS results and measured in existing testing.
Specimen Codet
mm
D/tH
mm
H/DConcrete
Infill
LoadingStiffeners
Location
Axial Load Failure (KN)Failure Mode
PExpPANSYSPANSYS/PExp
1S40-2-only263.54003.14No Steel No2552601.02
(+2%)
Local
2S100-2-only10007.872302200.96
(−4%)
Local
3S200-2-only200015.752202501.14
(+14%)
Global
4S40-4-only431.84003.14No Steel 6085500.90
(−10%)
Local
5S100-4-only10007.875805300.91
(−9%)
Global
6S200-4-only200015.755205301.02
(+2%)
Global
7C40-2263.54003.14FilledComposite8607500.87
(+13%)
Yield
8C100-210007.877437401.00
(0%)
Global
9C200-2200015.757246800.94
(−6%)
Global
10C40-4431.84003.14126012601.00
(0%)
Yield
11C100-410007.87109810800.98
(−2%)
Global
12C200-4200015.75107810901.01
(+1%)
Global
13S40-2263.54003.14Steel 8309501.14
(+14%)
Yield
14S100-210007.877167201.01
(+1%)
Local
15S200-2200015.757136600.93
(−7%)
Local
16C40-2-St1263.54003.14Composite0.5 H9589701.01
(+1%)
Yield
17C100-2-St310007.870.25 H8167900.97
(−3%)
Global
18C200-2-St5200015.750.25 H8027600.95
(−5%)
Global
19C40-2-St24003.140.33 H107510701.00
(0%)
Yield
20C100-2-St510007.870.167 H8308601.04
(+4%)
Global
21C200-2-St7200015.750.125 H8027600.95
(−5%)
Combined
22C40-4-St1431.84003.140.5 H129512100.93
(−7%)
Yield
23C100-4-St310007.870.25 H117911600.89
(−11%)
Global
24C200-4-St5200015.750.25 H105210901.03
(+3%)
Global
25S40-2-St2263.54003.14Steel0.33 H9998000.80
(−20%)
Yield
26S100-2-St510007.870.167 H88210001.13
(+13%)
Global
27S200-2-St7200015.750.125 H7809301.19
(+19%)
Global
Table 5. Material properties of infilled concrete in parametric study.
CasesCase 1
fcu = 40 MPa
Case 2
fcu = 50 MPa
Case 3
fcu = 60 MPa
Linear Isotropic
EX31,112.7 MPa34,785 MPa38,105 MPa
PRXY0.20.20.2
Multilinear Isotropic
PointStrainStress (MPa)StrainStress (MPa)StrainStress (MPa)
10.00.00.00.00.00.0
20.00038612.000.00043115.000.00047218.00
30.00065919.240.00073724.050.00080728.86
40.00093225.630.00104232.040.00114238.45
50.00120530.740.00134838.430.00147646.12
60.00147834.570.00165343.210.00181151.86
70.00175237.220.00195846.530.00214555.84
80.00202538.890.00226448.610.00248058.33
90.00229839.750.00256949.690.00281559.62
100.00257140.000.00287550.000.00314960.00
Concrete
Shear Transfer Coef. for Opened Cracks0.20.20.2
Shear Transfer Coef. for Closed Cracks0.90.90.9
Uniaxial tensile Stress MPa4.244.745.2
Uniaxial compressive Stress MPa405060
Table 6. Material properties of steel tube in parametric study.
CasesCase 1
fy = 360 MPa
Case 2
Fy = 420 MPa
Case 3
Fy = 520 MPa
Linear Isotropic
EX2 × 105 MPa
PRXY0.3
Multilinear Isotropic
PointStrain Stress (MPa)Strain Stress (MPa)Strain Stress (MPa)
1000000
20.00183600.00214200.0026520
30.00684600.00615000.0066600
Table 7. Limits of cross-section-dimension-to-steel-tube-thickness (D/t) ratio for composite sections under different codes provisions.
CodeLocal Slenderness Ratio D/tMax D/t
ECP 205-2007(LRFD)
ECP 203-2007
( 8   E s / f y ) 67.42
EC4 90 × ( 235 / f y ) 73.54
AIJ 35 , 250 / f y 100.14
Table 8. Maximum and minimum limits of column-height-to-cross-section-dimension (H/D) ratio for composite sections under different codes provisions.
CodeMin H/DMax H/D
EC4<4 (short column)>4 (long column)
AIJ≤4 (short column)≥12 (long column)
Table 9. Limits of infilled concrete compressive strength under codes of practice.
CodeConcrete Compressive Strength MPa
EC420–50
AISC21–70
Table 10. Description of specimens modeled by ANSYS and summary of the results.
Specimen NameH
mm
D
mm
t
mm
D/tH/Dfcu
MPa
fy
MPa
Stiffener’s LocationFailure Load
(KN)
V.L
Deformation
(mm)
Yielding
Load
(KN)
Yielding
Deformation
(mm)
Stiffness (KN/mm)Ductility
µ∆
Failure Mode
Pre-Yielding
K1
Post-Yielding
K2
1C1000-8-D40010004008502.540360No stiffeners 73001.75071001.554580.6410001.129Local
2C1000-8-D2001000200825527001.72824001.511533.3317541.144Local
3C3000-8-D40030004008507.572005.13864004.291480.581.1981.198Local
4C4000-8-D40040004008501071006.90959006.11163.26696.861.120Local
5C5000-8-D400500040085012.571008.28959006.9964.05553.251.201Local
6C3000-8-D20030002008251526005.55225005.12490.19231.481.084Local
7C4000-8-D20040002008252026007.46425006.8367.65150.6021.097Local
8C5000-8-D20050002008252526009.37525008.3301.2093.021.129Global
9C3000-4-D400300040041007.54036057005.32745003.431285.71656.811.552Local
10 C4000-4-D400 4000 400 4 10 57007.16545004.80937.5507.3991.492Local
11 C5000-4-D4005000400412.557009.00445005.40814.81360.711.667Local
12 C3000-4-D400-Fc5030004004 100 7.55036065005.75154004.21261.9773.691.369Local
13 C5000-4-D400-Fc505000400412.565009.72454007.5786.67269.781.297Local
14 C3000-4-D400-Fy42030004004 100 7.54042057005.16452004.301209.3578.71.201Local
15 C5000-4-D400-Fy4205000400412.557008.72151007.10718.31370.141.228Local
16 C3000-4-D400-Fc6030004004 100 7.56036070005.33361004.201452.4796.461.269Local
17 C5000-4-D400-Fc605000400412.570008.94761007.50813.33621.981.193Local
18 C3000-4-D400-Fy52030004004 100 7.54052058005.33052004.301209.3485.441.240Local
19 C5000-4-D400-Fy5205000400412.5 5800 9.002 51007.10718.13315.461.268Local
20 C3000-12-D40030004001233.37.54036092006.61287004.901775.5292.061.349Local
21C5000-12-D40050004001212.5920011.22887008.601011.6190.261.306Local
22 C3000-8-D400-Fc5030004008 50 7.55036080005.48376004.801583.3585.651.142Local
23 C5000-8-D400-Fc505000400812.579008.87575007.301027.4253.971.216Local
24 C3000-8-D400-Fy42030004008 50 7.54042074005.43765004.401477.3867.891.236Local
25 C5000-8-D400-Fy4205000400812.574009.17569007.80884.62363.641.176Local
26 C3000-8-D400-Fc6030004008 50 7.56036087005.57182004.901673.5745.161.137Local
27 C5000-8-D400-Fc605000400812.586009.11881007.501080309.021.216Local
28 C3000-8-D400-Fy52030004008 50 7.54052075005.45970004.411473.9953.291.238Local
29 C5000-8-D400-Fy5205000400812.575009.33270007.80897.44326.371.196Local
30 C3000-4-D200300020045015 40 360 19005.24918004.20387.1166.941.129Local
31 C4000-4-D200 4000 200 4 20 19007.07318006.42280.37153.141.102Local
32 C5000-4-D200500020042519008.87818007.90227.85102.251.124Global
33 C3000-4-D200-Fc5030002004 50 155036022006.18521005.2403.85101.521.189Local
34 C5000-4-D200-Fc505000200425220010.46621008.90235.9663.8571.176Global
35 C3000-4-D200-Fy42030002004 50 154042019005.15718004.80375280.111.074Local
36 C5000-4-D200-Fy420500020042519008.73918008.10222.22156.491.079Global
37 C3000-4-D200-Fc6030002004 50 156036023005.45321004.90428.57180.831.113Local
38 C5000-4-D200-Fc60500020042523009.20321008.30253.01221.481.109Global
39 C3000-4-D200-Fy52030002004 50 154052019005.15618004.80375280.111.074Local
40 C5000-4-D200-Fy520500020042519008.70218008.19222.22196.461.062Global
41 C3000-8-D200-Fc503000200825155036029006.52827005.12527.34142.051.275Local
42 C5000-8-D200-Fc505000200825290011.03528008.55327.4940.241.291Global
43 C3000-8-D200-Fy4203000200825154042028005.79426005.10509.8288.181.136Local
44 C5000-8-D200-Fy420500020082527009.32026008.60302.33138.891.084Global
45 C3000-8-D200-Fc603000200825156036030006.00128004.95575.76142.721.212Local
46 C5000-8-D200-Fc605000200825300010.18628008.60331.494.571.184Global
47 C3000-8-D200-Fy5203000200825154036028005.78826005.10509.8290.71.135Local
48 C5000-8-D200-Fy520500020082528009.76826008.60302.3385.6161.136Global
49 C1000-8-D400-@25010004008502.540360Every 250 mm71001.50270001.305384.61495.051.155local
50 C1000-8-D400-@50010004008Every 500 mm74001.76871001.305461.54641.031.360local
51 C3000-8-D400-@25030004008507.540360Every 250 mm 6600 4.295 61003.751626.67917.431.145local
52 C3000-8-D400-@50030004008Every 500 mm 7200 5.122 62004.301441.861216.541.191local
53 C3000-8-D400-@100030004008Every 1000 mm72005.13562004.201476.21069.51.223local
54 C5000-8-D400-@250300040085012.540360Every 250 mm65007.08660006.10984.13381.681.125local
55 C5000-8-D400-@50030004008Every 500 mm 7100 8.352 61006.20983.87464.681.347local
56 C5000-8-D400-@100030004008Every 1000 mm71008.50861006.20983.87433.281.372local
57 C1000-8-D200-@2501000200825540360Every 250 mm28001.79425001.401785.71761.421.281local
58 C1000-8-D200-@50010002008Every 500 mm27001.65225001.501666.671094.891.101local
59 C3000-8-D200-@25030002008251540360Every 250 mm26005.03424004.55527.47413.221.106local
60 C3000-8-D200-@50030002008Every 500 mm26005.32324004.82494.93397.611.104local
61 C3000-8-D200-@100030002008Every 1000 mm26005.45424004.91488.8367.651.111local
62 C5000-8-D200-@25030002008252540360Every 250 mm26008.48224007.81307.3397.621.086local
63 C5000-8-D200-@50030002008Every 500 mm26008.96424008.41292.68261.781.093local
64 C5000-8-D200-@100030002008Every 1000 mm26009.19224008.23291.62207.91.117local
Table 11. Comparisons of Ultimate Axial Loads between Analytical Results from ANSYS and obtained from Design Codes/standards.
Specimen CodeH/DD/tPANSYS (KN)AISC (2010)ECP 205-200 (LRFD)EC 4AIJ (1997)
Pn (KN)%
Panlytical/Pn
Pn (KN)%
Panlytical/Pn
PPLRD (KN)%
Panlytical/PPLRD
Pc (KN)%
Panlytical/Pc
C400-2-D1273.1463.5750744101%
(+1)
612123%
(23)
78196%
(−4)
85088%
(−12)
C1000-2-D1277.87740709104%
(+4)
593125%
(+25)
669111%
(+11)
77296%
(−4)
C2000-2-D12715.75680597114%
(+14)
523130%
(+30)
70896%
(−4)
606112%
(+12)
C400-4-D1273.1431.751260980129%
(+29)
857147%
(+47)
1143110%
(+10)
1158108%
(+8)
C1000-4-D1277.871150940122%
(+22)
830113%
(+13)
928124%
(+24)
1044110%
(+10)
C2000-4-D12715.751190810146%
(+46)
735110%
(+25)
975122%
(+22)
820145%
(+45)
C1000-8-D4002.5507300790892%
(−8)
6674109%
(+9)
910780%
(−20)
913780%
(−20)
C1000-8-D20052527002696100%
(0)
2425111%
(+11)
298990%
(−10)
318985%
(−15)
C3000-8-D4007.5507200757295%
(−5)
6472111%
(+11)
747396%
(−4)
836186%
(−14)
C4000-8-D40010507100728997%
(−3)
6296113%
(13)
718399%
(−1)
769392%
(−8)
C5000-8-D40012.55071006942102%
(+2)
6069119%
(+19)
724598%
(−2)
6965102%
(+2)
C3000-8-D200152526002307113%
(+13)
2132122%
(+22)
274095%
(−5)
2345111%
(+11)
C4000-8-D200 20 25 26002013129%
(+29)
1875139%
(+39)
353374%
(−26)
333078%
(−22)
C5000-8-D200252526001690154%
(+54)
1545168%
(+68)
493753%
(−47)
2205118%
(+18)
C3000-4-D4007.51005700603095%
(−5)
4898116%
(16)
574599%
(−1)
653987%
(−13)
C4000-4-D400 10 1005700577199%
(−1)
4760120%
(+20)
5611102%
(+2)
604694%
(−6)
C5000-4-D40012.510057005454105%
(+5)
4581124%
(+24)
5675100%
(0)
548798%
(−2)
C3000-4-D400-Fc50 7.5 1006500707092%
(−8)
5672115%
(+15)
666897%
(−3)
765885%
(−15)
C5000-4-D400-Fc50 12.5 10065006326103%
(+3)
5272123%
(+23)
670597%
(−3)
6397102%
(+2)
C3000-4-D400-Fy420 7.5 1005700629591%
(−9)
5175110%
(+10)
603894%
(−6)
687783%
(−17)
C5000-4-D400-Fy420 12.5 10057005667101%
(+1)
4820118%
(+18)
600495%
(−5)
5641101%
(+1)
C3000-4-D400-Fc60 7.5 1007000810186%
(−14)
6442107%
(+7)
760292%
(−8)
877780%
(−20)
C5000-4-D400-Fc60 12.5 1007000717398%
(−2)
5951118%
(+18)
774990%
(−10)
729896%
(−4)
C3000-4-D400-Fy520 7.5 1005800673586%
(−14)
5634103%
(+3)
651989%
(−11)
743978%
(−22)
C5000-4-D400-Fy520 12.5 1005800601696%
(−4)
5210111%
(+11)
657888%
(−22)
617594%
(−6)
C3000-12-D4007.533.392009067101%
(+1)
8011115%
(+15)
9159100%
(0)
1014691%
(−9)
C5000-12-D40012.533.392008363110%
(+10)
7518122%
(+22)
8782105%
(+5)
8409109%
(+9)
C3000-8-D400-Fc507.5 50 8000858393%
(−7)
7216111%
(+11)
833296%
(−4)
943585%
(−15)
C5000-8-D400-Fc5012.55079007808101%
(+1)
6734117%
(+17)
824496%
(−4)
7831101%
(+1)
C3000-8-D400-Fy4207.5 50 7400810591%
(−9)
7022105%
(+5)
803992%
(−8)
903182%
(−18)
C5000-8-D400-Fy42012.55074007383100%
(0)
6544113%
(+13)
789894%
(−6)
748399%
(−1)
C3000-8-D400- Fc607.5 50 8700958691%
(−9)
7957109%
(+9)
920295%
(−5)
1050883%
(−17)
C5000-8-D400-Fc6012.5508600865799%
(−1)
7391116%
(+16)
926093%
(−7)
868799%
(−1)
C3000-8-D400-Fy5207.5 50 7500898683%
(−17)
793095%
(−5)
896384%
(−16)
1014274%
(−26)
C5000-8-D400- Fy52012.5507500809793%
(−7)
7314103%
(+3)
906283%
(−17)
832290%
(−10)
C3000-4-D200155019001635116%
(+16)
1448131%
(+31)
191499%
(−1)
1656115
(+15)
C4000-4-D200205019001404135%
(+35)
1271149%
(+49)
238580%
(−20)
212389%
(−11)
C5000-4-D200255019001155165%
(+65)
1044182%
(+82)
320659%
(−41)
1448131%
(+31)
C3000-4-D200-Fc50155022001829120%
(+20)
1601137%
(+37)
2196100%
(0)
1851119
(+19)
C5000-4-D200-Fc50255022001253176%
(+76)
1119196%
(+96)
370659%
(−41)
1531144%
(+44)
C3000-4-D200-Fy420155019001731110%
(+10)
1554122%
(+22)
212389%
(−11)
1778107%
(+7)
C5000-4-D200-Fy420255019001192159%
(+59)
1079176%
(+76)
382750%
(−50)
1448131%
(+31)
C3000-4-D200-Fc60155023002018114%
(+14)
1751131%
(+31)
248193%
(−7)
2043113%
(+13)
C5000-4-D200-Fc60255023001342171%
(+71)
1185194%
(+94)
421055%
(−45)
1600144%
(+44)
C3000-4-D200-Fy520155019001885101%
(+1)
1722110%
(+10)
251076%
(−24)
197196%
(−4)
C5000-4-D200-Fy520255019001243153%
(+53)
1106172%
(+72)
503239%
(−61)
1448131%
(+31)
C3000-8-D200-Fc50152529002493116
(+16)
2272128%
(+28)
300796%
(−4)
2519115%
(+15)
C5000-8-D200-Fc50252529001792162%
(+62)
1615180%
(+80)
545353%
(−47)
2274126%
(+26)
C3000-8-D200-Fy420152528002504113%
(+13)
2339120%
(+20)
315885%
(−15)
2581108%
(+8)
C5000-8-D200-Fy420252527001774152%
(+52)
1606168%
(+68)
618744%
(−56)
2205122%
(+22)
C3000-8-D200-Fc60152530002675112
(+12)
2411124%
(+24)
327792%
(+8)
2686112%
(+12)
C5000-8-D200-Fc60252530001887159
(+59)
1678179%
(+79)
597650%
(−50)
2330129%
(+29)
C3000-8-D200-Fy520152528002813100%
(0)
2664105%
(+5)
395271%
(−29)
295695%
(−5)
C5000-8-D200-Fy520252528001888148%
(+48)
1652169%
(+69)
868932%
(−68)
2205127%
(+27)
Range (−17) to (+76) %(−5) to (+96) %(−68) to (+24) %(−26) to (+45) %
Average 114.7%129.3%86.1%103.26%
Publisher’s Note: MDPI stays neutral with regard to jurisdictional claims in published maps and institutional affiliations.

