Article

Environmental Taxation Assessment on Clean Technologies Reducing Carbon Emissions Cost-Effectively

1
Department of Business and Tourism Management, Izmail State University of Humanities, 68600 Izmail, Ukraine
2
Department of Finance and Banking, Pryazovskyi State Technical University, 49005 Dnipro, Ukraine
3
Sumy Regional Institute of Postgraduate Pedagogical Education, 40000 Sumy, Ukraine
4
Mineral and Energy Economy Research Institute, Polish Academy of Sciences, 31-261 Cracow, Poland
5
Department of Public Administration, Interregional Academy of Personnel Management, 03039 Kyiv, Ukraine
6
Department of Finance, Banking and Insurance, Khmelnytskyi National University, 29016 Khmelnytskyi, Ukraine
*
Author to whom correspondence should be addressed.
Sustainability 2022, 14(21), 14044; https://doi.org/10.3390/su142114044
Submission received: 10 September 2022 / Revised: 24 October 2022 / Accepted: 25 October 2022 / Published: 28 October 2022
(This article belongs to the Special Issue New Trends in Sustainable Supply Chain and Logistics Management)

Abstract

:
Anthropogenic emissions increase the concentration of greenhouse gases, including carbon dioxide, which necessitates the promotion of environmental protection as one of the most urgent tasks of European environmental policy. The reduction of greenhouse gas emissions and the development of clean technologies in production also depends on the impact of environmental taxation; in this regard, a methodology for analyzing its impact and assessment on the development of eco-friendly technologies is proposed. An analysis of environmental tax revenues to the budgets of the EU countries revealed the insufficiency of environmental revenues to cover the costs of environmental protection from the damage caused by greenhouse gas emissions, which requires the transformation of the system of fiscal mechanisms. The total receipts of all environmental taxes in the EU budget for the period 2000–2020 increased by 53%, and the receipts from taxes on greenhouse gas emissions into the atmosphere increased by 71% in the EU budget, with a tax rate increase of 1.5-fold over this period. The application of the proposed methodology made it possible to determine, on the basis of the correlation coefficient, a high connection strength of +0.971 for the period 2000–2020 between the receipts of the environmental tax for greenhouse gas emissions into the atmosphere and the total values of all environmental taxes, as well as a fairly strong feedback of +0.913 from the receipts of the environmental tax to the EU budget with gross domestic product. Therefore, it is proposed to use differentiated environmental tax rates for different stages of the development of clean technologies.

1. Introduction

The deterioration of the quality of the environment poses a serious threat to the sustainable development of the economy and leads to serious economic consequences: poverty, inequality, and food shortages [1]. Environmental taxation has been a key element of European environmental policy over the past few decades. Environmental taxation in 2020 accounted for approximately 2.5% of gross domestic product (GDP) and 6% of total taxes in the European Union (EU). Environmental taxes should increase the amount of climate finance by 2030 by approximately 6–13-fold [2]. Western European states have oriented their economies towards “greening” through the intensive use of tax instruments (environmental taxation reforms).
At present, the mobilization of funds needed to finance green economic growth requires the reorganization of major parts of the financial system and the tax system. Green projects promote green technologies, reduce pollution, improve resource efficiency, and reduce greenhouse gas emissions. Enterprises that produce goods and provide services, including ferrous metallurgy enterprises, are actively involved in the development and implementation of environmental projects [3,4,5]. There are theoretical and empirical studies that state that environmental taxation contributes to a significant development of the processes of greening and decarbonization [6,7,8].
The possibility of further accumulation of carbon dioxide in the atmosphere leads to the risk of irreversible climate consequences, in connection with which the governments of many countries are taking steps to stimulate and attract “green” financial instruments to support economic and environmental transformation. Climate change indicates that greening has inevitably become the main direction of taxation, investment, financing of the economy, and the development of financial systems. One of the important consequences of the greening and eco-modernization of the economies of countries is the creation of new jobs, enterprises and industries, an increase in employment and the reduction of poverty. Ecologization of the economy means environmentally friendly and sustainable growth, as well as the sustainable use of natural resources [3]. The purpose of the article is to develop a methodology for analyzing the impact of environmental taxation on the development of clean technologies that can cost-effectively reduce carbon emissions. The second section is devoted to a theoretical analysis of studies on the impact of environmental taxation on the development of clean technologies. The third section includes an empirical analysis of data on environmental revenues in the budget revenues of the countries of the European Union. The statistical data used in the study and econometric processing methods are described in detail. The following sections provide discussions, conclusions, and suggestions. As a result of the study, a methodology for analyzing the impact of environmental taxation on the development of clean technologies is proposed.

2. Literature Review and Theoretical Analysis of Research

2.1. The Role of Environmental Taxation in the Development of Clean Technologies

The effectiveness of the system of financial and fiscal mechanisms for the development of clean technologies is increasingly dependent on environmental taxation. Environmental taxes are not intended to generate income, which is the main reason for imposing any tax, but to change the behavior of economic agents [4]. Earlier studies [5] investigated the impact of taxation on changes in greenhouse gas emissions into the atmosphere. Optimal carbon reduction has been observed in the presence of technological change stimulated by environmental taxation. Each option was considered both from the point of view of economic efficiency and from the point of view of the “benefit–cost” policy. In the study [6], the regulator applies environmental taxes and obtains the best optimum [7,8]. In [9], a model for studying the interaction between environmental taxes on carbon emissions and innovative externalities is presented. The analysis shows that the timing of an optimal emission reduction policy depends on the set of available policy instruments, including environmental taxation. Where climate-focused targeted research and development tools are available, policymakers should use them to stimulate early innovation. When these tools are not available, policies should guide innovation by creating demand for technologies that reduce emissions. That is, taxes on emissions of greenhouse gases should be high compared with current levels when the emission reduction industry is booming. Goulder and Shane [10] demonstrate the complexity of a carbon tax, a “pure” cap-and-trade system, and a “hybrid” option (a cap-and-trade system with a cap and/or lower price).
However, exogenous pricing of emissions (through an environmental carbon tax or a hybrid option) has a number of important advantages over pure cap-and-trade. On the basis of various aspects of environmental taxation, the following were studied: trends in energy climate problems, including carbon emissions into the environment [11]; strategic taxation according to Pigue and externalities; trends in pollution of non-renewable resources [12,13,14]; and environmental policy and ensuring a balance between taxation and the growth of resource extraction [15,16,17]. All the above studies consistently use one environmental financial instrument—environmental taxes in the development of clean technologies. However, in order to more effectively achieve carbon reduction, it is necessary to take into account the distorting and distributive effects of local taxes, as well as the problems of tax burden and accounting for the legal aspects of transactions [18].
More recent studies [19] concluded that compared with other regulations to reduce greenhouse gas emissions, carbon taxes are also more effective in curbing pollutant emissions and promoting clean technologies. It is necessary to introduce taxes on carbon emissions in industrialized countries, where the environmental situation has led to the development of diseases, as a result of which, medical tourism has begun to develop [20,21]. The study of new opportunities for the development of environmentally friendly products and the organization of their implementation go beyond the scope of one industry and are considered in the restaurant business based on computer simulation [22,23,24]. The development of clean technologies and their areas of greening and eco-modernization require both a change in environmental taxation rates and additional sources of green financing and guarantees, including subsidies, soft loans, government guarantees, and green bonds. The organization of the use of these financial instruments depends on the territorial authorities, rights, and obligations, which are currently significantly expanded in connection with the reform of territorial public administration [25,26,27,28,29,30,31,32,33,34]. A significant role of environmental taxation in the creation of clean technologies in both developed and developing countries has been revealed. Effective state management of the development of clean technologies at the local level should be carried out with the help of state incentives, including through preferential taxation and attraction of other financial instruments. However, the issues of differentiation of environmental taxation in relation to developed and developing countries, in relation to the improvement of clean technologies, or, in general, complete replacement with completely innovative technologies (development of hydrogen-based metallurgy) have not been sufficiently studied. There is no single methodology for identifying existing and innovative environmental financial instruments and sharing them with differentiated environmental taxation.

2.2. Environmental Taxes in Green Finance for Clean Technology Development

The concept of “green finance” does not have a clear definition and is similar to the definition of “finance”: it is an economic category that characterizes the processes of formation, distribution, and redistribution of funds by the state, regions, business entities, legal entities, and individuals in the course of generating their income, expenses, and savings aimed at developing clean technologies. The current market policy is based on a service-oriented approach to green finance, which is more efficient due to its dual function of directing green investment and serving green industries. In the transition to carbon neutrality, a green finance approach can ensure that capital and environmental resources are optimally allocated, thereby contributing to carbon reduction and green transformation. Existing environmental taxes do not allow for the receipt of amounts necessary to reimburse government spending on environmental protection for damage caused by economic entities. Environmental taxes are not always an effective tool for changing the behavior of taxpayers.
The insignificance of the tax burden does not motivate the “pollutant” to carry out technical re-equipment and develop clean technologies. An increase in the tax burden on environmental payments will have a negative impact on the investment and tax climate. A possible solution to the problem is the development of a system of tax credits and deductions that can be provided to companies investing in green technologies. This approach is popular and promising for reforming the tax system. Another effective mechanism that can be used to solve the problem of sustainable environmental management is the creation of joint infrastructures for environmental carried out by organizations that pollute the environment.
An alternative to the environmental tax is Extended Producer Responsibility (ERP), which will allow the establishment of public–private partnerships to reduce the burden on the environment. The study [35] shows the use of several incentive instruments, including taxation, as a green financing tool in obtaining clean technologies. Rate changes are also proposed as environmental taxation for the influx of foreign aid to ensure the development of clean technologies. In developing countries [35,36], it is proposed to encourage cap-and-trade through programs to reduce tax rates and increase competition in financial markets through the privatization of domestic and international liberalization. In developed countries, it is recommended to introduce high taxes and fines for activities that damage the quality of the environment.
These actions contribute to the development of clean technologies in countries with different levels of market economy development. The study uses the Auto-Regressive Distribution Lag (ARDL) methodology to analyze the impact of green finance instruments on the adoption of clean technologies. The study [37] presents three types of environmental taxes. A permanent tax does not contribute to sustainable product design, and a “zero tax” is even better than a “permanent tax”. In contrast, a “linear tax” may contribute to sustainable product design and may be considered better. A “linear tax” can help balance design levels, stakeholder benefits, and welfare efficiency [38].
The quality of the environment is worsened by emissions from production and improved by spending on pollution control through the introduction of clean technologies. A proportional tax is levied on capital rental income to finance pollution abatement costs; household savings are invested.
Increasing the tax increases fixed and working capital and contributes to the development of clean technologies, national income, and environmental quality and reduces unemployment in the long run. The analysis of available documents in scientometric databases allowed us to draw the following conclusion: Taxation should be applied to “green” financial instruments aimed at managing the development and implementation of clean technologies.
However, different rates of environmental taxation have different impacts on the development of clean technologies in countries with different levels of market development. Environmental taxation rates also depend on the stage of development of clean technologies.
According to the authors, clean technologies can have the following characteristics: continuous improvement to a certain extent; and their complete replacement with innovative ones that have no analogues. The nature of the change in environmental tax rates in these options is different. Environmental taxes are among the green financial instruments that need to be used to develop clean technologies.

2.3. Encouraging Green Innovation through Taxation

The process of development and implementation of green innovations depends on the development of the system of environmental taxation [39,40,41,42]. “Green” innovations and environmental taxes significantly reduce carbon emissions, while GDP causes an increase in CO2 emissions in the G7 countries [43].
Currently, in order to achieve sustainable development, many developing countries are worried about increasing the level of carbon in the atmosphere. Tax incentives are used in conjunction with subsidies for the construction of cleaner production facilities in developing countries. Thus, multinational firms headquartered in developed countries are motivated to build cleaner production in developing countries. This helps to change the infrastructure of developing countries and reduce emissions.
Tax incentives make it possible to compensate for losses from the decentralization of the supply chain [44]. Bootstrap ARDL estimates show that environmental taxes, tax planning, and green investment reduce environmental emissions. China can effectively improve the quality of its environment through efficient management of natural resources, green investment, and carbon taxes [45].
The need to reuse capital in the development of clean technologies is associated with the impact of taxes depending on the distribution of climate damage, tax payments, and reuse of tax revenues [46,47].
Carbon taxes and carbon markets are important market mechanisms for reducing carbon emissions. Future research will focus on the carbon market, carbon-negative technologies, the circular economy, and clean energy [48,49]. Total reliance on carbon taxes in China means imposing a tax rate that is four times the cap. When using green investments, the carbon tax rate is halved.
Green finance will ensure the optimal allocation of capital and environmental resources. This will reduce carbon emissions and move the country toward a green transformation [50].
Coordinated implementation of environmental protection policy, carbon tax, and sectoral-differentiated environmental tax rates in China have balanced economic development and environmental management. This helped to achieve the following goals: obtaining an optimal taxation scheme; reducing air pollution and greenhouse gas emissions; economic growth; and ensuring long-term economic and environmental development through green innovations [51].
An effective Nordic policy is energy-safe, fair, and environmentally sustainable. The impact of environmental taxation in support of the double dividend hypothesis was studied in Denmark, Norway, Finland, and Sweden [52].
An analysis of the effectiveness of environmental taxation in promoting the introduction of cleaner production technologies showed that a low level of environmental taxation is ineffective in stimulating the introduction of “green” technologies [53]. As the level of taxation increases, so does the associated impact on investments in green projects and technologies. Low levels of environmental taxation can be effective when combined with public funding.
Tax incentives and infrastructure development promote green industrialization, the adoption of low-carbon technologies, the promotion of sustainable forms of urbanization and city planning, and the promotion of both investment and the deployment of renewable energy platforms. This helps emerging market countries achieve strong and environmentally sustainable GDP growth in the long term [54,55].
A study [56] showed: (1) tax incentives improve economic firms’ performance while improving their environmental performance; (2) tax incentives have a stronger impact on the economic and environmental performance of private firms in the central region of China and firms with high production capacities; and (3) tax incentives help improve the economic and environmental performance of companies by increasing their technological innovation and production efficiency. Further analysis shows that tax incentives have a stimulating effect on technological innovation.
To finance the development of clean technologies, it is necessary to share environmental taxes, equity, debt, and debt capital, which should be jointly managed using financial management mechanisms. This requires monitoring of environmental financial instruments for the development of clean technologies.

3. Methodology of Analysis and Environmental Tax Assessment of Clean Technologies That Reduce Carbon Emissions at the Lowest Cost

3.1. An Econometric Data Analysis

An empirical analysis of the impact of environmental taxation on the development of clean technologies was carried out using predicative methods for data processing—environmental revenues to the budget of the EU and to the budgets of countries.
The methodology for calculating environmental taxes on the basis of determining the actual emissions of greenhouse gases (in particular, CO2) into the atmosphere shows that there is a need to take into account the effect of reducing greenhouse gas (CO2) emissions when calculating the effect of the transition to innovative technologies for the production of goods and services. In this regard, an empirical analysis of environmental taxes on the EU budget is necessary, as are ways to improve the efficiency of environmental taxation and the development of technologies for the decarbonization of production based on the following: environmental taxation opportunities aimed at reducing CO2 emissions into the atmosphere; the possibility of increasing the return on capital of economic entities during the decarbonization of technologies exists by attracting various financial instruments (FI); and managing the formed capital using financial management mechanisms (FM).
An increase in environmental tax rates will lead to an increase in tax revenues for the budget and will force the development of greening and eco-modernization projects for the development of clean technologies. However, having reached a certain value of the environmental tax rate, entrepreneurs can concentrate financial resources on the shadow sector of the economy or stop their business activities. In this case, budget revenues will begin to decline, the investment climate will worsen, and the inflow of investments into the country will decrease. In turn, high taxes reduce the tax base and the revenues of local and state budgets. Therefore, raising environmental tax rates can only have a negative impact since carbon taxes must continue to decrease in order to reduce harmful emissions [14,57,58]. In relation to the proof of the aim, it is necessary to analyze Table 1 regarding government revenue from taxes and social contributions (TSC).
The share of environmental taxes to GDP is insignificant—2.24%—and in relation to TSC—5.42%. Corporations are also sources of emissions—47.7% of environmental tax revenue by tax payer (Table 1). As for taxes on pollution/resources, their share is insignificant and amounts to 0.08% of GDP and 0.19% of TSC. This indicates that the mechanism of environmental taxation in the EU requires further transformation. It also suggests that environmental tax revenues may not be sufficient to finance the development of clean technologies.
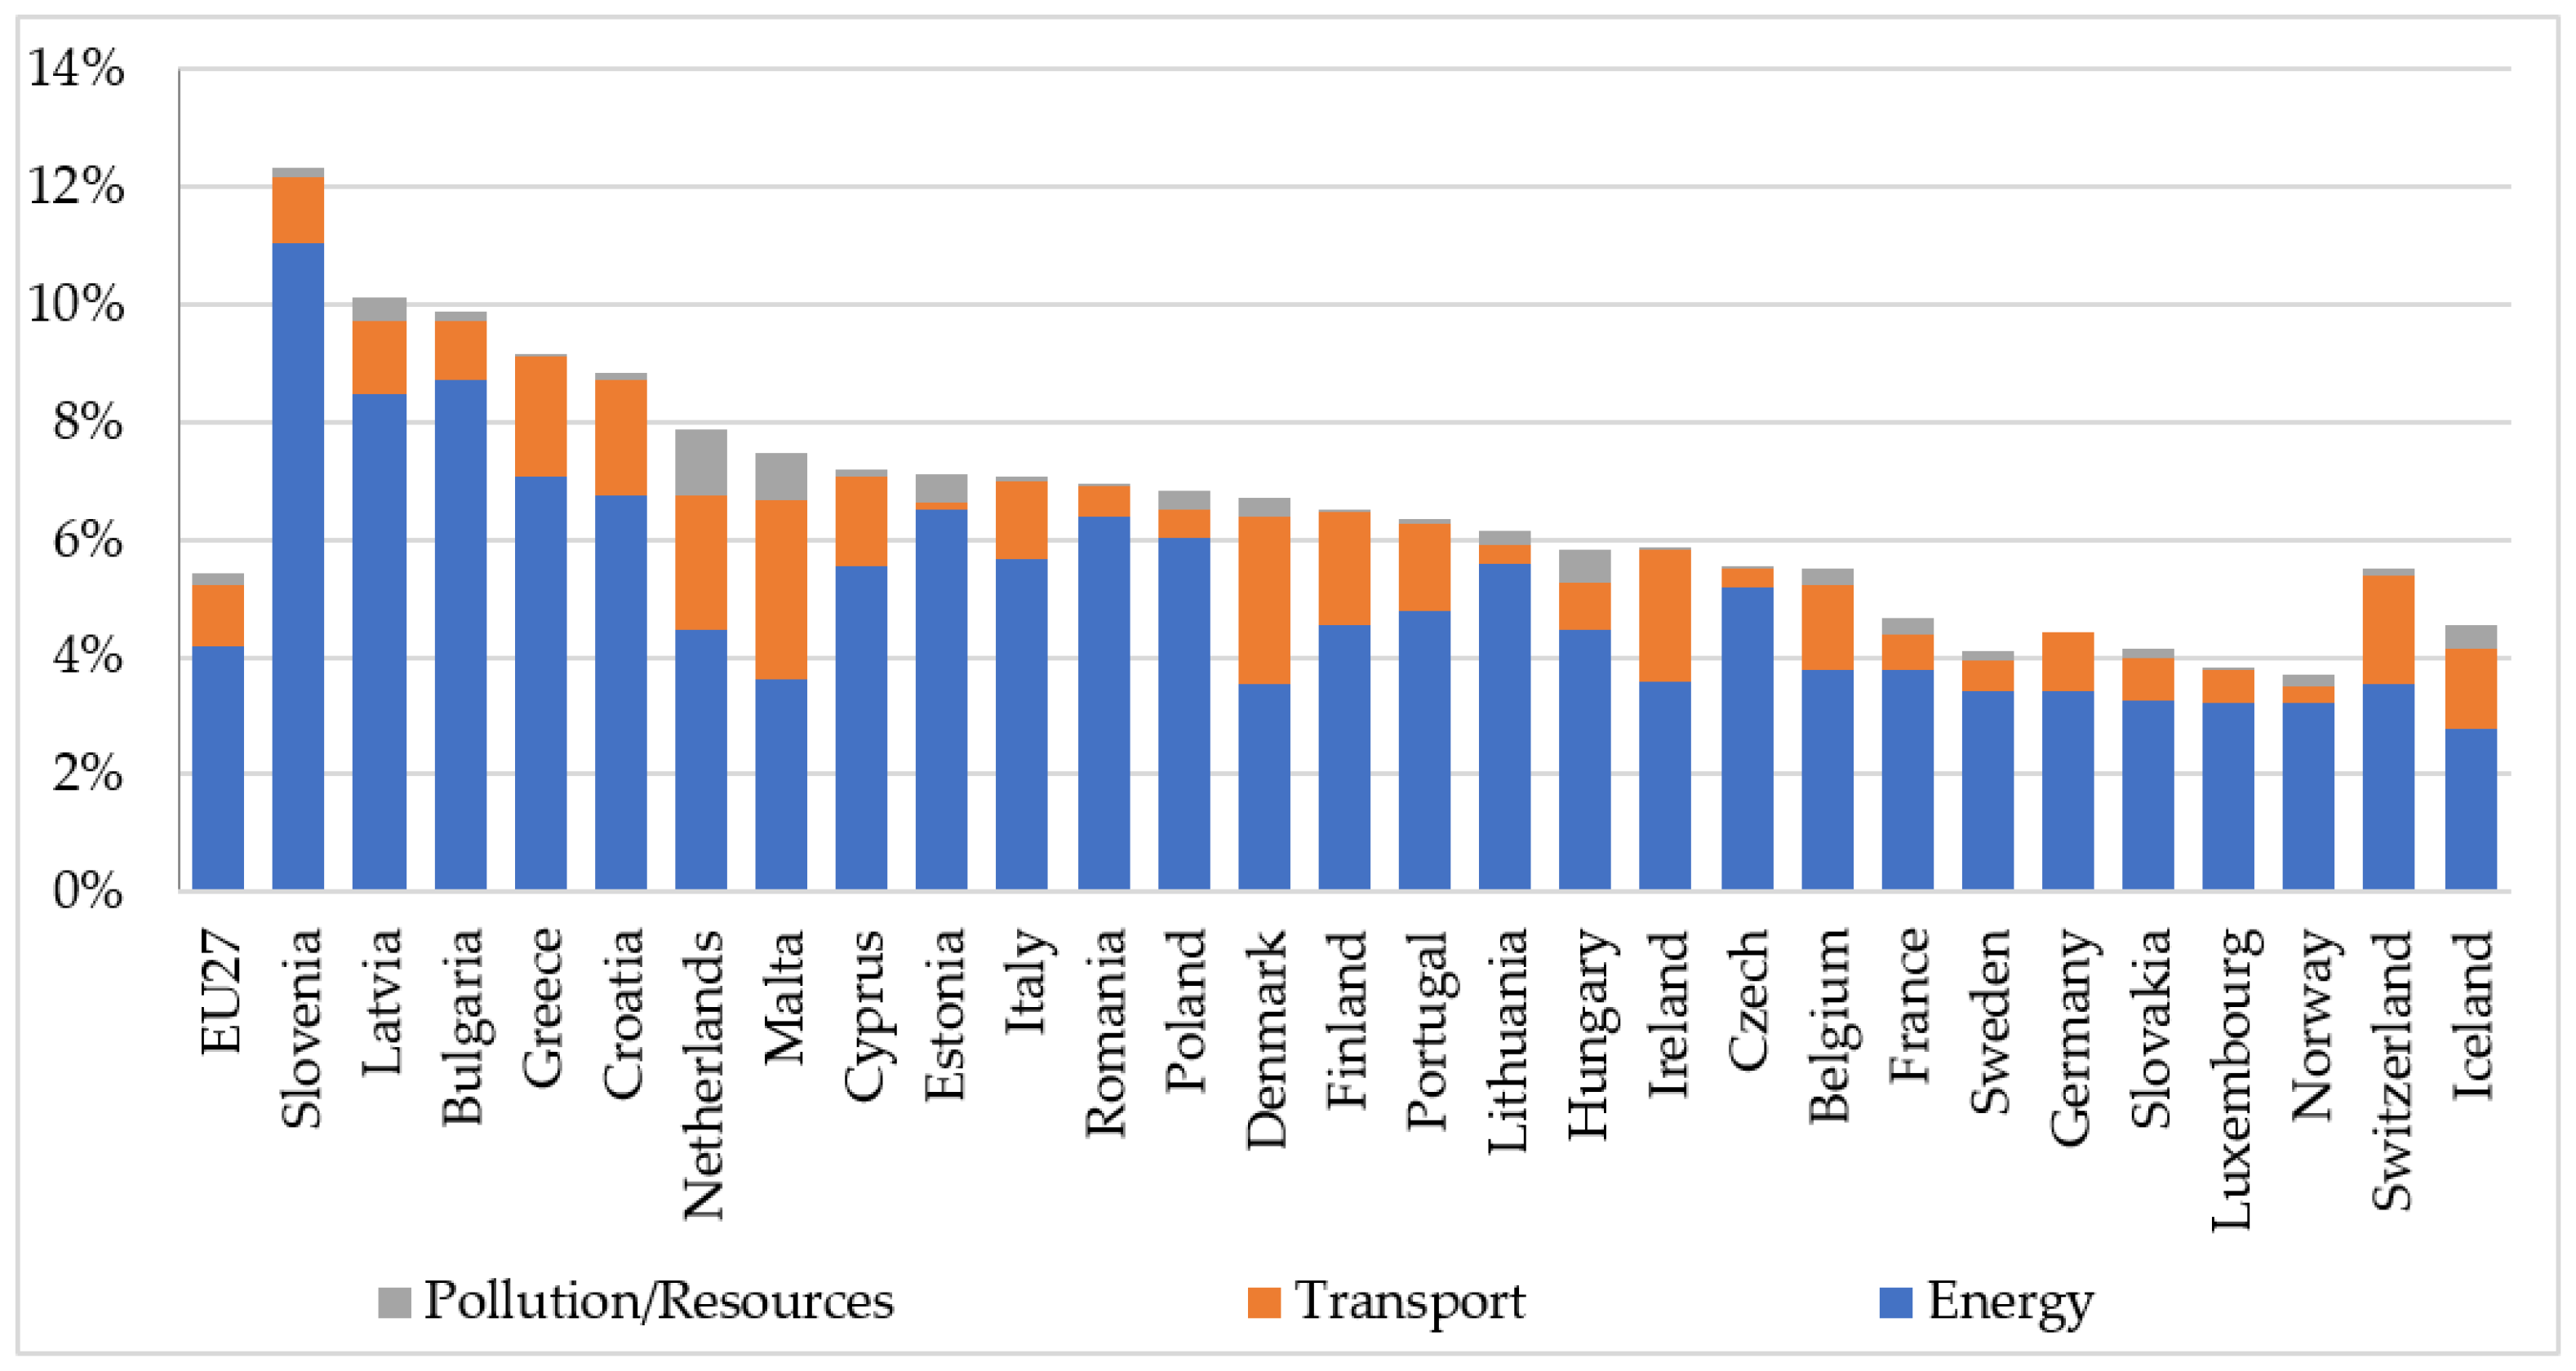
This is the reason for the slow implementation of greening and eco-modernization projects for the production of goods or services. European countries have introduced environmental taxes on greenhouse gases, mainly carbon dioxide, which are currently small but have the greatest anthropogenic impact [60,61,62,63]. The main function of environmental taxes is not to fill the budget but to perform the function of regulation in environmental taxation. The largest share of environmental taxes in the country’s GDP belongs to Slovenia (4.67%). The total share is 12.32%. The share of revenues from greenhouse gas emissions is 0.15% of the country’s GDP (Table 2). Further, in descending order of the countries’ GDP: Latvia (respectively, 3.23%; 10.12%; 0.37%), Bulgaria (3.03%; 9.88%; 0.16%), and Greece (3.77%; 9.11%; 0.01). The smallest share of environmental payments in GDP belongs to Iceland—1.19%. The most significant shares of environmental taxes to TSC were carried out by Germany, France, and Italy to the EU budget (Figure 1). Environmental tax revenues by categories in % of TSC, 2020, are presented in the figures, which show that Slovenia has paid the largest amount of environmental payments to the EU budget.
Ukraine is not listed as a tax payer for environmental pollution in the EU budget for 2020 [31]. The smallest amounts of environmental taxes belong to taxes on greenhouse gas emissions. Despite calls to increase environmental tax rates at the national, European, and global levels, the growth in the amount of environmental taxes collected has been slow [31]. Receipts from the environmental tax by category of environmental taxes in total social costs % of, 2020, are shown in Figure 2.
The largest total value of environmental taxes as % of TSC belongs to Slovenia, followed by Latvia, Bulgaria, and Greece (Figure 2). Total environmental tax as a percentage of GDP, 2020, are presented in Figure 3.
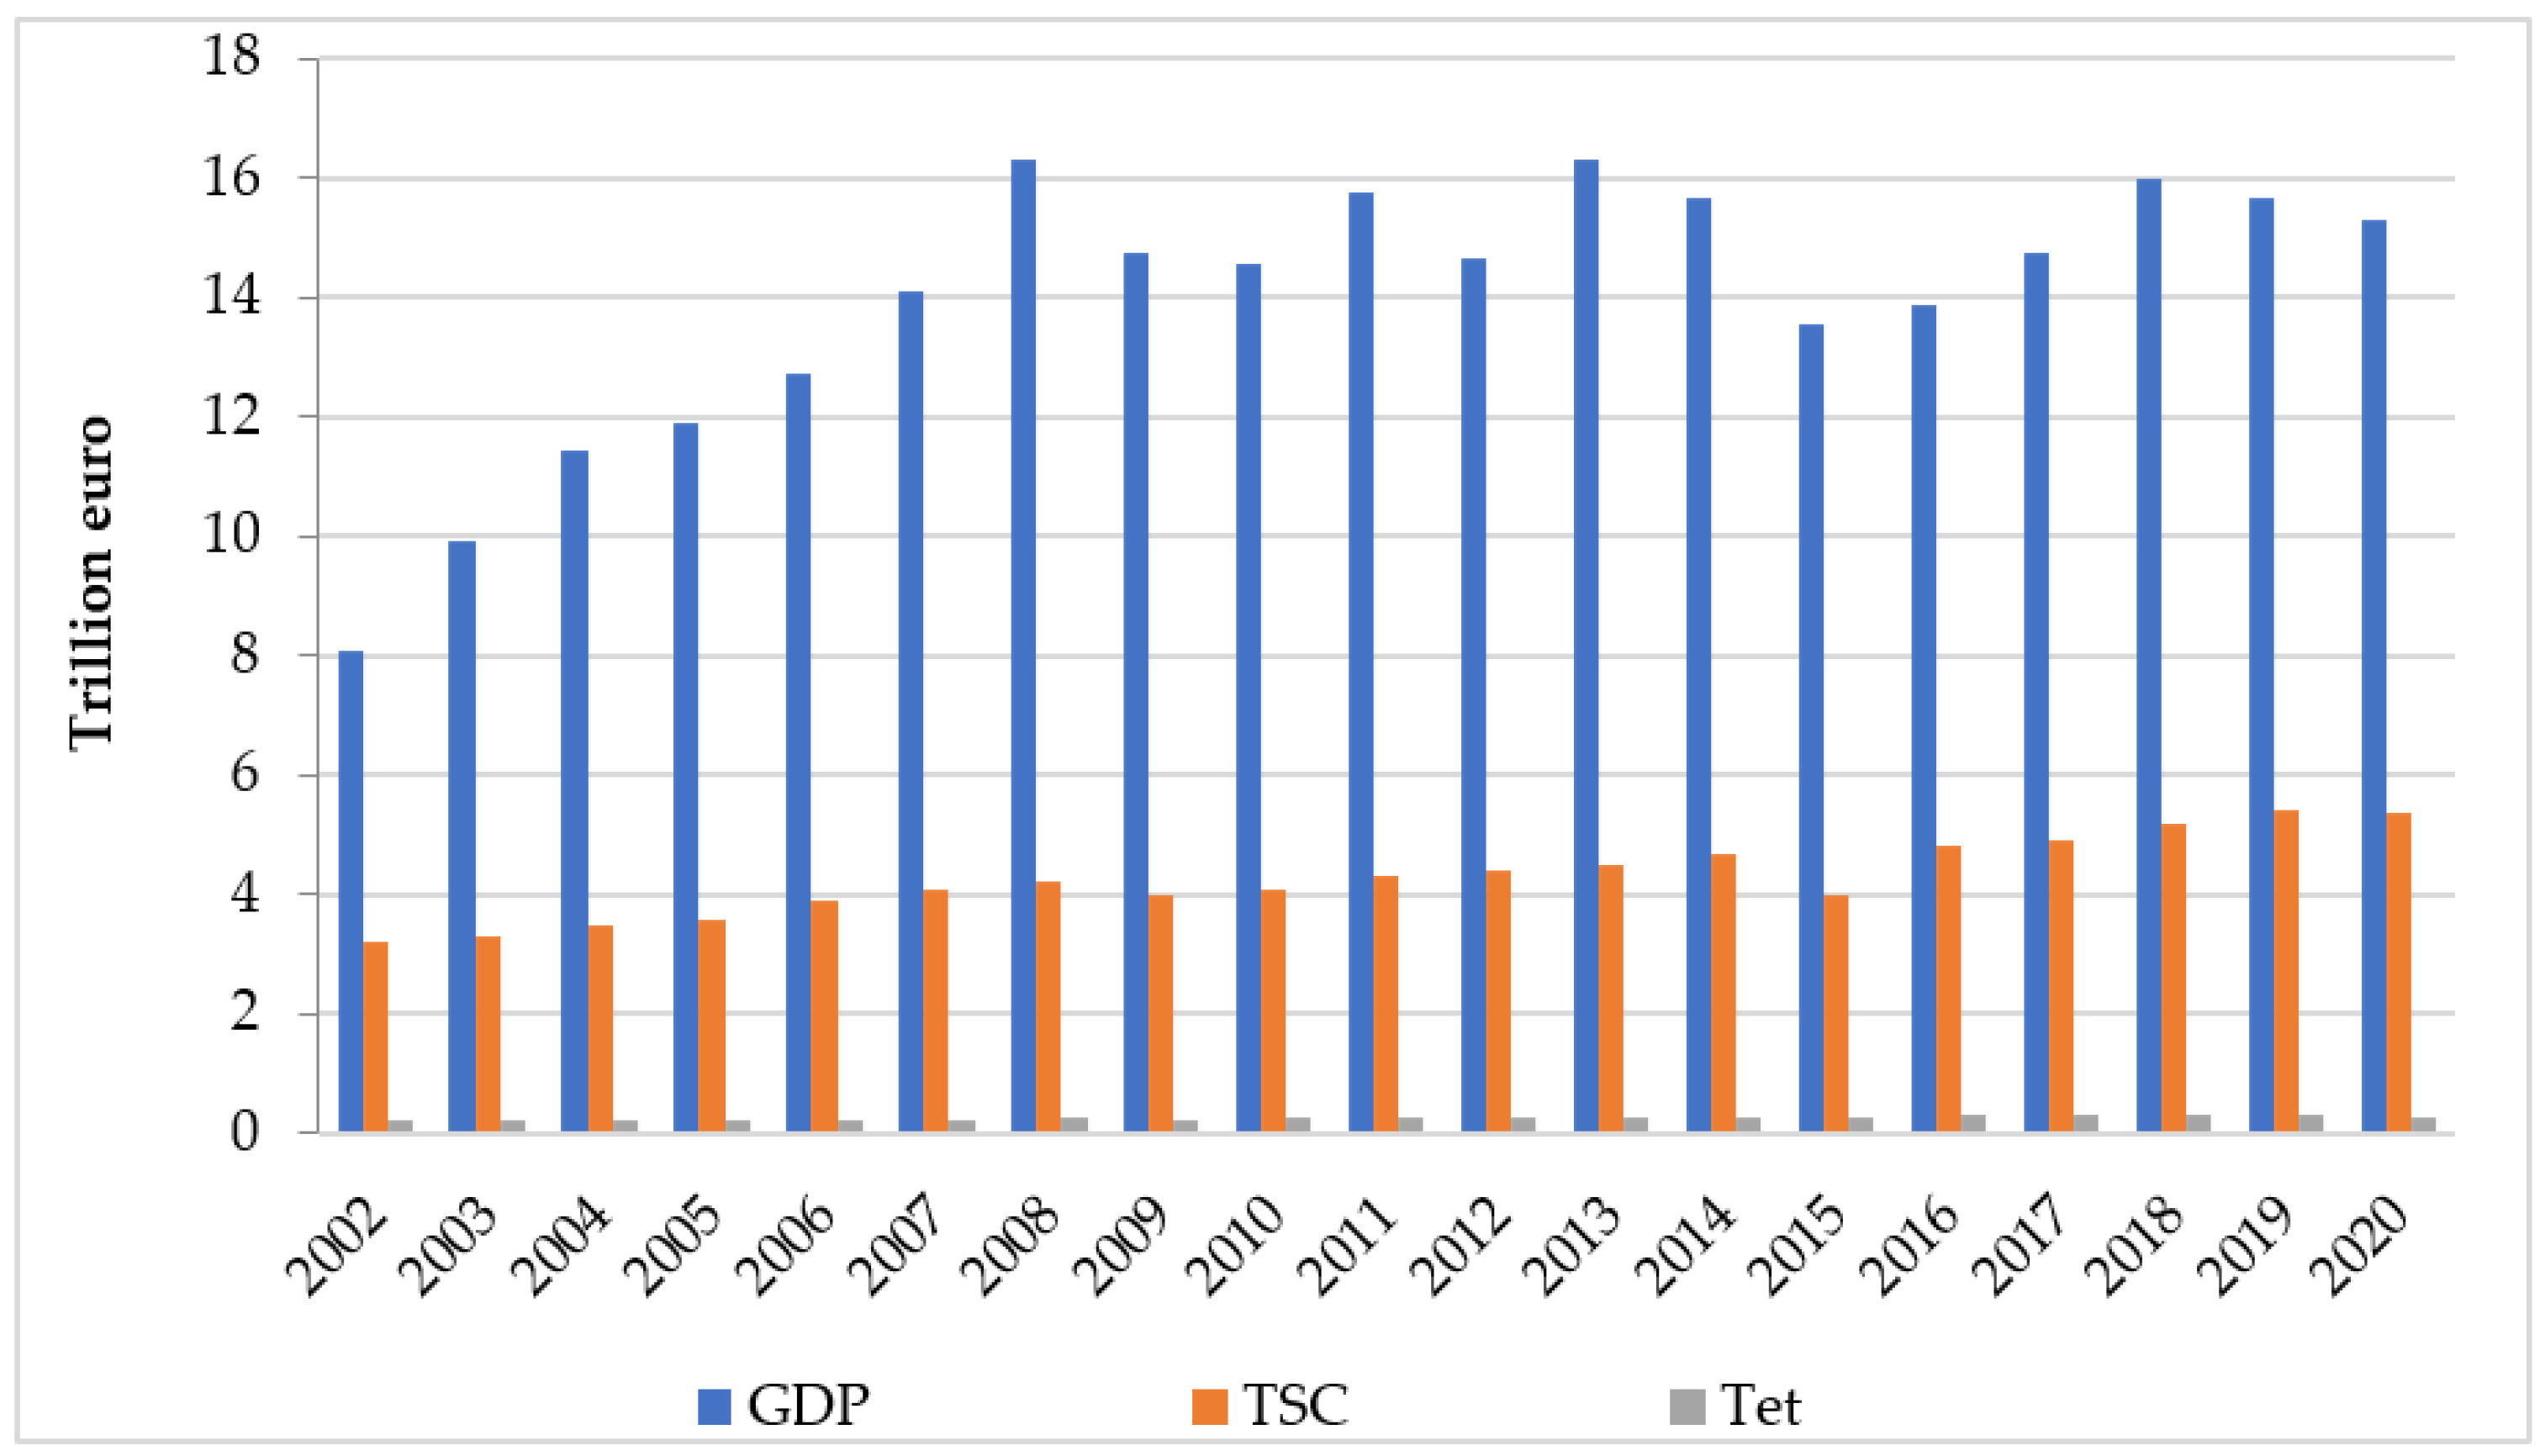
Total environmental tax (TET) as a percentage of GDP shows that Slovenia, Greece, and Croatia have the highest total value of TET as a percentage of GDP (Figure 3). Table 2 depicts the dynamics of changes in environmental tax revenues to the EU budget GDP, TSC, and total environmental taxes (TET) from 2002 to 2019.
Figure 4 demonstrates the negligibility of environmental tax revenues in the EU budget compared with indicators such as GDP and TSC. This implicitly informs that the mechanism of environmental taxation requires transformation (change of elements of taxes) in combination with other financial instruments, which should be managed using financial management mechanisms [14,57].
Insignificant amounts of environmental revenues compared with the amounts of GDP presented in Figure 4 indicate that EU environmental tax revenues (TET) is an insignificant share of GDP. Changes in environmental tax revenue shares as a percentage of TSC and of GDP, compared with 2019 and 2020, are presented in Table 3 and Figure 5. The biggest changes towards the reduction of environmental taxes in relation to TSC occurred in Estonia (−2.37), followed by in Slovenia (−1.45).
The change in the structure of tax revenues is presented in Table 4.
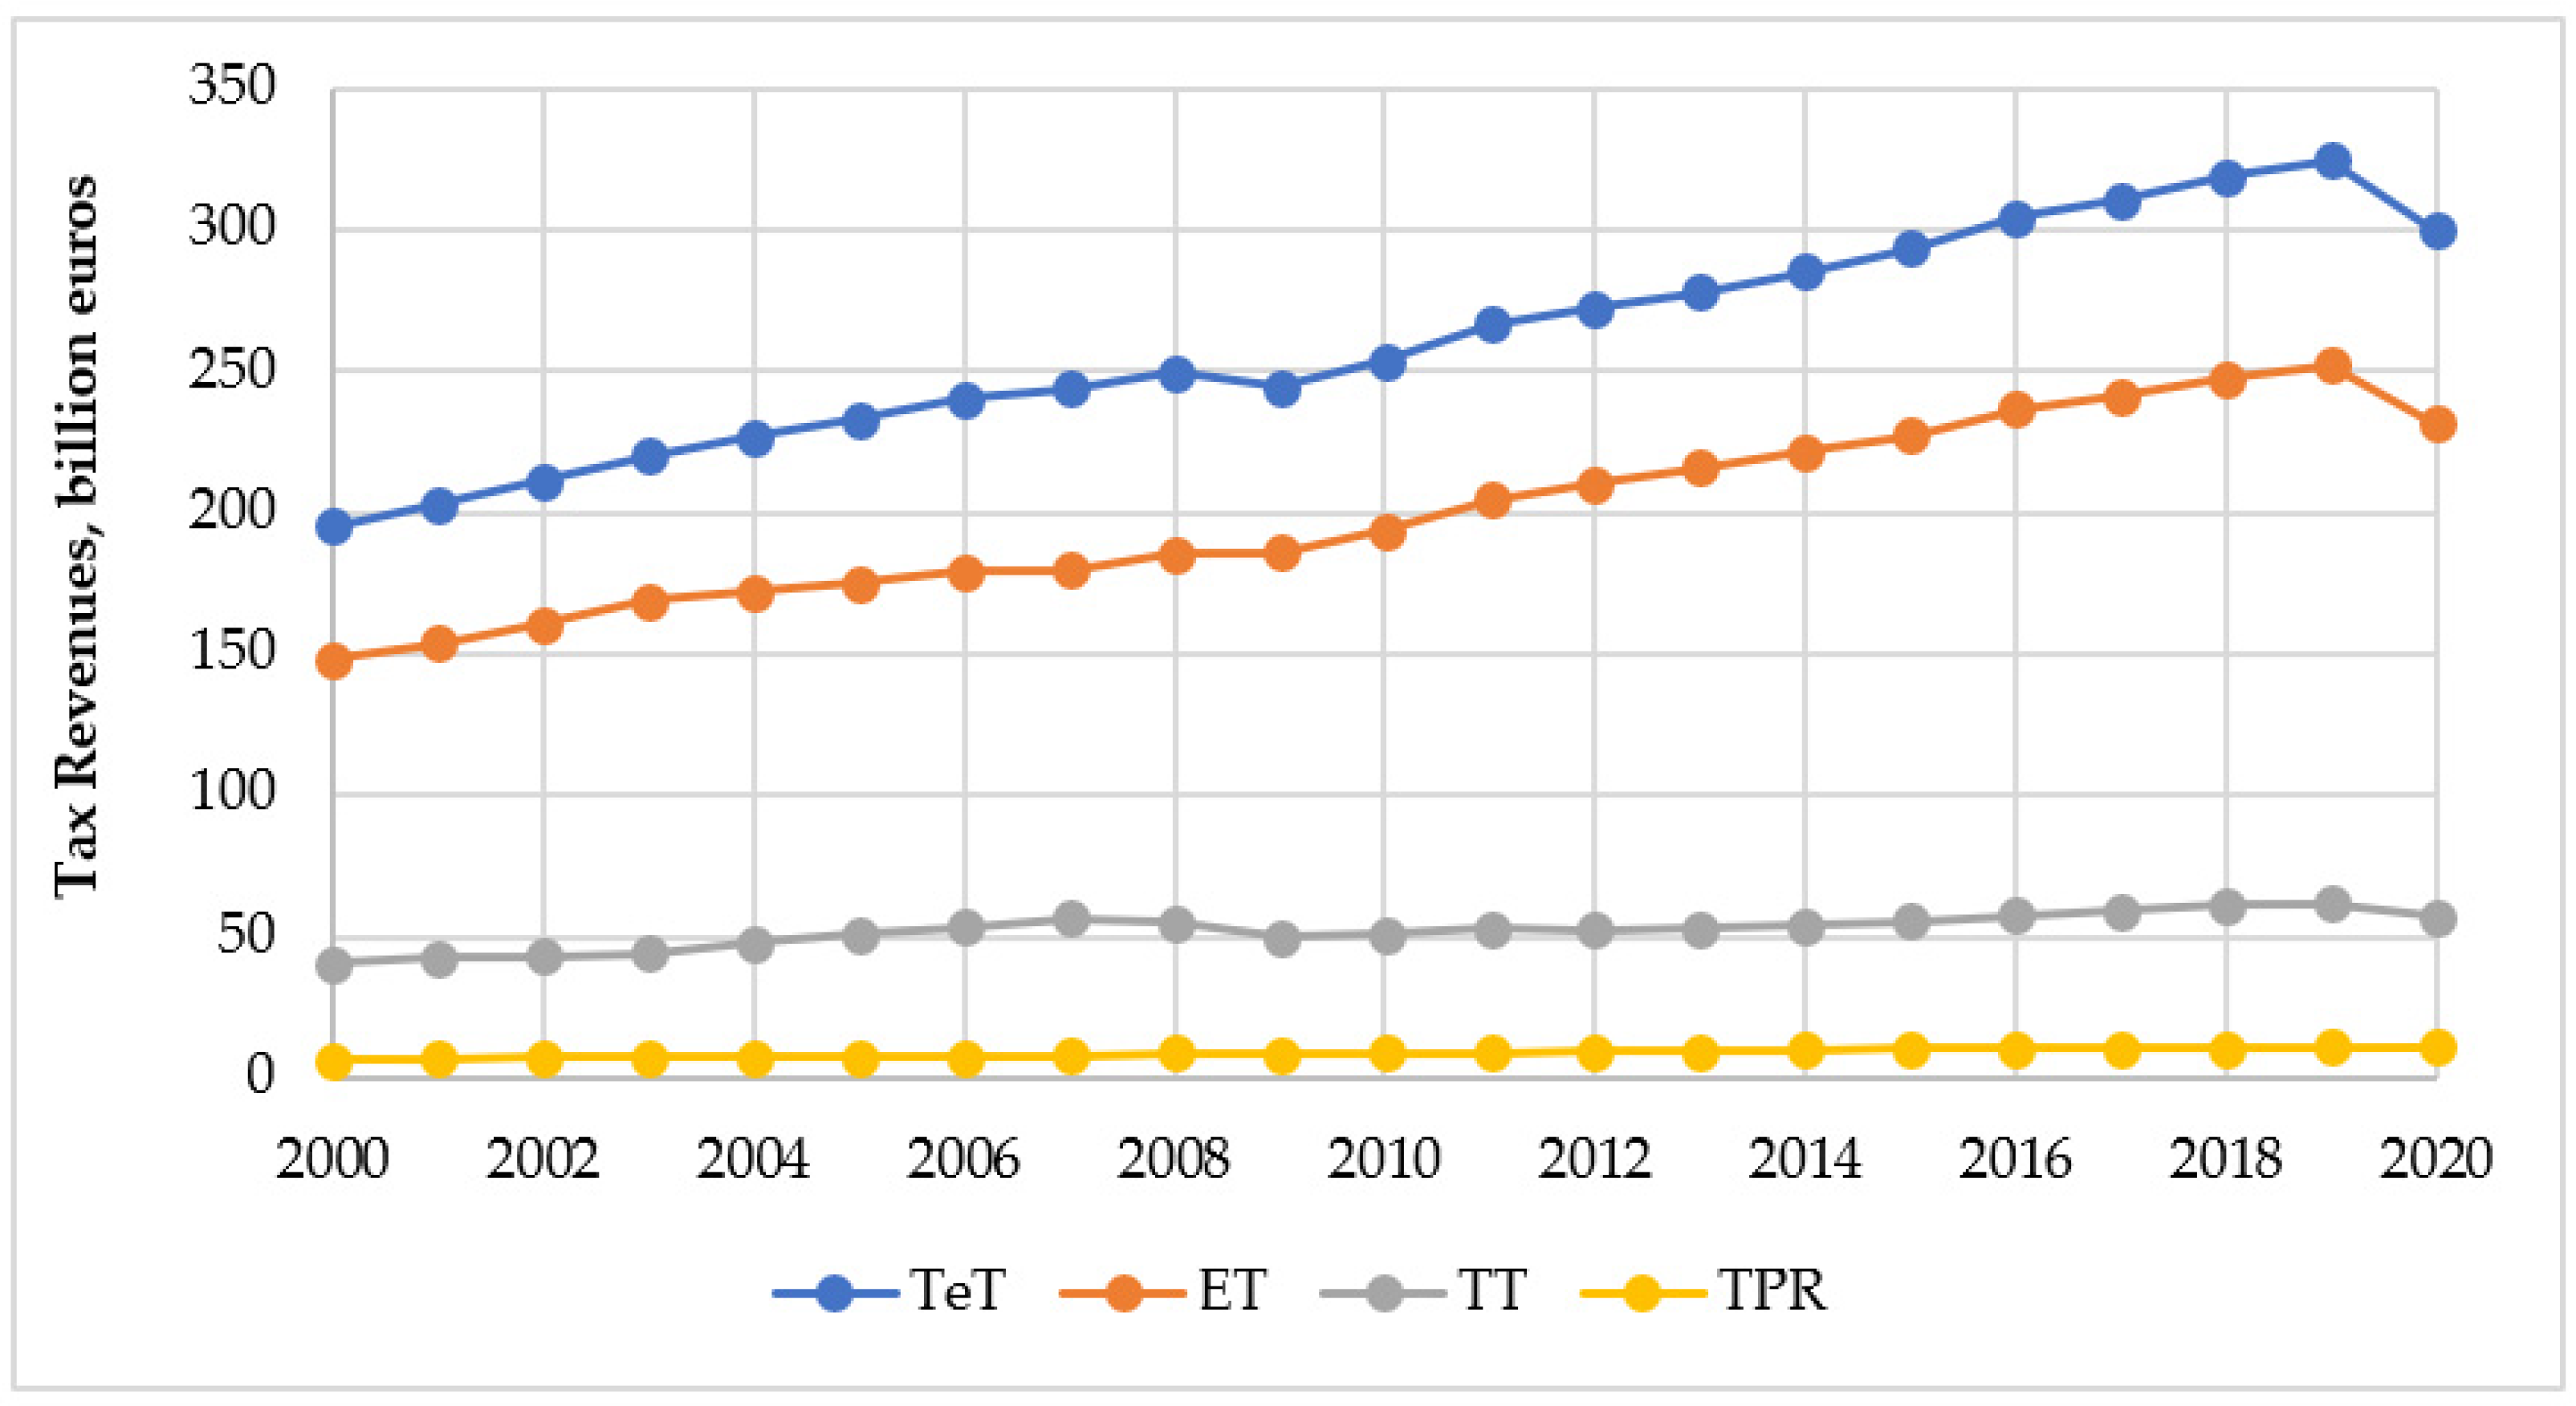
There was a significant increase in the total amount of tax revenues (TET) to the EU budget for the period 2000–2021 (Figure 5). The amounts of receipts of environmental taxes (ET, TT, and TPR), except for ET, practically did not change. This confirms our assumption that environmental taxes do not perform a fiscal function, their goal is not to fill the budget.
The overall level of all tax revenues for the period from 2000 to 2020 can be described by a linear regression relationship.
Joint-sample Linear Regression Equation { ( x i , y i ) } i = 1 n = { ( N i , T e T i ) } i = 1 n found in the form [64]:
Y = a X + b
where ( a , b ) —solution of a system of equations.
{ a i x i + b n = i y i a i x i 2 + b i x i = i x i y i
Solving the system, we obtain
a = n i x i y i i x i i y i n i x i 2 ( i x i ) 2 = 6.184 ,
coefficient of regression and
b = 1 n ( i y i a i x i ) = 12169.5
Linear regression relationship:
T e T = 6 . 184 N - 12169 . 5 ,
where N is the year.
The value of the coefficient of determination:
R 2 = i ( a x i + b y ¯ ) 2 i ( y i y ¯ ) 2 = 0.967
The linear model describes 96.7% of the change quantities TET.
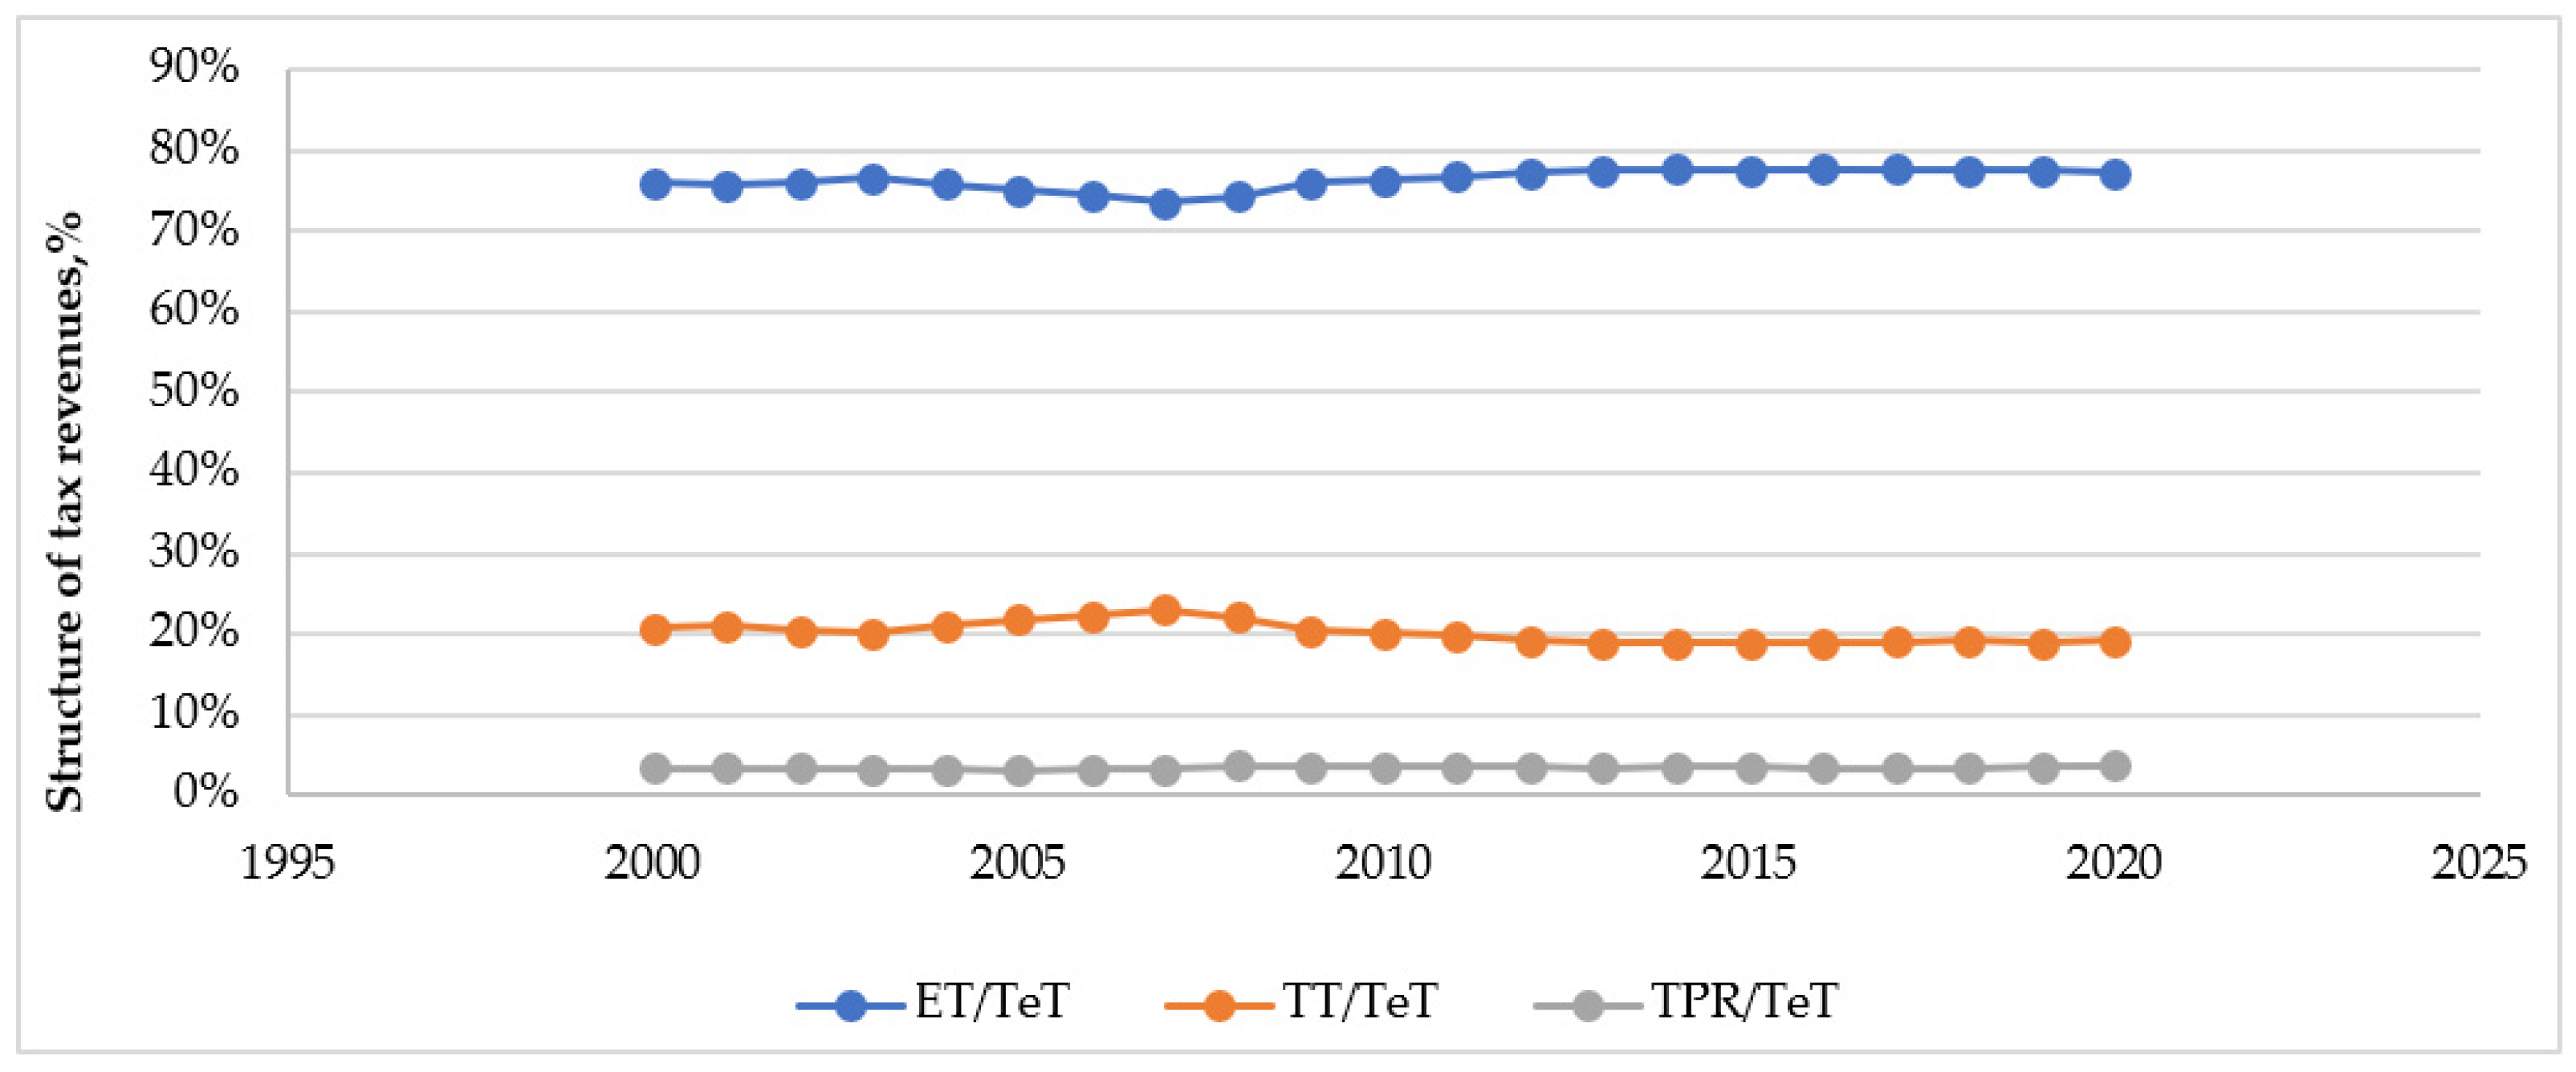
To describe the structure of tax revenues, the values of ET/TET, TT/TET, and TPR/TET, expressed as a percentage, were used (Figure 6). As can be seen, the corresponding values deviate from the average values of 76.4%, 20.2%, and 3.4% by no more than 3%, 3%, and 0.3%, respectively. Energy taxes are the most important in environmental taxes in the EU budget. In the structure of environmental taxes, their share ranges from 73.6 to 77.8%. Therefore, there is a need to change the elements of this tax, such as rates. However, the increase in rates should not exceed a certain amount, at which economic entities “will go into the shadows” or cease to engage in this type of activity. Another option is to develop and implement greening projects aimed at the development of clean technologies [59]. However, here, too, an obstacle arises—the lack of funding for greening projects. Therefore, it is necessary to search, in addition to changing tax rates, for environmental financial instruments, as well as to apply financial management mechanisms to the formed capital. For this purpose, the paper proposes turning to the services of financial outsourcing.
The Pearson Correlation Coefficient (PCC) allows one to calculate a linear correlation between different variables [61,62,63,64]. Pearson’s linear correlation coefficient formula [64]:
r x y = i ( x i x ¯ ) ( y i y ¯ ) i ( x i x ¯ ) 2 i ( y i y ¯ ) 2
where x i —the values of the variable x ; y i —of the variable y ; x ¯ —the arithmetic mean for the variable x ; and y ¯ —arithmetic mean for variable y .
The correlation coefficient is R—Pearson evaluates only the linear relationship of variables. According to the Chaddock scale, the linear relationship between the types of tax receipts and the total values of tax receipts within 0.9 ≥ R ≥ 0.99 is considered very high (Figure 7).
To determine the total contribution of each factor, it is proposed to carry out a factor analysis (Varimax analysis), the results of which are presented in Table 5.
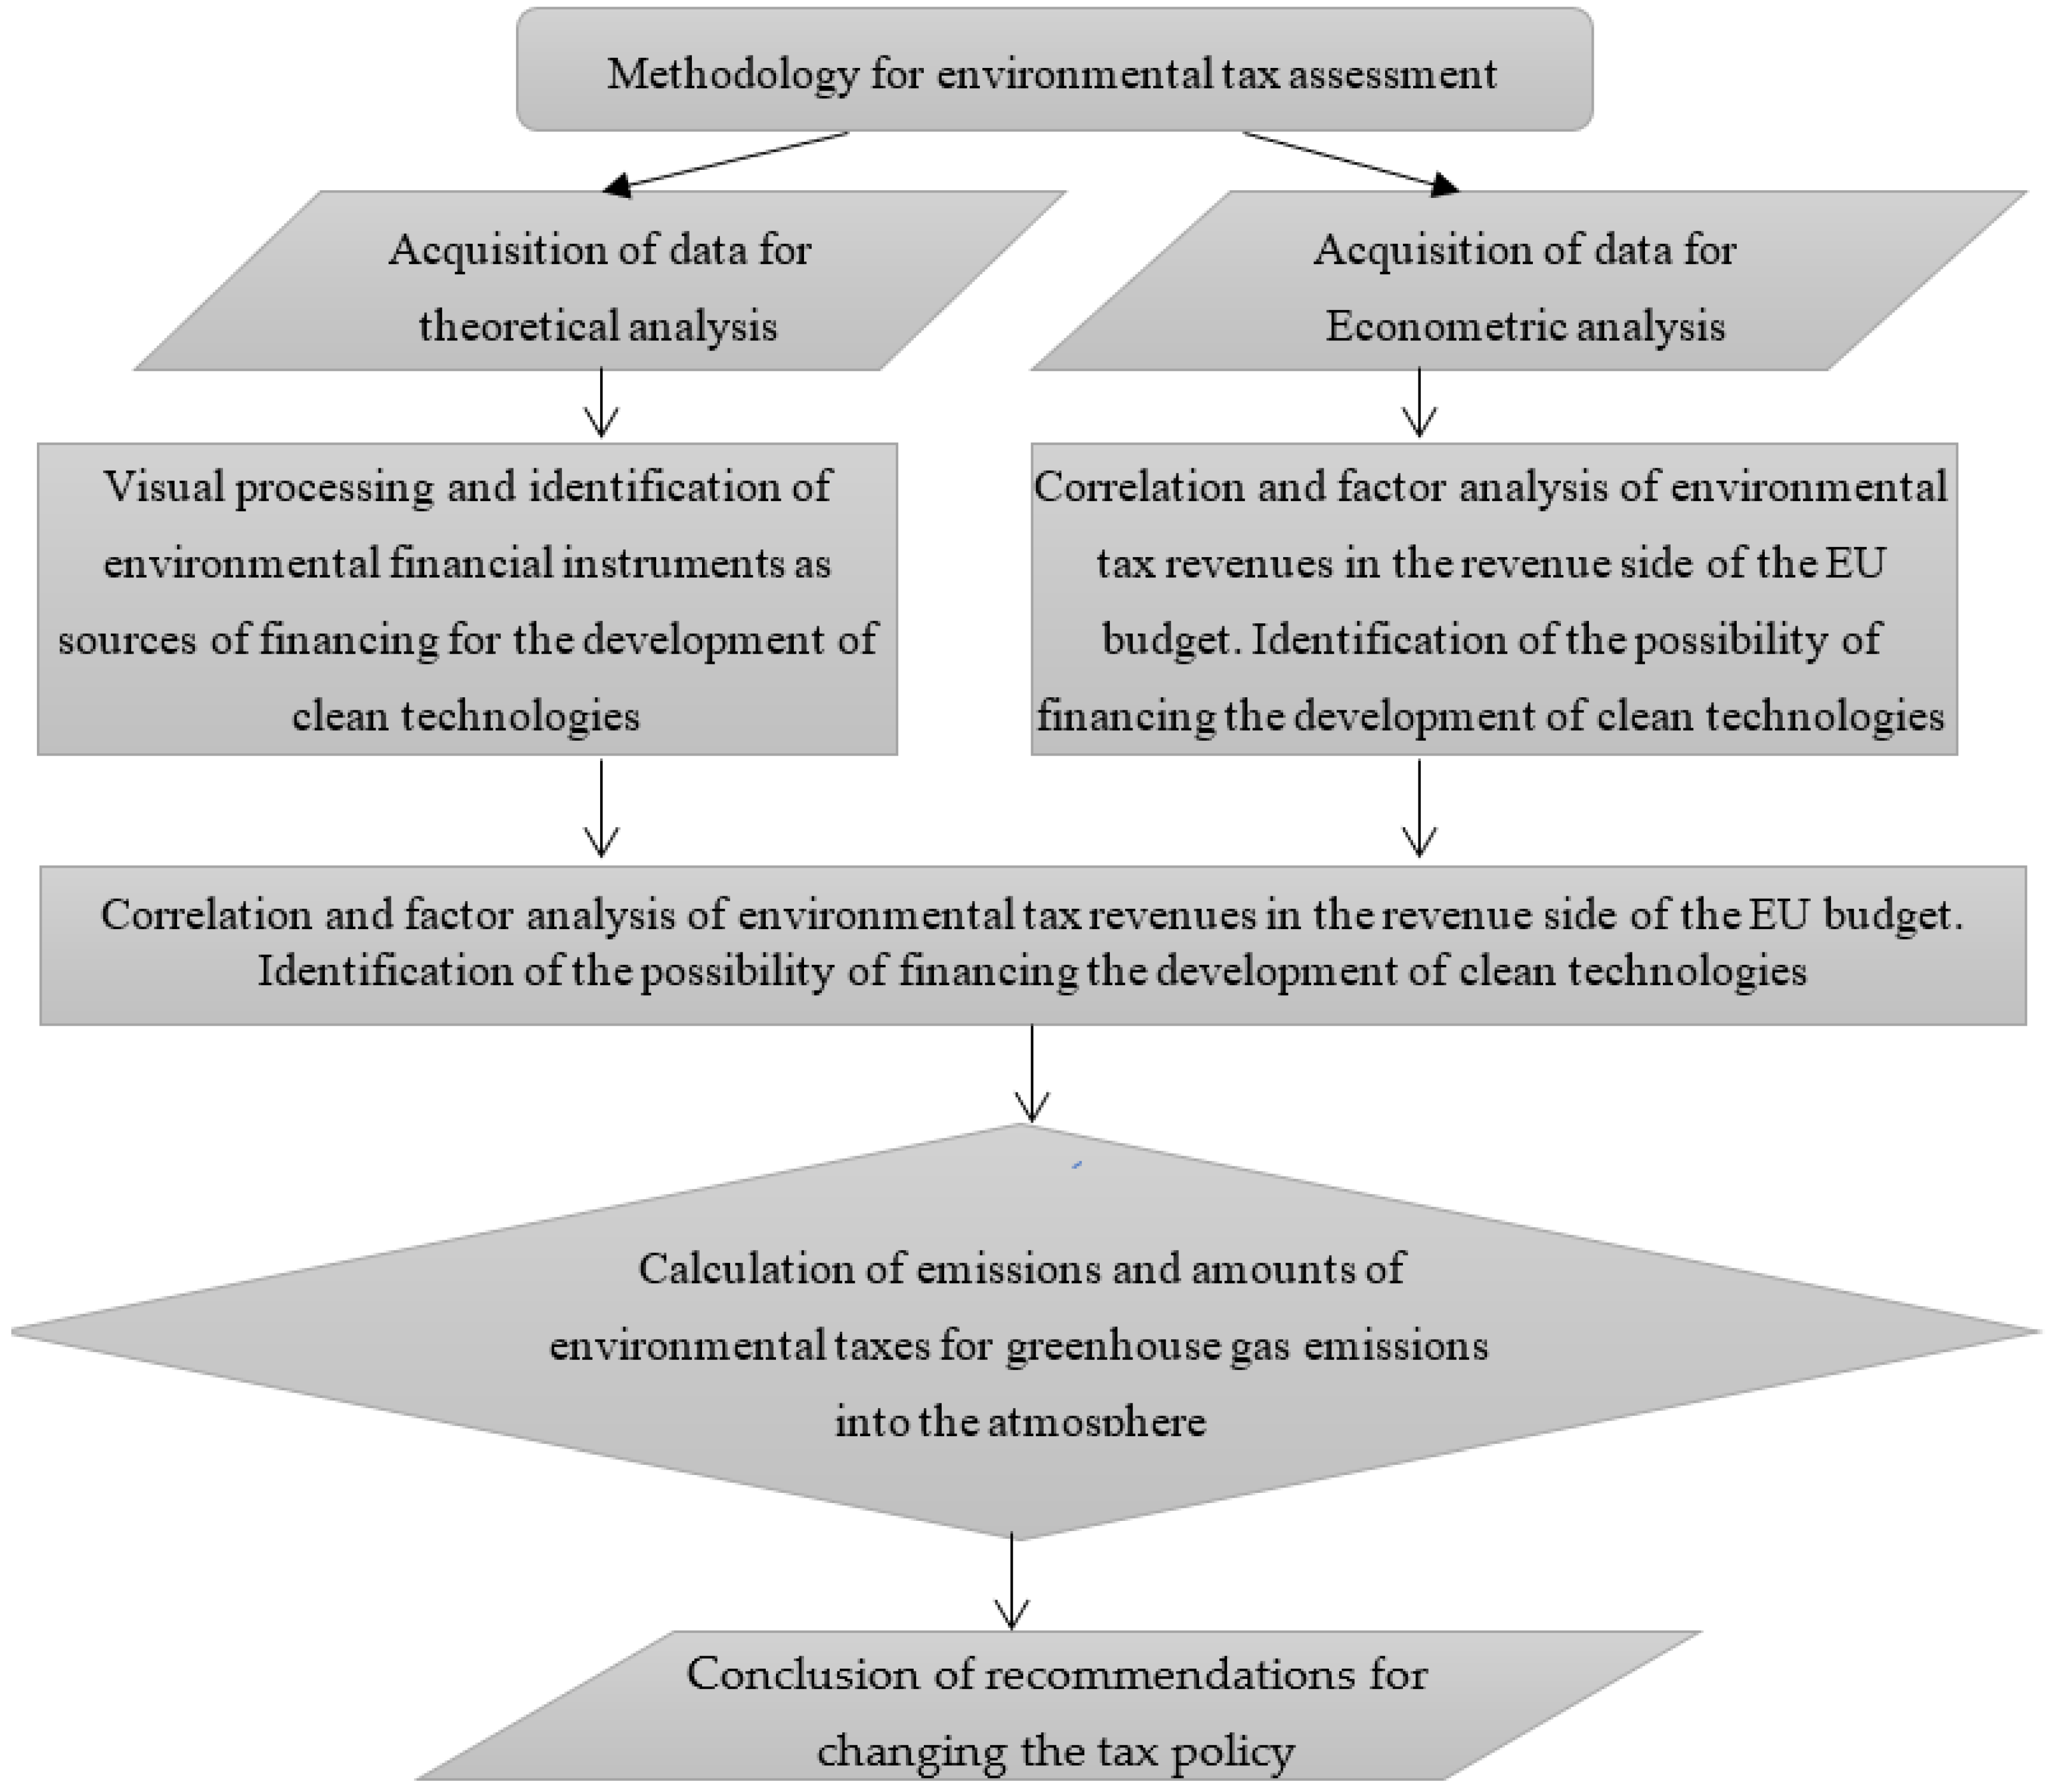
Factor analysis shows that the environmental tax on pollution, although having a very high value in the total amount of environmental taxes, is insignificant in terms of its share and has a contribution of 1.0108%. Block diagram methodology is presented in Figure 8.
All methodologies included in the methodology for environmental tax assessment of clean technologies that reduce carbon emissions at the lowest cost are aimed at reducing costs, including the identification of environmental sources of financing or environmental financial instruments. A comprehensive methodology is proposed, which includes a theoretical analysis of the search for environmental financial instruments or sources of financing for the development of clean technologies.
Methods of econometric analysis are also aimed at finding environmental financial instruments in the EU budget.
The methodology for determining actual greenhouse gas emissions and calculating the amount of environmental taxes allows one to obtain additional funding by increasing the rate to a certain level in accordance with the A. Laffer concept.
Thus, the task of searching for environmental financial instruments is solved by various methods combined into a comprehensive methodology. The problem of finding environmental financial instruments is the main one in the development of clean technologies.

3.2. Methodology for Calculating Greenhouse Gas Emissions (Price Adjustment)

The technique is necessary when calculating the effect of switching to innovative clean technologies (for example, metallurgical production using hydrogen) [65]. The results of the analysis are necessary to optimize revenues on the revenue side of budgets and to identify significant and insignificant tax revenues.
The amount of environmental tax on carbon dioxide emissions in the manufacture is proposed to be determined:
    P B C = t = i n ( M i × H n i )
where P B C —the amount of the environmental tax on CO2 emissions from the manufacture of goods; Mi—the actual volume of the emission of the i-th pollutant in tons (t); and Hni—ecotax rates in the current year per ton of the i-th pollutant [66].
The algorithm for calculating the environmental tax includes the following actions: identification of goods of a specific production; determination of CO2 emissions in the production of goods by calculation or experimental methods; preparation of documents for price adjustments; and adjustment of prices when importing goods into the EU countries directly from the manufacturer or seller. In relation to metallurgical production, the total amount of the environmental tax for CO2 emissions from sources of production of goods according to the above algorithm when imported into the EU countries:
E t = Q 1 + Q 2 + Q 3 + Q 4 + Q 5 + Q 6  
where E t —the total value of the environmental tax for CO2 emissions from sources for the production of metallurgical goods; Q 1 —the amount of tax payment for CO2 emissions from the source for the production of the product—lime; Q 2 —the amount of tax payment for CO2 emissions from the source for the production of goods—agglomerate; Q 3 —the amount of tax payment for CO2 emissions from the source for the production of goods—pig iron; Q 4 —the amount of tax payment for CO2 emissions from the source for the production of goods—open-hearth steel; Q 5 —the amount of tax payment for CO2 emissions from the source for the production of goods—converter steel; and Q 6 —the amount of tax payment for CO2 emissions from the source for the production of rolled products.
The total value of the volume of output of production for the tax period [67]:
M i = 1.182 L i + 0.254 a g + 2.085 c i + 0.116 s t + 0.125 r p + 0.00022 e l
where ∑Li—lime, t; ∑ag—agglomerate, t; ∑ci—cast iron, t; ∑st—steel, t; ∑rp—rolled products, t; and ∑el—power generation, kW-h.
Coefficients of specific emissions of CO2 into the atmosphere for the analyzed period during the production of one ton of goods at the metallurgical enterprises of Ukraine: lime (Li)—1.182 t/t; agglomerates (ag)—0.254 t/t; cast iron (ci)—2.085 t/t; steel (st)—0.116 t/t; rolled products (rp)—0.125 t/t; and electricity (el)—0.22 kW-h.
P B C = [ ( 1.182 L i + 0.254 a g + 2.085 c i + 0.116 s t + 0.125 r p + 0.00022 e l ) 500 ] × H n i
In some countries, the CO2 emission limit is 500 tons (per year), after which the environmental tax is paid [50]. The limit applies to all sources of pollution. In the metallurgical industry in the proposed example, there are six sources of pollution associated with the production of goods. On the basis of real CO2 emissions from man-made sources for the production of specific steel products, it is possible to calculate the amounts of tax payments and attract other FI that help stimulate local investment, generate income, reduce costs, stimulate economic growth, and create jobs. In addition to the obvious benefits of attracting additional resources to FI and reusing funds in the long term, the repayable nature of financial instruments offers incentives for efficiency gains, including increased financial discipline at the level of supported projects. The return on these investments becomes resources at the disposal of local authorities, which can later be reinvested in other decarbonization projects. The methodology for calculating greenhouse gas emissions can be used when calculating environmental tax revenues to the local budget of countries, given that these revenues should be one of the sources of financing for greening and eco-modernization of technologies for the production. The proposed calculation method can be used to calculate the effect of introducing an innovative technology—hydrogen metallurgy. Tax revenues are an insufficient source of financing for the processes of greening and eco-modernization of technologies. However, this does not mean that it is necessary to increase the rates of environmental taxes. It is necessary to attract additional financial instruments (FI) and financial management mechanisms to manage financial models [60,61,62].

4. Result

In confirmation of the continuation of GT-H1, the following can be added. Environmental taxation stimulates the reduction of CO2 emissions into the atmosphere by changing rates up to a certain amount [63]. During this period, economic entities use financial instruments (FI) in projects of greening and eco-modernization of decarbonization of the processes of production of goods and services according to the concepts of Laffer and Porter. However, the total amounts of environmental taxes on CO2 emissions to the EU budget are not significant for financing eco-projects. The receipt of environmental taxes in the EU budget cannot reduce the tax burden from labor taxes. The diagram (Figure 9) shows the change in tax revenues labor taxes and environmental taxes relative to 2002, expressed as a percentage. The value of E n was determined by the formula:
E n = E T n E T 2002
Note that it is practically constant. For the period 2002–2019, there was no “jump” in the growth of environmental tax revenues to the EU budget.
The formula for calculating the Pearson correlation coefficient is shown as Formula (7). The formula below for Pearson’s correlation coefficient suggests taking the difference between each value x i of the variable x and the arithmetic mean for the variable, x ¯ . However, in order to optimize the calculations, to calculate the Pearson correlation coefficient, an analog obtained using transformations is used [64]:
r x y = n i x i y i i x i i y i ( n i x i 2 ( i x i ) 2 ) ( n i y i 2 ( i y i ) 2 )
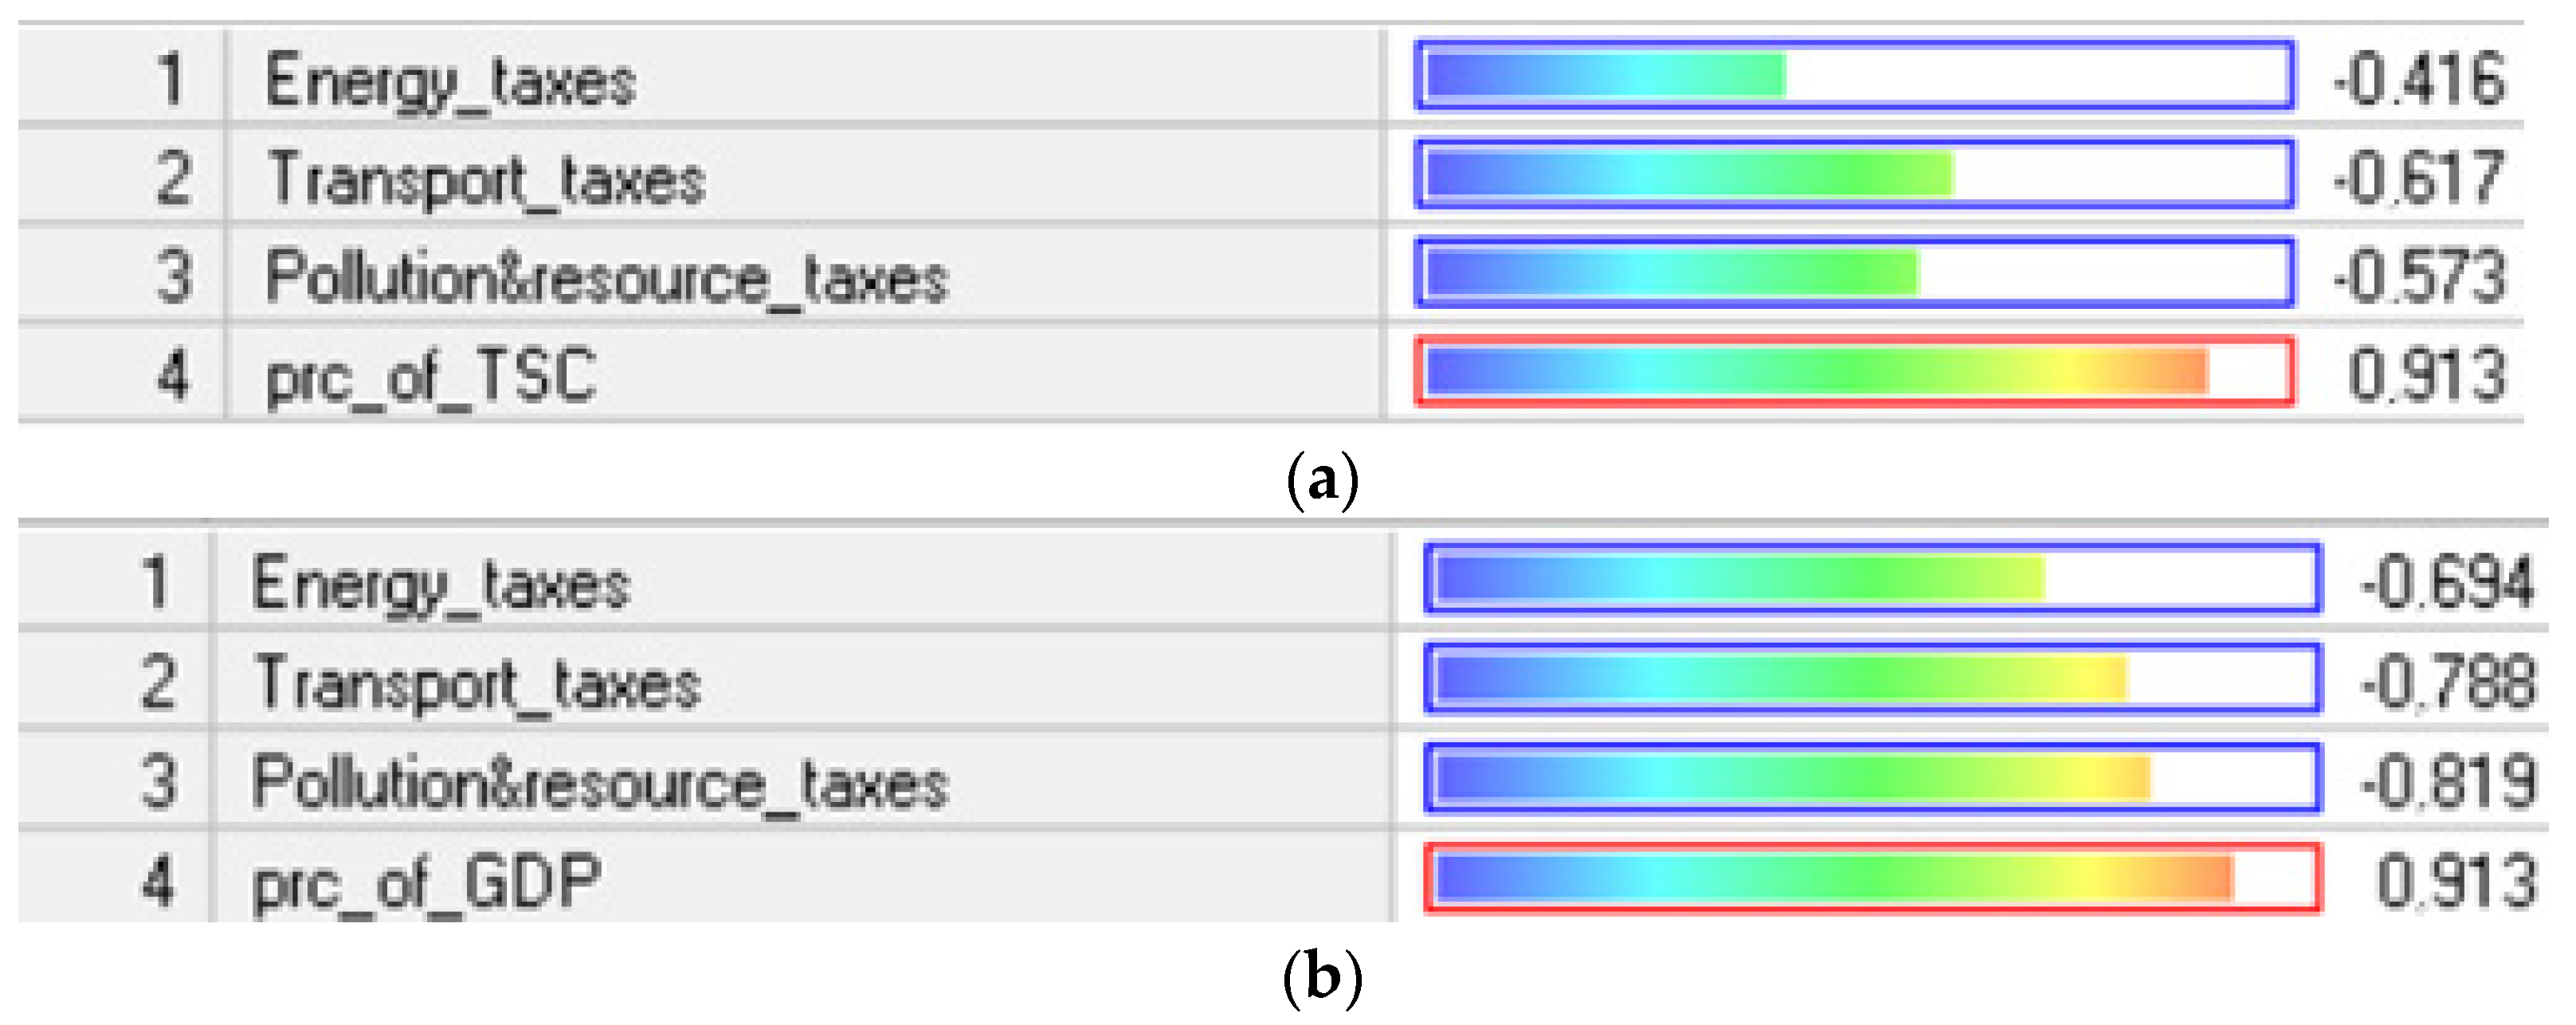
The results of the correlation analysis are shown in Figure 10.
Thus, the correlation analysis showed fairly strong feedback of environmental tax revenues to the EU budget to GDP and to TSC. Positive feedback is observed in TSC to GPD, the correlation coefficient is +0.913. Correlation analysis can take place in the analysis of the relationship of factors (environmental tax revenues by type) but requires caution in its application. An analysis of correlation analysis data showed that factors such as environmental revenues in the EU budget have little effect on TSC and GPD.

5. Discussion

Environmental taxation is necessary to organize the decarbonization of the production of goods and services. It is shown that, already today, it is necessary to lay the conditions for competitiveness in the economy of the future by creating environmentally friendly, sustainable, and low-carbon systems for the production of goods and services. It was revealed that the assumptions about the possibility of filling the EU budget with revenues from environmental taxes with an increase in rates are valid only in the short term. In the long term, the authors propose not to set excessively high rates of environmental taxes. In order to decarbonize as well as more actively introduce a “green” taxation system using financial instruments and financial management in cash flow management, within the framework of the New European Concept, a methodology for calculating emissions is proposed, taking into account the actual specific CO2 emissions. The proposed method for calculating tax payments for CO2 emissions in the production of products in the metallurgical industry, based on taking into account specific CO2 emissions per ton of manufactured products, showed that the most carbon-intensive stages of lime and cast-iron production require the use of an improved “green” mechanism taxation. Environmental taxation contributes to the decarbonization of the production of goods and services.
However, there is an erroneous opinion that environmental taxes should fulfill their main purpose—to be a source of filling budgets, including the EU budget. The authors agree with the statements of some economists that environmental taxes should perform fiscal functions to the least extent possible and regulatory functions to the greatest extent [66,67].
Environmental taxes should purposefully participate in the financing of projects on greening and eco-modernization of production processes for the transition to innovative technologies. The paper shows that, as a source of financing, the total receipts of environmental taxes are insufficient for the processes of decarbonization of production and additional financial instruments is required. The paper proposes that financial management mechanisms be used in the management of financial instruments. Such an approach to organizing the management of sources of financing for the processes of greening and decarbonization will reduce the necessary capital attracted for these processes and reduce its cost. The use of financial management mechanisms increases the return on equity. The research articles (Section 2), despite their invaluable significance, do not show the simultaneous use of several financial instruments and financial management mechanisms. Such an organization of the management of financial instruments is especially necessary in the transition to innovative production technologies [40,68,69].

6. Conclusions

Environmental taxation is necessary for the organization of decarbonization and the development of clean technologies for production. The analysis revealed that, compared with other norms for reducing greenhouse gas emissions, taxes on emissions are more effective in curbing emissions. Furthermore, it revealed that environmental tax rates require the development of a differentiation mechanism in relation to developed and developing countries regarding the improvement of clean technologies, to a certain extent, and/or their complete replacement with innovative technologies. Environmental taxes are classified as environmental financial instruments that ensure the development of clean technologies, which is possible, for example, based on tax incentives that are aimed at developing and implementing technological green innovations and increasing production efficiency. As the level of taxation increases, so does the associated impact on investment in cleantech. Low levels of environmental taxation can also be effective when combined with public funding. To finance the development of clean technologies, it is necessary to share environmental financial instruments (environmental taxes; equity, debt, and debt capital; and green bonds) and manage them using financial management mechanisms.
During the period 2000–2020, the total receipts of all environmental taxes in the EU budget increased by 53%. Revenues from taxes on greenhouse gas emissions into the atmosphere increased by 71% in the EU budget with a 1.5-fold increase in the tax rate. The application of the methodology proposed by the authors made it possible to determine the high strength of the relationship (correlation coefficient +0.971) for the period 2000–2020 between environmental tax revenues for greenhouse gas emissions into the atmosphere and the total values of all environmental taxes. The assumptions about the possibility of filling the EU budget with revenues from environmental taxes with an increase in rates are valid only in the short term. Subsequently, the available data were summarized, and it was proposed not to set excessively high rates of environmental taxes, as this could drive the activities of business entities “into the shadows”, especially in countries with developing economies. For a more active introduction of decarbonization processes and the development of clean technologies for the production of goods and services, it is necessary to create a “green” financial system, including a taxation system and other financial instruments and financial management mechanisms in cash flow management. This also corresponds to the New European Concept.
The application of the methodology takes place when calculating the amounts of environmental taxes and determining the price of products. The proposed methodology (as in the example of the metallurgical industry) for calculating tax payments for CO2 emissions is based on accounting for specific CO2 emissions per ton of output; it shows that the most carbon-intensive stages of lime and iron production require the use of an improved “green” taxation mechanism and the sharing of other environmental financial instruments. Mixed capital management should be carried out using financial management mechanisms, including financial and production levers to achieve sustainable development goals.

Author Contributions

Conceptualization, V.K. and O.L.; methodology, P.O. and O.L.; software, L.P.; validation, S.P. and I.U.; formal analysis, P.O. and I.U.; investigation, V.K.; resources, O.L.; data curation, I.U.; writing—original draft preparation, S.P.; writing—review and editing, V.K.; project administration, P.O.; funding acquisition, P.O. All authors have read and agreed to the published version of the manuscript.

Funding

This research received no external funding.

Institutional Review Board Statement

Not applicable.

Informed Consent Statement

Not applicable.

Data Availability Statement

Not applicable.

Conflicts of Interest

The authors declare no conflict of interest.

References

  1. Gwangndi, M.I.; Muhammad, Y.A.; Tagi, S.M. The Impact of Environmental Degradation on Human Health and Its Relevance to the Right to Health Under International Law. Eur. Sci. J. 2016, 12, 485. [Google Scholar] [CrossRef] [Green Version]
  2. Adaptation Fund: Portfolio—Programmes. Funding and Financing Solution for Infrastucture. Funding and Financing Green and Circular Economy Solutions. 2021. Available online: https://www.adapta-tion-fund.org/projects (accessed on 18 March 2022).
  3. Useful Information. Info Session 3: New European Bauhaus Funding Opportunities. 2022. Available online: https://new-european-bauhaus.europa.eu/get-involved/funding-opportu-nities_en (accessed on 18 March 2022).
  4. Francisco, J. Environmental taxation in the European Union: Are there common trends? Econ. Anal. Policy 2022, 73, 670–682. [Google Scholar]
  5. Goulder, L.H.; Mathai, K. Optimal CO2 Abatement in the Presence of Induced Technological Change. J. Environ. Econ. Manag. 2000, 39, 1–38. [Google Scholar] [CrossRef] [Green Version]
  6. Hart, R. The timing of taxes on CO2 emissions when technological change is endogenous. J. Environ. Econ. Manag. 2008, 55, 194–212. [Google Scholar] [CrossRef]
  7. Voskolupov, V.; Balanovska, T.; Havrysh, O.; Gogulya, O.; Drahnieva, N. Marketing Management as a Tool for Preventing Crisis of Agricultural Enterprises. Financ. Credit. Act. Probl. Theory Pract. 2021, 5, 410–417. [Google Scholar] [CrossRef]
  8. Olczak, P.; Żelazna, A.; Matuszewska, D.; Olek, M. The “My Electricity” Program as One of the Ways to Reduce CO2 Emissions in Poland. Energies 2021, 14, 7679. [Google Scholar] [CrossRef]
  9. Gerlagh, R.; Kverndokk, S.; Rosendahl, K.E. Optimal Timing of Climate Change Policy: Interaction Between Carbon Taxes and Innovation Externalities. Environ. Resour. Econ. 2009, 43, 369–390. [Google Scholar] [CrossRef]
  10. Goulder, L.H.; Schein, A.R. Carbon Taxes Versus Cap and Trade: A Critical Review. Clim. Chang. Econ. 2013, 4, 135001. [Google Scholar] [CrossRef]
  11. Quadrelli, R.; Peterson, S. The energy-climate challenge: Recent trends in CO2 emissions from fuel combustion. Energy Policy 2007, 35, 5938–5952. [Google Scholar] [CrossRef]
  12. Rubio, S.J.; Escriche, L. Strategic pigouvian taxation, stock externalities and polluting non-renewable resources. J. Public Econ. 2001, 79, 297–313. [Google Scholar] [CrossRef]
  13. Schou, P. When Environmental Policy is Superfluous: Growth and Polluting Resources. Scand. J. Econ. 2002, 104, 605–620. [Google Scholar] [CrossRef]
  14. Sinclair, P. High does nothing and rising is worse: Carbon taxes should keep declining to cut harmful emissions. Manch. Sch. 1992, 60, 41–52. [Google Scholar] [CrossRef]
  15. Schou, P. Polluting Non-Renewable Resources and Growth. Environ. Resour. Econ. 2000, 16, 211–227. [Google Scholar] [CrossRef]
  16. Sinn, H.-W. Taxation, growth, and resource extraction. A general equilibrium approach. Eur. Econ. Rev. 1982, 19, 357–386. [Google Scholar] [CrossRef]
  17. Sinn, H.-W. Public policies against global warming: A supply side approach. Int. Tax Public Financ. 2008, 15, 360–394. [Google Scholar] [CrossRef]
  18. Ulph, A.; Ulph, D. The Optimal Time Path of a Carbon Tax. Oxf. Econ. Pap. 1994, 46, 857–868. [Google Scholar] [CrossRef]
  19. Samsin, I.; Kovalko, N.; Kovalenko, A.; Zabzaliuk, D.; Kurando, K. Legal Aspects of Identity Transactions Involving Entities with Foreign Elements: ICT Technologies and Issues of the Tax Burden. Stud. Appl. Econ. 2021, 39, 4865. [Google Scholar] [CrossRef]
  20. Tong, J.; Yue, T.; Xue, J. Carbon taxes and a guidance-oriented green finance approach in China: Path to carbon peak. J. Clean. Prod. 2022, 367, 133050. [Google Scholar] [CrossRef]
  21. Turski, I.; Mashika, H.; Tkachenko, T.; Khmara, M.; Komarnitskyi, I.; Oliinyk, M. Medical Tourism: Analysis of the State of International Tourism and Prospects for Domestic Development. Univers. J. Public Health 2021, 9, 27–34. [Google Scholar] [CrossRef]
  22. Koval, L.; Turski, I.; Kolomiiets, O.; Komarnitskyi, I.; Chaika, T. New Opportunities for Restaurant Business Development Based on Computer Modeling of Consumer Preferences. Stud. Appl. Econ. 2021, 39, 4714. [Google Scholar] [CrossRef]
  23. Bovsh, L.; Hopkalo, L.; Levytska, I.; Komarnitskyi, I.; Rasulova, A. Simulation of Behavior of Hotel and Restaurant Business Staff in the Conditions of COVID-19 Viral Pandemic. J. Environ. Manag. Tour. 2021, 12, 186–195. [Google Scholar] [CrossRef]
  24. Dankeieva, O.; Solomianiuk, N.; Strashynska, L.; Fiedotova, N.; Soloviova, Y.; Koval, V. Application of Cognitive Modelling for Operation Improvement of Retail Chain Management System. TEM J. 2021, 10, 358–367. [Google Scholar] [CrossRef]
  25. Koval, L.; Tserklevych, V.; Popovich, O.; Bukhta, S.; Hurman, O.; Komarnitskyi, I. Gender Targeting of Restaurants’ Visitors-Representatives of Generation Z. Int. J. Manag. 2020, 11, 155–162. [Google Scholar]
  26. Danko, Y.I.; Medvid, V.Y.; Koblianska, I.I.; Kornietskyy, O.V.; Reznik, N.P. Territorial government reform in Ukraine: Problem aspects of strategic management. Int. J. Sci. Technol. Res. 2020, 9, 1376–1382. [Google Scholar]
  27. Balanovska, T.; Gogulya, O.; Dramaretska, K.; Voskolupov, V.; Holik, V. Using marketing management to ensure competitiveness of agricultural enterprises. Agric. Resour. Econ. Int. Sci. E-J. 2021, 7, 142–161. [Google Scholar] [CrossRef]
  28. Oklander, M.; Chukurna, O.; Oklander, T.; Yashkina, O. Methodical Approach to Calculating Information Value in Pricing Policy in Supply Chains. Stud. Appl. Econ. 2020, 38, 4009. [Google Scholar] [CrossRef]
  29. Halkiv, L.; Karyy, O.; Kulyniak, I.; Ohinok, S. Modeling and Forecasting of Innovative, Scientific and Technical Activity Indicators Under Unstable Economic Situation in the Country: Case of Ukraine. In International Conference on Data Stream Mining and Processing; Communications in Computer and Information Science; Springer: Cham, Switzerland, 2020; Volume 1158, pp. 79–97. [Google Scholar] [CrossRef]
  30. Mirzoieva, T.; Heraimovych, V.; Loshakova, Y.; Tripak, M.; Humeniuk, I. Optimization of the sown areas structure as a tool for the development of medicinal crop production on the basis of sustainability and regenerative agriculture. E3S Web Conf. 2021, 244, 03027. [Google Scholar] [CrossRef]
  31. Bohach, L.; Heraimovych, V.; Humeniuk, I.; Nahornyi, V.; Gerasymenko, N. Formation of optimal field crop structure on leased lands of agricultural enterprises. J. Adv. Res. Law Econ. 2019, 10, 1868–1876. [Google Scholar]
  32. Prokopenko, O.; Chechel, A.; Sotnyk, I.; Omelyanenko, V.; Kurbatova, T.; Nych, T. Improving state support schemes for the sustainable development of renewable energy in Ukraine. Polityka Energetyczna 2021, 24, 85–100. [Google Scholar] [CrossRef]
  33. Hrechyn, B.; Krykavskyy, Y.; Binda, J. The Development of a Model of Economic and Ecological Evaluation of Wooden Biomass Supply Chains. Energies 2021, 14, 8574. [Google Scholar] [CrossRef]
  34. Maslov, A.; Spasiv, N.; Bezzubko, B.; Lazebnyk, I.; Nych, T.; Ternova, L. Spatial optimization of regional social infrastructure facilities. Int. J. Innov. Technol. Explor. Eng. 2019, 9, 929–3932. [Google Scholar] [CrossRef]
  35. Semigina, T. Frustrations or moving forward? Ukrainian social work within the ‘hybrid war’ context. Eur. J. Soc. Work. 2019, 22, 446–457. [Google Scholar] [CrossRef]
  36. Koval, V.; Laktionova, O.; Atstāja, D.; Grasis, J.; Lomachynska, I.; Shchur, R. Green Financial Instruments of Cleaner Production Technologies. Sustainability 2022, 14, 10536. [Google Scholar] [CrossRef]
  37. Bashkirova, N.N.; Lessovaia, S.N. Sustainable Natural Resources Use: Financial and Tax Issues. IOP Conf. Ser. Earth Environ. Sci. 2022, 988, 022012. [Google Scholar] [CrossRef]
  38. Huo, W.; Ullah, M.R.; Zulfiqar, M.; Parveen, S.; Kibria, U. Financial Development, Trade Openness, and Foreign Direct Investment: A Battle Between the Measures of Environmental Sustainability. Front. Environ. Sci. 2022, 10, 77. [Google Scholar] [CrossRef]
  39. Cai, Y.-J.; Choi, T.-M.; Feng, L.; Li, Y. Producer’s choice of design-for-environment under environmental taxation. Eur. J. Oper. Res. 2022, 297, 532–544. [Google Scholar] [CrossRef]
  40. Dragone, D.; Lambertini, L.; Palestini, A. Emission taxation, green innovations and inverted-U aggregate R&D efforts in a linear state differential game. Res. Econ. 2022, 76, 62–68. [Google Scholar] [CrossRef]
  41. Huang, L.; Zhen, L.; Wang, J.; Zhang, X. Blockchain implementation for circular supply chain management: Evaluating critical success factors. Ind. Mark. Manag. 2022, 102, 451–464. [Google Scholar] [CrossRef]
  42. Ouchida, Y.; Goto, D. Strategic non-use of the government’s precommitment ability for emissions taxation: Environmental R&D formation in a Cournot duopoly. Aust. Econ. Pap. 2022, 61, 181–206. [Google Scholar] [CrossRef]
  43. Vidal-Meliá, L.; Arguedas, C.; Camacho-Cuena, E.; Zofío, J.L. An Experimental Analysis of the Effects of Imperfect Compliance on Technology Adoption. Environ. Resour. Econ. 2022, 81, 425–451. [Google Scholar] [CrossRef]
  44. Xie, P.; Jamaani, F. Does Green Innovation, Energy Productivity and Environmental Taxes Limit Carbon Emissions in Developed economies: Implications for Sustainable development. Struct. Chang. Econ. Dyn. 2022, 63, 66–78. [Google Scholar] [CrossRef]
  45. Niu, B.; Zhang, N.; Xu, H.; Chen, L.; Ji, P. Inviting MNFs’ green offshoring: Is it an effective way to coordinate economic and environmental sustainability? Int. J. Prod. Econ. 2022, 254, 108605. [Google Scholar] [CrossRef]
  46. Wan, Q.; Miao, X.; Afshan, S. Dynamic effects of natural resource abundance, green financing, and government environmental concerns toward the sustainable environment in China. Resour. Policy 2022, 79, 102954. [Google Scholar] [CrossRef]
  47. Chen, S. The inequality impacts of the carbon tax in China. Humanit. Soc. Sci. Commun. 2022, 9, 277. [Google Scholar] [CrossRef]
  48. Bae, J.H. Impacts of income inequality on CO2 emission under different climate change mitigation policies. Korean Econ. Rev. 2018, 34, 187–211. [Google Scholar]
  49. Zhang, Z.; Hu, G.; Mu, X.; Kong, L. From low carbon to carbon neutrality: A bibliometric analysis of the status, evolution and development trend. J. Environ. Manag. 2022, 322, 116087. [Google Scholar] [CrossRef]
  50. Zhen, L.; Huang, L.; Wang, W. Green and sustainable closed-loop supply chain network design under uncertainty. J. Clean. Prod. 2019, 227, 1195–1209. [Google Scholar] [CrossRef]
  51. Huang, L.; Zhen, L.; Yin, L. Waste material recycling and exchanging decisions for industrial symbiosis network optimization. J. Clean. Prod. 2020, 276, 124073. [Google Scholar] [CrossRef]
  52. Li, S.; Jia, N.; Chen, Z.; Du, H.; Zhang, Z.; Bian, B. Multi-objective optimization of environmental tax for mitigating air pollution and greenhouse gas. J. Manag. Sci. Eng. 2022, 7, 473–488. [Google Scholar] [CrossRef]
  53. Alola, A.A.; Nwulu, N. Do energy-pollution-resource-transport taxes yield double dividend for Nordic economies? Energy 2022, 254, 124275. [Google Scholar] [CrossRef]
  54. Tchorzewska, K.; Garcia-Quevedo, J.; Martinez-Ros, E. The heterogeneous effects of environmental taxation on green technologies. Res. Policy 2022, 51, 104541. [Google Scholar] [CrossRef]
  55. Sikder, M.; Wang, C.; Yao, X.; Huai, X.; Wu, L.; KwameYeboah, F.; Wood, J.; Zhao, Y.; Dou, X. The integrated impact of GDP growth, industrialization, energy use, and urbanization on CO2 emissions in developing countries: Evidence from the panel ARDL approach. Sci. Total Environ. 2022, 837, 155795. [Google Scholar] [CrossRef] [PubMed]
  56. Capital misallocation, technological innovation, and green development efficiency: Empirical analysis based on China provincial panel data. Environ. Sci. Pollut. Res. 2022, 29, 65535–65548. [CrossRef]
  57. Yijun, Z. Tax rebates, technological innovation and sustainable development: Evidence from Chinese micro-level data. Technol. Forecast. Soc. Change 2022, 176, 121481. [Google Scholar]
  58. Establishing Green Finance System to Support the Circular Economy. Available online: https://www.eria.org/uploads/media/ERIA-Books-2018-Industry4.0-Circular_-Economy.pdf (accessed on 18 March 2022).
  59. Eurostat Database. 2018. Available online: https://ec.europa.eu/eurostat/data/database (accessed on 10 June 2022).
  60. Koval, V.; Mikhno, I.; Udovychenko, I.; Gordiichuk, Y.; Kalina, I. Sustainable Natural Resource Management to Ensure Strategic Environmental Development. TEM J. 2021, 10, 1022–1030. [Google Scholar] [CrossRef]
  61. European Commission. A European Green Deal. 2019. Available online: https://ec.europa.eu/info/strategy/priorities-2019-2024/european-green-deal_en (accessed on 18 March 2022).
  62. European Commission 2021. Revision of the Energy Taxation Directive (ETD): Questions and Answers. Available online: https://ec.europa.eu/commission/presscorner/detail/en/qanda_21_3662 (accessed on 18 March 2022).
  63. United Nation Climate Change. The Paris Agreement—Publication. Available online: https://unfccc.int/documents/184656/2022 (accessed on 18 November 2021).
  64. European Commission. New European Bauhaus. 2022. Available online: https://europa.eu/new-european-bauhaus/index_en (accessed on 18 March 2022).
  65. Bollerslev, T.; Russell, J.; Watson, M. Volatility and Time Series Econometrics: Essays in Honor of Robert Engle; OUP Oxford: Oxford, UK, 2010. [Google Scholar]
  66. Philanthropova, V.A.; Sham, P.I. On Atmospheric Air Pollution by Ferrous Metallurgy Enterprises. Bull. Azov State Tech. Univ. 2001, 11, 1–4. [Google Scholar]
  67. Tax Code of Ukraine. 2021. Available online: https://www.wto.org/english/thewto_e/acc_e/ukr_e/wtaccukr88_leg_3.pdf (accessed on 18 March 2022).
  68. Cader, J.; Olczak, P.; Koneczna, R. Regional dependencies of interest in the “My Electricity” photovoltaic subsidy program in Poland. Polityka Energetyczna—Energy Policy J. 2021, 24, 97–116. [Google Scholar] [CrossRef]
  69. Cader, J.; Koneczna, R.; Olczak, P. The Impact of Economic, Energy, and Environmental Factors on the Development of the Hydrogen Economy. Energies 2021, 14, 4811. [Google Scholar] [CrossRef]
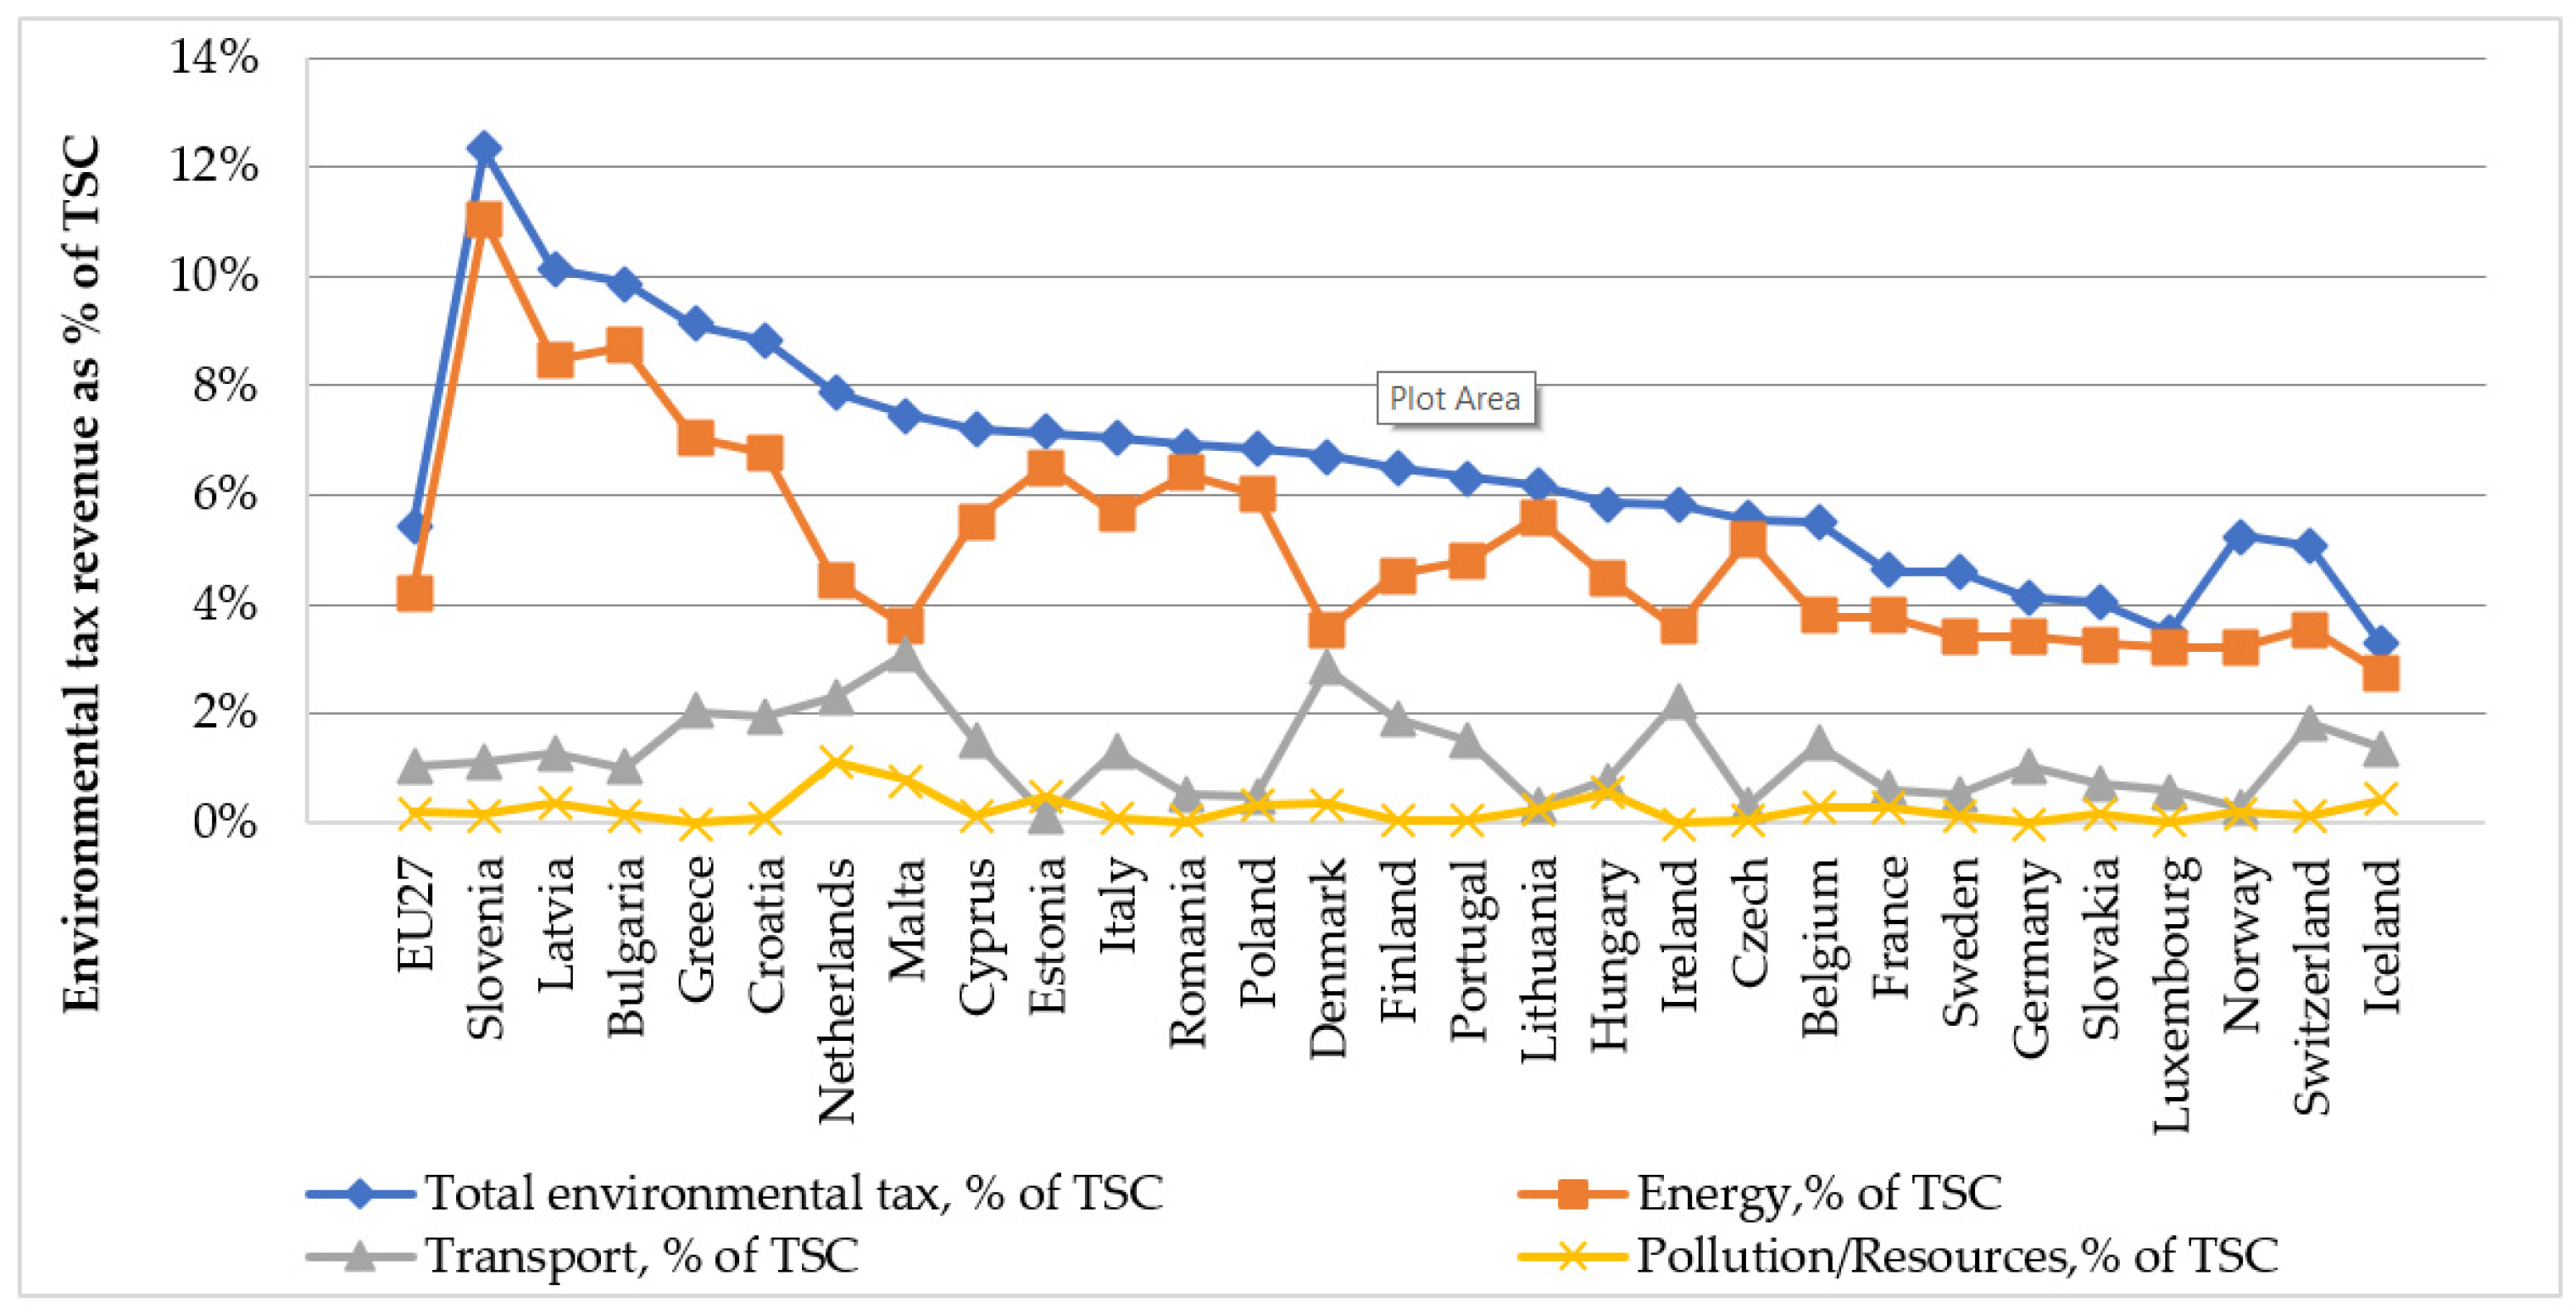
Figure 1. Environmental tax revenue as a percentage of TSC, 2020. Reprinted with permission from [59]. Copyright 2022, Eurostat.
Sustainability 14 14044 g001
Figure 2. Environmental tax revenue by category as a percentage of TSC in 2020, %. Reprinted with permission from [59]. Copyright 2022, Eurostat.
Sustainability 14 14044 g002
Figure 3. Total environmental tax as a percentage of GDP, 2020. Reprinted with permission from [59]. Copyright 2022, Eurostat.
Sustainability 14 14044 g003
Figure 4. Comparison of GDP, TSC, and EU environmental tax revenues (TET), trillion euros. Reprinted with permission from [59]. Copyright 2022, Eurostat.
Sustainability 14 14044 g004
Figure 5. Dynamics of tax revenues, billion euros. Reprinted with permission from [59]. Copyright 2022, Eurostat.
Sustainability 14 14044 g005
Figure 6. Structure of tax revenues,%. Reprinted with permission from [59]. Copyright 2022, Eurostat.
Sustainability 14 14044 g006
Figure 7. Visualization of the linear Pearson correlation coefficient®, input fields—types of environmental taxes; output—the total values of the total environmental taxes, 2000–2020.
Sustainability 14 14044 g007
Figure 8. Block diagram methodology of analysis and environmental tax assessment of clean technologies for reduce carbon emissions at the lowest cost.
Sustainability 14 14044 g008
Figure 9. Dynamics of changes in the amount of taxes relative to 2002, %. Reprinted with permission from [59]. Copyright 2022, Eurostat.
Sustainability 14 14044 g009
Figure 10. Results of correlation analysis of environmental tax revenues (input fields) to GDP and to TSC (output fields), 2002–2020. Reprinted with permission from [59]. Copyright 2022, Eurostat. (a) Output field—GDP, (b) Output field—GDP–TSC.
Sustainability 14 14044 g010
Table 1. Total environmental tax revenue by type of tax and tax payer, EU, 2019 and 2020.
Million EuroShare of Total Environmental Taxes, %Share of GDP, %Share of Total Environmental Taxes, %Share of (Specific Type of) Environmental Tax Revenue (by Tax Payer), %
20202019
CorporationsHouseholdsNon-residents
Total environmental taxes299,885100.02.245.4247.748.03.4
Energy taxes232,41177.21.744.1951.443.34.2
Transport taxes56,83819.10.421.0332.365.40.5
Taxes on pollution/ resources10,6363.70.080.2042.456.51.1
Source: adapted with permission from [59]. Copyright 2022, Eurostat.
Table 2. Dynamics of changes in environmental tax revenues to the EU budget GDP, TSC, 2002–2019, million euros.
200220032004200520062007
GDP8,540,077.08,768,884.89,168,960.09,561,846.310,113,606.010,740,038.1
TSC3,289,484.63,377,960.33,509,263.43,685,837.83,931,673.14,187,016.4
TET217,623.33226,683.65235,467.66242,508.35249,795.39254,040.43
200820092010201120122013
GDP11,085,484.44,027,279.94,163,941.64,344,072.54,478,704.24,581,440.4
TSC4,261,044.34,027,279.94,163,941.64,344,072.54,478,704.24,581,440.4
TET255,000.63249,489.6259,603.6272,357.19278,482.61284,174.26
201420152016201720182019
GDP4,696,565.04,852,744.34,998,941.25220,149.95,420507.05,595,531.4
TSC4,696,565.04,027,279.94,852,744.34,998,941.25,220,149.95,420,507.0
TET290,979.85249,489.6299,066.49310,173.35316,635.62324,958.63
Source: adapted with permission from [59]. Copyright 2022, Eurostat.
Table 3. Environmental tax revenue—change between 2019 and 2020, pp change in share of TSC and of GDP.
Countriespp Change in the Share of TSCpp Change in the Share of GDPCountriespp Change in the Share of TSCpp Change in the Share of GDP
EU-27−0.33−0.12
Estonia−2.37−0.76France−0.32−0.13
Slovenia−1.45−0.52Bulgaria−0.31−0.06
Romania−1.00−0.24Spain−0.30−0.01
Luxembourg−0.77−0.35Belgium−0.25−0.09
Netherlands−0.66−0.23Denmark−0.21−0.09
Italy−0.59−0.21Cyprus−0.17−0.04
Malta−0.59−0.19Slovakia−0.15−0.01
Portugal−0.55−0.15Finland−0.14−0.07
Poland−0.49−0.13Germany−0.13−0.05
Ireland−0.38−0.20Czechia−0.12−0.03
Croatia−0.34−0.17Greece−0.12−0.10
Austria−0.34−0.17Sweden−0.02−0.01
Hungary−0.34−0.13Lithuania−0.010.03
Norway0.270.33Latvia0.240.16
Iceland0.12−0.01Switzerland0.32−0.01
Source: adapted with permission from [59]. Copyright 2022, Eurostat.
Table 4. Structure of tax revenues, billion euros, % ET/TET, TT/TET, and TPR/TET, (%) [58].
YearET/TETTT/TETTPR/TETYearET/TETTT/TETTPR/TET
200076.020.73.3201176.819.83,4
200175.721.03.3201277.219.33,5
200276.120.53.4201377.718.93,4
200376.720.13.2201477.718.83,5
200475.921.03.2201577.519.03,5
200575.121.83.1201677.818.93,4
200674.522.33.2201777.719.03,3
200773.623.13.3201877.519.13,3
200874.322.13.6201977.619.03,4
200976.120.43.5202077.219.13,7
201076.420.13.4202177.319.13.7
Source: adapted with permission from [59]. Copyright 2022, Eurostat.
Table 5. Factor analysis for 2020 (Varimax analysis).
Refinement of the number of selected factors in accordance with the desired proportion of the variance reproduced by them (right column),
Significance threshold—46, 88
Main ComponentsEigenvaluesContribution to the ResultTotal Contribution
Meaning 12.81393.7540 %93.7540%
Meaning 20.1575.2352 %
Meaning 30.0301.01 %
Final factors
(Varimax method)
Significance threshold 0.30
VariablesFactor
Energy taxes0.9822
Transport taxes0.9451
Taxes on Pollution/Resources0.9770
Source: Source: adapted with permission from [59]. Copyright 2022, Eurostat.
Publisher’s Note: MDPI stays neutral with regard to jurisdictional claims in published maps and institutional affiliations.