Article

A Meta-Analysis of Soil Organic Carbon Response to Livestock Grazing in Grassland of the Tibetan Plateau

1
State Key Laboratory of Plateau Ecology and Agriculture, Qinghai University, Xining 810016, China
2
Key Laboratory of Restoration Ecology for Cold Regions Laboratory in Qinghai, Northwest Institute of Plateau Biology, Chinese Academy of Sciences, Xining 810008, China
3
Key Laboratory of Adaption and Evolution of Plateau Biota, Chinese Academy of Sciences, Xining 810008, China
*
Authors to whom correspondence should be addressed.
Sustainability 2022, 14(21), 14065; https://doi.org/10.3390/su142114065
Submission received: 24 September 2022 / Revised: 24 October 2022 / Accepted: 25 October 2022 / Published: 28 October 2022
(This article belongs to the Section Soil Conservation and Sustainability)

Abstract

:
Known as the “roof of the world”, the Tibetan Plateau hosts the largest pastoral alpine ecosystem in the world. Nevertheless, there is currently no consensus on how soil organic carbon (SOC) stock changes after livestock grazing on the grassland of this region. Here, a meta-analysis was performed based on 55 published studies to quantify the livestock grazing-induced changes in SOC stock (0–30 cm) in grassland on the Tibetan Plateau. The results showed that livestock grazing significantly increased bulk density by an average of 11.5%, indicating that significant soil compaction was caused by livestock grazing. In contrast, SOC content and stock significantly decreased by 14.4% and 11.9% after livestock grazing, respectively. The decline rate of SOC stock was higher in alpine meadow (−12.4%) than that in alpine steppe (−8.8%), but there was no significant difference between the two rates. The SOC stocks decreased by 10.1%, 6.2% and 20.1% under light grazing, moderate grazing and heavy grazing, respectively. The decline rate of SOC stock under moderate grazing was significantly lower than that under heavy grazing. For different livestock types, it was observed that yak grazing significantly decreased SOC stock by 15.3%. Although the decline rate induced by yak grazing was higher than those induced by Tibetan sheep grazing and mixed grazing, no significant difference was detected among them. Similarly, the grazing-induced SOC declines also did not differ significantly among subgroups of grazing season. The positive relationships between SOC stock and plant biomass indicated that the decreased plant biomass was a likely reason for the declined SOC stock under grazing condition. The findings suggested that moderate grazing with Tibetan sheep in the warm season may minimize SOC losses from grazing activities in alpine grassland on the Tibetan Plateau.

1. Introduction

As one of the most widespread ecosystems worldwide, grassland plays a vital role in the terrestrial carbon (C) cycle [1]. Soil is the major C reservoir of grassland, containing about 10–30% of the global soil organic C (SOC) pool [2,3]. Therefore, the changes in SOC pool of grassland may considerably influence the concentration of atmospheric CO2, which is a key factor driving global climate change [4]. Furthermore, SOC has many positive impacts on soil quality and is acknowledged as a pivotal indicator of grassland health [5]. Decline of the SOC pool may lead to poor habitats for plants and then hinder the development of animal husbandry [6]. Consequently, maintaining or enhancing SOC stock through proper management practices in a grassland ecosystem becomes a promising method to address the global climate change and food shortage [1,7].
Globally, grassland is often used for haying, livestock grazing and reclamation. Since all the land-use forms are intensively managed, whether grassland soil is sink or source of atmospheric CO2 is still debated [1]. As the primary anthropogenic activity in grassland, livestock grazing not only provides meat and dairy products for human society, but also affects the structure and function of the ecosystem [8]. It has been demonstrated that the balance between the inputs and outputs of SOC will be altered by livestock grazing, leading to variations in SOC stock [9]. Although the impacts of livestock grazing on SOC dynamics have attracted much attention, there is still no consensus on how SOC pool vary after livestock grazing because the climatic condition, grassland type and grazing strategy differed among study regions [9,10]. For example, McSherry [11] conducted a global meta-analysis of grazing effects on SOC stock and found that grazing intensity had different impacts on SOC stock in C3-dominated and C4-dominated grasslands. Dlamini [12] pointed out that the grazing-induced reductions in SOC stock in dry regions (annual precipitation < 600 mm) and acidic soils (pH ≤ 5) were higher than those in wet regions (annual precipitation > 1000 mm) and alkaline soils (pH ≥ 7). Due to the spatial heterogeneity of climatic condition, soil property and grassland biome, the response of SOC stock to livestock grazing should also be estimated from a regional perspective to better understand the mechanisms controlling soil C cycle under grazing conditions.
Known as the “roof of the world”, the Tibetan Plateau hosts the largest pastoral alpine ecosystem in the world [13]. The dominant ecosystems on this plateau are alpine grassland, which is an essential component of the global grassland biomes and has been grazed by domestic yak and Tibetan sheep for thousands of years [14]. The two major grassland types on the Tibetan Plateau are alpine meadow and alpine steppe, which are dominated by Kobresia (Cyperaceae) species and Stipa (Poaceae) species, respectively [13]. Both grassland types are sensitive to grazing disturbance under the unique alpine environment [13,14]. It is reported that almost 40% of alpine grasslands on the Tibetan Plateau have been degraded, which are mainly attributed to overgrazing [15]. In order to explore optimal management practice, numerous field trials have been conducted to investigate the effects of grazing on plant and soil characteristics in alpine grassland of the Tibetan Plateau [16]. The response of SOC stock to grazing strategy is one of the research focuses [17,18,19]. Unfortunately, uncertainties remain regarding how SOC stock changes after livestock grazing because the observations differ considerably among case studies [20,21]. Therefore, a systematic synthesis is urgently required to elucidate the response of SOC stock to livestock grazing in alpine grassland of the Tibetan Plateau. Furthermore, the SOC stock was mainly calculated based on soil volume in previous studies [17,18]. This method may overestimate the grazing-induced SOC variation because bulk density (BD) usually increase after grazing [22,23]. For this reason, it is desirable to estimate SOC stock according to the equivalent soil mass method, which has been proved to generate more accurate results when assessing the variation of SOC stock induced by management practice or land-use change [23].
Here, a meta-analysis was performed based on the dataset collected from 55 published studies to assess the response of SOC stock to livestock grazing in alpine grassland of the Tibetan Plateau. Considering the potential increase in BD after grazing, soil mass correction of SOC stock was performed using the equivalent soil mass method. Since plant productivity is a key factor affecting both soil physical properties and SOC inputs in grassland ecosystem [24,25], the changes in plant above-ground and below-ground biomass after grazing were also investigated. The dataset was divided into four groups grassland type, grazing intensity, livestock type and grazing season, to separately evaluate their impacts on SOC stock. The main objectives of our study were to: (a) quantify the change in SOC stock after livestock grazing; (b) clarify the relationship between SOC stock and plant biomass under grazing conditions; (c) provide suggestion for soil C management in alpine grassland of the Tibetan Plateau.

2. Materials and Methods

2.1. Study Area

The Tibetan Plateau is located in southwest China (26°00′–39°47′ N, 73°19′–104°47′ E) with a mean elevation of 4000 m and a terrain inclining from northwest to southeast. This area has a typical plateau climate which has many unique features such as intense solar radiation, longer sunshine duration, lower air temperature, lower barometric pressure, less cloud cover and spatial inhomogeneity of precipitation. The total area of this plateau is approximately 2.5 million km2 and nearly 60% of the area is covered by grassland, including mainly meadow (5.47 × 10⁵ km2) and steppe (7.10 × 10⁵ km2). Other important vegetation types on this plateau are forest and shrubland. The major soil types are Cryorthent, Calciudoll, Calcicryid and Eutroboralf (USDA soil taxonomy). Animal husbandry is the pillar industry on this plateau and livestock grazing is the main source of income for the local herdsmen [26,27].

2.2. Data Compilation

Peer-reviewed publications were searched through ISI Web of Science (http://apps.webofknowledge.com accessed on 22 January 2022) and China Knowledge Resource Integrated Database (CNKI, http://www.cnki.net, accessed on 22 January 2022). The combinations of keywords used for the literature search were: (grazing OR fencing OR grazing exclusion) AND (soil carbon OR soil organic carbon OR soil properties) AND (alpine grassland OR alpine meadow OR alpine steppe OR alpine pasture) AND (Tibetan Plateau OR Tibet Plateau OR Qinghai-Tibetan Plateau). The following criteria were set to select the appropriate observation:
(a)
study must be conducted in natural grassland rather than cultivated grassland;
(b)
an ungrazed treatment should be included in the experiments as a control, adjacent to the grazed treatment;
(c)
at least one of the following grazing strategies was stated: grazing intensity, livestock type, or grazing season;
(d)
grazing experiment lasted for at least one growing season;
(e)
SOC stock was given or could be calculated based on BD, SOC content and sampling depth for both grazed and ungrazed treatment;
(f)
the mean and sample size of the selected variable must be reported for both grazed and ungrazed treatment.
Since the soil layer of alpine grassland is generally thin (<40 cm) on the Tibetan Plateau, most studies have only focused on the livestock grazing-induced SOC variation in the upper 30 cm soil layer [20,21,22]. Hence, the data for BD and SOC content were gathered from 0 to 30 cm soil layer in the present meta-analysis. It should be noted that the data was only recorded once when different publications reported the same data at one experimental site. Finally, a total of 136 paired observations from 55 publications were compiled to estimate the effect of livestock grazing on SOC stock in alpine grassland of the Tibetan Plateau (Figure 1).
The collected dataset was grouped into alpine meadow and alpine steppe, the two main grassland types on the Tibetan Plateau. The grazing intensity was classified into light grazing (LG), moderate grazing (MG) and heavy grazing (HG) according to the original description by the authors [3]. To evaluate the impact of livestock type on SOC stock, the livestock type was divided into yak, Tibetan sheep and yak mixed with Tibetan sheep. Three subgroups were also established for grazing season (annual grazing, AG; warm-season grazing, WSG; and cold-season grazing, CSG). Information on the location, elevation, mean annual temperature (°C), mean annual precipitation (mm), above-ground biomass (g m−2) and below-ground biomass (g m−2) of the plant community at each experimental site were also gathered if they were reported (Table S1). The raw data were extracted from the text, tables, figures and appendices of the publications. GetData Graph Digitizer v.2.25 (http://www.getdata-graph-digitizer.com/index.php accessed on 22 January 2022) was used to obtain data which were presented graphically [28].

2.3. Calculation of SOC Stock

The minimum equivalent soil mass method, which adjusted soil mass to the lightest soil mass across different treatments at an experimental site, was applied to calculate SOC stock in this meta-analysis [24]. The first step of this method was to calculate soil mass per unit area in a certain soil layer (MS1, Mg ha−1) at both ungrazed and grazed plots for each study:
M S 1 = B D × H × 100
where BD (g cm−3) and H (cm) are the bulk density and the thickness of soil layer, respectively. The next step was to compare MS1 of different treatments to find out which treatment had the lightest soil mass. This soil mass was deemed as the equivalent soil mass (MS2, Mg ha−1). For other treatments, a certain quantity of soil mass (MS3, Mg ha−1) must be subtracted from MS1 to obtain MS2:
M S 2 = M S 1 M S 3
The last step was to calculate SOC stock in equivalent soil mass according to the following two equations:
S O C S = S O C C o n × M S × 0 . 001
S O C S 2 = S O C S 1 S O C S 3
where SOCS (Mg ha−1) is the SOC stock; SOCCon (g kg−1) is the SOC content; SOCS1, SOCS2 and SOCS3 (Mg ha−1) are the SOC stocks of MS1, MS2 and MS3, respectively. Therefore, SOCS2 was the SOC stock in equivalent soil mass. The content of soil organic matter (SOM) was converted to that of SOC by multiplying a coefficient of 0.58 when studies only reported the content of SOM [29]. For studies only reporting SOC content but not measuring BD, empirical equations were established based on the relationships between SOC content and BD for both ungrazed and grazed treatments to obtain the missing BD (Figure S1).

2.4. Meta-Analysis

The natural log-transformed response ratio (RR) was used as effect size to examine the differences in soil and plant characteristics between ungrazed treatment and grazed treatment [3]:
R R = l n ( X ¯ G X ¯ U G ) = l n ( X ¯ G ) l n ( X ¯ U G )
where X ¯ G and X ¯ U G represent the mean in grazed treatment and ungrazed treatment, respectively.
In the meta-analysis, the weight of individual observation is vital to effect size estimation and subsequent inference, since sampling variance was not reported in some compiled studies and the variance-based weighting function could also assign extreme weight to a few individual observations [30]. Similar to other studies [30,31], the number of replications was used to weight the effect size in the present meta-analysis:
W = n G × n U G n G + n U G
where W is the weight of each observation; nG and nUG indicate the number of replication in grazed treatment and ungrazed treatment, respectively.
In this meta-analysis, publication bias was tested using funnel plot. The potential asymmetry of the funnel plot was examined through Egger’s regression test (Figure S2). The means and 95% confidence intervals (CIs) of effect size were used to assess the response of each variable to livestock grazing. The mean effect size was converted to the percentage change on the basis of (exp(RR) − 1) × 100% to present the change in variable after livestock grazing [3]. A positive value implied that a variable increased after livestock grazing, whereas a negative value suggested that livestock grazing decreased a variable. The impact of livestock grazing was considered to be significant if the 95% CIs did not overlap with zero. The means of different subgroups were deemed significantly different from one another if their 95% CIs did not overlap [3]. The Metafor package in R v.4.0.3 was employed to conduct the meta-analysis [32,33].

3. Results

3.1. Changes in BD after Livestock Grazing

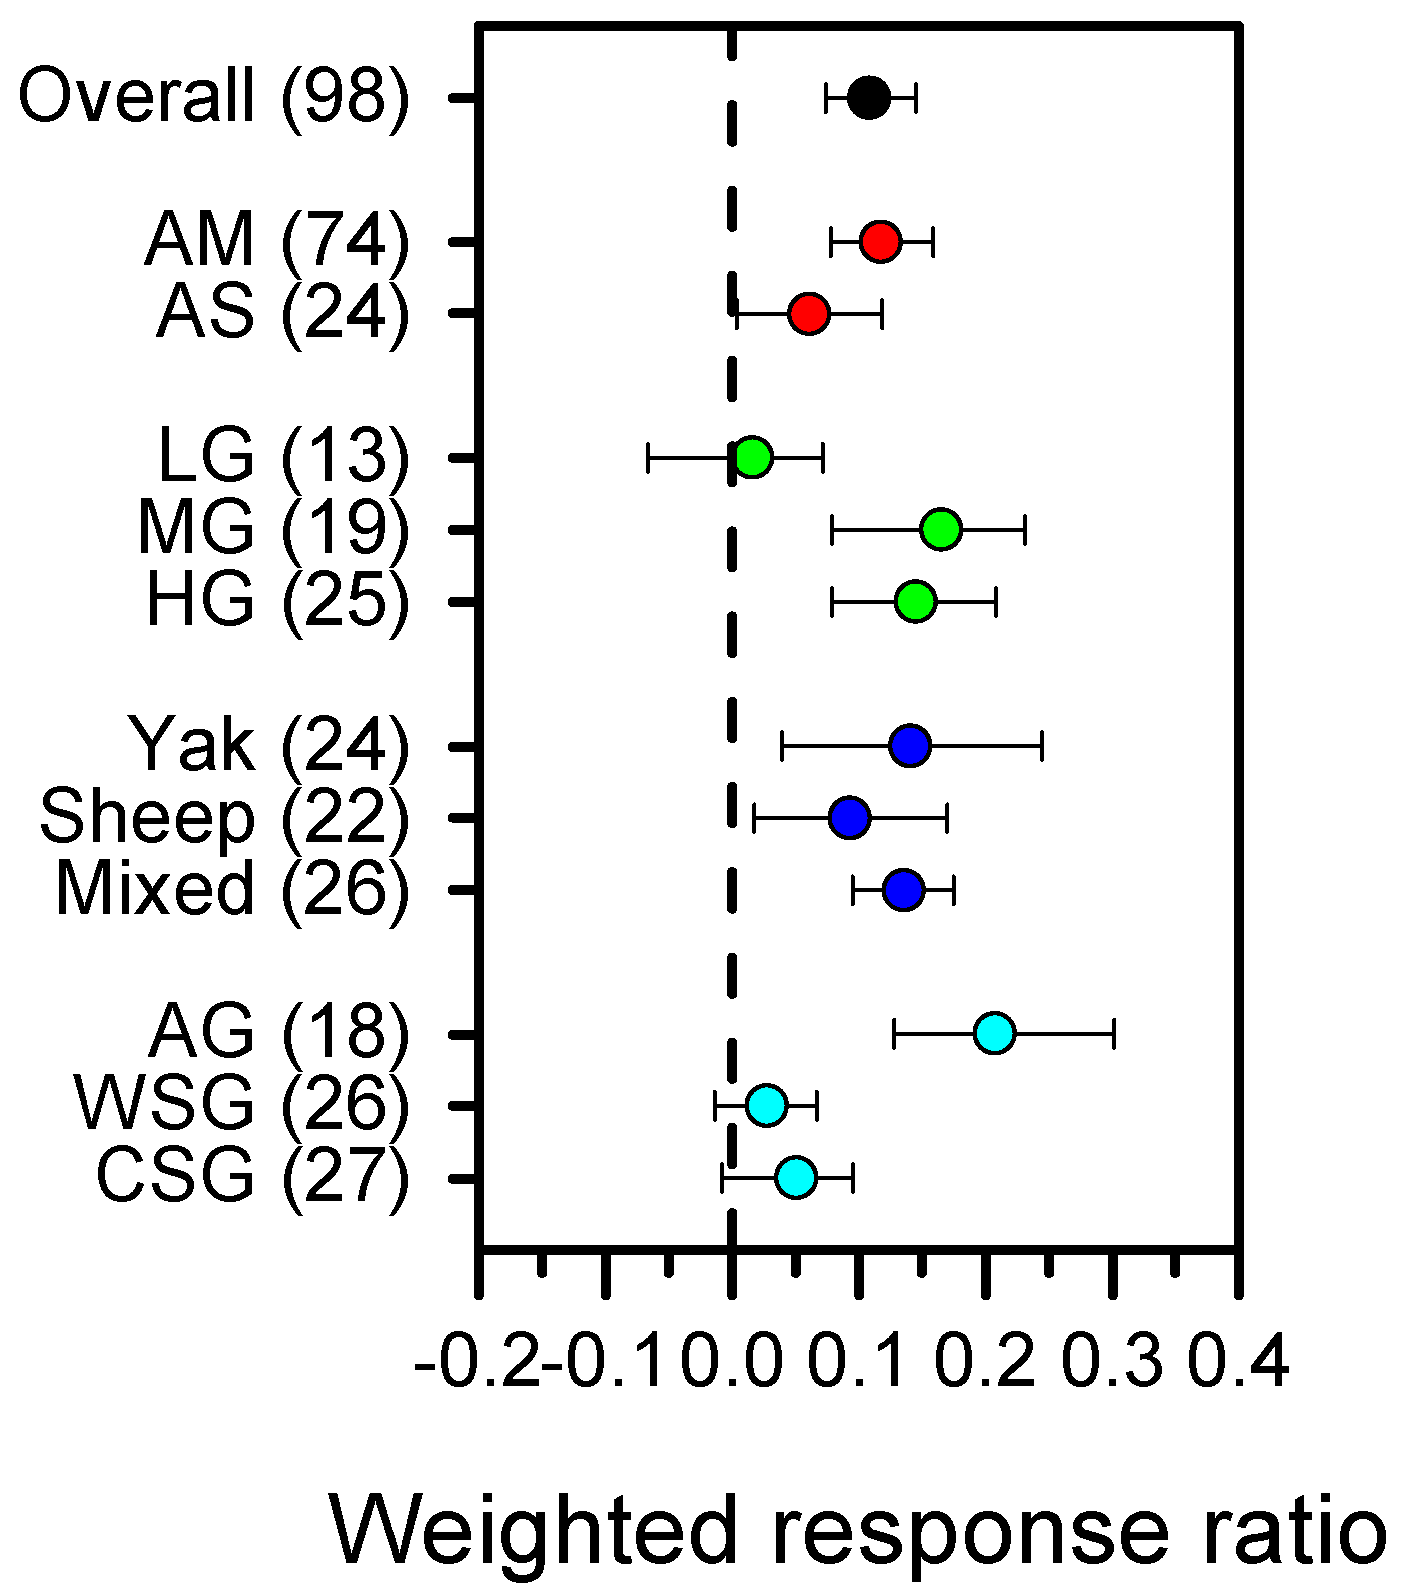
Across all the observations, the mean effect size of BD was 0.11 (95% CIs, 0.07 to 0.15), indicating that BD in grazed treatments was 11.5% (95% CIs, 7.7 to 15.6%) higher than that in ungrazed treatment (Figure 2). The increase in BD of alpine meadow was 12.5% (95% CIs, 8.1 to 17.2%), which was almost two times higher than that of alpine steppe. However, the two changes did not differ significantly as indicated by their overlapped 95% CIs. An intensity of light grazing (LG) did not induce a significant increase in BD, while moderate grazing (MG) and heavy grazing (HG) significantly increased BD by 18.0% (95% CIs, 8.2 to 26.1%) and 15.7% (95% CIs, 8.3 to 23.1%), respectively. For livestock type, yak grazing resulted in the highest increase in BD. The increases in BD were 23.1% (95% CIs, 13.7 to 35.2%) under annual grazing (AG), 2.8% (95% CIs, −1.4 to 6.9%) under warm-season grazing (WSG) and 5.2% (95% CIs, −0.8 to 10.0%) under cold-season grazing (CSG), respectively. Nevertheless, the change was only significant under AG.

3.2. Changes in SOC Content and Stock after Livestock Grazing

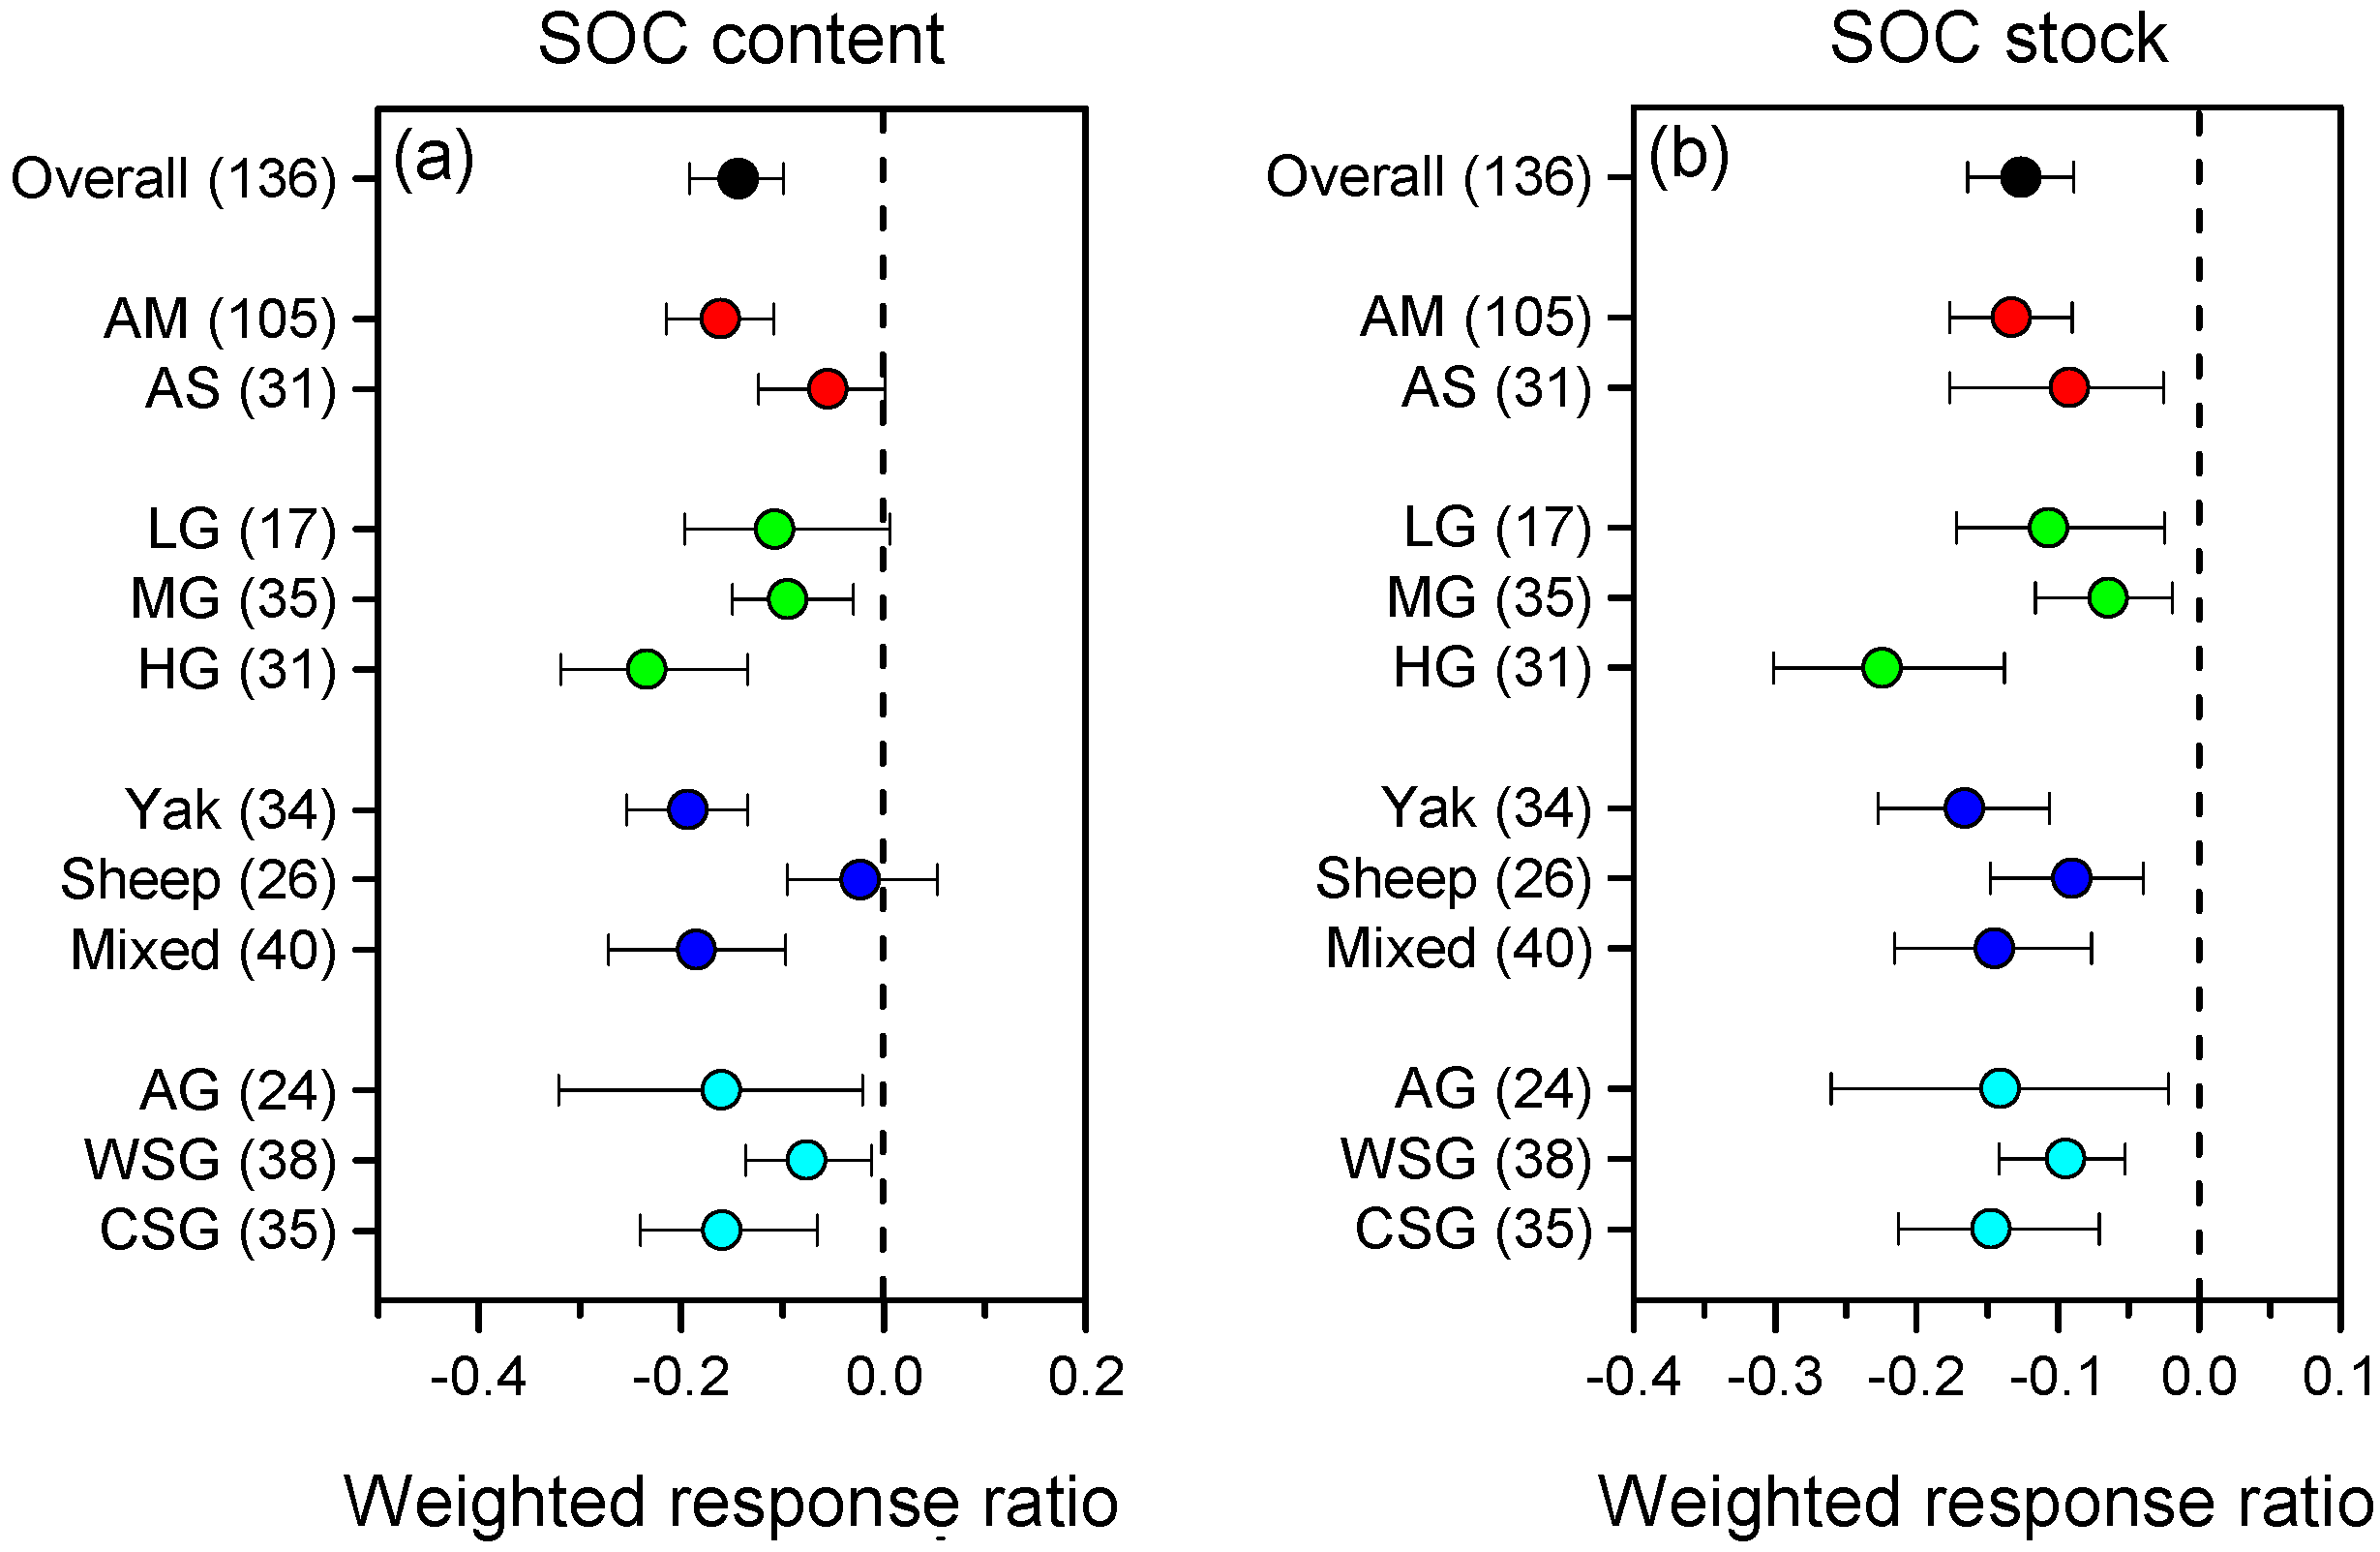
Overall, livestock grazing significantly decreased SOC content by 14.4% (95% CIs, −17.5 to −9.4%) (Figure 3a). Compared with the findings of previous studies (Table 1 [34,35,36,37,38]), it was observed that the decline rate of SOC content in this study was higher than those evaluated at the global scale, but was comparable to that reported by Liu et al. [39], who also took the Tibetan Plateau as the study area. In alpine meadow, a significant reduction of −14.8% (95% CIs, −19.3 to −10.3%) was detected for SOC content. In contrast, the change in SOC content was not significant in alpine steppe, as indicated by the overlapped 95% CIs and zero. Among different grazing intensities, it was observed that HG and MG caused the highest and lowest reductions in SOC content, respectively. With respect to livestock type, the highest reduction in SOC content was found under yak grazing with an reduction rate of −17.6% (95% CIs, −22.4 to −12.6%). By contrast, sheep grazing did not induce a significant reduction in SOC content. All the three grazing seasons resulted in significant reductions in SOC content. The largest reduction rate was −14.8% (95% CIs, −27.5 to −2.0%), observed under AG.
In general, the response of SOC stock to livestock grazing was similar to that of SOC content. On average, a significant reduction of −11.9% (95% CIs, −15.4 to −8.5%) was observed for SOC stock as a result of livestock grazing (Figure 3b). In general, the decline rate observed in this study was comparable to those assessed at the global scale [4,12] (Table 1). Grazing of both alpine meadow and alpine steppe caused significant losses of SOC stock. Although the reduction in SOC stock in alpine meadow was 1.4-times higher than that in alpine steppe, no significant difference was detected between them. For grazing intensity, the highest and lowest reductions in SOC stock were found under HG and MG, respectively. Similar to the impact of livestock type on SOC content, we found that yak grazing had the greatest effect on SOC stock, while sheep grazing resulted in the lowest change in SOC stock. With respect to grazing season, the highest reduction in SOC stock was observed under CSG rather than under AG or WSG.

3.3. Changes in Plant Biomass after Livestock Grazing

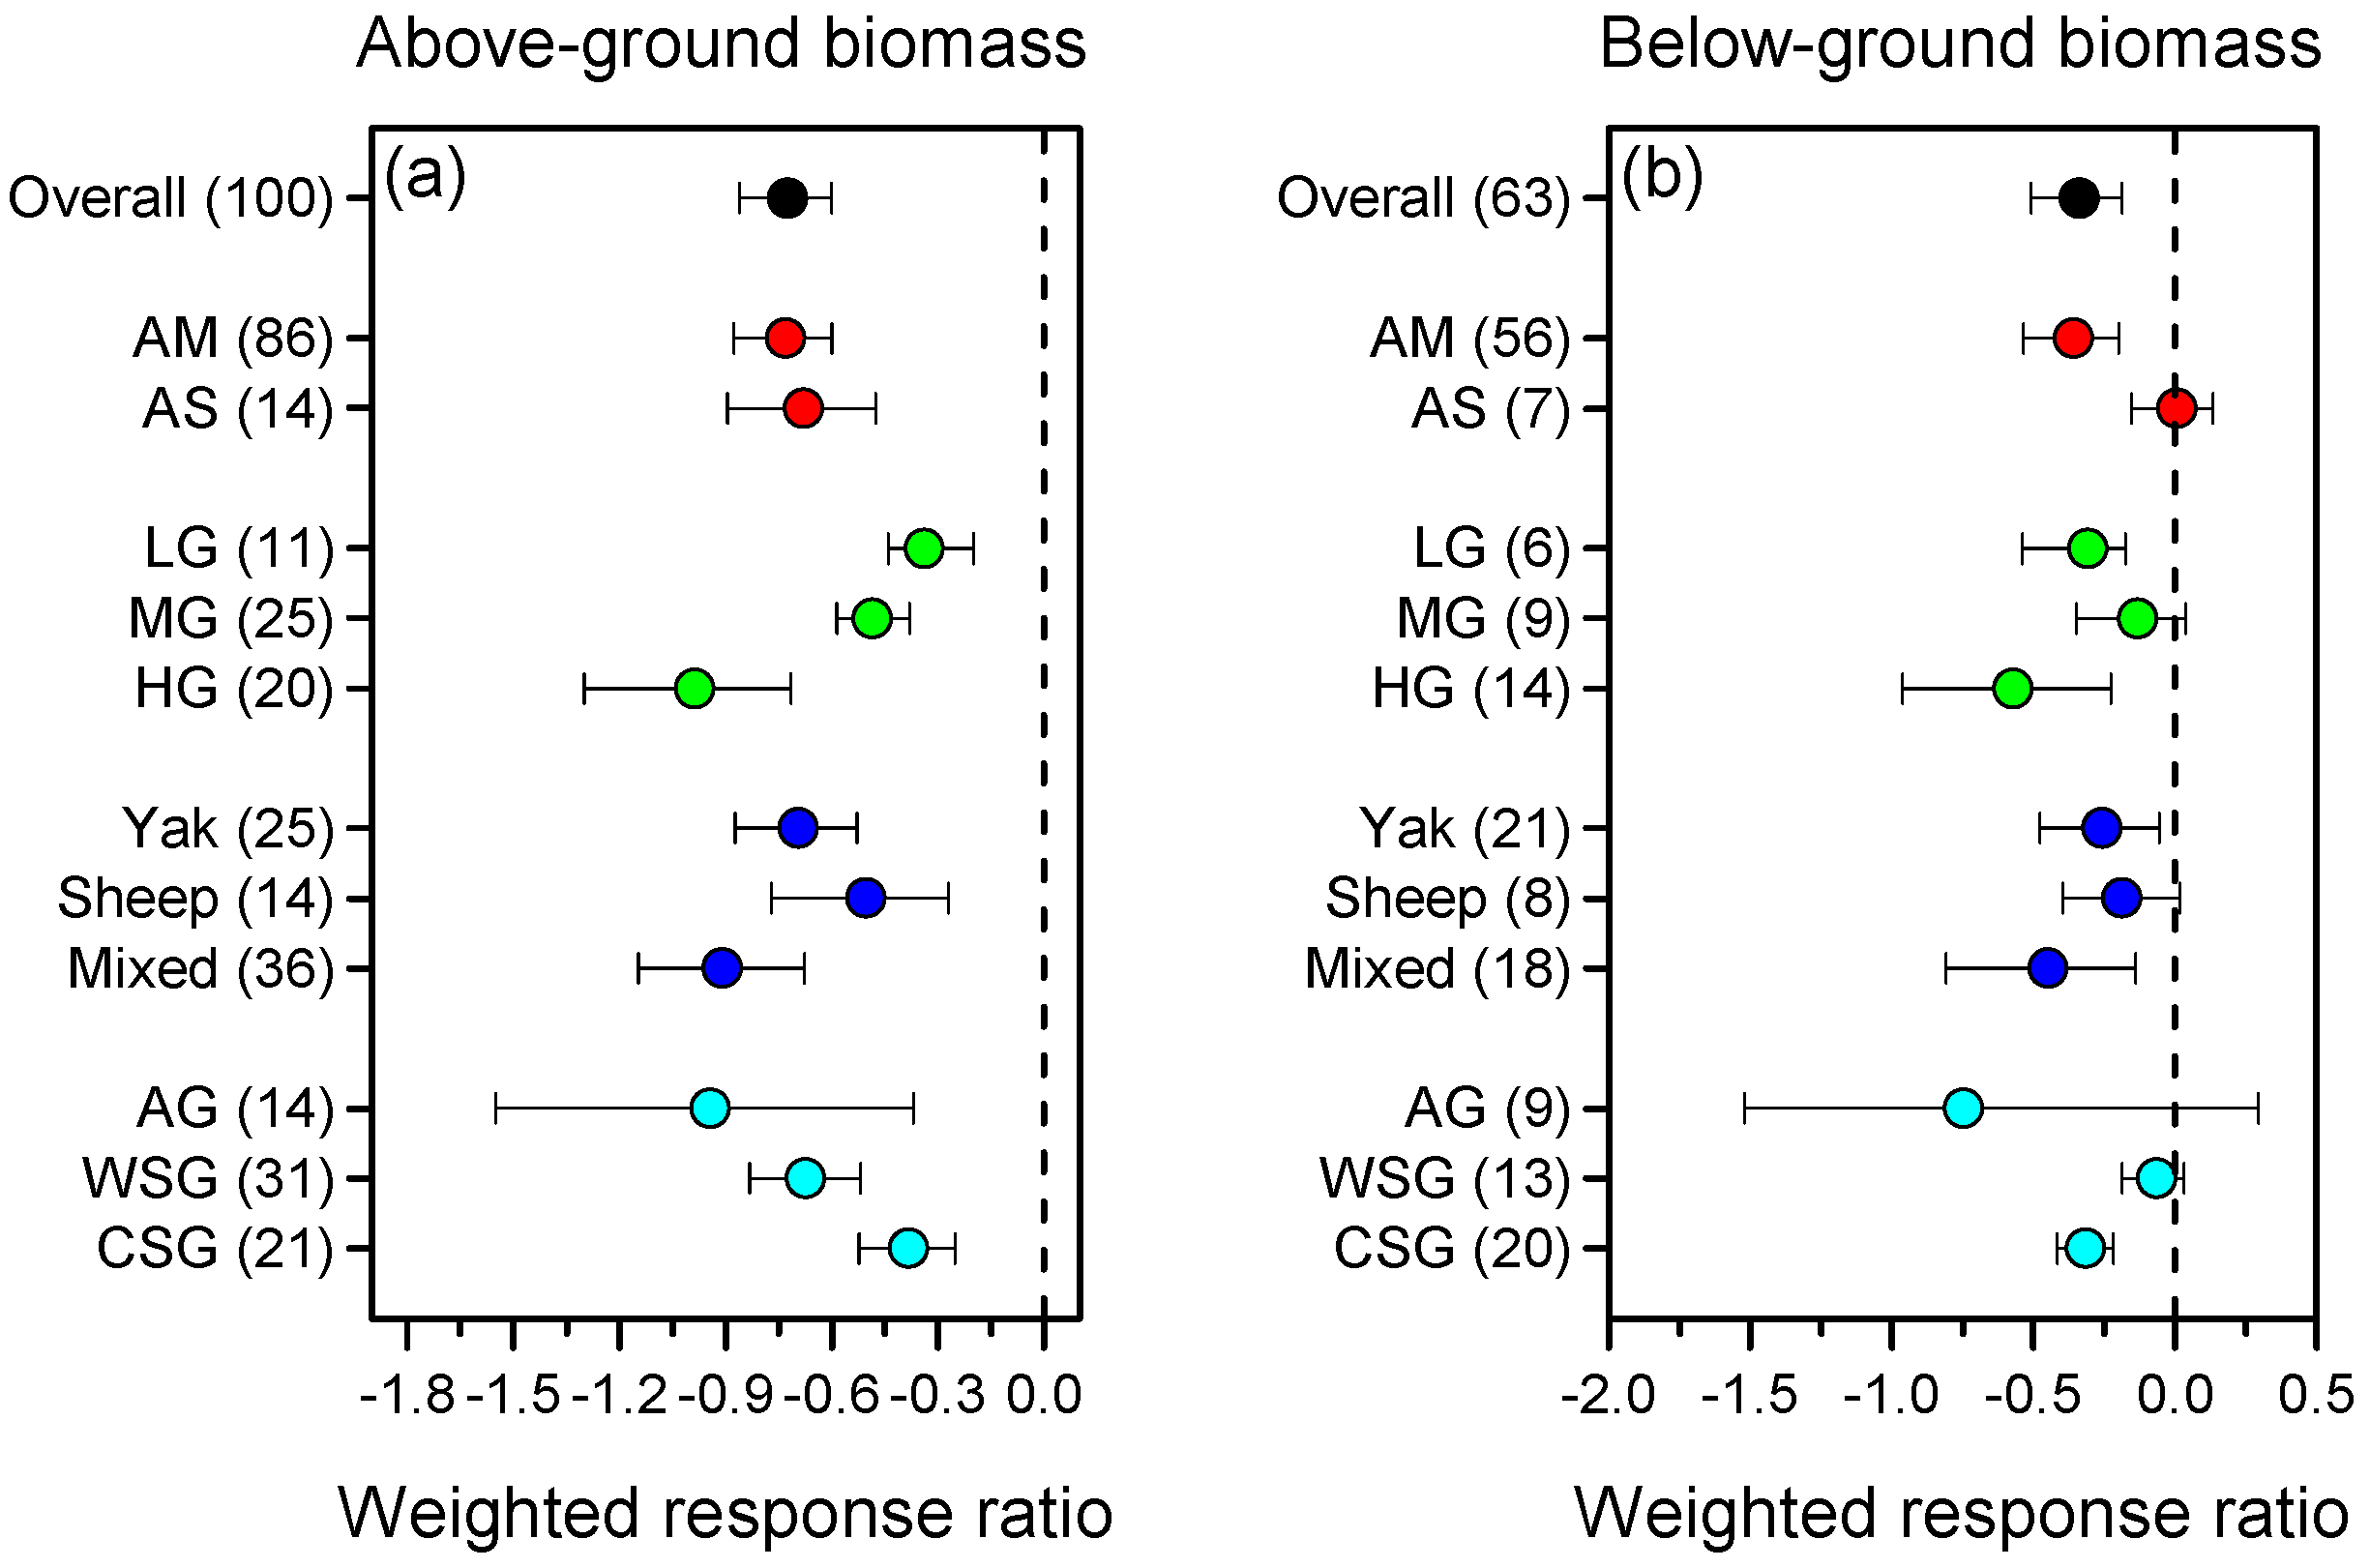
As illustrated in Figure 4a, livestock grazing caused a significant reduction in plant above-ground biomass. Across all the observations, livestock grazing significantly decreased above-ground biomass by 51.6% (95% CI, −57.7 to −45.2%). The reduction in above-ground biomass was higher in alpine meadow than that in alpine steppe, but no significant difference was detected between them as reflected by their overlapped 95% CIs. LG and MG significantly decreased above-ground biomass by 28.8% (95% CIs, −35.7 to −18.2%) and 38.4% (95% CIs, −44.3 to −31.7%), respectively, both of which were significantly lower than the reduction induced by HG. With respect to livestock type, yak grazing, sheep grazing and mixed grazing significantly reduced above-ground biomass by 50.1% (95% CIs, −58.2 to −41.1%), 39.6% (95% CIs, −52.2 to −21.2%) and 59.7% (95% CIs, −68.2 to −49.2%), respectively. However, the reductions in above-ground biomass did not differ significantly among livestock types. When grouped by grazing season, we observed that AG and CSG resulted in the highest and lowest reductions in above-ground biomass, respectively.
Livestock grazing significantly reduced plant below-ground biomass by an average of 28.7% (95% CIs, −39.8 to −16.9%) across all the observations (Figure 4b). The below-ground biomass of alpine meadow significantly decreased by 30.0% (95% CIs, −41.5 to −18.0%) due to grazing. By contrast, an increase of 0.8% (95% CIs, −14.1 to 14.6%) was observed for below-ground biomass after grazing of alpine steppe, but the overlapped 95% CIs and zero implied that the change was not significant. When grouped by grazing intensity, it was found that both LG and HG resulted in significant reductions in below-ground biomass. However, the change in below-ground biomass was not significant under MG. For livestock type, the highest and lowest reductions in below-ground biomass were detected under mixed and sheep grazing, respectively, which was similar to the variation characteristic of above-ground biomass. The reductions in below-ground biomass were −52.5% (95% CIs, −78.1 to 34.4%) under AG, −6.0% (95% CIs, −16.9 to 3.4%) under WSG and −27.0% (95% CIs, −34.0 to −19.3%) under CSG, respectively, but the variation was only significant under CSG.
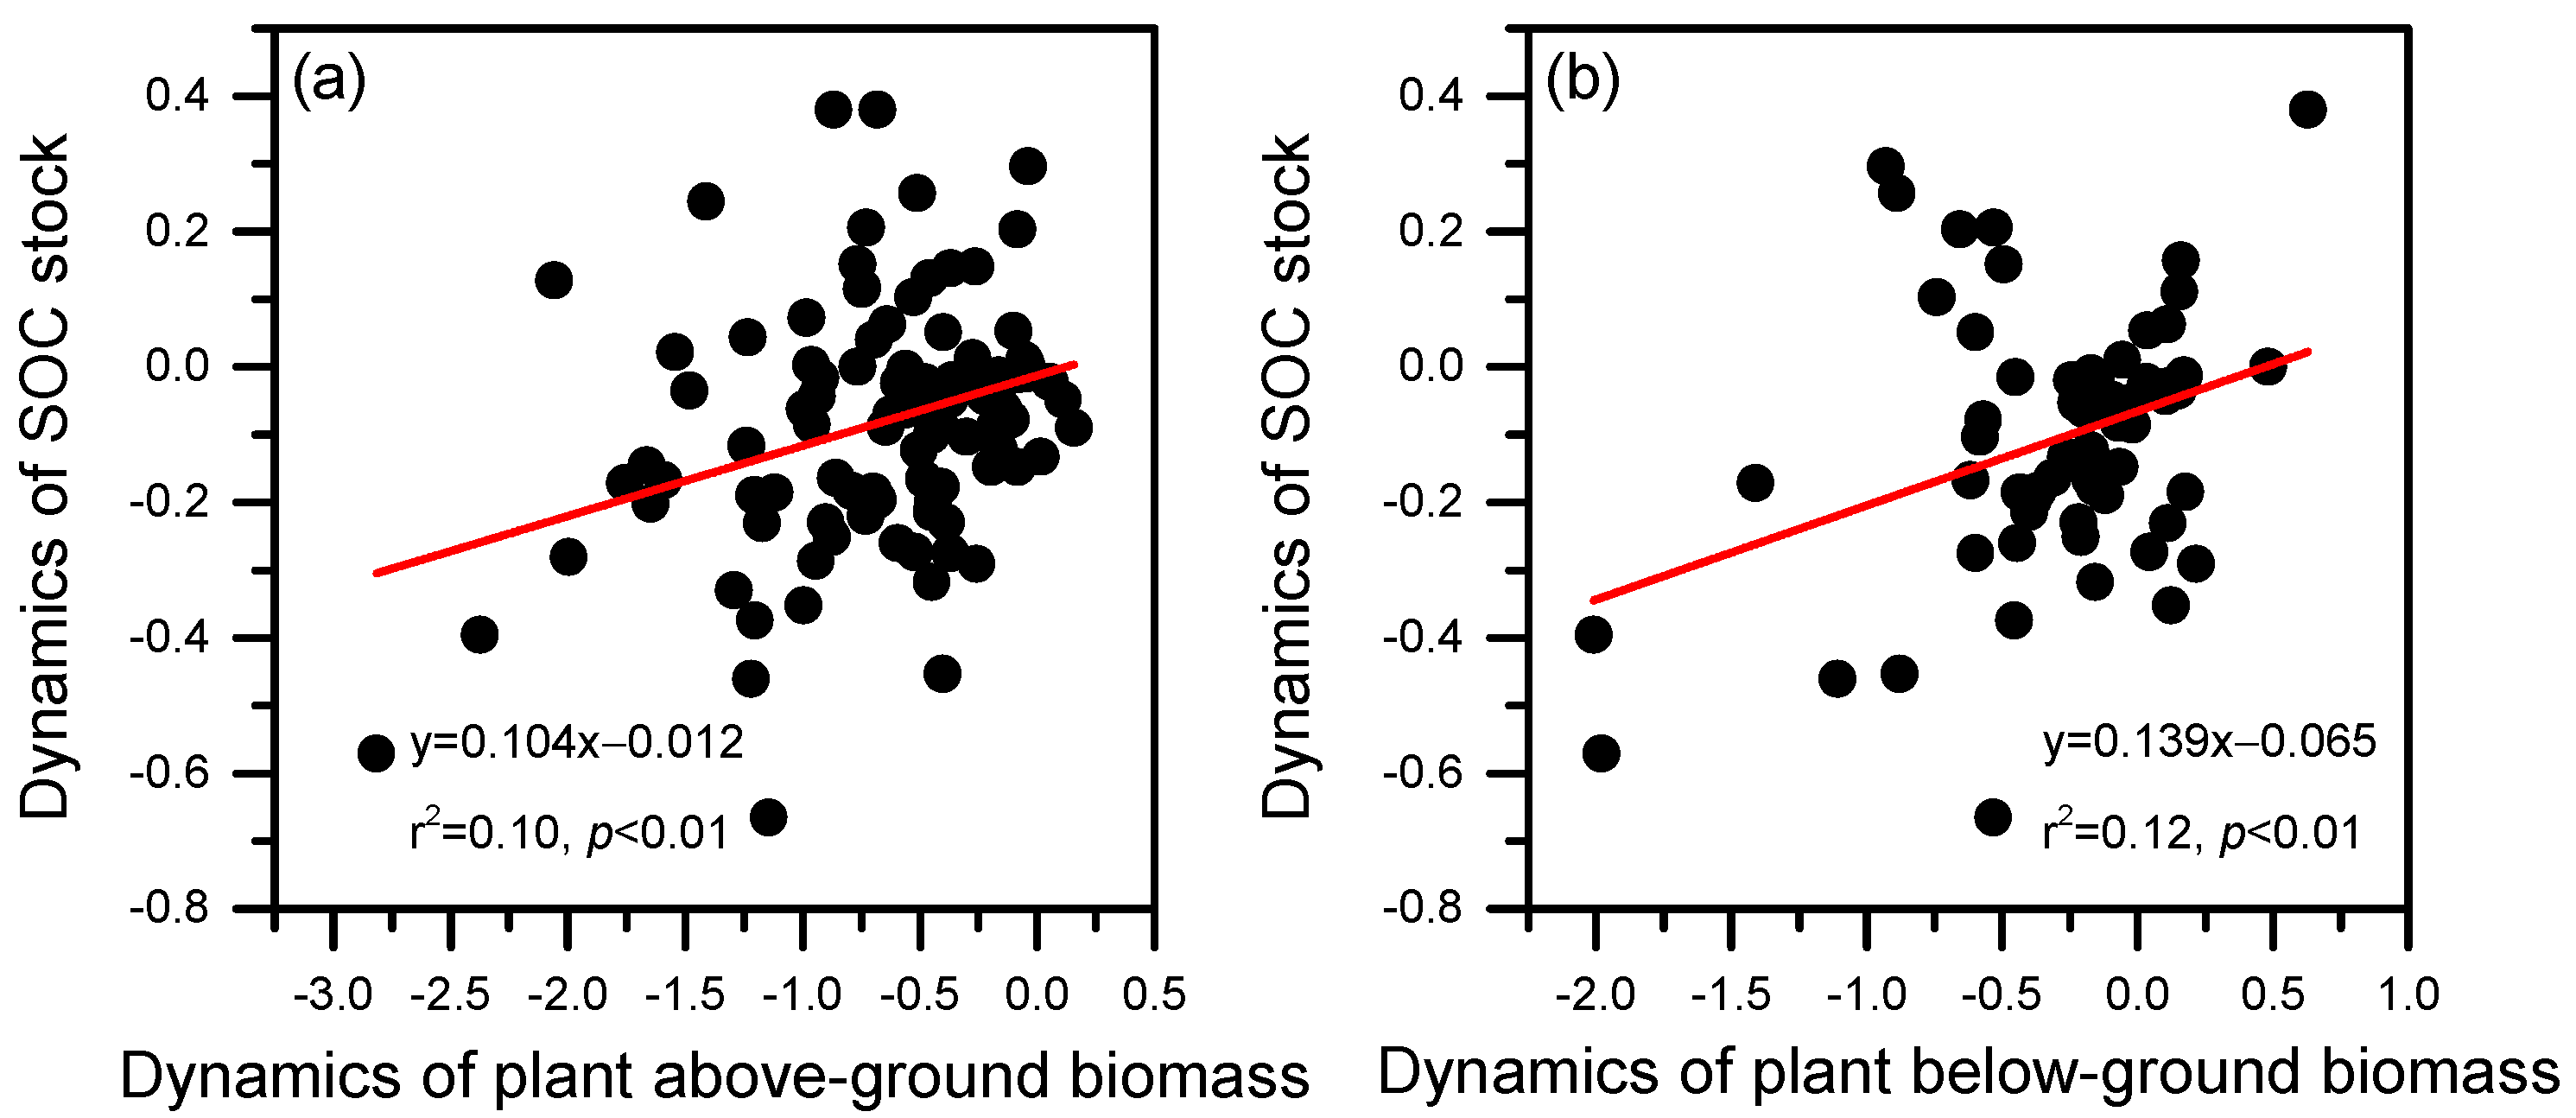
The relationships between SOC stock and plant biomass were illustrated in Figure 5. There was a significant positive relationship between the changes in SOC stock and those in plant above-ground biomass (r2 = 0.10, p < 0.01). Similarly, the dynamics of SOC stock were also positively correlated to those of plant below-ground biomass (r2 = 0.12, p < 0.01).

4. Discussion

4.1. Impact of Livestock Grazing on BD: Implication for Soil Compaction

The response of BD to livestock grazing in a grassland ecosystem has been widely investigated in previous studies, most of which reported that BD increased after grazing [34,36,40]. For instance, Byrnes et al. [34] reviewed the impact of grazing on soil health indicators of grassland at the global scale and found that BD significantly increased by 6.8% and 7.3% under annual grazing and rotational grazing, respectively. In a recent meta-analysis, Hao and He [36] found that grazing significantly increased BD by 3.1% in grassland of China. By comparison, the present meta-analysis showed that grazing led to a higher increasing rate of BD (11.5%) across all the observations, implying that severe soil compaction was induced by grazing in alpine grassland of the Tibetan Plateau. Livestock trampling, which exerts downward pressure through hoofs on the soil surface, is the primary reason responsible for the increased BD [41]. In general, livestock type is a key factor determining the trampling pressure because of the differences in body weight among livestock [42,43]. On the Tibetan Plateau, the major grazing livestock are yak and Tibetan sheep, with a body weight of approximately 200 kg and 40 kg, respectively [13,44]. Therefore, yak grazing possibly exerts stronger trampling pressure on per unit area of soil compared to sheep grazing [42,43], leading to a more significant effect on soil compaction (Figure 2). In addition to livestock trampling, the reduced SOM content is also a likely reason for the increased BD after grazing because SOM helps loosen soil and plays a key role in the formation of soil granular structure [45,46]. The positive relationships between BD and SOC content (Figure S1) partly supported this assertion. As an important form of physical soil degradation, soil compaction has many negative impacts on the grassland ecosystem, such as reducing the water infiltration rate and limiting the development of the root system [47]. In this case, management practices such as grazing exclusion and rotational grazing can be applied to ameliorate the grazing-induced soil compaction in alpine grassland on the Tibetan Plateau.

4.2. Losses of SOC Pool after Livestock Grazing: Rate and Potential Mechanism

Alpine grassland on the Tibetan Plateau stores more than 33.5 Pg SOC in the 0–75 cm soil layer and thus plays an important role in the regional C cycle [48]. However, the results of this study showed that the content and stock of SOC significantly decreased by 14.4% and 11.9% after grazing, respectively, indicating that soil of alpine grassland on the Tibetan Plateau is a source of atmospheric CO2 under grazing disturbance. Similarly, existing syntheses also observed that livestock grazing led to SOC losses (Table 1). For example, In a global meta-analysis, Eze et al. [4] pointed out that SOC stock in the 0–40 cm soil layer significantly reduced by 11.9% after grazing. However, previous studies mainly evaluated SOC stock using the equivalent soil volume method. As shown in Figure S3, the decline rate of SOC stock quantified based on soil volume was only −7.0% (95% CIs, −10.2 to −3.9%), 41.1% lower compared to that estimated according to soil mass. The difference was mainly attributed to the increased BD after grazing. In this case, soil at the grazed site might have higher soil mass in a certain soil layer compared to that at the ungrazed site. Hence, it is recommended that the impact of livestock grazing on SOC stock should better be quantified through the equivalent soil volume method [12].
The decline of SOC stock after grazing in this study can be explained by the following mechanisms. First and foremost, grazing can directly decrease plant above-ground biomass through livestock intake. The growth of herbage can be stunted by rodent (e.g., Ochotona curzoniae) activities, soil compaction and the expansion of poisonous weeds (e.g., Ligularia virgaurea) when grassland degradation is caused, leading to the declines in both above- and below-ground productivity of the plant community [6]. As a consequence, the inputs of SOM from plant will be decreased. In this meta-analysis, grazing significantly decreased plant above-ground biomass and below-ground biomass by 51.6% and 28.7%, respectively (Figure 4). Positive relationships were detected between the dynamics of SOC stock and those of plant biomass (Figure 5), indicating that SOC pool and plant biomass were tightly linked under grazing condition. Moreover, the changes in SOC stock showed a closer relationship with plant below-ground biomass (r2 = 0.12, p < 0.01) compared to plant above-ground biomass (r2 = 0.10, p < 0.01). The finding supported the widely accepted viewpoint that the root system is a more important source of SOC than the above-ground part in the grassland ecosystem [9]. Secondly, livestock trampling may destroy soil aggregates, which can physically protect SOC from being decomposed by soil microorganisms. For instance, Wang et al. [49] observed that MG and HG significantly decreased the stability of soil aggregates compared to ungrazed treatment in an alpine marsh meadow on the eastern Tibetan Plateau. They also found a positive relationship between SOC content and the stability of soil aggregates. Thirdly, a grazing-induced reduction in plant coverage will not only increase soil temperature, but also aggravate soil erosion. In this case, SOC pool will decrease due to the accelerated SOC decomposition as well as soil erosion [9,50]. Some studies also suggested that the formation of SOM was limited by soil nitrogen (N) supply under grazing condition, as indicated by the increased soil C:N ratio after grazing [9,51]. Piñeiro et al. [9] further claimed that the decoupled C and N cycles induced by grazing was another potential mechanism resulting in SOC depletion. Nevertheless, the results of this study showed that livestock grazing had little impact on soil C:N ratio (mean effect size, −0.02, 95% CIs, −0.05 to 0.02, Figure S4). In a recent meta-analysis, Liu et al. [39] even found that grazing of alpine grasslands significantly decreased soil C:N ratio by 3.4% on the Tibetan Plateau. These findings implied that livestock grazing could not cause N limitations for SOM formation in this region.

4.3. Livestock Grazing-Induced SOC Decline in Different Classified Groups: Suggestion for Soil C Management in Alpine Grassland of the Tibetan Plateau

Occupying more than 40% total area of the Tibetan Plateau, alpine meadow and alpine steppe store approximately 23.2 Pg SOC, which accounts for 69.3% of the total SOC pool across the Tibetan grassland [48]. In the last two decades, lots of efforts have been made to quantify the response of SOC pool to environmental changes such as warming, N addition and livestock grazing in both alpine meadow and alpine steppe of the Tibetan Plateau [18,52,53]. Using a meta-analysis approach, Fu and Shen [52] detected that neither the SOC content of alpine meadow nor that of alpine steppe was affected by N addition. In contrast, whether the SOC pool shows differential responses to livestock grazing between the two grassland types remains unclear. In this meta-analysis, the results showed that livestock grazing led to significant reductions in SOC stock in both alpine meadow and alpine steppe, while the decline rate did not differ significantly between the two grassland types. However, the average loss of SOC stock in alpine meadow (10.3 Mg ha−1) was higher compared to that in alpine steppe (9.8 Mg ha−1) after grazing (Table S2). This was possibly attributed to the differences in stocking rate and grazing duration between the two grassland types. In the compiled dataset, the average stocking rate and grazing duration in alpine meadow were 3.5 sheep ha−1 year−1 and 6.2 years, respectively, which were higher and longer than those in alpine steppe (2.3 sheep ha−1 year−1 and 4.0 years, respectively). The findings implied that soils of both alpine meadow and alpine steppe are sources of atmospheric CO2 under grazing disturbance.
In the present meta-analysis, the grazing strategies were classified by grazing intensity, livestock type and grazing season. Empirical evidence has indicated that these factors can modify SOC balance through influencing plant characteristics, soil nutrient content, or soil physical property [10,54,55]. However, the livestock grazing-induced SOC reductions did not differ significantly among subgroups for all the classifications (Figure 3). Although the results were unexpected, they partly supported the viewpoint of Piñeiro et al. [9], who claimed that grazing affects the controlling factors of SOC dynamics via a complex pathway. According to the mean effect size of SOC stock in each subgroup (Figure 3), we suggest that MG with Tibetan sheep in warm season is probably an optimal grazing regime for minimizing SOC losses from grazing activities. A further analysis indicated that such a grazing strategy had little impact on SOC stock (mean effect size, −0.08, 95% CIs, −0.20 to 0.03, n = 6). However, this speculation needs to be tested through conducting more field trials in the future because of the small sample size. Similarly, some studies have also suggested that MG, Tibetan sheep grazing and seasonal grazing are relatively ideal grazing regimes in alpine grassland of the Tibetan Plateau [28,37,56]. As previously mentioned, Tibetan sheep might cause less damage on soil physical property compared to yaks, creating a better soil environment for plant growth [43]. Sun et al. [28] found that plant biomass transferred from above-ground to below-ground and reached a maximize growth rate under MG. In this case, SOC inputs from root system were probably higher under MG than those under LG and HG. In addition, a more developed root system might release more root exudates into soil and then promote the activity of rhizosphere microorganisms. On this condition, the decomposition rate of plant litter and nutrient cycle could be accelerated [37]. The three mechanisms can also help to explain why seasonal grazing rather than AG is a more rational grazing strategy in this region.

5. Conclusions

The results of this meta-analysis showed that livestock grazing significantly increased BD by 11.5% across all the observations, demonstrating that soil compaction was caused by livestock grazing in alpine grassland of the Tibetan Plateau. Therefore, the equivalent soil mass method may be more appropriate than the equivalent soil volume method when estimating the grazing-induced changes in SOC stock. Overall, SOC stock significantly reduced by 11.9% after grazing. The reduced plant biomass was a likely reason for the declined SOC pool. The decline rate of SOC stock was higher in alpine meadow compared to that in alpine steppe, whereas there was no significant difference between the two rates. We also observed that the grazing-induced SOC reductions did not differ significantly among subgroups of grazing intensity, livestock type and grazing season. According to the mean effect size of SOC stock in each subgroup, it is recommended that moderate grazing with Tibetan sheep in warm season is a relatively ideal grazing strategy for minimizing SOC losses from grazing activity in alpine grassland of the Tibetan Plateau, but this needs more empirical evidence for verification.

Supplementary Materials

The following supporting information can be downloaded at: https://www.mdpi.com/article/10.3390/su142114065/s1, Table S1. Detailed information of literature compiled in this meta-analysis. MAT, MAP, GT, LT, GI, GS, GD represent mean annual temperature, mean annual precipitation, grassland type, livestock type, grazing intensity, grazing season and grazing duration, respectively; AM, AS, LG, MG, HG, AG, WSG and CSG represent alpine meadow, alpine steppe, light grazing, moderate grazing, heavy grazing, annual grazing, warm-season grazing and cold-season grazing, respectively; Table S2. Statistical summary of soil organic carbon (SOC) stock and its changes after grazing in alpine meadow (AM) and alpine steppe (AS); Figure S1. Relationships between bulk density (BD) and soil organic carbon (SOC) content in ungrazed (a: 0–10 cm; c: 10–20 cm; e: 20–30 cm) and grazed treatments (b: 0–10 cm; d: 10–20 cm; f: 20–30 cm); Figure S2. Funnel plots of changes in bulk density (BD) (a), soil organic carbon (SOC) content (b), SOC stock (c), plant above-ground biomass (AGB) (d) and below-ground biomass (BGB) (e). Results of publication bias tests using Egger’s regression are given (z and p values). p value > 0.05 indicates the absence of publication bias; Figure S3. Weighted response ratios of soil organic carbon (SOC) stock calculated based on soil volume (a); relationship between weighted response ratios of SOC stock calculated based on volume (SOC stockV) and those of SOC stock calculated based on mass (SOC stockM) (b); Figure S4. Relationships between the changes in soil carbon to nitrogen (C: N) ratio and grazing duration (a) as well as stocking rate (b).

Author Contributions

Conceptualization, X.L. and X.H.; methodology, Z.M. and W.Q.; software, Z.W. and X.H.; validation, Z.M. and W.Q.; formal analysis, W.Q.; investigation, X.L. and W.Q.; data curation, W.Q. and C.H.; writing—original draft preparation, Z.M. and X.L.; writing—review and editing, C.H. and X.H.; visualization, Z.W.; supervision, X.H.; project administration, C.H.; funding acquisition, Z.W., C.H. and X.L. All authors have read and agreed to the published version of the manuscript.

Funding

The work was funded by the National Natural Science Foundation of China (42067070, 32160278), the Natural Science Foundation of Qinghai Province of China (2020-ZJ-955Q) and the Open Project of State Key Laboratory of Plateau Ecology and Agriculture, Qinghai University (2020-ZZ-07).

Institutional Review Board Statement

Not applicable.

Informed Consent Statement

Not applicable.

Data Availability Statement

The data presented in this study are available on request from the corresponding authors.

Acknowledgments

We are grateful to all the researchers for their original data used in this meta-analysis.

Conflicts of Interest

The authors declare no conflict of interest.

References

  1. Poeplau, C. Grassland soil organic carbon stocks along management intensity and warming gradients. Grass Forage Sci. 2021, 76, 186–195. [Google Scholar] [CrossRef]
  2. Follett, R.F.; Reed, D.A. Soil carbon sequestration in grazing lands: Societal benefits and policy implications. Rangel. Ecol. Manag. 2010, 63, 4–15. [Google Scholar] [CrossRef] [Green Version]
  3. Zhou, G.; Zhou, X.; He, Y.; Shao, J.; Hu, Z.; Liu, R.; Zhou, H.; Hosseinibai, S. Grazing intensity significantly affects belowground carbon and nitrogen cycling in grassland ecosystems: A meta-analysis. Glob. Chang. Biol. 2017, 23, 1167–1179. [Google Scholar] [CrossRef] [PubMed]
  4. Eze, S.; Palmer, S.M.; Chapman, P.J. Soil organic carbon stock in grasslands: Effects of inorganic fertilizers, liming and grazing in different climate settings. J. Environ. Manag. 2018, 223, 74–84. [Google Scholar]
  5. Guillaume, T.; Bragazza, L.; Levasseur, C.; Libohova, Z.; Sinaj, S. Long-term soil organic carbon dynamics in temperate cropland-grassland systems. Agric. Ecosyst. Environ. 2021, 305, 107184. [Google Scholar]
  6. Li, Y.Y.; Dong, S.K.; Liu, S.; Wang, X.; Wen, L.; Wu, Y. The interaction between poisonous plants and soil quality in response to grassland degradation in the alpine region of the Qinghai-Tibetan Plateau. Plant Ecol. 2014, 215, 809–819. [Google Scholar] [CrossRef]
  7. Lal, R. Managing soils and ecosystems for mitigating anthropogenic carbon emissions and advancing global food security. BioScience 2010, 60, 708–721. [Google Scholar] [CrossRef] [Green Version]
  8. Zhao, Y.; Liu, Z.; Wu, J. Grassland ecosystem services: A systematic review of research advances and future directions. Landsc. Ecol. 2020, 35, 793–814. [Google Scholar]
  9. Piñeiro, G.; Paruelo, J.M.; Oesterheld, M.; Jobbágy, E.G. Pathways of grazing effects on soil organic carbon and nitrogen. Rangel. Ecol. Manag. 2010, 63, 109–119. [Google Scholar]
  10. Abdalla, M.; Hastings, A.; Chadwick, D.R.; Jones, D.L.; Evans, C.D.; Jones, M.B.; Rees, R.M.; Smith, P. Critical review of the impacts of grazing intensity on soil organic carbon storage and other soil quality indicators in extensively managed grasslands. Agric. Ecosyst. Environ. 2018, 253, 62–81. [Google Scholar] [CrossRef] [Green Version]
  11. McSherry, M.E.; Ritchie, M.E. Effects of grazing on grassland soil carbon: A global review. Glob. Chang. Biol. 2013, 19, 1347–1357. [Google Scholar] [CrossRef] [PubMed]
  12. Dlamini, P.; Chivenge, P.; Chaplot, V. Overgrazing decreases soil organic carbon stocks the most under dry climates and low soil pH: A meta-analysis shows. Agric. Ecosyst. Environ. 2016, 221, 258–269. [Google Scholar] [CrossRef]
  13. Mipam, T.D.; Zhong, L.L.; Liu, J.Q.; Miehe, G.; Tian, L.M. Productive overcompensation of alpine meadows in response to yak grazing in the eastern Qinghai-Tibet Plateau. Front. Plant Sci. 2019, 10, 925. [Google Scholar] [CrossRef] [PubMed] [Green Version]
  14. Miehe, G.; Miehe, S.; Kaiser, K.; Reudenbach, C.; Behrendes, L.; Duo, L.; Schlütz, F. How old is pastoralism in Tibet? An ecological approach to the making of a Tibetan landscape. Palaeogeogr. Palaeoclimatol. Palaeoecol. 2009, 276, 130–147. [Google Scholar] [CrossRef]
  15. Wang, Z.; Zhang, Y.; Yang, Y.; Zhou, W.; Gang, C.; Zhang, Y.; Li, J.; An, R.; Wang, K.; Odeh, I.; et al. Quantitative assess the driving forces on the grassland degradation in the Qinghai–Tibet Plateau, in China. Ecol. Inform. 2016, 33, 32–44. [Google Scholar] [CrossRef]
  16. Yang, Z.; Zhu, Q.; Zhan, W.; Xu, Y.; Zhu, E.; Gao, Y.; Li, S.; Zheng, Q.; Zhu, D.; He, Y.; et al. The linkage between vegetation and soil nutrients and their variation under different grazing intensities in an alpine meadow on the eastern Qinghai-Tibetan Plateau. Ecol. Eng. 2018, 110, 128–136. [Google Scholar] [CrossRef]
  17. Ji, L.; Qin, Y.; Jimoh, S.O.; Hou, X.; Zhang, N.; Gan, Y.; Luo, Y. Impacts of livestock grazing on vegetation characteristics and soil chemical properties of alpine meadows in the eastern Qinghai-Tibetan Plateau. Ecoscience 2020, 27, 107–118. [Google Scholar] [CrossRef]
  18. Sun, D.S.; Wesche, K.; Chen, D.D.; Zhang, S.H.; Wu, G.L.; Du, G.Z.; Comerford, N.B. Grazing depresses soil carbon storage through changing plant biomass and composition in a Tibetan alpine meadow. Plant Soil Environ. 2011, 57, 271–278. [Google Scholar] [CrossRef] [Green Version]
  19. Rui, Y.; Wang, S.; Xu, Z.; Wang, Y.; Chen, C.; Zhou, X.; Kang, X.; Lu, S.; Hu, Y.; Lin, Q.; et al. Warming and grazing affect soil labile carbon and nitrogen pools differently in an alpine meadow of the Qinghai–Tibet Plateau in China. J. Soils Sediments 2011, 11, 903–914. [Google Scholar] [CrossRef]
  20. Dong, Q.M.; Zhao, X.Q.; Wu, G.L.; Shi, J.J.; Wang, Y.L.; Sheng, L. Response of soil properties to yak grazing intensity in a Kobresia parva-meadow on the Qinghai-Tibetan Plateau, China. J. Soil Sci. Plant Nutr. 2012, 12, 535–546. [Google Scholar] [CrossRef] [Green Version]
  21. Shi, X.M.; Li, X.G.; Li, C.T.; Zhao, Y.; Shang, Z.H.; Ma, Q. Grazing exclusion decreases soil organic C storage at an alpine grassland of the Qinghai–Tibetan Plateau. Ecol. Eng. 2013, 57, 183–187. [Google Scholar] [CrossRef]
  22. Ellert, B.H.; Bettany, J.R. Calculation of organic matter and nutrients stored in soils under contrasting management regimes. Can. J. Soil Sci. 1995, 75, 529–538. [Google Scholar] [CrossRef] [Green Version]
  23. Lee, J.; Hopmans, J.W.; Rolston, D.E.; Baer, S.G.; Six, J. Determining soil carbon stock changes: Simple bulk density corrections fail. Agric. Ecosyst. Environ. 2009, 134, 251–256. [Google Scholar] [CrossRef]
  24. Gould, I.J.; Quinton, J.N.; Weigelt, A.; De Deyn, G.B.; Bardgett, R.D. Plant diversity and root traits benefit physical properties key to soil function in grasslands. Ecol. Lett. 2016, 19, 1140–1149. [Google Scholar] [CrossRef]
  25. O’brien, S.L.; Jastrow, J.D.; Grimley, D.A.; Gonzalez-Meler, M.A. Moisture and vegetation controls on decadal-scale accrual of soil organic carbon and total nitrogen in restored grasslands. Glob. Chang. Biol. 2010, 16, 2573–2588. [Google Scholar] [CrossRef]
  26. Che, M.; Chen, B.; Innes, J.L.; Wang, G.; Dou, X.; Zhou, T.; Zhang, H.; Yan, J.; Xu, G.; Zhao, H. Spatial and temporal variations in the end date of the vegetation growing season throughout the Qinghai–Tibetan Plateau from 1982 to 2011. Agric. For. Meteorol. 2014, 189, 81–90. [Google Scholar] [CrossRef]
  27. Wang, C.; Guo, H.; Zhang, L.; Qiu, Y.; Sun, Z.; Liao, J.; Liu, G.; Zhang, Y. Improved alpine grassland mapping in the Tibetan Plateau with MODIS time series: A phenology perspective. Int. J. Digit. Earth 2015, 8, 133–152. [Google Scholar] [CrossRef]
  28. Sun, J.; Zhan, T.; Liu, M.; Zhang, Z.; Wang, Y.; Liu, S.; Wu, G.L.; Liu, G.; Tsunekawa, A. Verification of the biomass transfer hypothesis under moderate grazing across the Tibetan plateau: A meta-analysis. Plant Soil 2021, 458, 139–150. [Google Scholar] [CrossRef]
  29. Don, A.; Schumacher, J.; Freibauer, A. Impact of tropical land-use change on soil organic carbon stocks–a meta-analysis. Glob. Chang. Biol. 2011, 17, 1658–1670. [Google Scholar] [CrossRef] [Green Version]
  30. Ma, Z.; Chen, H.Y.H.; Bork, E.W.; Carlyle, C.N.; Chang, S.X. Carbon accumulation in agroforestry systems is affected by tree species diversity, age and regional climate: A global meta-analysis. Glob. Ecol. Biogeogr. 2020, 29, 1817–1828. [Google Scholar] [CrossRef]
  31. Pittelkow, C.M.; Liang, X.; Linquist, B.A.; van Groenigen, K.J.; Lee, J.; Lundy, M.E.; van Gestel, N.; Six, J.; Venterea, R.T.; van Kessel, C. Productivity limits and potentials of the principles of conservation agriculture. Nature 2015, 517, 365–368. [Google Scholar] [CrossRef] [PubMed]
  32. Viechtbauer, W. Conducting meta-analyses in R with the metafor package. J. Stat. Softw. 2010, 36, 1–48. [Google Scholar] [CrossRef] [Green Version]
  33. R Core Team. R: A Language and Environment for Statistical Computing; R Foundation for Statistical Computing: Vienna, Austria, 2020. [Google Scholar]
  34. Byrnes, R.C.; Eastburn, D.J.; Tate, K.W.; Roche, L.M. A global meta-analysis of grazing impacts on soil health indicators. J. Environ. Qual. 2018, 47, 758–765. [Google Scholar] [CrossRef] [PubMed] [Green Version]
  35. Lai, L.; Kumar, S. A global meta-analysis of livestock grazing impacts on soil properties. PLoS ONE 2020, 15, e0236638. [Google Scholar] [CrossRef] [PubMed]
  36. Hao, Y.; He, Z. Effects of grazing patterns on grassland biomass and soil environments in China: A meta-analysis. PLoS ONE 2019, 14, e0215223. [Google Scholar] [CrossRef]
  37. Zhan, T.; Zhang, Z.; Sun, J.; Liu, M.; Zhang, X.; Peng, F.; Tsunekawa, A.; Zhou, H.; Gou, X.; Fu, S. Meta-analysis demonstrating that moderate grazing can improve the soil quality across China’s grassland ecosystems. Appl. Soil Ecol. 2020, 147, 103438. [Google Scholar] [CrossRef]
  38. Yan, L.; Li, Y.; Wang, L.; Zhang, X.; Wang, J.; Wu, H.; Yan, Z.; Zhang, K.; Kang, X. Grazing significantly increases root shoot ratio but decreases soil organic carbon in Qinghai-Tibetan Plateau grasslands: A hierarchical meta-analysis. Land Degrad. Dev. 2020, 31, 2369–2378. [Google Scholar]
  39. Liu, C.; Li, W.; Xu, J.; Wei, W.; Xue, P.; Yan, H. Response of soil nutrients and stoichiometry to grazing management in alpine grassland on the Qinghai-Tibet Plateau. Soil Till. Res. 2021, 206, 104822. [Google Scholar] [CrossRef]
  40. Pulido, M.; Schnabel, S.; Lavado Contador, J.F.; Lozano-Parra, J.; González, F. The impact of heavy grazing on soil quality and pasture production in rangelands of SW Spain. Land Degrad. Dev. 2018, 29, 219–230. [Google Scholar] [CrossRef]
  41. Sharrow, S.H. Soil compaction by grazing livestock in silvopastures as evidenced by changes in soil physical properties. Agroforest. Syst. 2007, 71, 215–223. [Google Scholar]
  42. Chai, J.; Yu, X.; Xu, C.; Xiao, H.; Zhang, J.; Yang, H.; Pan, T. Effects of yak and Tibetan sheep trampling on soil properties in the northeastern Qinghai-Tibetan Plateau. Appl. Soil Ecol. 2019, 144, 147–154. [Google Scholar] [CrossRef]
  43. Yang, H.; Sun, J.; Xu, C.; Zhang, J.; Chai, J.; Jiao, T.; Yu, X. Hoof pressure and trampling intensity of yaks are higher than those of Tibetan sheep in a Tianzhu alpine meadow. Rangel. J. 2019, 41, 125–133. [Google Scholar] [CrossRef]
  44. Ganjurjav, H.; Duan, M.; Wan, Y.; Zhang, W.; Gao, Q.; Li, Y.; Jiangcun, W.; Danjiu, L.; Guo, H. Effects of grazing by large herbivores on plant diversity and productivity of semi-arid alpine steppe on the Qinghai-Tibetan Plateau. Rangel. J. 2015, 37, 389–397. [Google Scholar] [CrossRef]
  45. Ruehlmann, J.; Körschens, M. Calculating the effect of soil organic matter concentration on soil bulk density. Soil Sci. Soc. Am. J. 2009, 73, 876–885. [Google Scholar] [CrossRef]
  46. Šimanský, V.; Juriga, M.; Jonczak, J.; Uzarowicz, Ł.; Stępień, W. How relationships between soil organic matter parameters and soil structure characteristics are affected by the long-term fertilization of a sandy soil. Geoderma 2019, 342, 75–84. [Google Scholar] [CrossRef]
  47. De Boer, H.C.; Deru, J.G.C.; Van Eekeren, N. Sward lifting in compacted grassland: Effects on soil structure, grass rooting and productivity. Soil Till. Res. 2018, 184, 317–325. [Google Scholar] [CrossRef]
  48. Genxu, W.; Ju, Q.; Guodong, C.; Yuanmin, L. Soil organic carbon pool of grassland soils on the Qinghai-Tibetan Plateau and its global implication. Sci. Total Environ. 2002, 291, 207–217. [Google Scholar] [CrossRef]
  49. Wang, J.; Zhao, C.; Zhao, L.; Wen, J.; Li, Q. Effects of grazing on the allocation of mass of soil aggregates and aggregate-associated organic carbon in an alpine meadow. PLoS ONE 2020, 15, e0234477. [Google Scholar] [CrossRef]
  50. Li, Q.; Yu, P.; Li, G.; Zhou, D.; Chen, X. Overlooking soil erosion induces underestimation of the soil C loss in degraded land. Quat. Int. 2014, 349, 287–290. [Google Scholar] [CrossRef]
  51. He, M.; Zhou, G.; Yuan, T.; van Groenigen, K.J.; Shao, J.; Zhou, X. Grazing intensity significantly changes the C:N:P stoichiometry in grassland ecosystems. Glob. Ecol. Biogeogr. 2020, 29, 355–369. [Google Scholar] [CrossRef]
  52. Fu, G.; Shen, Z.X. Response of alpine soils to nitrogen addition on the Tibetan Plateau: A meta-analysis. Appl. Soil Ecol. 2017, 114, 99–104. [Google Scholar] [CrossRef]
  53. Zhang, C.; Dong, Q.; Chu, H.; Shi, J.; Li, S.; Wang, Y.; Yang, X. Grassland community composition response to grazing intensity under different grazing regimes. Rangel. Ecol. Manag. 2018, 71, 196–204. [Google Scholar] [CrossRef]
  54. Chang, Q.; Wang, L.; Ding, S.; Xu, T.; Li, Z.; Song, X.; Zhao, X.; Wang, D.; Pan, D. Grazer effects on soil carbon storage vary by herbivore assemblage in a semi-arid grassland. J. Appl. Ecol. 2018, 55, 2517–2526. [Google Scholar] [CrossRef]
  55. Hou, X.; Wang, Z.; Michael, S.P.; Ji, L.; Yun, X. The response of grassland productivity, soil carbon content and soil respiration rates to different grazing regimes in a desert steppe in northern China. Rangel. J. 2014, 36, 573–582. [Google Scholar] [CrossRef]
  56. Dong, S.; Shang, Z.; Gao, J.; Boone, R.B. Enhancing sustainability of grassland ecosystems through ecological restoration and grazing management in an era of climate change on Qinghai-Tibetan Plateau. Agric. Ecosyst. Environ. 2020, 287, 106684. [Google Scholar] [CrossRef]
Figure 1. Distributions of study sites in the compiled dataset.
Sustainability 14 14065 g001
Figure 2. Weighted response ratios of bulk density (BD) in response to livestock grazing. Error bars represent 95% confidence intervals. The number of the observation is shown in the parenthesis on the y-axis. LG, MG, HG, AG, WSG and CSG represent light grazing, moderate grazing, heavy grazing, annual grazing, warm-season grazing and cold-season grazing, respectively.
Sustainability 14 14065 g002
Figure 3. Weighted response ratios of soil organic carbon (SOC) content and SOC stock in response to livestock grazing. Error bars represent 95% confidence intervals. The number of the observation is shown in the parenthesis on the y-axis. LG, MG, HG, AG, WSG and CSG represent light grazing, moderate grazing, heavy grazing, annual grazing, warm-season grazing and cold-season grazing, respectively.
Sustainability 14 14065 g003
Figure 4. Weighted response ratios of plant above-ground biomass and below-ground biomass in response to livestock grazing. Error bars represent 95% confidence intervals. The number of the observation is shown in the parenthesis on the y-axis. LG, MG, HG, AG, WSG and CSG represent light grazing, moderate grazing, heavy grazing, annual grazing, warm-season grazing and cold-season grazing, respectively.
Sustainability 14 14065 g004
Figure 5. Relationships between soil organic carbon (SOC) stock, plant above-ground biomass and below-ground biomass.
Sustainability 14 14065 g005
Table 1. Variation rate of content and stock of soil organic carbon (SOC) reported by other studies.
StudyDecline Rate (%)Soil Layer
(cm)
Study Area
SOC ContentSOC Stock
Zhou et al. [3]−10.310–100Globe
Byrnes et al. [34]−7.7Globe
Lai and Kumar [35]−10.80–10Globe
−22.510–30Globe
Hao and He [36]−8.0China
Zhan et al. [37]−7.0China
Yan et al. [38]−20.00–30Tibetan Plateau
Liu et al. [39]−13.70–30Tibetan Plateau
Dlamini et al. [12]−9.00–30Globe
Eze et al. [4]−6.60–19Globe
−11.90–40Globe
−24.00–100Globe
Abdalla et al. [10]−19.00–30Moist cool regions
1 Data was not reported.
Publisher’s Note: MDPI stays neutral with regard to jurisdictional claims in published maps and institutional affiliations.