Article

One-Kilometer Walking Limit during COVID-19: Evaluating Accessibility to Residential Public Open Spaces in a Major Saudi City

1
Department of Landscape Architecture, Faculty of Architecture and Planning, King Abdulaziz University, Jeddah 21589, Saudi Arabia
2
Department of Geomatics, Faculty of Architecture and Planning, King Abdulaziz University, Jeddah 21589, Saudi Arabia
3
The Center of Excellence in Smart Environment Research, King Abdulaziz University, Jeddah 21589, Saudi Arabia
*
Author to whom correspondence should be addressed.
Sustainability 2022, 14(21), 14094; https://doi.org/10.3390/su142114094
Submission received: 3 September 2022 / Revised: 24 October 2022 / Accepted: 26 October 2022 / Published: 28 October 2022

Abstract

:
Considering the significance of physical activities in maintaining physical and mental well-being, several nations made exceptions during the COVID-19 lockdowns and allowed residents to walk outdoors, but with time and distance restrictions that varied across countries. This study aimed to identify if such regulations provided residents with equal access to public open spaces (POS) to engage in physical activity during the lockdown. Using a mixed research method (secondary descriptive data, field observations, and spatial analysis), we assessed the one-kilometer walking limit imposed on six typical existing neighborhoods in Jeddah city, Saudi Arabia. We find that the imposed one-kilometer limit was effective in providing accessibility, and the four urban factors ensured the effectiveness of the imposed walking distance: the small scale of residential districts in comparison to the long-imposed walking distance; the presence of neighborhood parks near main local streets; the distribution of neighborhood parks throughout the districts; and the absence of major highways that physically isolated residential districts. Notably, regulations related to walking distances during future pandemics should not be generalized to all cities; instead, they should be based on the existing availability of relatively good POS provisions with easy and equal access to all community members to enhance social sustainability.

1. Introduction

Several non-pharmaceutical interventions, such as curfews, lockdowns, social distancing, and the closure of gathering places, were implemented to control the spread of the coronavirus 2019 (COVID-19) disease worldwide. Several of these measures, including movement restrictions, have proved to be highly effective in virus containment [1,2,3,4]. Despite their effectiveness, some studies show that these measures may negatively affect people’s physical, mental, and social well-being [1,5,6]. For instance, a study on physical activity during the COVID-19 lockdown in Italy revealed a substantial decline in physical activity compared to before the lockdown, which may have caused adverse health outcomes [7]. Similarly, a recent study in Saudi Arabia on the effect of the COVID-19 lockdown shows a significant decrease in participants’ daily physical activity during the pandemic and an increase in unhealthy dietary behaviors [8]. Other studies have also found that the pandemic triggered substantial levels of fear, worry, depression, and anxiety among the public [9,10]. Therefore, regular physical activity was recommended to reduce the mental health impact and maintain appropriate fitness levels during the pandemic [11].
The role of physical activity on physical and mental health is well-highlighted in the literature. Regular physical activity such as walking, which is known as the most sustainable mode of transportation [12], contributes to multiple health benefits that can reduce the risk of illnesses such as cardiovascular and respiratory diseases [13,14]. Additionally, previous studies confirm that adequate physical activity and exercise impact mental health positively by decreasing stress, anxiety, and depression [15,16,17]. Other studies suggest that physical activity in green open spaces may increase the possible physical and mental health benefits compared to indoor areas [18,19].
The link between physical activity and sustainable urban planning and design of built environments has been extensively reviewed [20,21,22]. Built environments designed to support physical activity, such as those that provide good street network connectivity, proper pedestrian infrastructure, and mixed land use, are more likely to raise physical activity levels [23,24,25]. Other studies indicate that outdoor physical activity will be enhanced if public open spaces (POS) are accessible, large, and attractive [25,26].
Realizing the importance of physical activity during COVID-19, countries around the world implemented various interventions, such as specifying walking time and distance, to ensure that the residents were physically active. For example, Saudi Arabia and Spain imposed a one-kilometer walking distance limit for one hour daily [27,28]. The South Australian State imposed a two-and-a-half-kilometer limit [29] and Victoria State (Australia) implemented a five-kilometer lockdown radius [30]. In Kuwait, people were allowed to exercise once a day for two hours, but no specific walking distance was stipulated [31]. Other countries, such as the United Kingdom (UK) and many parts of the United States (US), require citizens to “stay home” or “stay local”, allowing people to leave their homes only for essential reasons, such as exercising and shopping [32,33]. However, countries opting for such restrictions did not disclose the criteria or rationale for restricting the allowable time and distance (e.g., one-hour/one-kilometer) for walking outdoors, raising questions about the efficiency and applicability to the urban fabric of those countries.
This study investigates to what extent the one-kilometer walking limit during the pandemic may influence residents’ accessibility of POS. Using Jeddah city in Saudi Arabia as a case study, the planning of six typical existing residential districts was explored to determine whether POS (e.g., built neighborhood parks) were accessible to most residents when the one-kilometer regulation for walking was imposed during the lockdown. We measured several urban attributes related to walkability and residential POS in the assessment process, including block size, street network connectivity, and residential POS quantity and distribution. The underlying assumption of this study is that the one-kilometer walking distance limit imposed by the Saudi Ministry of Health does not consider urban planning patterns and POS provision and distribution as critical measures that increase access to open spaces and enhance physical activity [34]. Assessing the effectiveness of the controlled walking distance regulation during curfew in facilitating physical activity and curbing the spread of COVID-19 is critical to inform future responses, achieve sustainable urban planning, and promote public health and well-being.

2. Literature Review

2.1. Impact of COVID-19 on Walkability

As a result of the COVID-19 pandemic, many countries applied lockdown and social distancing measures to prevent the spread of the virus. These measures were adequate to manage the spread of the virus but also disturbed people’s mobility and overall quality of life [1]. The impact of COVID-19 on walkability is evident in the growth of publications related to walkability studies over the last three years. A recent systematic review shows that from 2019 to 2022, there was a 33% increase in publications that cover a wide range of walkability topics related to public health, urban characteristics, transportation, and socioeconomic aspects [35].
Many public health studies published during the pandemic showed a positive impact of walkability on physical health [36,37,38]. Other studies found a connection between the built environment’s characteristics and walkability. For example, Lotfata et al. [39] explored the association between urban neighborhood characteristics and walking behavior during the pandemic in 24 cities. Their research findings highlight the importance of distance-based urban planning in sustaining social cohesion and public health. Other recent studies measured the impact of COVID-19 on accessibility to urban green spaces. For instance, a study by Venter et al. [40] showed a significant increase in outdoor recreational activity in remote green spaces, including walking, running, hiking, and biking, during the partial lockdown in Oslo, Norway. On the other hand, a study by Addas and Maghrabi [41] investigated the impact of COVID-19 on the use and accessibility of urban green spaces in Jeddah, Saudi Arabia, and found a significant decrease in users’ numbers during the pandemic period and noted that the majority of visitors used these parks for physical activity.
Recent studies have also showed the importance of walking as an active mode of transportation [42,43]. Studies show that due to the high risk of infection on public transportation [44,45], people tend to walk and cycle [46,47]. For instance, Wang et al. [48] studied the relationship between walkability and the spread of COVID-19 in Massachusetts, Texas, and found that active transportation is associated with a lower infection rate during the COVID-19 pandemic. A body of literature also explored the impact of COVID-19 on walkability in urban areas and its Socioeconomic effect [49,50,51]. For example, Yuan 2022 et al. [52] studied the impact of COVID-19 on walkability in Xi’an’s historical area in China and found a negative impact on street vitality, which in turn caused a reduction in pedestrian flow and commercial value. In another study, Liu et al. [53] found that, during the COVID-19 pandemic, discriminated-against migrants had insufficient access to social activities and neighborhood POS because of fear. Likewise, Ma et al. [54] revealed that Asians were less likely to increase walking than Caucasians due to racism during the COVID-19.
Our study contributes to the large body of literature that highlights the importance of POS accessibility during the COVID-19 outbreak.

2.2. POS Size and Quality, Walking Distance, and Block Size

POS are areas assigned for recreation and the improvement of urban areas’ social, cultural, and environmental quality [55]. Various types and spatial forms of POS exist, such as neighborhood and city parks, gardens, streets, sidewalks, playgrounds, beaches, and waterfronts [56]. UN-Habitat suggested that an average of 45–50% of urban land should be designated for street networks and POS, comprising 30–35% for streets and sidewalks and 15–20% for POS (refer to Table 1).
Previous studies verify that the availability and proximity of POS within walking distance of people’s homes is associated with the increased usage of those spaces. According to Maas et al. [18], POSs located within a 1000–3000 m radius have a strong positive impact on residents’ perceived general health and well-being. In another study by King et al. [57], the walking distance was found to be reduced for the elderly. Their study concluded that living within a 1500-m walking distance of specific types of neighborhood facilities was positively linked to individuals’ physical activities. Interestingly, Sugiyama [58] found that large and attractive POS within a 1600-m walking distance from homes were considered attractive for walking for up to around 150 min or more a week by adults. It is important to highlight that the willingness to walk such distances is fundamentally linked to POS’s attractiveness and size [26,59,60].
Another important factor that impacts walkability is the block size. A city block is a land unit designated for a group of buildings, or POS, enclosed by streets that form a city’s urban fabric. As a primary element of the physical structure of urban areas, the city block comes in varying forms, dimensions, and arrangements. The block size can be classified into three categories, namely small (under 10,000 m2), medium (10,000–20,000 m2), and large (over 20,000 m2 [61]). However, the rationale behind using particular block dimensions and forms in these cities is not provided, with only a few studies critically examining them [62,63,64].
Several urbanists claim that smaller blocks provide a wide range of benefits that support walkability [65,66,67,68]. Smaller blocks, according to Jacobs [69], provide excellent connectivity, shortening walking distance for individuals and facilitating social interaction on the street. Similarly, Krier [70] argued that city blocks should be small in length and width to allow more diversity and complexity in the urban landscape. Carmona et al. [71] also prefer smaller blocks for their greater permeability and route choices. Furthermore, Stangl and Guinn [72] confirmed that small block sizes provide good connectivity, while large block sizes create significant movement obstructions throughout the urban environment. To encourage walkability, some authors suggest that block lengths should be between 91.4 and 152.4 m (300 to 500 feet). When the block length reaches 182.8 to 243.8 m (600–800 feet) or more, it is highly recommended to provide midblock cross-walks and connected pass-throughs to promote walkability [73].
Several studies, however, found little or no relationship between small block sizes and walkability [74,75]. For example, Sevtsuk et al. [76] outlined that the relationship between block size and walkability is non-linear as large block sizes provide better walkability than small block sizes. Thus, current literature validates the strong relationship between block size and walkability, but the small versus large block size debate remains inconclusive and requires further research. In this study, block size and length in each study residential district are measured to evaluate their impact on residential POS accessibility when the one-kilometer walking distance restriction was imposed.

2.3. Spatial Accessibility Analysis

Overall, two main approaches are used to measure access to POS. The first is based on people’s self-reporting and perception, which is mainly used in public health studies [77]. The second approach measures accessibility [78] to POS using the distance model and potential measure [79]. Distance measurements are commonly used to estimate the maximum travel time or distance between two points. The contour measure, also known as an Isochrone measure, is utilized to count the number of opportunities that can be accessed within a particular travel time and distance when there are more than two possible destinations.
For instance, Shen [80] investigated the fairness of local zoning regulations in terms of housing accessibility to facilities. He measured accessibility using a distance-oriented methodology that includes the shortest distances, aggregated mean lengths, and descriptive statistics on distances from residences to community resources. The shortest path, the quickest path, the second-shortest path, and the second-fastest path were used by Yang et al. [81] to determine the accessibility of a housing estate to various nearby public services using distance-based measurements. Exploring social equity based on the analysis of housing and accessibility to essential services is an important research topic [82]. The notion of accessibility has been discussed in various ways in scientific literature. Nonetheless, the possibility of interaction is a widely accepted fundamental concept [83]. Geographic information systems (GIS) are well-equipped with standard tools for investigating accessibility, which might be broadly termed “network analysis” [84].
For subjective well-being and social equity, it is more important to examine how people perceive their accessibility [85]. Lättman et al. [86] further suggested that perceived accessibility may be in conflict with objectively measured accessibility. In Liu et al.’s [53,87] analysis of accessibility during the COVID-19 outbreak, they found that, on the one hand, social activities (which POS offers) could be accessed via online participation, while on the other hand, physical activities (such as walking) can be conducted within the neighborhood without necessarily visiting POS.
In this study, spatial analysis procedures are used in association with field observations to evaluate accessibility to existing POS of residential districts in Jeddah city when a one-kilometer walking distance was imposed during the lockdown.

3. Materials and Methods

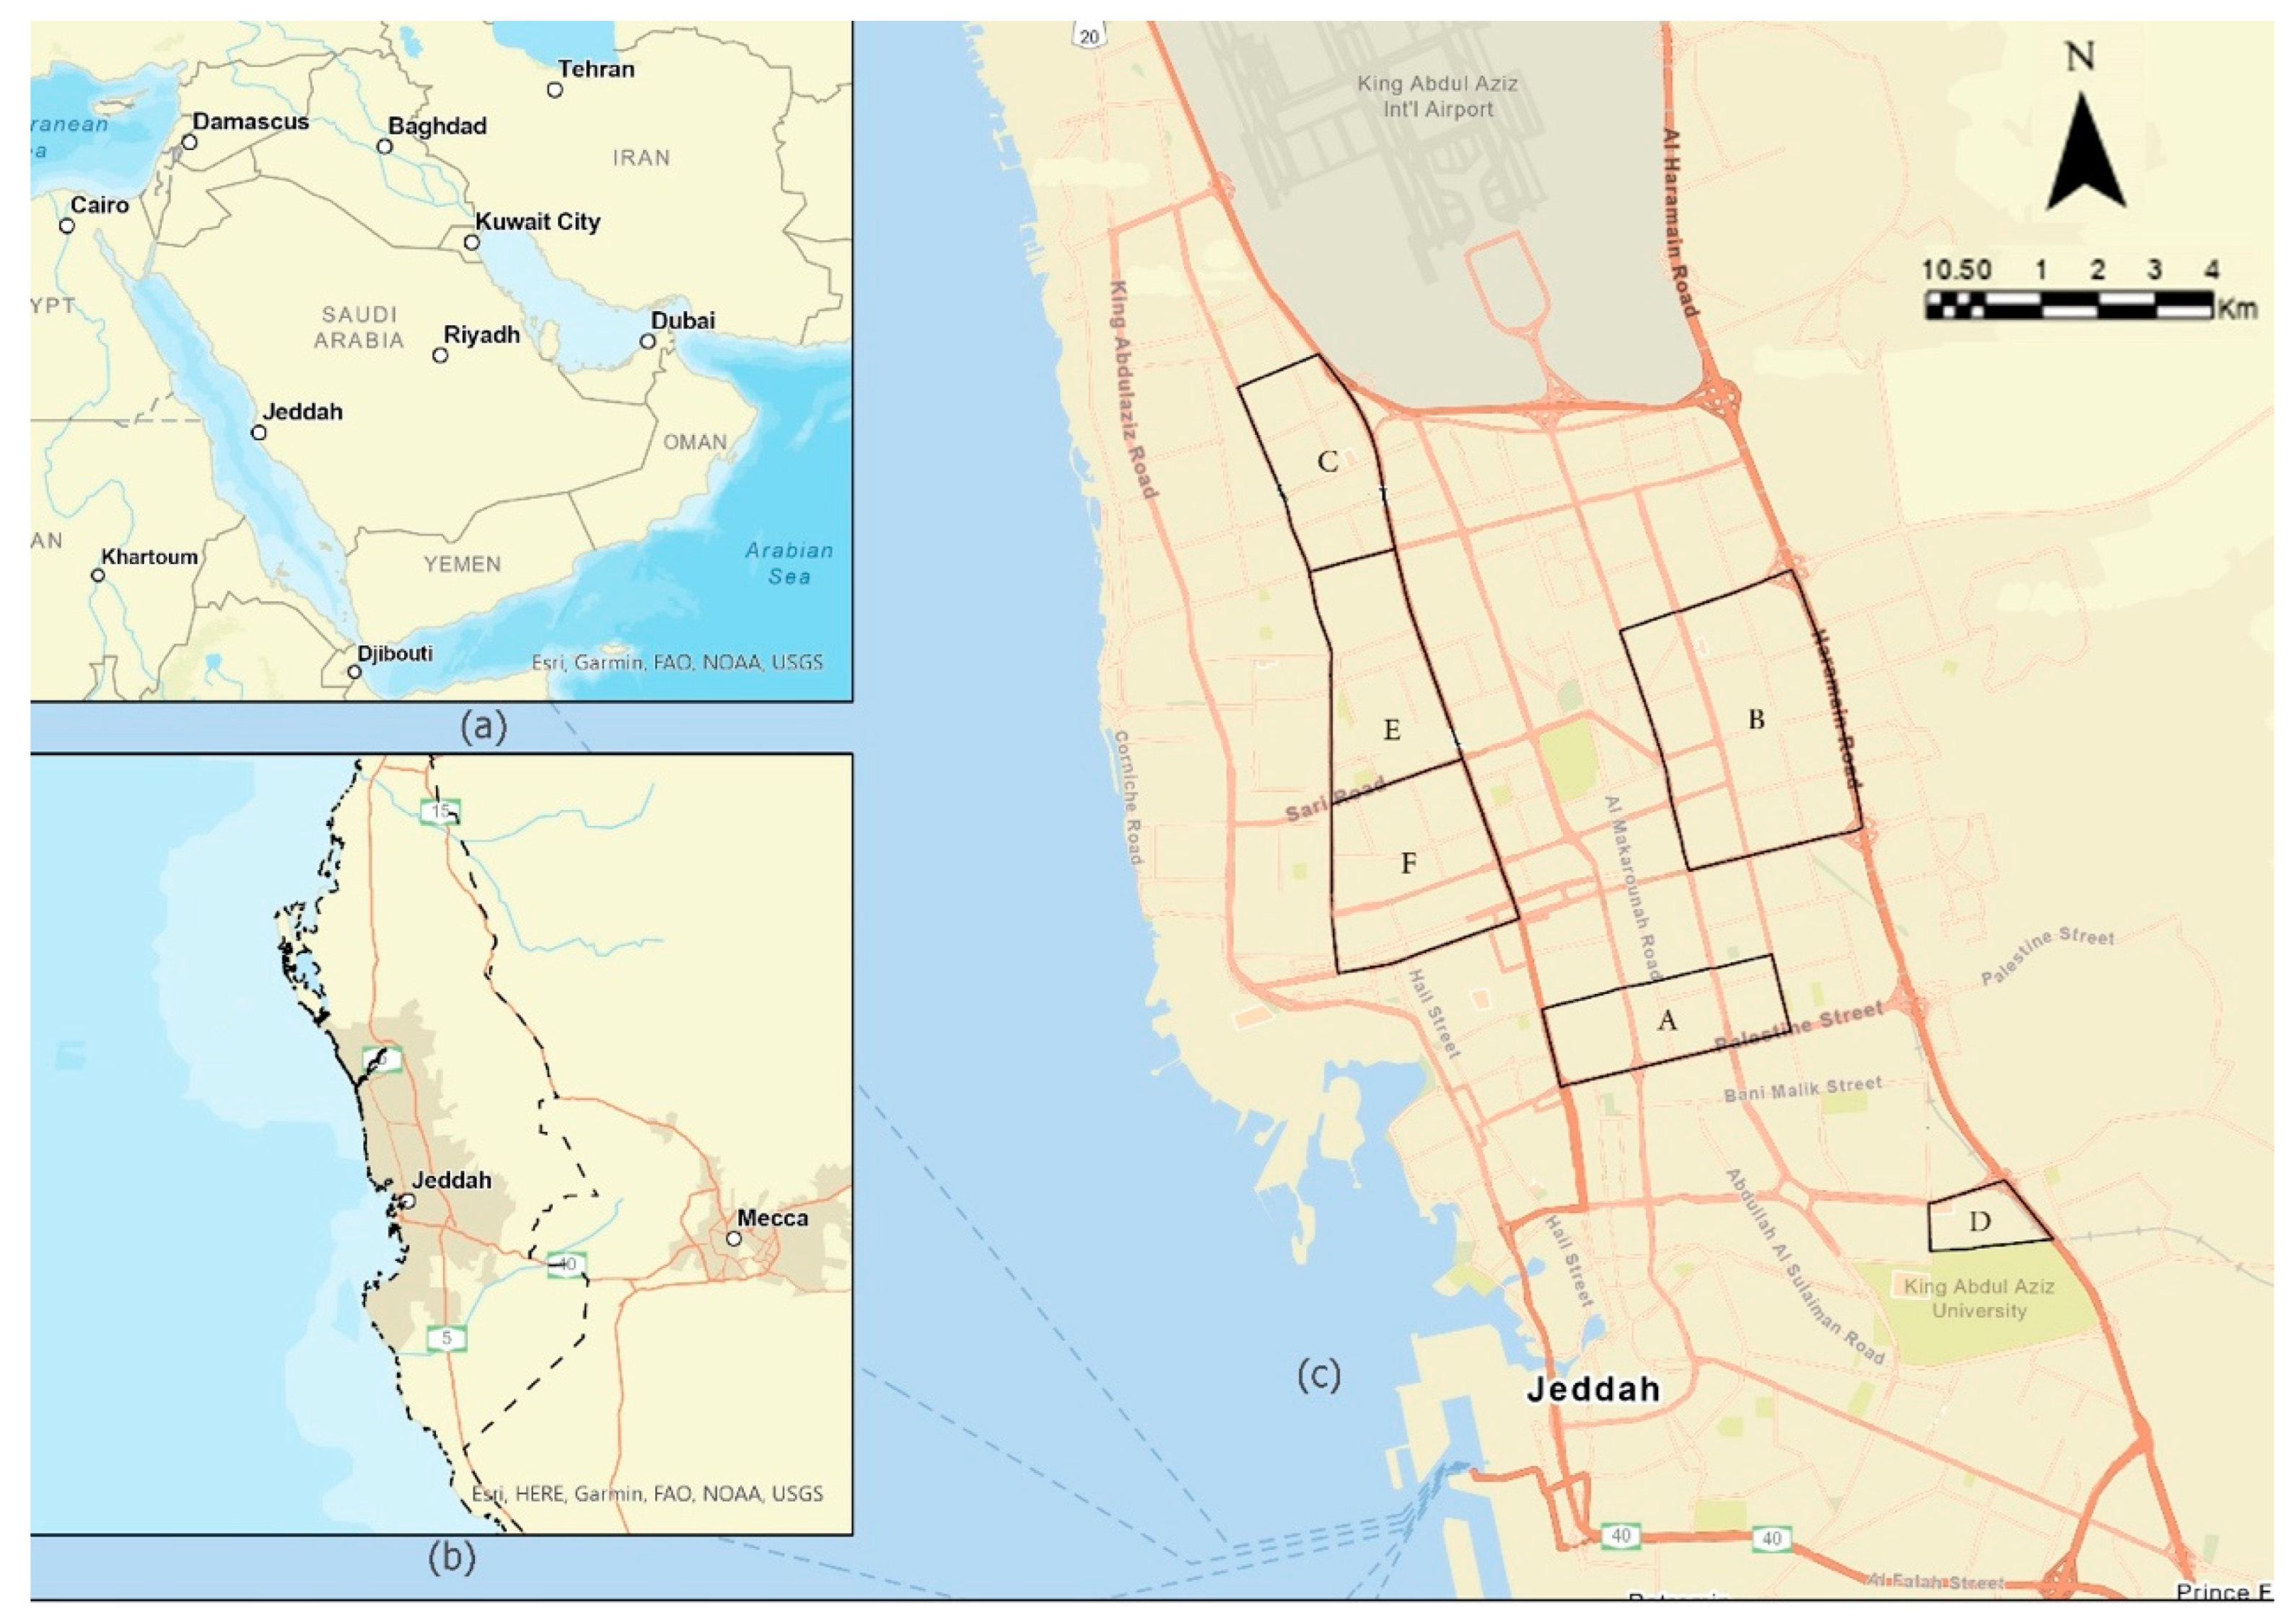
3.1. Study Area Selection

The research was conducted in the city of Jeddah, which is the largest city in the western region of Saudi Arabia and the nation’s second-largest city, with an estimated population of over 4 million [88]. Six typical residential districts were selected based on population density, block size, POS provision, and distribution, as well as urban street patterns (refer to Figure 1). A majority of these residential districts have iron-grid patterns, with a few patches of organic fabric in one residential district. Such areas represent the variety of POS distribution and provision types and the urban morphology within Jeddah city and signify the level of planning for other Saudi cities’ districts (refer to Figure 2).
The land areas of the six case studies range from 171 to 1395 hectares, with a population density ranging from 37,732 to 222,215 people. The block size in Al-Salamh, Mushrefah, and Al-Rawdah districts is found to be under 10,000 m2, which is classified as a small block size according to Siksna [61]. The block size of the remaining three case studies, namely Al-Safa, Al-Naeem, and Al-Sulaymaniyah, is between 10,000 and 20,000 m2, which is considered a medium-size block according to Siksna. The block length in the case studies ranges from 76 to 209 m, and the largest block length is in the Al-Naeem district at 209 m, while the shortest block length is the Mushrefah district at 76 m (refer to Table 2).

3.2. Data Collection and Analysis

This study applies a mixed research method, including secondary descriptive data, field observations, and spatial analysis. Data for this study were collected from six residential districts in Jeddah city with typical urban planning and diverse characteristics. The maps for each residential district were reproduced in GIS using the administration boundary and land-use map obtained from Jeddah’s Municipality online database called Atlas [89]. This land-use map contains POS data representing public parks and other green spaces. The street networks were obtained from the Open Street Map (OSM).
Accessibility to POS is evaluated through geographic information analysis. The process has two main phases. In the first phase, the POS data are prepared and validated. We use QGIS to map the POS in the selected case studies based on Jeddah’s Local Plan Atlas. The POS layer reliability is examined by conducting a comparison with Google Maps (GM) and direct field observations. Based on this step, POS is categorized into two groups: built and unbuilt POS (refer to Figure 3). The built POS indicates a fully developed urban park with greenery, walking paths, and amenities. The unbuilt POS means undeveloped urban parks, often used for illegal parking and dumping of damaged vehicles. We considered the residential districts’ POS as the major destination points. Then, a pedestrian buffer was created based on the imposed one-kilometer walking distance from each POS center. In the case of linear parks, multiple geographic points were inserted along the centerline of the park with respect to road network junctions.
In the second phase, we performed a spatial analysis using QGIS software and OSM to investigate the residential districts’ POS accessibility. The procedure consists of four steps. First, the district boundary obtained from Jeddah Municipality was employed to intersect POS for each selected case study. Second, we calculated the essential attributes, such as district area, population density, block size, the quantity of POS, and the total area of POS. Third, an Isochrone analysis was performed using the Network Analysis Toolbox 3 “QNEAT3” plugin package in QGIS 3.16 to calculate the coverage areas for built POS. Last, the percentage of POS accessibility coverage area in the study areas was measured. The findings of this research are presented at each selected residential district level, and Figure 4 provides a summary of the study’s methodological framework.

4. Results

The analysis of the POS data obtained from Jeddah municipality specifies that the six study districts have 295 POS, covering about 1.4% to 2% of the entire district’s land area. Data analysis by GM and field observation showed a high percentage of unbuilt POS in the study areas. Altogether, four out of six districts have less than 50% of built POS. For instance, the Al-Safa district, the most extensive study area with the highest population rate, has 102 POS, but only 45 POS were built. Similarly, only 41% of POS were designed in Al-Naeem and Al-Sulaymaniyah districts. The remaining are either unbuilt or have been converted for other uses. The Mushrefah district reported the highest percentage of built POS in the study area, with 95% of built POS. Finally, the Al-Rawdah district had the lowest rate, with 37% built POS (refer to Table 3).
The analysis of the total POS land area in relation to population density in each residential district in the study indicates that the provision of built POS per person is around 0.1 m2/person. Both Al-Salamh and Al-Rawdah districts contained the highest POS provision per person in the study area. Contrariwise, Al-Safa and Al-Sulaymaniyah districts reported the lowest POS provision per person.
Despite the high deficiency in POS (i.e., estimated below 50% in Al-Safa, Al-Naeem, Al-Rawdah, and Al-Sulaymaniyah) and the very low POS provision per person in all study districts, our analysis suggests that residents’ walking accessibility to the existing neighborhood parks was between fair and very high when the one-kilometer imposed walking distance was applied: 66% in Mushrefah district, 79% in Rawdah district, 94% in Al-Salamh and Al-Safa districts, 99% in Al-Sulaymaniyah district, and 100% in Naeem district (refer to Table 4). Illustrations of the residential districts’ POS coverage and accessibility are presented in Figure 5.

5. Discussion

This study investigates whether the imposed one-kilometer walking distance was sufficient to promote social sustainability by providing equal access to neighborhood parks to allow residents to exercise during the spread of COVID-19 in six typical residential districts in the city of Jeddah. Generally, this study extends current knowledge on imposed walking distances and their effectiveness in reaching residential POS during the spread of the recent pandemic, as no previous study has investigated this topic to date.
The study finds four main urban factors that make the imposed one-kilometer walking distance effective in connecting and providing residents with equal access to their existing neighborhood’s parks. These include: first, the long imposed one-kilometer walking distance compared to the relatively small scale of residential districts; second, the presence of neighborhood parks near main local streets that connect districts’ administrative edges together; third, the relatively good distribution of neighborhood parks throughout districts; and fourth, residential districts being free of major urban corridors such as highways that divide their built-up areas into several physically isolated parts.
For instance, 100% of Al-Naeem’s district residents can access existing neighborhood parks when complying with the imposed one-kilometer rule, even though this district’s built-up area is dominated by medium block sizes (average of 16,290 m2) and a low percentage (41%) of built neighborhood parks. Here, the relatively good distribution of neighborhood parks in such a small land area of the district (590 H) can assist all residents in reaching these POS. In the Al-Sulaymaniyah district, which also includes a medium block size (average 12,765 m2), the imposed walking distance was also considered perfect, as it links 99% of the district residents to neighborhood parks, even though the district has a low percentage of built neighborhood parks (41%) that are unequally distributed (i.e., concentrated to the southern and eastern edge of the district). Again, the smaller land area of the district (171 H) in comparison to the long-imposed walking distance, and the presence of existing neighborhood parks near main local streets that connect both administrative edges of the district, overcome the issues of poor distribution and the low number of built POS. Hence, both the factors lead to very high accessibility when applying the imposed one-kilometer walking distance.
Conversely, residential districts with a small block size (average of 4284) and high built POS (95%) (e.g., Mushrefah) only provide 66% of their residents with access to neighborhood parks when the same walking distance was imposed. Here, the imbalanced distribution of POS (concentrated in the eastern and middle areas of the district), the physical separation of one-third of the district land area by a highway (illustrated in pink in Figure 5A), and the unavailability of walking facilities, such as pedestrian bridges, to connect this part with other neighborhood parks, led to this low percentage.
Notably, the imposed one-kilometer walking distance to ensure physical activity during COVID-19 was effective in enabling a very high percentage of residents to reach their existing built neighborhood parks without breaching the official regulation. However, the POS per person provision was significantly lower. The findings indicate that POS provision in all study residential districts ranged between 0.06–0.12 m2 per person, a provision that contrasts with the World Health Organization recommendations, which advocate a minimum of 9 m2 per person [55]. Additionally, the percentage of built neighborhood parks land area to districts ranges from 1.4 to 2%. This percentage is very low compared to UN-Habitat’s recommendations that necessitate 15–20% for POS [56]. For these reasons, reaching such small open areas will be considered a negative as social distancing between users would be reduced or only a few residents would be catered to during the day to avoid the spread of the virus. In other cases, some community members who are more cautious about their health, such as the elderly or those with compromised immune systems, will most likely avoid walking to neighborhood parks to avoid being infected. Thus, the most vulnerable segment would lose the vital benefit of being physically active. This issue needs urgent attention toward allocating additional budgets to build the undeveloped lands assigned for neighborhood parks and finding other opportunities to turn unused or underutilized residential public spaces for the benefit of increasing functional POS.
The availability of smaller to medium block sizes (refer to Table 2), in association with the imposed one-kilometer walking distance and the relatively good distribution of neighborhood parks, plays a key role in providing fair to full accessibility to these residential POS. Here, the outcome related to block size is consistent with previous research, which highlights the important role of smaller blocks in enhancing connectivity by increasing pedestrians’ permeability and choice of routes [71], thus encouraging physical activity [65,66]. With the imposed one-kilometer walking distance, the importance of existing small-to-medium blocks may not appear significant, but these block sizes will help maximize accessibility if the imposed walking distance is reduced. This notion depends on POS provision and distribution as well as the unavailability of appropriate pedestrians’ accessibility if major highways cut through residential districts.
The basic perquisites of social sustainability indicate the importance of providing an easily accessible, attractive, and inviting POS for everyone [12]. Neglecting the current issue of POS provision and only relying on extending the imposed walking distance to more than one kilometer in any future pandemic, as implemented in other international cities (e.g., Adelaide [2.5 km] and Melbourne [5 km] in Australia) during COVID-19 will not be appropriate to solve this problem. Such a decision will minimize social and physical distancing between users, as the lack of POS provision is not only linked to the six studied residential districts but the entire city of Jeddah [55,88]. The city also suffers from inaccessibility to a significant portion of its public shoreline because of privatization [90]. Moreover, 42% of Jeddah’s population lives in areas between 50 and 150 p/ha, and the city’s population is projected to reach more than 5.2 million by 2033, with a population growth rate of 3.2% per annum [88]. For these reasons, future plans should be based on sustainable urban planning to increase the low POS provisions, particularly in residential districts, to sustain human well-being. This is because neighborhood parks (also known as community parks) in particular were perceived as important for creating social sustainability and enhancing social interaction between residents during the COVID-19 lockdown [91]. Moreover, imposing regulations related to walking distances during future pandemics should not be generalized to all cities; rather, they should be based on the existing availability of relatively good provisions of POS that are equally distributed and accessible to all community members.
Last, the method used in this study is generic and cost-effective as it uses open-source data and free software. It can be easily used to evaluate the imposed walking distances that were applied by different countries to ensure their suitability to equally connect residents to their neighborhood parks during COVID-19 or other outbreaks that may appear in the future. The method can also be used to measure the appropriateness of urban block sizes and to check whether they help provide easy access to different POS forms at the city level or in residential districts.

6. Conclusions

This study investigates if the imposed one-kilometer walking distance for exercising, approved by the Saudi Ministry of Health during COVID-19, was appropriate for the planning of Jeddah’s residential districts. Our study shows that the imposed one-kilometer limit was effective in providing access to POS. In addition, we identified four urban factors that ensured the effectiveness of the imposed walking distance: the small scale of residential districts in comparison to the long-imposed walking distance; the presence of neighborhood parks near main local streets; the distribution of neighborhood parks throughout the districts; and the absence of major highways that physically isolate residential districts.
Our study makes three main contributions to the literature. First, it adds empirical evidence to the Saudi planning literature by highlighting the four urban factors that play a key role in facilitating accessibility to neighborhood parks while adhering to the one-kilometer walking distance rule. Second, its findings are considered essential for future sustainable planning, urban design, and landscape architecture of the Saudi cities’ residential areas and perhaps other international cities with similar urban planning. Third, its method is important for the research community and practice as it provides a simple way to test the efficiency of imposed walking distances in the event of any future pandemic.
The study has three limitations. First, it did not investigate the quality of the street design and pedestrian facilities and their impact on the encouragement or discouragement to walk one kilometer. Rather, it only focuses on the possibility to reach existing neighborhood parks without breaching the imposed walking distance due to their role in encouraging physical activity. Second, it did not investigate the quality and attractiveness of existing neighborhood parks to encourage residents to walk to and from long distances. Lastly, the current manuscript focuses on the physical attributes of residential districts, such as total population, block size, length, and width. They are useful to measure the design of the built environment. However, the socioeconomic features of these residential districts were not considered in the spatial accessibility analysis. These limitations represent viable topics for future research.

Author Contributions

Conceptualization, A.H. and N.A.; methodology, A.H.; software, A.F.; validation, A.H., N.A. and A.F.; formal analysis, A.F.; investigation, A.H.; resources, N.A.; data curation, A.F.; writing—original draft preparation, A.H.; writing—review and editing, A.H. and N.A.; visualization, A.F.; supervision, A.H. All authors have read and agreed to the published version of the manuscript.

Funding

This research received no external funding.

Data Availability Statement

Not applicable.

Acknowledgments

The authors are extremely thankful to all the associated personnel that contributed to this research.

Conflicts of Interest

The authors declare no conflict of interest.

References

  1. Haug, N.; Geyrhofer, L.; Londei, A.; Dervic, E.; Desvars-Larrive, A.; Loreto, V.; Pinior, B.; Thurner, S.; Klimek, P. Ranking the effectiveness of worldwide COVID-19 government interventions. Nat. Hum. Behav. 2020, 4, 1303–1312. [Google Scholar] [CrossRef] [PubMed]
  2. Giordano, G.; Blanchini, F.; Bruno, R.; Colaneri, P.; Di Filippo, A.; Di Matteo, A.; Colaneri, M. Modelling the COVID-19 epidemic and implementation of population-wide interventions in Italy. Nat. Med. 2020, 26, 855–860. [Google Scholar] [CrossRef] [PubMed]
  3. Koo, J.R.; Cook, A.R.; Park, M.; Sun, Y.; Sun, H.; Lim, J.T.; Tam, C.; Dickens, B.L. Interventions to mitigate early spread of SARS-CoV-2 in Singapore: A modelling study. Lancet Infect. Dis. 2020, 20, 678–688. [Google Scholar] [CrossRef] [Green Version]
  4. Prem, K.; Liu, Y.; Russell, T.W.; Kucharski, A.J.; Eggo, R.M.; Davies, N.; Centre for the Mathematical Modelling of Infectious Diseases COVID-19 Working Group; Jit, M.; Klepac, P. The effect of control strategies to reduce social mixing on outcomes of the COVID-19 epidemic in Wuhan, China: A modelling study. Lancet Public Health 2020, 5, e261–e270. [Google Scholar] [CrossRef] [Green Version]
  5. Brooks, S.K.; Webster, R.K.; Smith, L.E.; Woodland, L.; Wessely, S.; Greenberg, N.; Rubin, G.J. The psychological impact of quarantine and how to reduce it: Rapid review of the evidence. Lancet 2020, 395, 912–920. [Google Scholar] [CrossRef] [Green Version]
  6. Marchi, V.; Speak, A.; Ugolini, F.; Sanesi, G.; Salbitano, F. Attitudes towards urban green during the COVID-19 pandemic via Twitter. Cities 2022, 126, 103707. [Google Scholar] [CrossRef]
  7. Zaccagni, L.; Toselli, S.; Barbieri, D. Physical activity during COVID-19 lockdown in Italy: A systematic review. Int. J. Environ. Res. Public Health 2021, 18, 6416. [Google Scholar] [CrossRef]
  8. Alfawaz, H.; Amer, O.E.; Aljumah, A.A.; Aldisi, D.A.; Enani, M.A.; Aljohani, N.J.; Alotaibi, N.H.; Alshingetti, N.; Alomar, S.Y.; Khattak, M.N.K.; et al. Effects of home quarantine during COVID-19 lockdown on physical activity and dietary habits of adults in Saudi Arabia. Sci. Rep. 2021, 11, 1487. [Google Scholar] [CrossRef]
  9. Pfefferbaum, B.; North, C.S. Mental health and the COVID-19 pandemic. N. Engl. J. Med. 2020, 383, 510–512. [Google Scholar] [CrossRef]
  10. Torales, J.; O’Higgins, M.; Castaldelli-Maia, J.M.; Ventriglio, A. The outbreak of COVID-19 coronavirus and its impact on global mental health. Int. J. Soc. Psychiatry 2020, 66, 317–320. [Google Scholar] [CrossRef]
  11. Yang, Y.; Lu, Y.; Yang, L.; Gou, Z.; Liu, Y. Urban greenery cushions the decrease in leisure-time physical activity during the COVID-19 pandemic: A natural experimental study. Urban For. Urban Green. 2021, 62, 127136. [Google Scholar] [CrossRef] [PubMed]
  12. Gehl, J. Cities for People; Island Press: Washington, DC, USA, 2010. [Google Scholar]
  13. Hallal, P.C.; Victora, C.G.; Azevedo, M.R.; Wells, J.C. Adolescent physical activity and health. Sports Med. 2006, 36, 1019–1030. [Google Scholar] [CrossRef] [PubMed]
  14. Haskell, W.L.; Blair, S.N.; Hill, J.O. Physical activity: Health outcomes and importance for public health policy. Prev. Med. 2009, 49, 280–282. [Google Scholar] [CrossRef] [PubMed]
  15. Fox, K.R. The influence of physical activity on mental well-being. Public Health Nutr. 1999, 2, 411–418. [Google Scholar] [CrossRef] [Green Version]
  16. Paluska, S.A.; Schwenk, T.L. Physical activity and mental health: Current concepts. Sports Med. 2000, 29, 167–180. [Google Scholar] [CrossRef]
  17. Saxena, M.; Van Ommeren, K.; Tang, C.; Armstrong, T.P. Mental health benefits of physical activity. J. Ment. Health 2005, 14, 445–451. [Google Scholar] [CrossRef]
  18. Maas, J.; Verheij, R.A.; Spreeuwenberg, P.; Groenewegen, P.P. Physical activity as a possible mechanism behind the relationship between green space and health: A multilevel analysis. BMC Public Health 2008, 8, 206. [Google Scholar] [CrossRef] [Green Version]
  19. Richardson, E.A.; Pearce, J.; Mitchell, R.; Kingham, S. Role of physical activity in the relationship between urban green space and health. Public Health 2013, 127, 318–324. [Google Scholar] [CrossRef] [Green Version]
  20. Handy, S.L.; Boarnet, M.G.; Ewing, R.; Killingsworth, R.E. How the built environment affects physical activity: Views from urban planning. Am. J. Prev. Med. 2002, 23, 64–73. [Google Scholar] [CrossRef]
  21. Frank, L.D.; Schmid, T.L.; Sallis, J.F.; Chapman, J.; Saelens, B.E. Linking objectively measured physical activity with objectively measured urban form: Findings from SMARTRAQ. Am. J. Prev. Med. 2005, 28, 117–125. [Google Scholar] [CrossRef]
  22. Sigmundová, D.; El Ansari, W.; Sigmund, E. Neighbourhood environment correlates of physical activity: A study of eight Czech regional towns. Int. J. Environ. Res. Public Health 2011, 8, 341–357. [Google Scholar] [CrossRef] [PubMed] [Green Version]
  23. Berke, E.M.; Koepsell, T.D.; Moudon, A.V.; Hoskins, R.E.; Larson, E.B. Association of the built environment with physical activity and obesity in older persons. Am. J. Public Health 2007, 97, 486–492. [Google Scholar] [CrossRef] [PubMed]
  24. McCormack, G.R.; Shiell, A. In search of causality: A systematic review of the relationship between the built environment and physical activity among adults. Int. J. Behav. Nutr. Phys. Act. 2011, 8, 125. [Google Scholar] [CrossRef] [PubMed] [Green Version]
  25. Gardsjord, H.; Tveit, M.; Nordh, H. Promoting youth’s physical activity through park design: Linking theory and practice in a public health perspective. Landsc. Res. 2014, 39, 70–81. [Google Scholar] [CrossRef]
  26. Giles-Corti, B.; Broomhall, M.; Knuiman, M.; Collins, C.; Douglas, K.; Ng, K.; Lange, A.; Donovan, R.J. Increasing walking: How important is distance to, attractiveness, and size of public open space? Am. J. Prev. Med. 2005, 28, 169–176. [Google Scholar] [CrossRef]
  27. Jan, C. “Spain Lifts Lockdown Rules on Exercise and Walks in Phase 2 Areas”. Translated by Melissa Kitson. El País. Available online: https://english.elpais.com/society/2020-05-27/spain-lifts-lockdown-rules-on-exercise-and-walks-in-phase-2-areas.html (accessed on 27 May 2021).
  28. Khalid, T. Coronavirus: Discover Which Curfew Movement Permits Are Available in Saudi Arabia. Alarabiya News, 5 May 2020. Available online: https://english.alarabiya.net/coronavirus/2020/05/25/Movement-permits-available-during-coronavirus-curfew-in-Saudi-Arabia-A-list(accessed on 25 May 2020).
  29. ABC News. A 2.5 km Exercise Limit Has Been Imposed in South Australia. This Map Shows How Far That Gets You. ABC News, 20 July 2021. Available online: https://www.abc.net.au/news/2021-07-20/south-australia-covid-lockdown-exercise-limit-radius/100308960?utm_campaign=abc_news_web&utm_content=link&utm_medium=content_shared&utm_source=abc_news_web(accessed on 20 July 2021).
  30. Elvery, S. What Is within 5 km of Your Victorian Home? Find Out Where You Can Go Under Stage 4 Coronavirus Restrictions with Our Interactive Map. ABC News, 4 August 2020. Available online: https://www.abc.net.au/news/2020-08-04/how-to-measure-whats-within-5km-radius-of-your-home-coronavirus/12517868?utm_campaign=abc_news_web&utm_content=link&utm_medium=content_shared&utm_source=abc_news_web(accessed on 4 April 2021).
  31. AlSherbini, R. COVID-19: Kuwait Allows 2-Hour Walk under Total Curfew. Gulf News, 9 May 2020. Available online: https://gulfnews.com/world/gulf/kuwait/covid-19-kuwait-allows-2-hour-walk-under-total-curfew-1.1589026532818(accessed on 9 May 2020).
  32. Cullbertson, A. COVID-19: How Far Can You Go for Exercise during Lockdown? Clarity Urged after Boris Johnson’s Bike Ride. Sky News, 12 January 2021. Available online: https://news.sky.com/story/covid-19-how-far-can-you-go-for-exercise-during-lockdown-clarity-urged-after-boris-johnsons-bike-ride-12185712(accessed on 12 January 2021).
  33. Petrella, D.; Clair, S.; Johnson, S.; Pratt, G.; Gov, J.B. Pritzker Issues Order Requiring Residents to “Stay at Home” Starting Saturday. Chicago Tribune 2020. Available online: https://www.chicagotribune.com/coronavirus/ct-coronavirus-illinois-shelter-in-place-lockdown-order-20200320-teedakbfw5gvdgmnaxlel54hau-story.html (accessed on 20 March 2021).
  34. Ministry of Health. The Kingdom of Saudi Arabia’s Experience in Health Preparedness and Response to COVID-19 Pandemic; Ministry of Health Publication: Singapore, 2020. Available online: https://www.moh.gov.sa/en/Ministry/MediaCenter/Publications/Pages/Publications-2020-10-27-001.aspx (accessed on 10 February 2022).
  35. Jardim, B.; de Castro Neto, M. Walkability Indicators in the Aftermath of the COVID-19 Pandemic: A Systematic Review. Sustainability 2022, 14, 10933. [Google Scholar] [CrossRef]
  36. Colom, A.; Mavoa, S.; Ruiz, M.; Wärnberg, J.; Muncunill, J.; Konieczna, J.; Vich, G.; Barón-López, F.J.; Fitó, M.; Salas-Salvadó, J.; et al. Neighbourhood walkability and physical activity: Moderating role of a physical activity intervention in overweight and obese older adults with metabolic syndrome. Age Ageing 2020, 50, 963–968. [Google Scholar] [CrossRef]
  37. Sun, Y.; He, C.; Zhang, X.; Zhu, W. Association of Built Environment with Physical Activity and Physical Fitness in Men and Women Living inside the CityWall of Xi’an, China. Int. J. Environ. Res. Public Health 2020, 17, 4940. [Google Scholar] [CrossRef]
  38. Rachele, J.N.; Sugiyama, T.; Davies, S.; Loh, V.H.; Turrell, G.; Carver, A.; Cerin, E. Neighbourhood built environment and physical function among mid-to-older aged adults: A systematic review. Health Place 2019, 58, 102137. [Google Scholar] [CrossRef]
  39. Lotfata, A.; Gemci, A.G.; Ferah, B. The changing context of walking behavior: Coping with the COVID-19 Pandemic in urban neighborhoods. Archnet-IJAR 2022, 16, 495–516. [Google Scholar] [CrossRef]
  40. Venter, Z.S.; Barton, D.N.; Gundersen, V.; Figari, H.; Nowell, M. Urban nature in a time of crisis: Recreational use of green space increases during the COVID-19 outbreak in Oslo, Norway. Environ. Res. Lett. 2020, 15, 104075. [Google Scholar] [CrossRef]
  41. Addas, A.; Maghrabi, A. How did the COVID-19 pandemic impact urban green spaces? A multi-scale assessment of Jeddah megacity (Saudi Arabia). Urban For. Urban Green. 2022, 69, 127493. [Google Scholar] [CrossRef] [PubMed]
  42. Kim, E.J.; Kim, J.; Kim, H. Does Environmental Walkability Matter? The Role of Walkable Environment in Active Commuting. Int. J. Environ. Res. Public Health 2020, 17, 1261. [Google Scholar] [CrossRef] [Green Version]
  43. Watson, K.B.; Whitfield, G.P.; Thomas, J.V.; Berrigan, D.; Fulton, J.E.; Carlson, S.A. Associations between the National Walkability Index and walking among US Adults—National Health Interview Survey, 2015. Prev. Med. 2020, 137, 106122. [Google Scholar] [CrossRef]
  44. Eisenmann, C.; Nobis, C.; Kolarova, V.; Lenz, B.; Winkler, C. Transport mode use during the COVID-19 lockdown period in Germany: The car became more important, public transport lost ground. Transp. Policy 2021, 103, 60–67. [Google Scholar] [CrossRef]
  45. Yıldırım, M.; Geçer, E.; Akgül, O. The impacts of vulnerability, perceived risk, and fear on preventive behaviours against COVID-19. Psychol. Health Med. 2020, 26, 35–43. [Google Scholar] [CrossRef]
  46. Zafri, N.; Khan, A.; Jamal, S.; Alam, B. Impacts of the COVID-19 Pandemic on Active Travel Mode Choice in Bangladesh: A Study from the Perspective of Sustainability and New Normal Situation. Sustainability 2021, 13, 6975. [Google Scholar] [CrossRef]
  47. Monterde-I-Bort, H.; Sucha, M.; Risser, R.; Honzickova, K. A European-Wide Study on the Effects of the COVID-19 Threat on Active Transport Modes. Sustainability 2022, 14, 3482. [Google Scholar] [CrossRef]
  48. Wang, Y.; Tsai, T.C.; Duncan, D.; Ji, J. Association of city-level walkability, accessibility to biking and public transportation and socio-economic features with COVID-19 infection in Massachusetts, USA: An ecological study. Geospat. Health 2022, 17, 1017. [Google Scholar] [CrossRef]
  49. Wo, J.C.; Kim, Y.A. Unintended consequences? The effects of neighbourhood walkability on crime in nine US cities. Br. J. Criminol. 2022, azac011. [Google Scholar] [CrossRef]
  50. Mitsutake, S.; Ishizaki, T.; Yokoyama, Y.; Nishi, M.; Koohsari, M.; Oka, K.; Yano, S.; Abe, T.; Kitamura, A. Do Walking-Friendly Built Environments Influence Frailty and Long-Term Care Insurance Service Needs? Sustainability 2021, 13, 5632. [Google Scholar] [CrossRef]
  51. Talen, E.; Koschinsky, J. The Walkable Neighborhood: A Literature Review. Int. J. Sustain. Land Use Urban Plan. 2013, 1, 211. [Google Scholar] [CrossRef]
  52. Yuan, K.; Abe, H.; Otsuka, N.; Yasufuku, K.; Takahashi, A. Impact of the COVID-19 Pandemic on Walkability in the Main Urban Area of Xi’an. Urban Sci. 2022, 6, 44. [Google Scholar] [CrossRef]
  53. Liu, Q.; Liu, Z.; Kang, T.; Zhu, L.; Zhao, P. Transport inequities through the lens of environmental racism: Rural-urban migrants under COVID-19. Transp. Policy 2022, 122, 26–38. [Google Scholar] [CrossRef]
  54. Ma, L.; Liu, Y.; Cao, J.; Ye, R. The impact of perceived racism on walking behavior during the COVID-19 lockdown. Transp. Res. D. Transp. Environ. 2022, 109, 103335. [Google Scholar] [CrossRef]
  55. Alhajaj, N. New Forms of Public Open Space in the City of Jeddah: Urban Design Scenarios for Increasing the Provision of POS to Enhance the Urban Health of a Rapidly Growing Saudi Arabian Metropolis. Ph.D. Thesis, University of Western Australia, Perth, Australia, 2014. [Google Scholar]
  56. UN-Habitat. SDG Indicator 11.7.1 Training Module: Public Space. United Nations Human Settlement Programme (UN-Habitat), Nairobi, 2018. Available online: https://www.dlgsc.wa.gov.au/department/publications/publication/classification-framework-for-public-open-space (accessed on 5 July 2021).
  57. King, W.; Belle, S.; Brach, J.; Simkin-Silverman, L.; Soska, T.; Kriska, A. Objective measures of neighborhood environment and physical activity in older women. Am. J. Prev. Med. 2005, 28, 461–469. [Google Scholar] [CrossRef]
  58. Sugiyama, T.; Francis, J.; Middleton, N.J.; Owen, N.; Giles-Corti, B. Associations between recreational walking and attractiveness, size, and proximity of neighborhood open spaces. Am. J. Public Health 2010, 100, 1752–1757. [Google Scholar] [CrossRef]
  59. Krenichyn, K. The only place to go and be in the city: Women talk about exercise, being outdoors, and the meanings of a large urban park. Health Place 2006, 12, 631–643. [Google Scholar] [CrossRef]
  60. Sugiyama, T.; Thompson, C.W. Associations between characteristics of neighborhood open space and older people’s walking. Urban For. Urban Green. 2008, 7, 41–51. [Google Scholar] [CrossRef]
  61. Siksna, A. The effects of block size and form in North American and Australian city centres. Urban Morphol. 1997, 1, 19–33. [Google Scholar] [CrossRef]
  62. Castagnoli, F. Orthogonal Town Planning in Antiquity; MIT Press: Cambridge, MA, USA, 1971. [Google Scholar]
  63. Hillier, B. Centrality as a process: Accounting for attraction inequalities in deformed grids. Urban Des. 1999, 4, 107–127. [Google Scholar]
  64. Siksna, A. City centre blocks and their evolution: A comparative study of eight American and Australian CBDs. J. Urban Des. 1998, 3, 253–283. [Google Scholar] [CrossRef]
  65. Ewing, R.; Cervero, R. Travel and the built environment. J. Am. Plan. Assoc. 2010, 76, 265–294. [Google Scholar] [CrossRef]
  66. Giles-Corti, B.; Wood, G.; Pikora, T.; Learnihan, V.; Bulsara, M.; Van Niel, K.; Timperio, A.; McCormack, G.; Villanueva, K. School site and the potential to walk to school: The impact of street connectivity and traffic exposure in school neighborhoods. Health Place 2011, 17, 545–550. [Google Scholar] [CrossRef]
  67. Hess, P.M.; Moudon, A.V.; Snyder, M.C.; Stanilov, K. Site design and pedestrian travel. Transp. Res. Rec. 1999, 1674, 9–19. [Google Scholar] [CrossRef] [Green Version]
  68. Targa, F.; Clifton, K. The built environment and trip generation for non-motorized travel. J. Transp. Stat. 2005, 8, 55–70. [Google Scholar]
  69. Jacobs, J. The Death and Life of Great American Cities; Random House: New York, NY, USA, 1961. [Google Scholar]
  70. Krier, L. Urban components. Archit. Des. 1984, 54, 43–49. [Google Scholar]
  71. Carmona, M.; Heath, T.; Oc, T.; Tiesdell, S. Public Places Urban Spaces: The Dimensions of Urban Design; Architectural Press: Oxford, UK, 2003. [Google Scholar]
  72. Stangl, P.; Guinn, J. Neighborhood design, connectivity assessment and obstruction. Urban Des. Int. 2011, 16, 285–296. [Google Scholar] [CrossRef]
  73. Ewing, R. Pedestrian and Transit Friendly Design: A Primer for Smart Growth. Smart Growth Network Manual. Available online: https://19january2017snapshot.epa.gov/smartgrowth/pedestrian-and-transit-friendly-design.html (accessed on 13 January 2021).
  74. Boarnet, M.G.; Joh, K.; Siembab, W.; Fulton, W.; Nguyen, M.T. Retrofitting the suburbs to increase walking: Evidence from a land use-travel study. Urban Stud. 2011, 48, 129–159. [Google Scholar] [CrossRef] [Green Version]
  75. Boer, R.; Zheng, Y.; Overton, A.; Ridgeway, G.K.; Cohen, D.A. Neighborhood design and walking trips in ten U.S. metropolitan areas. Am. J. Prev. Med. 2007, 32, 298–304. [Google Scholar] [CrossRef] [Green Version]
  76. Sevtsuk, A.; Kalvo, R.; Ekmekci, O. Pedestrian accessibility in grid layouts: The role of block, plot and street dimensions. Urban Morphol. 2016, 20, 89–106. [Google Scholar] [CrossRef]
  77. Koohsari, M.J. Access to public open space: Is distribution equitable across different social-economic areas. J. Urban Environ. Eng. 2011, 5, 67–72. [Google Scholar] [CrossRef]
  78. Geurs, K.T.; van Wee, B. Accessibility evaluation of land-use and transport strategies: Review and research directions. J. Transp. Geogr. 2004, 12, 127–140. [Google Scholar] [CrossRef]
  79. Vickerman, R.W. Accessibility, attraction, and potential: A review of some concepts and their use in determining mobility. Environ. Plan A Econ. Space 1974, 6, 675–691. [Google Scholar] [CrossRef] [Green Version]
  80. Shen, G. Location of manufactured housing and its accessibility to community services: A GIS-assisted spatial analysis. Socio-Econ. Plan. Sci. 2005, 39, 25–41. [Google Scholar] [CrossRef]
  81. Yang, X.; Cao, Y.; Wu, A.; Guo, M.; Dong, Z.; Tang, L. Accessibility assessment of buildings based on multi-source spatial data: Taking Wuhan as a case study. ISPRS Int. J. Geo-Inf. 2021, 10, 701. [Google Scholar] [CrossRef]
  82. Lan, F.; Wu, Q.; Zhou, T.; Da, H. Spatial effects of public service facilities accessibility on housing prices: A case study of Xi’an, China. Sustainability 2018, 10, 4503. [Google Scholar] [CrossRef] [Green Version]
  83. Hansen, W.G. How accessibility shapes land use. J. Am. Inst. Plan. 1959, 25, 73–76. [Google Scholar] [CrossRef]
  84. Cavallaro, F.; Dianin, A. An innovative model to estimate the accessibility of a destination by public transport. Transp. Res. D Transp. Environ. 2020, 80, 102256. [Google Scholar] [CrossRef]
  85. Lättman, K.; Olsson, L.E.; Friman, M. Development and test of the perceived accessibility scale (PAC) in public transport. J. Transp. Geogr. 2016, 54, 257–263. [Google Scholar] [CrossRef]
  86. Lättman, K.; Olsson, L.E.; Friman, M. A new approach to accessibility–Examining perceived accessibility in contrast to objectively measured accessibility in daily travel. Res. Transp. Econ. 2018, 69, 501–511. [Google Scholar] [CrossRef]
  87. Liu, Q.; An, Z.; Liu, Y.; Ying, W.; Zhao, P. Smartphone-based services, perceived accessibility, and transport inequity during the COVID-19 pandemic: A cross-lagged panel study. Transp. Res. D Transp. Environ. 2021, 97, 102941. [Google Scholar] [CrossRef] [PubMed]
  88. UN-Habitat. Jeddah CPI Profile 2018. Available online: https://unhabitat.org/sites/default/files/2020/04/cpi_profile_for_jeddah_2019.pdf (accessed on 27 June 2021).
  89. Jeddah Municipality. Local Plan Atlas: Maps of Districts and Neighborhoods. Available online: https://www.jeddah.gov.sa/Business/LocalPlanning/Atlas/index.php (accessed on 2 September 2022).
  90. Alhajaj, N.; Hendrigan, C. Out of sight and out of reach: Public access strategies using a mixed method to reconnect a Saudi urban mega-district with its shoreline. Coast. Manag. 2022, 50, 325–345. [Google Scholar] [CrossRef]
  91. Yang, C.; Shi, S.; Runeson, G. Associations between community parks and social interactions in master-planned estates in Sydney, Australia. Sustainability 2022, 14, 3496. [Google Scholar] [CrossRef]
Figure 1. (a) Geographic location of Saudi Arabia and its neighboring countries, (b) the location of Jeddah city on the Red Sea, and (c) the six residential districts selected for this study (illustrated in bold black boundaries). The districts are (A) Mushrefah, (B) Al-Safa, (C) Al-Naeem, (D) Al-Sulaymaniyah, (E) Al-Salamh, and (F) Al-Rawdah.
Sustainability 14 14094 g001
Figure 2. Example of the different urban block sizes and patterns in the study residential district (Scale 1:3000).
Sustainability 14 14094 g002
Figure 3. Examples of POS categories. Left: a built neighborhood park. Right: an unbuilt neighborhood park is currently being used as an illegal parking space and for the dumping of damaged vehicles.
Sustainability 14 14094 g003
Figure 4. Steps (AE) shows the methodological framework.
Sustainability 14 14094 g004
Figure 5. The coverage area (hatched zones) of built POS when applying the imposed one-kilometer walking distance to the selected residential districts (Scale 1:50,000).
Sustainability 14 14094 g005
Table 1. POS categories and criteria (adopted from UN-Habitat [56], City-wide public space strategies: Guide for local governments).
POS
Category
DefinitionUseAverage
Area
Walking
Distance
Local/pocketSmall parklets for recreation needs of the immediate residential populationRecreation purposes and may include small areas of nature space0.03–0.04 hectares400 m/5 min
NeighborhoodLarger spaces to fulfill the recreational and social needs of a communityRecreation, sporting, and natural features conservation0.04–0.4 hectares400 m from households
District/citySubstantial open space for organized formal sportRecreation areas and some nature spaces0.4–10 hectares800 m or 10 min
RegionalLarge city parks that serve one or more geographical or social regionsOrganized sport, play, social interaction, relaxation, and enjoyment of nature10–50 hectares-
National/metropolitan-Recreation and sporting50–200 hectares-
Table 2. Block size and length.
Case StudyLand Area (Hectares)Total PopulationAverage Block Size
(m2)
Average Block Length (m)Average Block Width
(m)
Al-Salamh693118,0809860Small13779
Mushrefah55996,8774284Small7653
Al-Safa1395222,21512,539Medium15785
Al-Naeem59092,86616,290Medium209103
Al-Rawdah833145,6698756Small10881
Al-Sulaymaniyah17137,73212,765Medium15884
Table 3. POS provisions.
Cast StudyLand Area (Hectares)Total Number
of POS
Number of Built POSNumber of Unbuilt POSNumber of
Converted POS
Total Area of Built POS (Hectares)Percentage of Built POSPercentage of POS Land Area to District
Al-Salamh693523411714.465%2%
Mushrefah55920190110.695%1.9%
Al-Safa139510245421519.644%1.4%
Al-Naeem59063262899.941%1.7%
Al-Rawdah8334115131317.437%2%
Al-Sulaymaniyah1711771002.441%1.4%
Table 4. POS provision and population accessibility within one kilometer.
Case StudyLand Area (Hectares)Total PopulationTotal Area of Built POS (Hectares)Percentage of Built POSPercentage of POS Land Area to DistrictProvision of Built POS per Person (m2)Percentage of the Population That Can Access POS within One Kilometer
Al-Salamh693118,08014.465%2%0.1294%
Mushrefah55996,87710.695%1.9%0.1166%
Al-Safa1395222,21519.644%1.4%0.0994%
Al-Naeem59092,8669.941%1.7%0.11100%
Al-Rawdah833145,66917.437%2%0.1279%
Al-Sulaymaniyah17137,7322.441%1.4%0.0699%
Publisher’s Note: MDPI stays neutral with regard to jurisdictional claims in published maps and institutional affiliations.

