Abstract
The COVID-19 pandemic policies have had a significant impact on the daily commuter flow at the metro rail transit stations. In this study, we propose a modified state-dependent M(n)/G(n)/C/C queuing model for the analysis of commuter flow in the corridor of metro rail transit stations in the COVID-19 situation in order to ensure safe social distance. The proposed model is a finite capacity queuing system with state-dependent commuter arrivals and state-dependent service rates based on the flow–density relationship. First, a mathematical queuing model is developed by using the birth–death process (BDP) and the expected number of commuters, and average area occupied per commuter and blocking probabilities are computed. Then, the accuracy of the proposed model is verified by a discrete-event simulation (DES) framework. (1) The proposed model’s results are compared to those of the existing M/G(n)/C/C model. The proposed modified model’s sensitivity analysis revealed that the anticipated number of commuters in the corridor remains smaller when the arrival rate is state-dependent. (2) In accordance with COVID-19 protocol, when the facility is congested, commuters are discouraged from entering and a safe social distance is maintained between them. (3) No commuters are impeded, and adequate throughput is ensured from the corridor. The proposed model will assist the metro rail transit station operators in making intelligent decisions regarding the operations in the COVID-19 situation.
1. Introduction
Commuter congestion in public transportation hubs is a condition that arises when the number of commuters approaches or exceeds the service facility’s capacity. These hubs play an important role in moving vast numbers of commuters in urban and suburban areas [1]. However, the COVID-19 outbreak has had a significant effect on daily commuter travel in the public transportation hubs [2,3]. Moreover, there is evidence that the COVID-19 outbreak has posed profound challenges for public transit agencies in terms of ensuring passenger safety [4,5]. The issue of commuter traffic congestion has attracted the attention of academic researchers and transportation engineers due to the population’s perpetual growth. Due to longer commuter traffic jams and facility queue waiting times, the lack of productive time ultimately has a negative impact on the economy, which is even worsened by the COVID-19 outbreak. Due to COVID-19, it is necessary to modify the capacity analysis procedures in order to ensure safe social distancing and safe movement, while simultaneously limiting delays as much as possible.
The Planning and Design Process for Metro Rail Transit Station Service Facilities is outlined in the Transit Capacity and Quality of Service Manual (TCQSM) [6]. It relies on the assumption that the commuter arrival process (also known as arrival demand to the service facility) and the service time (also known as the amount of time spent getting services) of service facilities are both deterministic and have limited capacity for a specified level of service (LOS). It is implausible to ignore the fluctuation in the arrival demand of commuters as well as the variation in the service time of the service facilities in metro rail transit stations. This is especially problematic when considering the fact that the flow of commuters through the service facility is always random. It is important to note that the design manual does not contain any provisions for conducting an analysis of service facilities in light of the COVID-19 pandemic. In the past, intricate models were developed in order to account for the randomness of the arrival flows of commuters at metro rail transit stations [7,8,9]. These models attempted to model the variation in the service process of the corridors. Nevertheless, these queuing models were based on the speed –density relationship of commuters at metro rail transit stations. The models assume that the walking speed decreases as the number of commuters increases in the metro rail station facilities. However, in the case of COVID-19, in order to maintain a safe distance for commuters along the corridor, these models cannot be used reliably for the capacity analysis. In the COVID-19 situation, in a corridor facility, a density up to a certain extent is maintained. A greater number of commuters are deterred from using the corridor when density exceeds that critical density, which means that arrival rate is required to be state-dependent and drops when critical density is achieved. Therefore, in lieu of the speed–density model, it is required to consider the flow–density relationship, which more accurately depicts the flow conditions during a pandemic.
Several studies have been conducted in the past to evaluate the performance of pedestrian service facilities at transportation hubs as well as scheduling, such as at metro stations [10,11,12], commercial and educational buildings [13,14], airport terminals [15,16], and bus rapid transit stations [17,18,19,20,21], employing both analytical queuing modeling and simulation techniques. The majority of these models considered the state-dependent service time of facilities based on the speed–density relationship, which does not accurately represent the congested and uncongested conditions that exist, especially in the COVID-19 situation. In a pandemic, it is necessary to maintain a greater social distance between commuters, so the capacity of service facilities remains constrained and lower than normal. When commuters want to enter a service facility and see that the facility in front of them is crowded, they slow down and avoid joining the queue. Therefore, the downstream congestion affects the arrival rate at the upstream end. Due to the fact that the flow –density relationship accounts for both congested and uncongested conditions, we modify the exiting state-dependent queuing model by incorporating the flow–density relationship and consider state-dependent arrival rate, which will be able to capture the true scenario during COVID-19 at metro rail transit stations.
Metro rail transit must facilitate commuter travel demand during the pandemic as well as provide improved protection to reduce and avoid its spread. COVID-19’s impact on metro rail stations has been studied by several researchers. Research revealed that the COVID-19 turmoil can give rise to functional behavioral changes, including lessened metro rail transit usages due to increased walking and bicycling, and negative attitudes towards public transportation [22]. A simulation study of metro rail transit station exits under the COVID-19 scenario was conducted using a social force model [23]. Plausible isolation amenities, greater walking distances, and expected speed can reduce spread of infection, but enhancing the number of individuals leaving the station will lessen the efficiency of stations. Stairway barriers can reduce the spread of COVID-19 infections by up to 23%. Another study found that COVID-19 remains prevalent in public transportation [24]. It is crucial to improve the safety and efficiency of the metro rail transit station by implementing stringent measures for diseases that are under control. In order to prevent and control COVID-19, the government should strengthen environmental cleaning, personal protection and disinfection. No research has, to the best of our knowledge, developed or modified the queuing model for the performance analysis of metro rail transit stations taking COVID-19 into account. Therefore, the aim of this research is to develop an queuing model by incorporating the flow–density relationship that accounts for congested and congested conditions as well as incorporates state-dependent arrival rates to depict the COVID-19 scenario at metro rail transit stations.
2. Method
Inspired by the study conducted in [25], in this research, we also describe the metro rail transit corridor as a rectangular facility, as shown in Figure 1. As commuters enter the corridor facility from any upstream facility or entrance gate, they occupy the spaces. The empty spaces along the corridor serve as “multiple servers.” When occupied by commuters, these numerous servers stay operational. The total number of these multiple servers, which is also the corridor facility’s capacity, is contingent on the length , width , and congestion density of commuters . The occupation of these vacant spaces increases commuter density . When all vacant spaces are occupied, commuters remain stationary and the flow halts. Jam density refers to the commuter density corresponding to a jam condition in the corridor facility of a metro rail transit station. Consequently, the capacity of the corridor facility at a metro rail transit station can be determined using Equation (1).
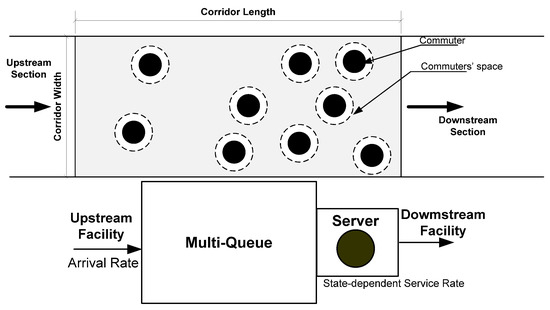
Figure 1.
Queuing system representation of corridor facility at metro rail transit station.
Due to the limited capacity of the corridor facility, the number of empty spaces reduces as the number of commuters increases. In the COVID-19 situation, to ensure safety by restricting the spread of virus and blocking the transmission chain, safety measures are implemented, such as appropriate social distancing and wearing facial masks. Therefore, the passenger flow analysis is done and considers both congested and uncongested conditions, which can be explained by the fundamental triangular diagram in Figure 2.
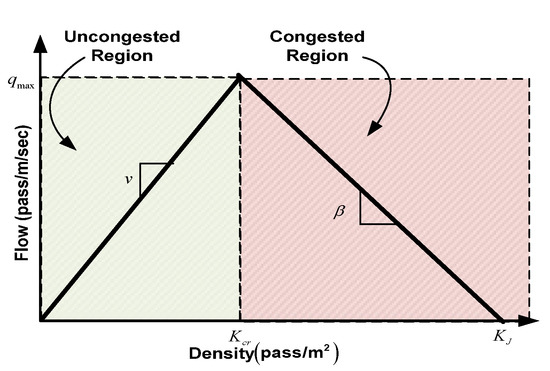
Figure 2.
Triangular flow–density relationship.
This fundamental diagram shows some important points, which are the corridor capacity , jam density , critical density (the density and speed occurring at capacity operations) and the maximum flow . Within this triangular relationship, there are two traffic conditions, i.e., congested traffic flow and uncongested flow, as shown in Figure 3.
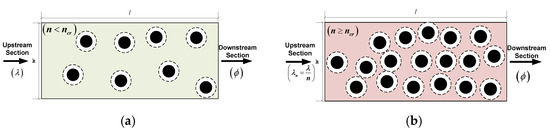
Figure 3.
Flow conditions in the corridor of metro rail transit station. (a) Uncongested condition. (b) Congested condition.
Assume that the number of commuters in the corridor is , and that below this number the flow is uncongested, while above this number the flow is congested . In areas with lower densities, the flow of traffic steadily increases as the population density rises. Commuters are free to move about in this condition up until the point where the flow is at its maximum. When a certain density threshold is reached , the state of the traffic transitions from free flow traffic to congested traffic. After that point , an increase in population leads to a decrease in the amount of space that exists between commuters in the event that conditions are congested. This, in turn, causes a decrease in travel speed and has an effect on the social distance that exists between individuals. A queue occurring at a bottleneck propagates upstream of the corridor facility.
Based on the above analysis, a corridor facility at metro rail transit stations is a multiservice finite-capacity queuing system with the state-dependent service flow rates. The service flow rate is function of commuter density both in uncongested and congested conditions. The commuter arrival rate remains constant in uncongested condition and becomes state-dependent, i.e., arrivals are discouraged when there is congestion (density reaches the critical value) to ensure safe distance among commuters and break the transmission chain of the virus. Therefore, the general form to represent a state-dependent, finite-capacity, multiservice corridor facility at a metro rail transit station is the queuing system.
2.1. Developing Queuing Model
In this section, we discuss the formulation of a mathematical queuing model for a corridor at a metro rail transit station considering the unidirectional flow of commuter traffic from an upstream service facility to a downstream service facility in the COVID-19 scenario, as depicted in Figure 3. The arrivals are assumed to occur in a Poisson process with fluctuating rates. To ensure safe distancing in the COVID-19 situation, the arrival demand remains constant when the number of commuters is less than critical numbers and the arrival demand becomes state-dependent when the corridor operates in congested conditions, as shown in Table 1. When the corridor is saturated, the average arrival demand of commuters drops at the rate of as there is a queue downstream ahead of the arriving commuters. The average arrival interval will increase due to deceleration of arriving commuters. Similarly, the service flow rate of the corridor facility at the metro rail transit station is based on the triangular flow–density model (Figure 2).

Table 1.
Fluctuated arrival and service rates.
The number of commuters in the corridor facility at a metro rail transit station at critical or optimal capacity is given by Equation (2). The corridor facility will be considered uncongested if it operates below and congested if it operates above .
The service process at the corridor facility is also assumed to occur in an exponential process with a state-dependent service rate . Therefore, based on the above analysis, in order to formulate our proposed model for the performance assessment of corridor facilities at a metro rail transit station in the COVID-19 situation, we employ the birth–death (BD) process [26]. A multiservice finite-capacity queuing system, when the arrival and service processes are state-dependent, the state transition diagram for the process is shown by Figure 4. The vertical dotted line demarcates the congested and uncongested conditions. From the state-transition diagram, we can develop an infinitesimal generator matrix with birth rate and death rate , which is given by Matrix P.
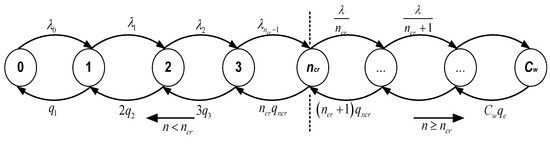
Figure 4.
The BD process state-transition diagram.
The BD process is an example of a continuous time Markov process (CTMC). The BD process is a stochastic process with the property that the net change across an infinitesimal time interval is −1, 0, or 1. The number of commuters in the corridor (system) of metro rail transit station represents the “state” of the system. Let be the steady-state probability of commuters in the corridor facility of a metro rail transit station for the states , respectively. Given the number of commuters , the probability of an increase (in an infinitesimal time period) is:
Similarly, the probability of a reduction is:
Therefore, the probability that state of the system will stay the same is:
When the system operates for some time, it will reach equilibrium, i.e., a steady-state condition will be achieved. Equilibrium in turn implies that the state probabilities eventually become independent of time and approach to constant values.
For the state-dependent arrival demand and service process as well as for a multiservice system, an infinitesimal generator matrix can be:
We have:
Setting the differential-difference equations to 0, the general solutions to the Chapman–Kolmogorov steady-state difference equations for the state probabilities are given below.
| Uncongested Condition and Constant Arrivals and Plugging , we get; Putting gets us | Congested Condition and Discouraged Arrivals and |
Since the sum of the probabilities must equal unity, we have normalization given by .
From this, we obtain the value for idle probability, , as given by Equation (4):
In order to compute the expected number of commuters, EN and average area occupied per commuter EA, we can use Equations (5) and (6), which are based on the state probabilities.
- The expected number of commuters in the corridor facility:
- The average area occupied per commuter:
2.2. Developing Discrete Event Simulation Model
As shown in Figure 5, the DES framework was developed in the SimEvents® module of MATLAB in order to test the precision of our proposed modified queuing model for the flow of commuters in the corridor of the metro rail transit station in the COVID-19 scenario. This was done in order to ensure that our model accurately represented the flow of commuters. The FIFO Queue blocks, which serve as a queuing space for the commuters, the Server blocks, which act as multiple services where commuters stay for a certain period of time, and the Generator block, which generates the commuters at a given inter-arrival time are the essential building blocks for the development of a SimEvents®-based DES framework. The commuter inter-arrival time is the reciprocal of average commuter arrival rate. Level-2 S-function blocks compute the state-dependent service flow rate under congested and uncongested conditions. Since the corridor has a finite capacity, a mechanism is embedded in the DES framework that stops the commuters from entering the facility when the number of commuters becomes equal to the capacity of the corridor.
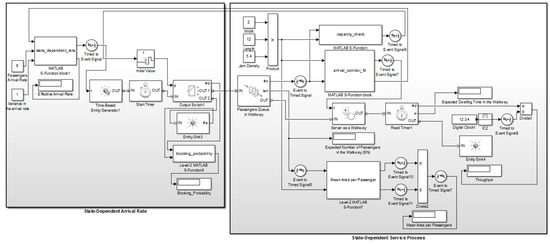
Figure 5.
Discrete event simulation framework of the corridor facility at metro rail transit station.
As discussed earlier, both the arrival rate and service flow rate are state-dependent under both uncongested and congested conditions; therefore, Figure 6 shows the variation in arrival rate and service flow rate with the increase or decrease in the number of commuters in the corridor of metro rail transit stations.

Figure 6.
State-dependent arrival and service flow rate of the corridor facility. (a) State-dependent arrival process. (b) State-dependent service process.
3. Results
The computational experiments section consists of three subsections that include the description regarding commuter flow data, verification of proposed model for the COVID-19 situation, by state-dependent DES framework. This section on computational experiments is divided into three subsections. These subsections include a description of commuter flow data, verification of a proposed model for the COVID-19 situation using a state-dependent DES framework, comparison with an existing model [27] and sensitivity analysis under different design parameters.
3.1. Data
Commuter arrival flow data are initially gathered through a field survey of various Beijing and Chengdu stations. The data represent the weekday and weekend commuter flows, respectively. Similar information was collected on Thursday and Saturday during their peak hours. The collection of data that takes place between 7:30 and 8:30 in the morning represents the morning peak, 11:30 and 12:30 in the afternoon represents the flat peak, and 17:30 and 18:30 in the evening represents the evening peak.
3.2. Verification of Proposed Model
It is essential to first examine the precision of our proposed modified queuing model by using a state-dependent DES framework in order to meet the prerequisites for carrying out the sensitivity analysis under a variety of different parameters. The average commuter arrival demand, as well as the length and width of the corridor facility, are the three input parameters that our proposed model and state-dependent DES framework takes into consideration. By using Equation (7), we can see that the arrival demand from average commuters is dependent on the peak-hour commuter volume (Q) and the peak-hour factor (), both of which are required to be predetermined from the field survey. In a similar vein, the average service flow rate is a function of the length as well as the width of the corridor, both of which are required to be predetermined.
In order to verify precision, tests were performed on corridors of metro rail transit stations with different lengths and widths. The area of each corridor is equal to 8 × 2.5 m2 and 5 × 2 m2. Similarly, tests were performed with different commuter arrival demand, which are obtained from the field survey data. The performance measures (shown in Table 2), including the blocking probability , expected number of commuters in the corridor (EN) and average area occupied per commuter (EA), are computed by our proposed model and verified by the state-dependent DES framework.
Table 2.
Verification of proposed mathematical queuing model.
3.3. Sensitivity Analysis
It is vital to study how the fluctuation in the values of certain design factors affects the performance of metro rail transit station corridors in the COVID-19 situation or the values of some other factors. While looking to the metro rail transit station corridor in the COVID-19 situation, several questions may arise. On average, in the COVID-19 situation, what is the expected number of commuters in the corridor when the arrival rate rates or drops? How is the throughput affected by arrival rate during COVID-19?
This section describes the sensitivity analysis tests conducted to determine the effect of key design parameters on the anticipated number of commuters in the corridor (EN), the average area occupied per commuter (EA), and the throughput in the corridor of metro rail transit stations.
3.3.1. Effect of Average Commuter Arrival Demand on EN and EA
Starting with a base average commuter arrival demand of ped/s, the average arrival demand level was increased in increments of 0.5 ped/s (up to a demand level of 6 ped/s), and the expected number of commuters and average area occupied per commuter were calculated. It can be seen that there is a significant increase in the expected number of commuters (EN) (Figure 7a–c) and decrease in area occupied per commuter (EA) (Figure 7d–f) with increasing arrival demand . We can also observe that the increase in expected number of commuters (EN) and decrease in area occupied per commuter (EA) is more rapid in the case of the existing model compared to the model for the same area of corridor. The value of EN is much lower and EA much higher in the case of the model, which is a true depiction of social distancing in the COVID-19 situation. The EN will remain within a limit once a critical density is achieved and social distancing is maintained. Therefore, during the COVID-19 situation, for assessment of commuter flow, the application of the model overestimates the performance measure values and impacts the overall operation of the metro rail transit station.

Figure 7.
Impact of average commuter arrival demand on EN and EA.
3.3.2. Effect of Commuter Arrival Demand on the Throughput
This section explores the effects of average commuter arrival demand on the corridor throughput. For a given dimension, i.e., area of the corridor equals 5 × 2 m2, is there a value of average commuter arrival demand that maximizes the throughput? From the practical point of view, it is important to determine the value of commuter arrival demand that maximizes the throughput . This information will help the metro rail transit station operators in making routing decisions and control the arrival demand (flow). Figure 8 shows us the throughput values with respect to average commuter arrival demand for the models based on both the and relationship. By plotting the graph, we are able to determine the optimum commuter arrival demand at which the throughput is maximized and further increase of arrival demand may compromise the safe social distance among commuters in the COVID-19 situation. From Figure 8, by comparing the graphs of and , it can be seen that the value of throughput drops at a lower value of average commuter arrival demand for the than the model.
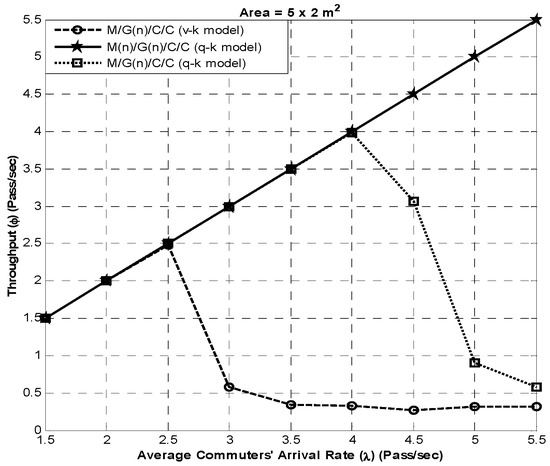
Figure 8.
Effect of arrival rate on the throughput.
The throughput value for the model drops at 2.5 ped/s, while for the model it reaches 4 ped/s and then drops. In the case of the model, the throughput increases with increase in arrival rate .
For the model, the value of throughput remains almost constant after average commuter arrival demand of 3.5 ped/s; however, for the model, it drops at 4 ped/s and continues to decrease with increasing arrival demand. This might be due to ignoring of uncongested condition by the model. As per the model, the walking speed drops as the number of commuters increases, even when there are few people in the corridor. This is not true because the walking speed is not affected by few surrounding people in the corridor. The commuters may still be able to maintain free flow speed till a point beyond which free flow speed is not possible. Therefore, the maximum value of throughput value obtained by the model is not the true representation of the COVID-19 situation.
3.3.3. Effect of Corridor Width (W) on EN and EA
Another parameter of interest is the width of the corridor. Provided that the length of the corridor is fixed and the average commuter arrival demand is predetermined, we can assess the effects of increasing or decreasing width on performance measures and especially allowing commuters to pass through dedicated corridors in the COVID-19 situation. Existing studies [7,8,9] reveal that the width of the facility is one of the vital parameters that affect its performance. This parameter is also useful for metro rail transit station designers in making the decision of whether or not to increase the width of the corridor. As shown in Figure 9, for a constant value of average commuter arrival demand and length of the corridor, expected number of commuters (EN) drops at 1.75 m for the model and 3.25 m for the . However, in the model, the commuters travel at a free flow speed even at lower value of width. This also reveals that the application of the model during COVID-19 for the assessment of passenger flow overestimates the results.

Figure 9.
Effect of the corridor width on EN and EA.
3.3.4. Effect of Commuter Arrival Demand on the Steady-State Probability Distribution
Keeping the area of the corridor constant and increasing the arrival demand with an increment of 0.50 ped/s, it has been observed that at lower arrival demand , both and models result in zero blocking probability . This means that with higher inter-arrival time among commuters, the corridor will remain uncongested. In Figure 10, as the arrival demand increases to from 2.5 to 3 ped/s, the model shows an abrupt change in the blocking probability from 0 (0%) to 0.72 (72%), while the q-k model still shows the 0 value of blocking probability. At average arrival demand of 4.5 ped/s, the blocking probability rises to 0.93 (93%), whereas the q-k model starts showing some glimpses of blocking, which is 0.17 (17%).
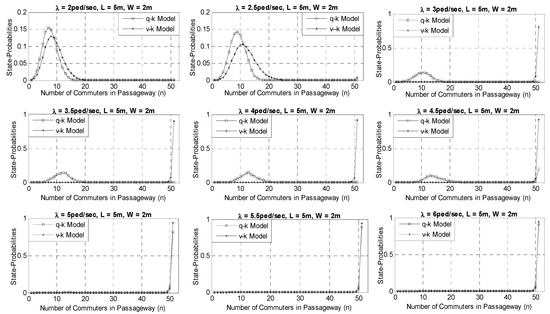
Figure 10.
Steady-state probability distribution for different arrival demands.
This shows that the model overestimates the blocking probability result. The model assumes that the corridor will always remain in congestion, even with a lower number of commuters, which is not the case in reality. A very high level of arrival demand may occur during emergency evacuation. The results indicate here that the given dimensions are not suitable for the larger arrival demand to carry. The commuters block to enter the facility. Therefore, there is a need to optimally design the dimensions of the corridor by keeping the blocking probability equal to zero.
4. Conclusions
We developed a modified queuing model to estimate the anticipated number of commuters, the average area occupied per commuter, the probability of blocking, and the throughput in the corridors of metro rail transit stations operating under COVID-19 protocols. The accuracy of the proposed model is validated by the DES framework using actual field data gathered from multiple metro rail transit stations. Sensitivity analysis was performed to gain insight into the impact of various design parameters using our proposed model and comparing it to an existing model. Several conclusions are drawn from this investigation.
- The transient solution of our proposed queuing models derived using the BD process appears to agree quite well with the values determined using the DES framework
- For the data considered herein, the computational experiments indicate that the expected number of commuters (EN) and blocking probability for the model are smaller than for the model. The values of EN for the model are much smaller due to a state-dependent arrival rate effect, depicting the social distancing protocol of COVID-19.
- The model for the service facility capacity analysis in the COVID-19 situation overestimates the results and shows a larger value of EN, even at a smaller arrival demand . Therefore, the model cannot be used for the analysis when pandemic conditions are considered.
- The sensitivity analysis also revealed that the throughput value drops rapidly for the model, even at a lower arrival demand compared to . However, for the model, the values of throughput increase linearly with arrival rates and no blocking is observed.
- The average area occupied per commuter (EA) is higher in the case of the model, while it is smaller in the case of the model. The average area occupied per commuter (EA) is highest in the case of . This means that at a certain density, when arrival rates are discouraged, social distancing is ensured, allowing commuters to travel at a free-flowing speed despite a small corridor area.
- For model, the blocking remains at zero for all arrival rates to ensure social distancing in the corridor.
Notably, the scope of this study is limited to the development of a modified queuing model for capacity analysis of metro rail transit station corridors in order to implement the COVID-19 protocol for safe social distancing. Future research may incorporate various other service amenities of metro rail transit stations, such as stairs and platforms, among others.
Author Contributions
Conceptualization, A.K.; formal analysis, A.K., H.A. and H.S.A.; investigation, A.K.; methodology, A.K.; project administration, F.C.; resources, H.A. and F.C.; software, H.A. and F.C.; supervision, F.C.; visualization, H.A., H.S.A. and F.C. All authors have read and agreed to the published version of the manuscript.
Funding
This research received no external funding.
Institutional Review Board Statement
Not applicable.
Informed Consent Statement
Not applicable.
Data Availability Statement
Not applicable.
Acknowledgments
We sincerely acknowledge colleagues at the College of Transportation Engineering, Tongji University Shanghai and College of Civil Engineering, Taif University for their efforts and technical guidance in this research.
Conflicts of Interest
The authors declare no conflict of interest.
References
- Sipetas, C.; Keklikoglou, A.; Gonzales, E.J. Estimation of left behind subway passengers through archived data and video image processing. Transp. Res. Part C Emerg. Technol. 2020, 118, 102727. [Google Scholar] [CrossRef]
- Basu, R.; Ferreira, J. Sustainable mobility in auto-dominated Metro Boston: Challenges and opportunities post-COVID-19. Transp. Policy 2021, 103, 197–210. [Google Scholar] [CrossRef]
- Dzisi, E.K.J.; Dei, O.A. Adherence to social distancing and wearing of masks within public transportation during the COVID 19 pandemic. Transp. Res. Interdiscip. Perspect. 2020, 7, 100191. [Google Scholar] [CrossRef] [PubMed]
- Auad, R.; Dalmeijer, K.; Riley, C.; Santanam, T.; Trasatti, A.; Van Hentenryck, P.; Zhang, H. Resiliency of on-demand multimodal transit systems during a pandemic. Transp. Res. Part C Emerg. Technol. 2021, 133, 103418. [Google Scholar] [CrossRef] [PubMed]
- Naveen, B.R.; Gurtoo, A. Public transport strategy and epidemic prevention framework in the Context of COVID-19. Transp. Policy 2022, 116, 165–174. [Google Scholar] [CrossRef]
- KFH Group. Transit Capacity and Quality of Service Manual; The National Academies Press: Washington, DC, USA, 2013. [Google Scholar]
- Hu, L.; Jiang, Y.; Zhu, J.; Chen, Y. A PH/PH (n)/C/C state-dependent queuing model for metro station corridor width design. Eur. J. Oper. Res. 2015, 240, 109–126. [Google Scholar] [CrossRef]
- Jiang, Y.; Zhu, J.; Hu, L.; Lin, X.; Khattak, A. AG/G (n)/C/C state-dependent simulation model for metro station corridor width design. J. Adv. Transp. 2016, 50, 273–295. [Google Scholar] [CrossRef]
- Khattak, A.; Yangsheng, J.; Lu, H.; Juanxiu, Z. Width design of urban rail transit station walkway: A novel simulation-based optimization approach. Urban Rail Transit 2017, 3, 112–127. [Google Scholar] [CrossRef][Green Version]
- Zhu, J.; Hu, L.; Jiang, Y.; Khattak, A. Circulation network design for urban rail transit station using a PH (n)/PH (n)/C/C queuing network model. Eur. J. Oper. Res. 2017, 260, 1043–1068. [Google Scholar] [CrossRef]
- Khattak, A.; Yangsheng, J.; Hussain, A. Design of passengers’ circulation areas at the transfer station: An automated hybrid simulation-differential evolution framework. Simul. Model. Pract. Theory 2018, 87, 293–310. [Google Scholar] [CrossRef]
- Khattak, A.; Hussain, A. Hybrid DES-PSO framework for the design of commuters’ circulation space at multimodal transport interchange. Math. Comput. Simul. 2021, 180, 205–229. [Google Scholar] [CrossRef]
- Khalid, R.; Mnawawi, M.K.; Kawsar, L.A.; Ghani, N.A.; Kamil, A.A.; Mustafa, A. A discrete event simulation model for evaluating the performances of an M/G/C/C state dependent queuing system. PLoS ONE 2013, 8, e58402. [Google Scholar]
- Weiss, A.; Williams, L.; MacGregor Smith, J. Performance & optimization of M/G/c/c building evacuation networks. J. Math. Model. Algorithms 2012, 11, 361–386. [Google Scholar]
- Park, Y.; Ahn, S.B. Optimal assignment for check-in counters based on passenger arrival behaviour at an airport. Transp. Plan. Technol. 2003, 26, 397–416. [Google Scholar] [CrossRef]
- Regattieri, A.; Gamberini, R.; Lolli, F.; Manzini, R. Designing production and service systems using queuing theory: Principles and application to an airport passenger security screening system. Int. J. Serv. Oper. Manag. 2010, 6, 206–225. [Google Scholar] [CrossRef]
- Wang, C.; Ye, Z.; Fricker, J.D.; Zhang, Y.; Ukkusuri, S.V. Bus capacity estimation using stochastic queuing models for isolated bus stops in China. Transp. Res. Rec. 2018, 2672, 108–120. [Google Scholar] [CrossRef]
- Gunawan, F.E. Design and implementation of discrete-event simulation framework for modeling bus rapid transit system. J. Transp. Syst. Eng. Inf. Technol. 2014, 14, 37–45. [Google Scholar] [CrossRef]
- Gunawan, F.E.; Gunawan, A.A. Simulation model of bus rapid transit. EPJ Web Conf. 2014, 68, 00021. [Google Scholar] [CrossRef]
- Tian, X.Y.; Jiang, H.Y.; Zha, J. Scheduling Optimization of Inter-City Bus Rapid Transit Based on M/M/C/N/∞ Queuing Model. Appl. Mech. Mater. 2012, 235, 294–297. [Google Scholar] [CrossRef]
- Bunker, J.M. Probabilistic Modeling of Bus Rapid Transit Station Loading Area Selection for Bus Capacity Estimation. Transp. Res. Rec. 2022, 2676, 03611981221082553. [Google Scholar] [CrossRef]
- De Haas, M.; Faber, R.; Hamersma, M. How COVID-19 and the Dutch ‘intelligent lockdown’change activities, work and travel behaviour: Evidence from longitudinal data in the Netherlands. Transp. Res. Interdiscip. Perspect. 2020, 6, 100150. [Google Scholar] [PubMed]
- Gutiérrez, A.; Miravet, D.; Domènech, A. COVID-19 and urban public transport services: Emerging challenges and research agenda. Cities Health 2021, 5, S177–S180. [Google Scholar] [CrossRef]
- Shen, J.; Duan, H.; Zhang, B.; Wang, J.; Ji, J.S.; Wang, J.; Pan, L.; Wang, X.; Zhao, K.; Ying, B. Prevention and control of COVID-19 in public transportation: Experience from China. Environ. Pollut. 2020, 266, 115291. [Google Scholar] [CrossRef] [PubMed]
- Liu, J.; Hu, L.; Xu, X.; Wu, J. A queuing network simulation optimization method for coordination control of passenger flow in urban rail transit stations. Neural Comput. Appl. 2021, 33, 10935–10959. [Google Scholar] [CrossRef]
- Stewart, W.J. Probability, Markov Chains, Queues, and Simulation: The Mathematical Basis of Performance Modeling; Princeton University Press: Princeton, NJ, USA, 2009. [Google Scholar]
- Cruz, F.R.; Smith, J.M.; Medeiros, R. An M/G/C/C state-dependent network simulation model. Comput. Oper. Res. 2005, 32, 919–941. [Google Scholar] [CrossRef]
Publisher’s Note: MDPI stays neutral with regard to jurisdictional claims in published maps and institutional affiliations. |
© 2022 by the authors. Licensee MDPI, Basel, Switzerland. This article is an open access article distributed under the terms and conditions of the Creative Commons Attribution (CC BY) license (https://creativecommons.org/licenses/by/4.0/).