
Modified State-Dependent


Abstract
:1. Introduction
2. Method
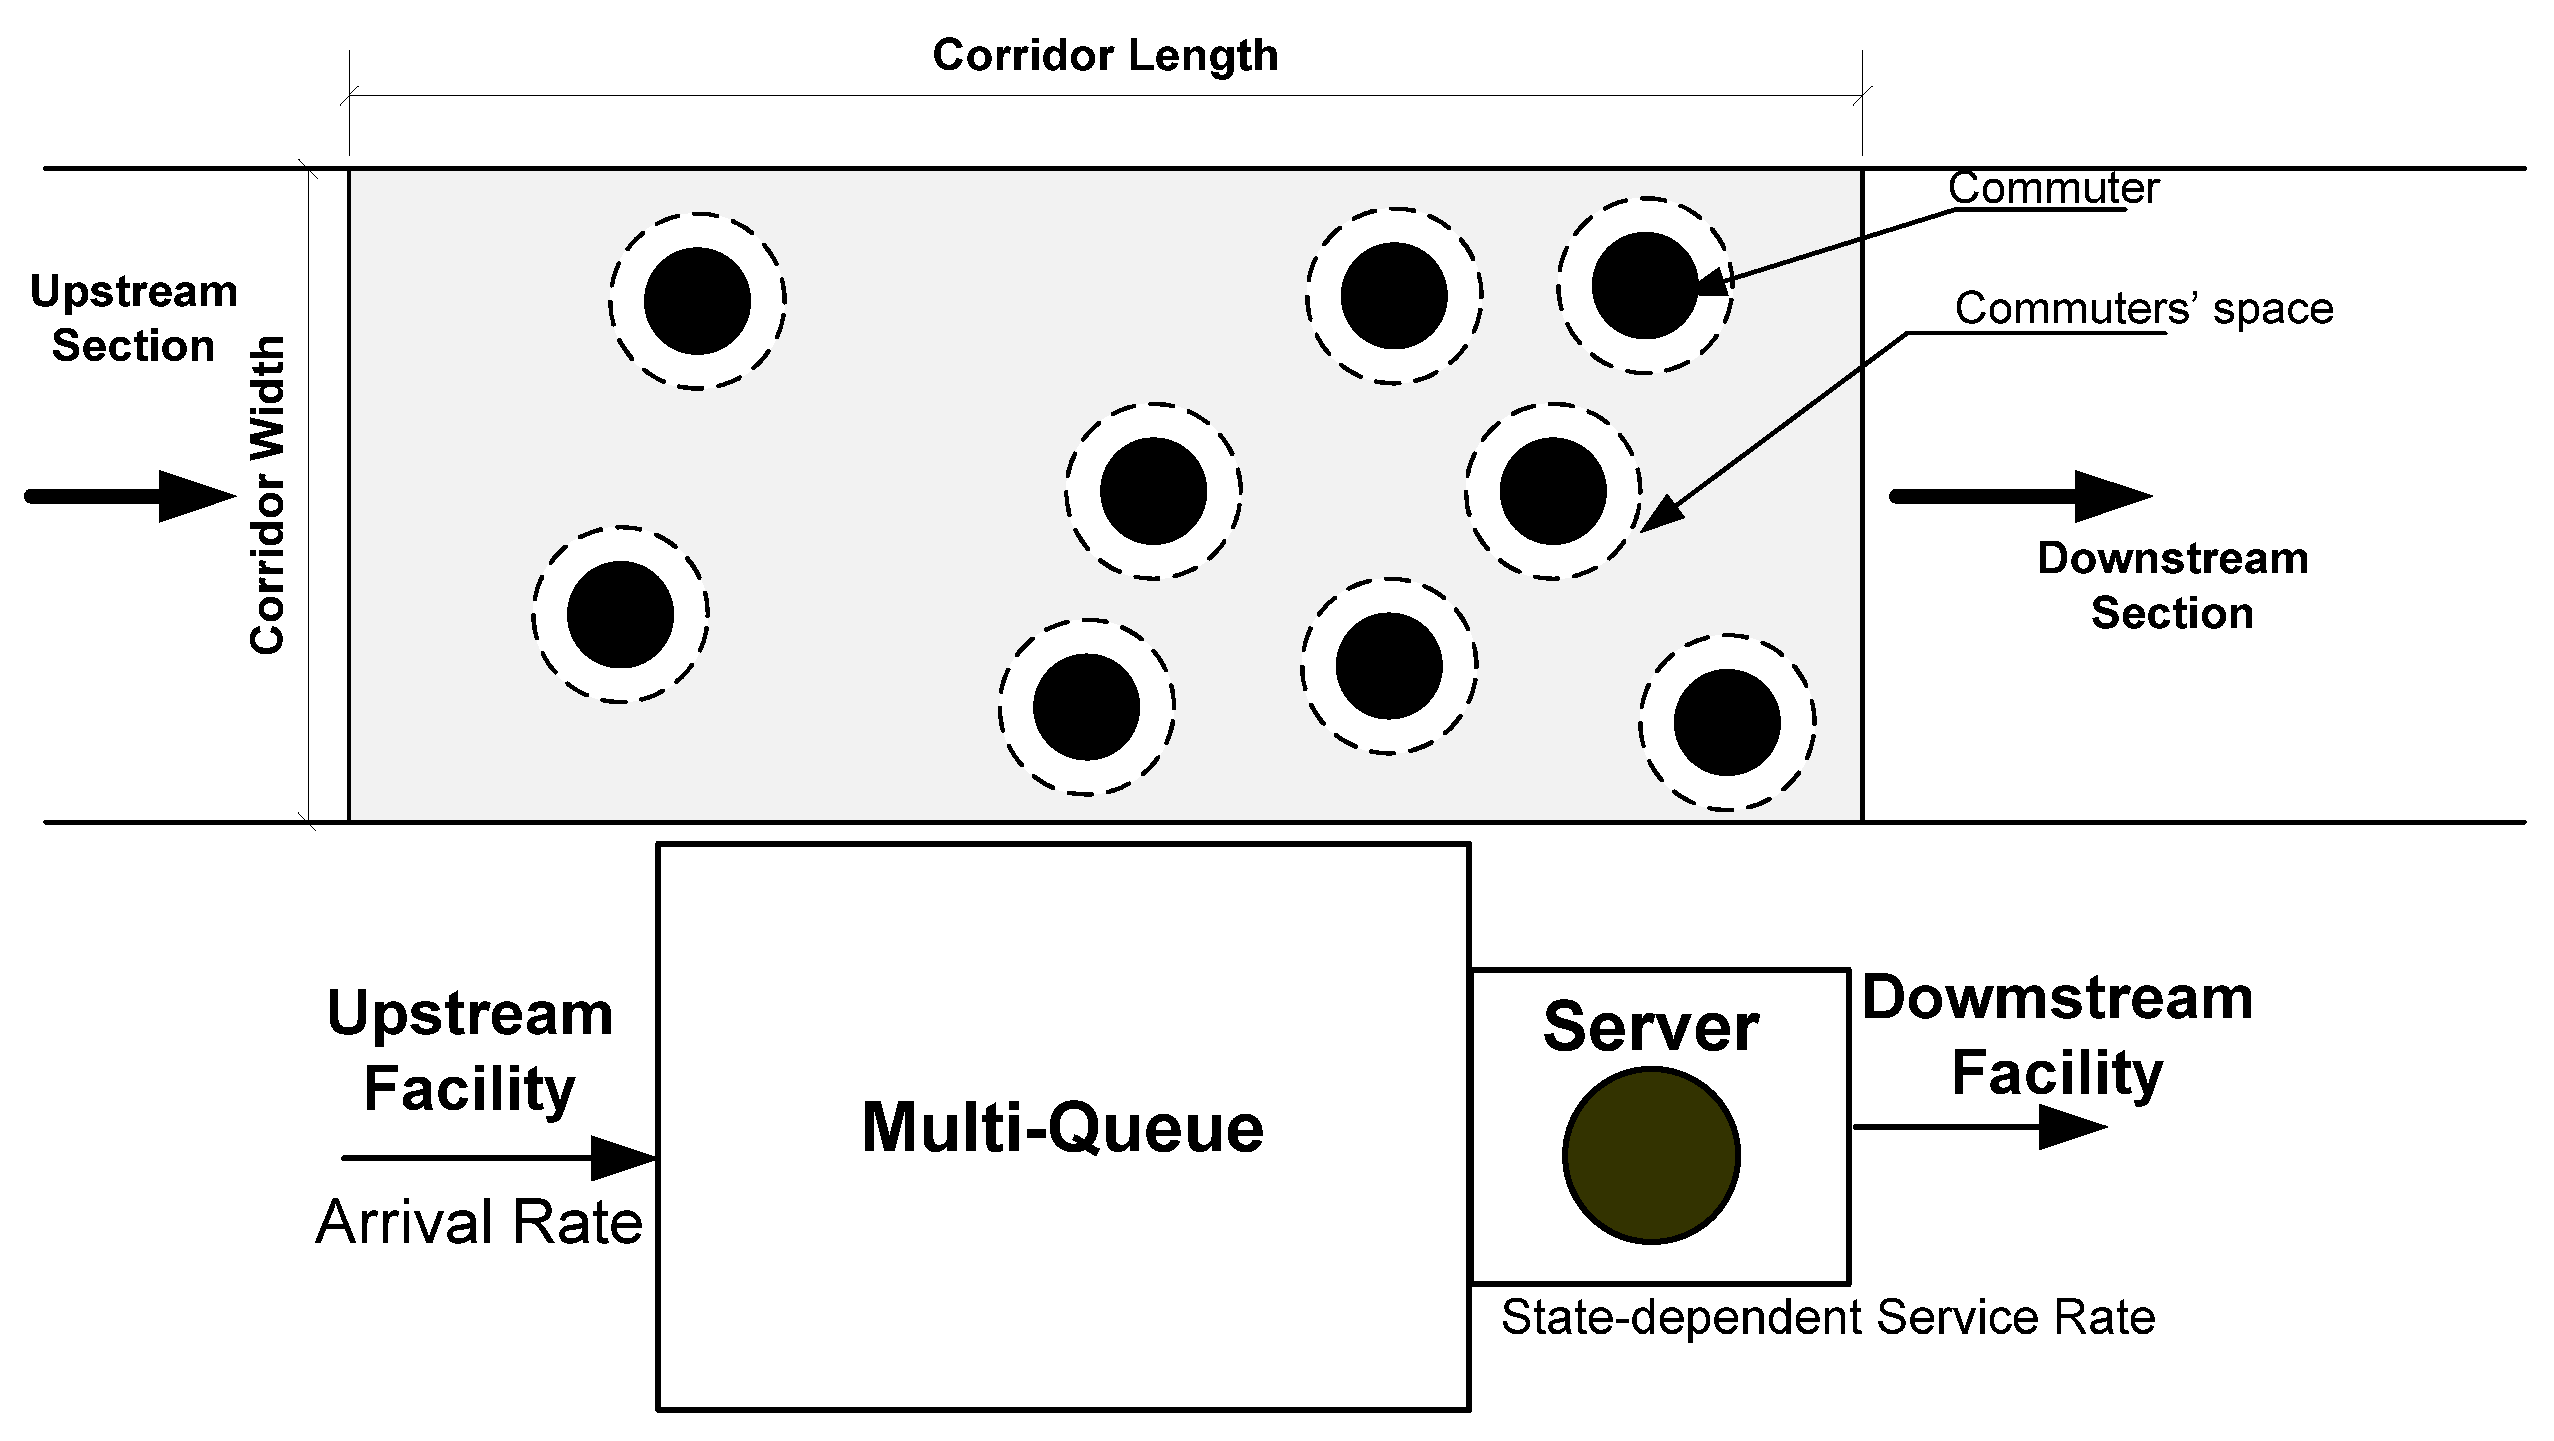
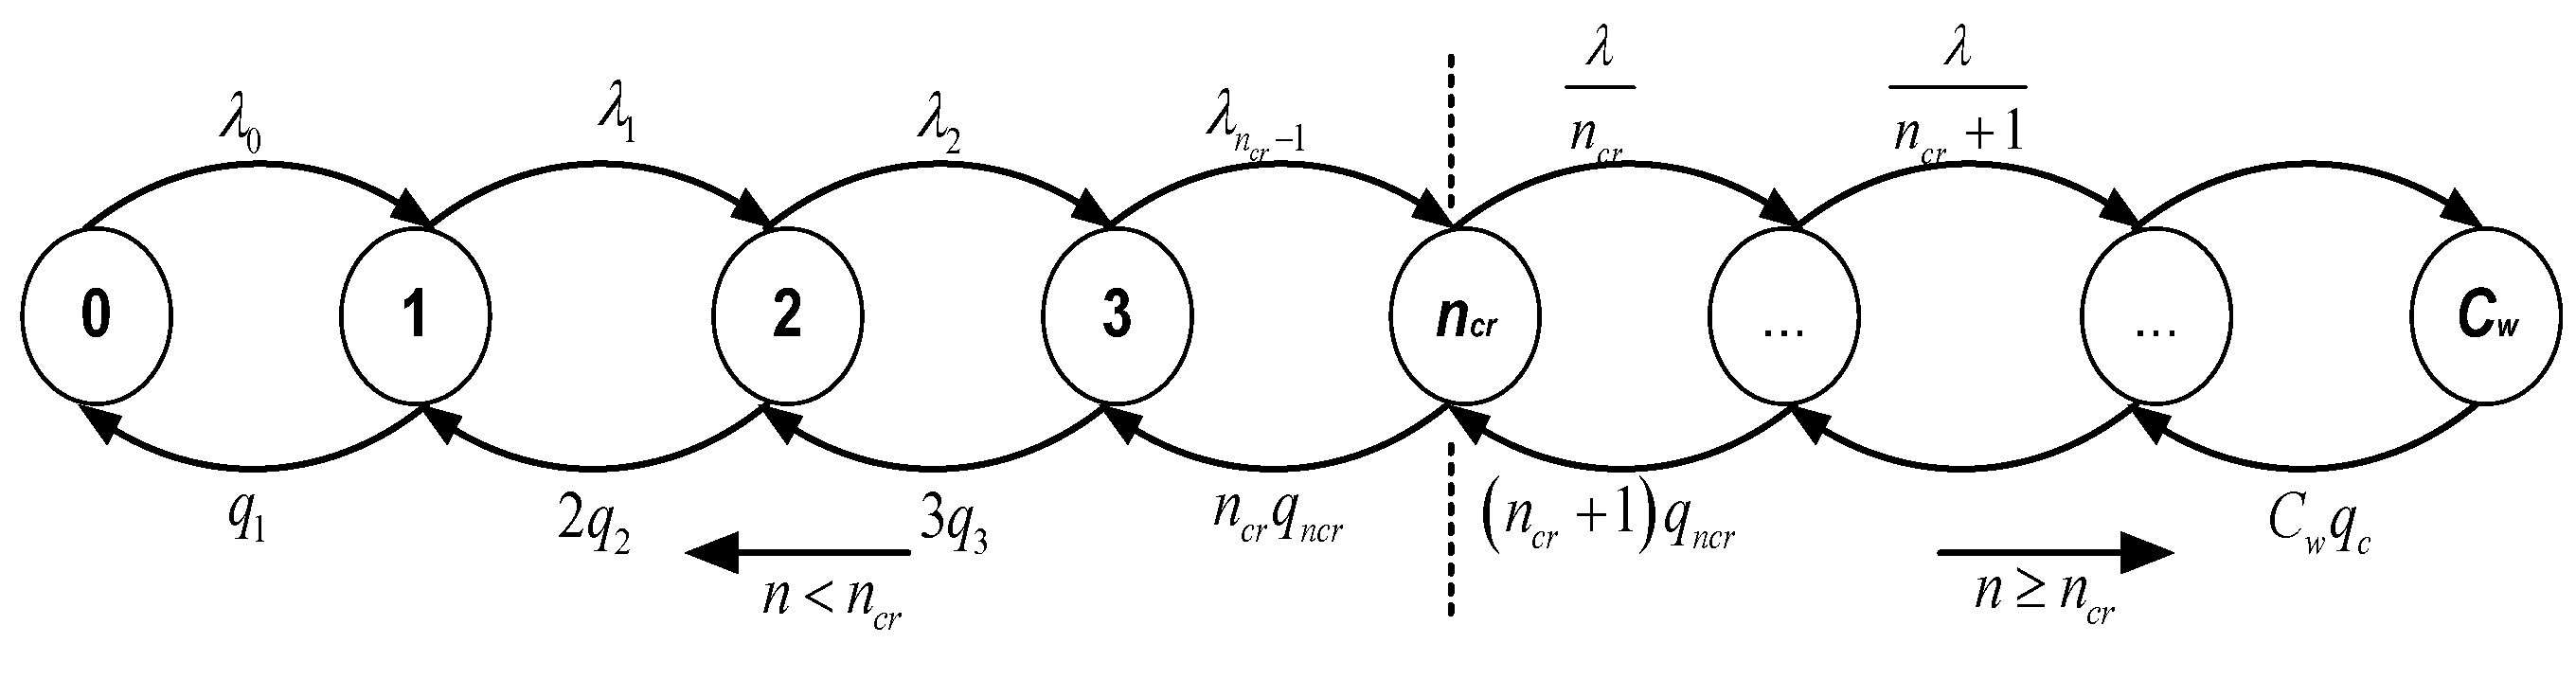
2.1. Developing Queuing Model
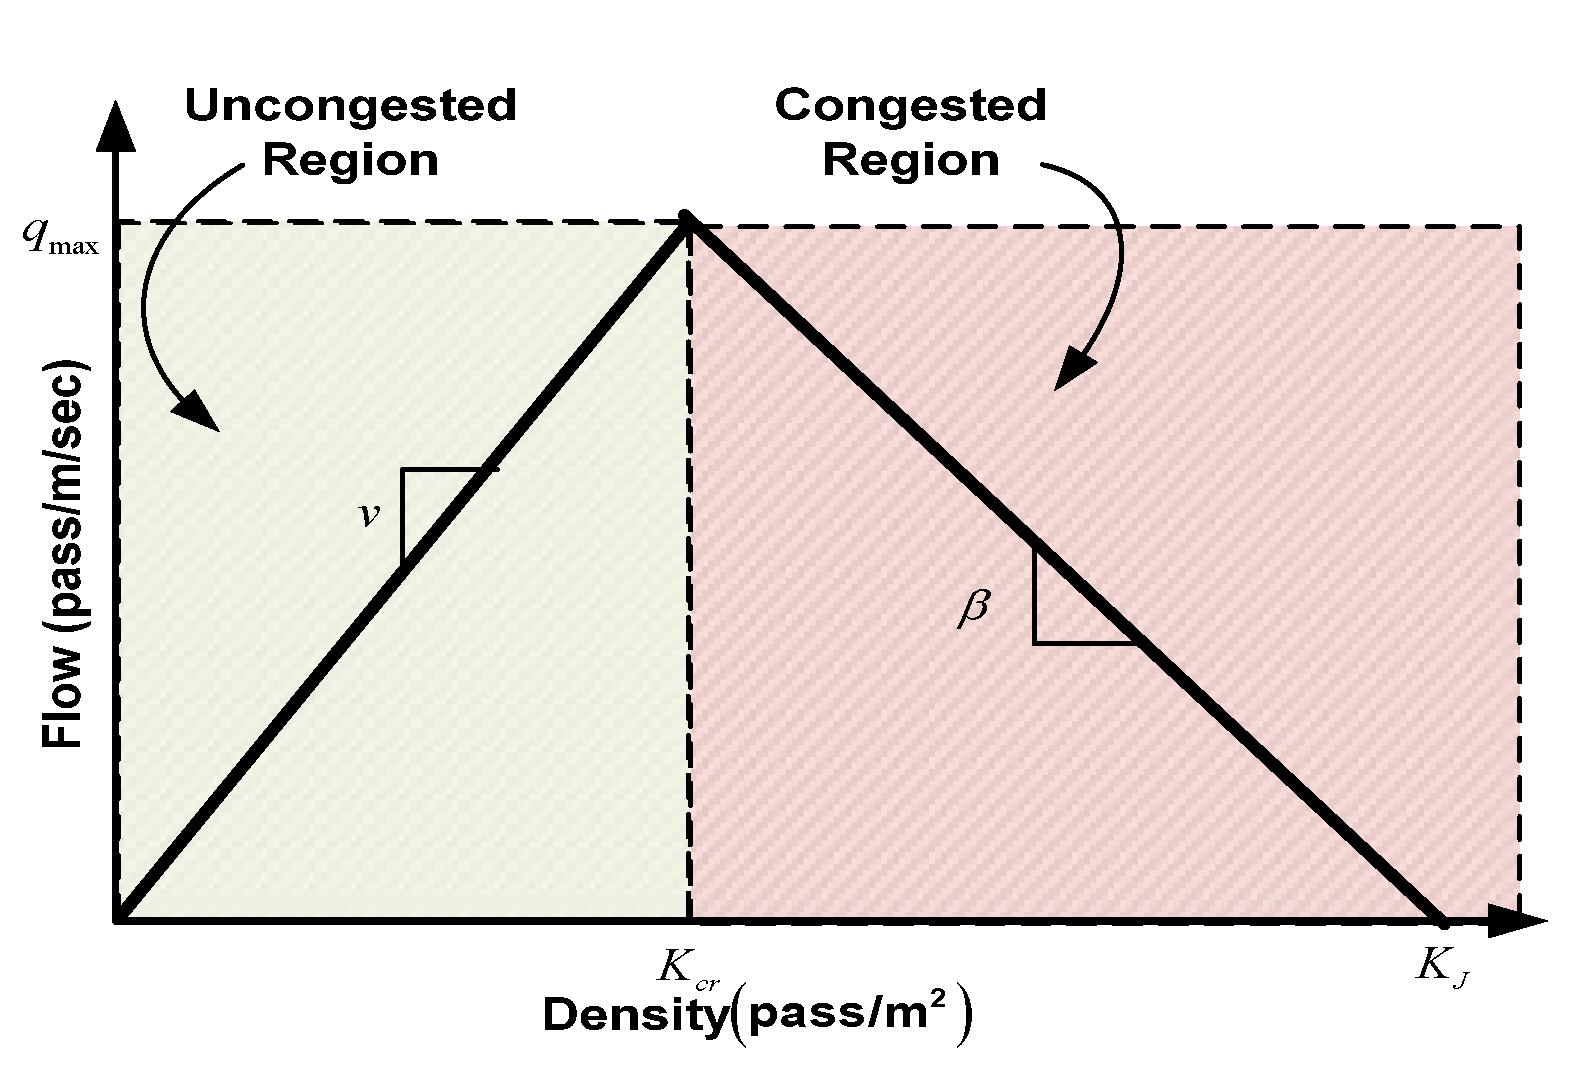
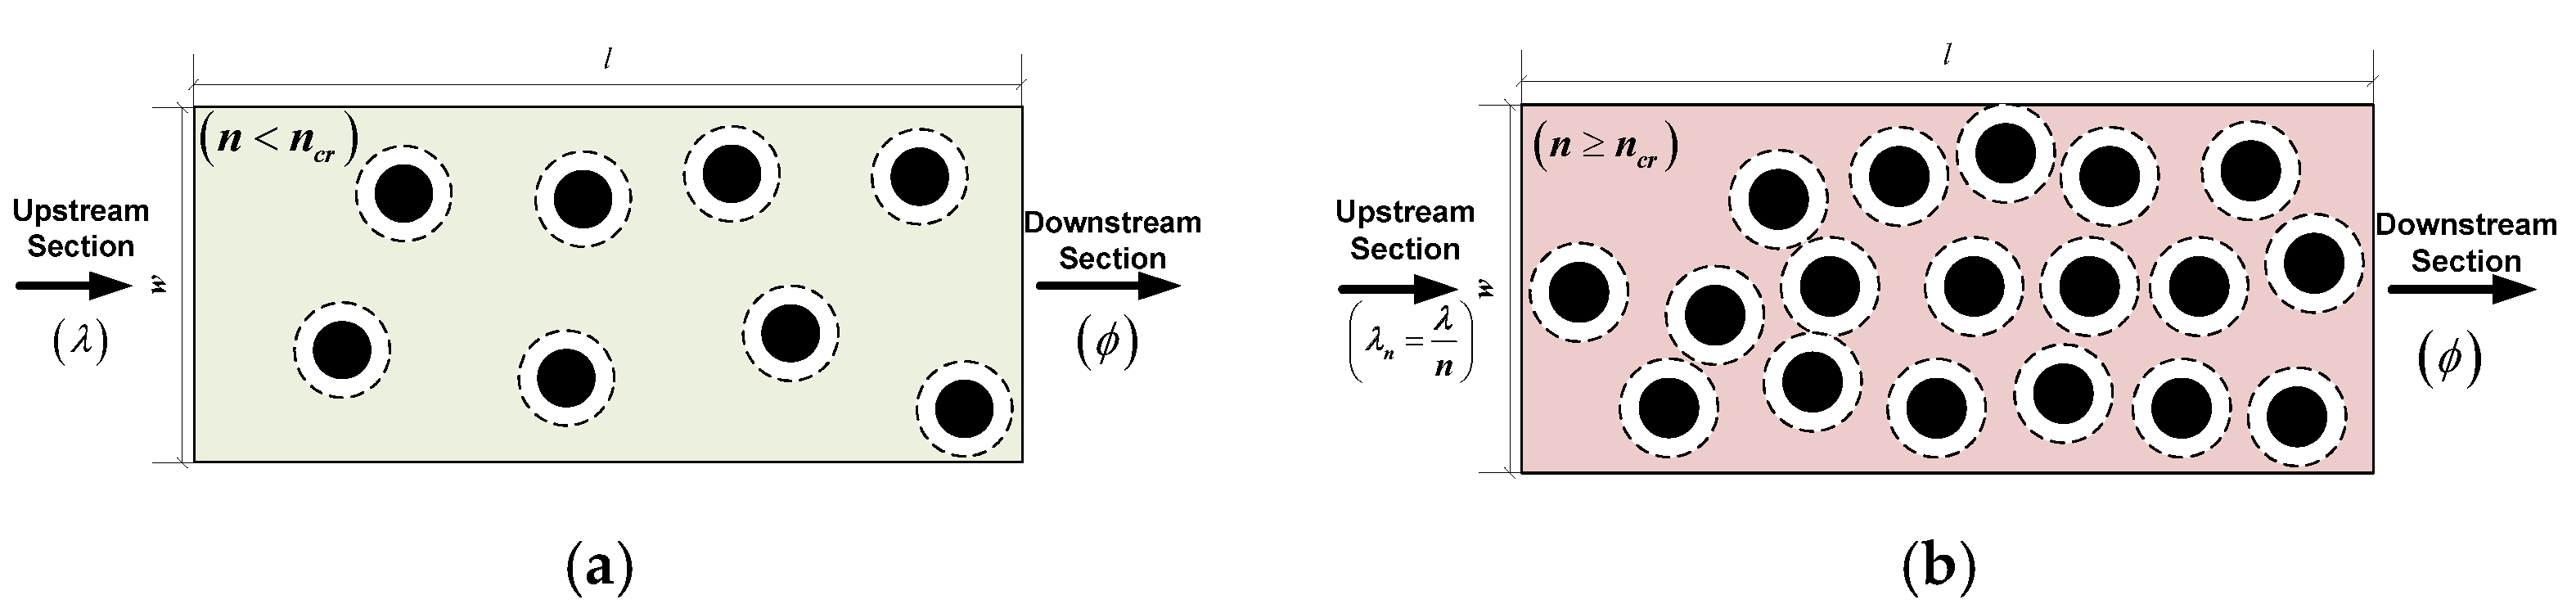
| Uncongested Condition and Constant Arrivals and Plugging , we get; Putting gets us | Congested Condition and Discouraged Arrivals and |
- The expected number of commuters in the corridor facility:
- The average area occupied per commuter:
2.2. Developing Discrete Event Simulation Model
3. Results
3.1. Data
3.2. Verification of Proposed Model
3.3. Sensitivity Analysis
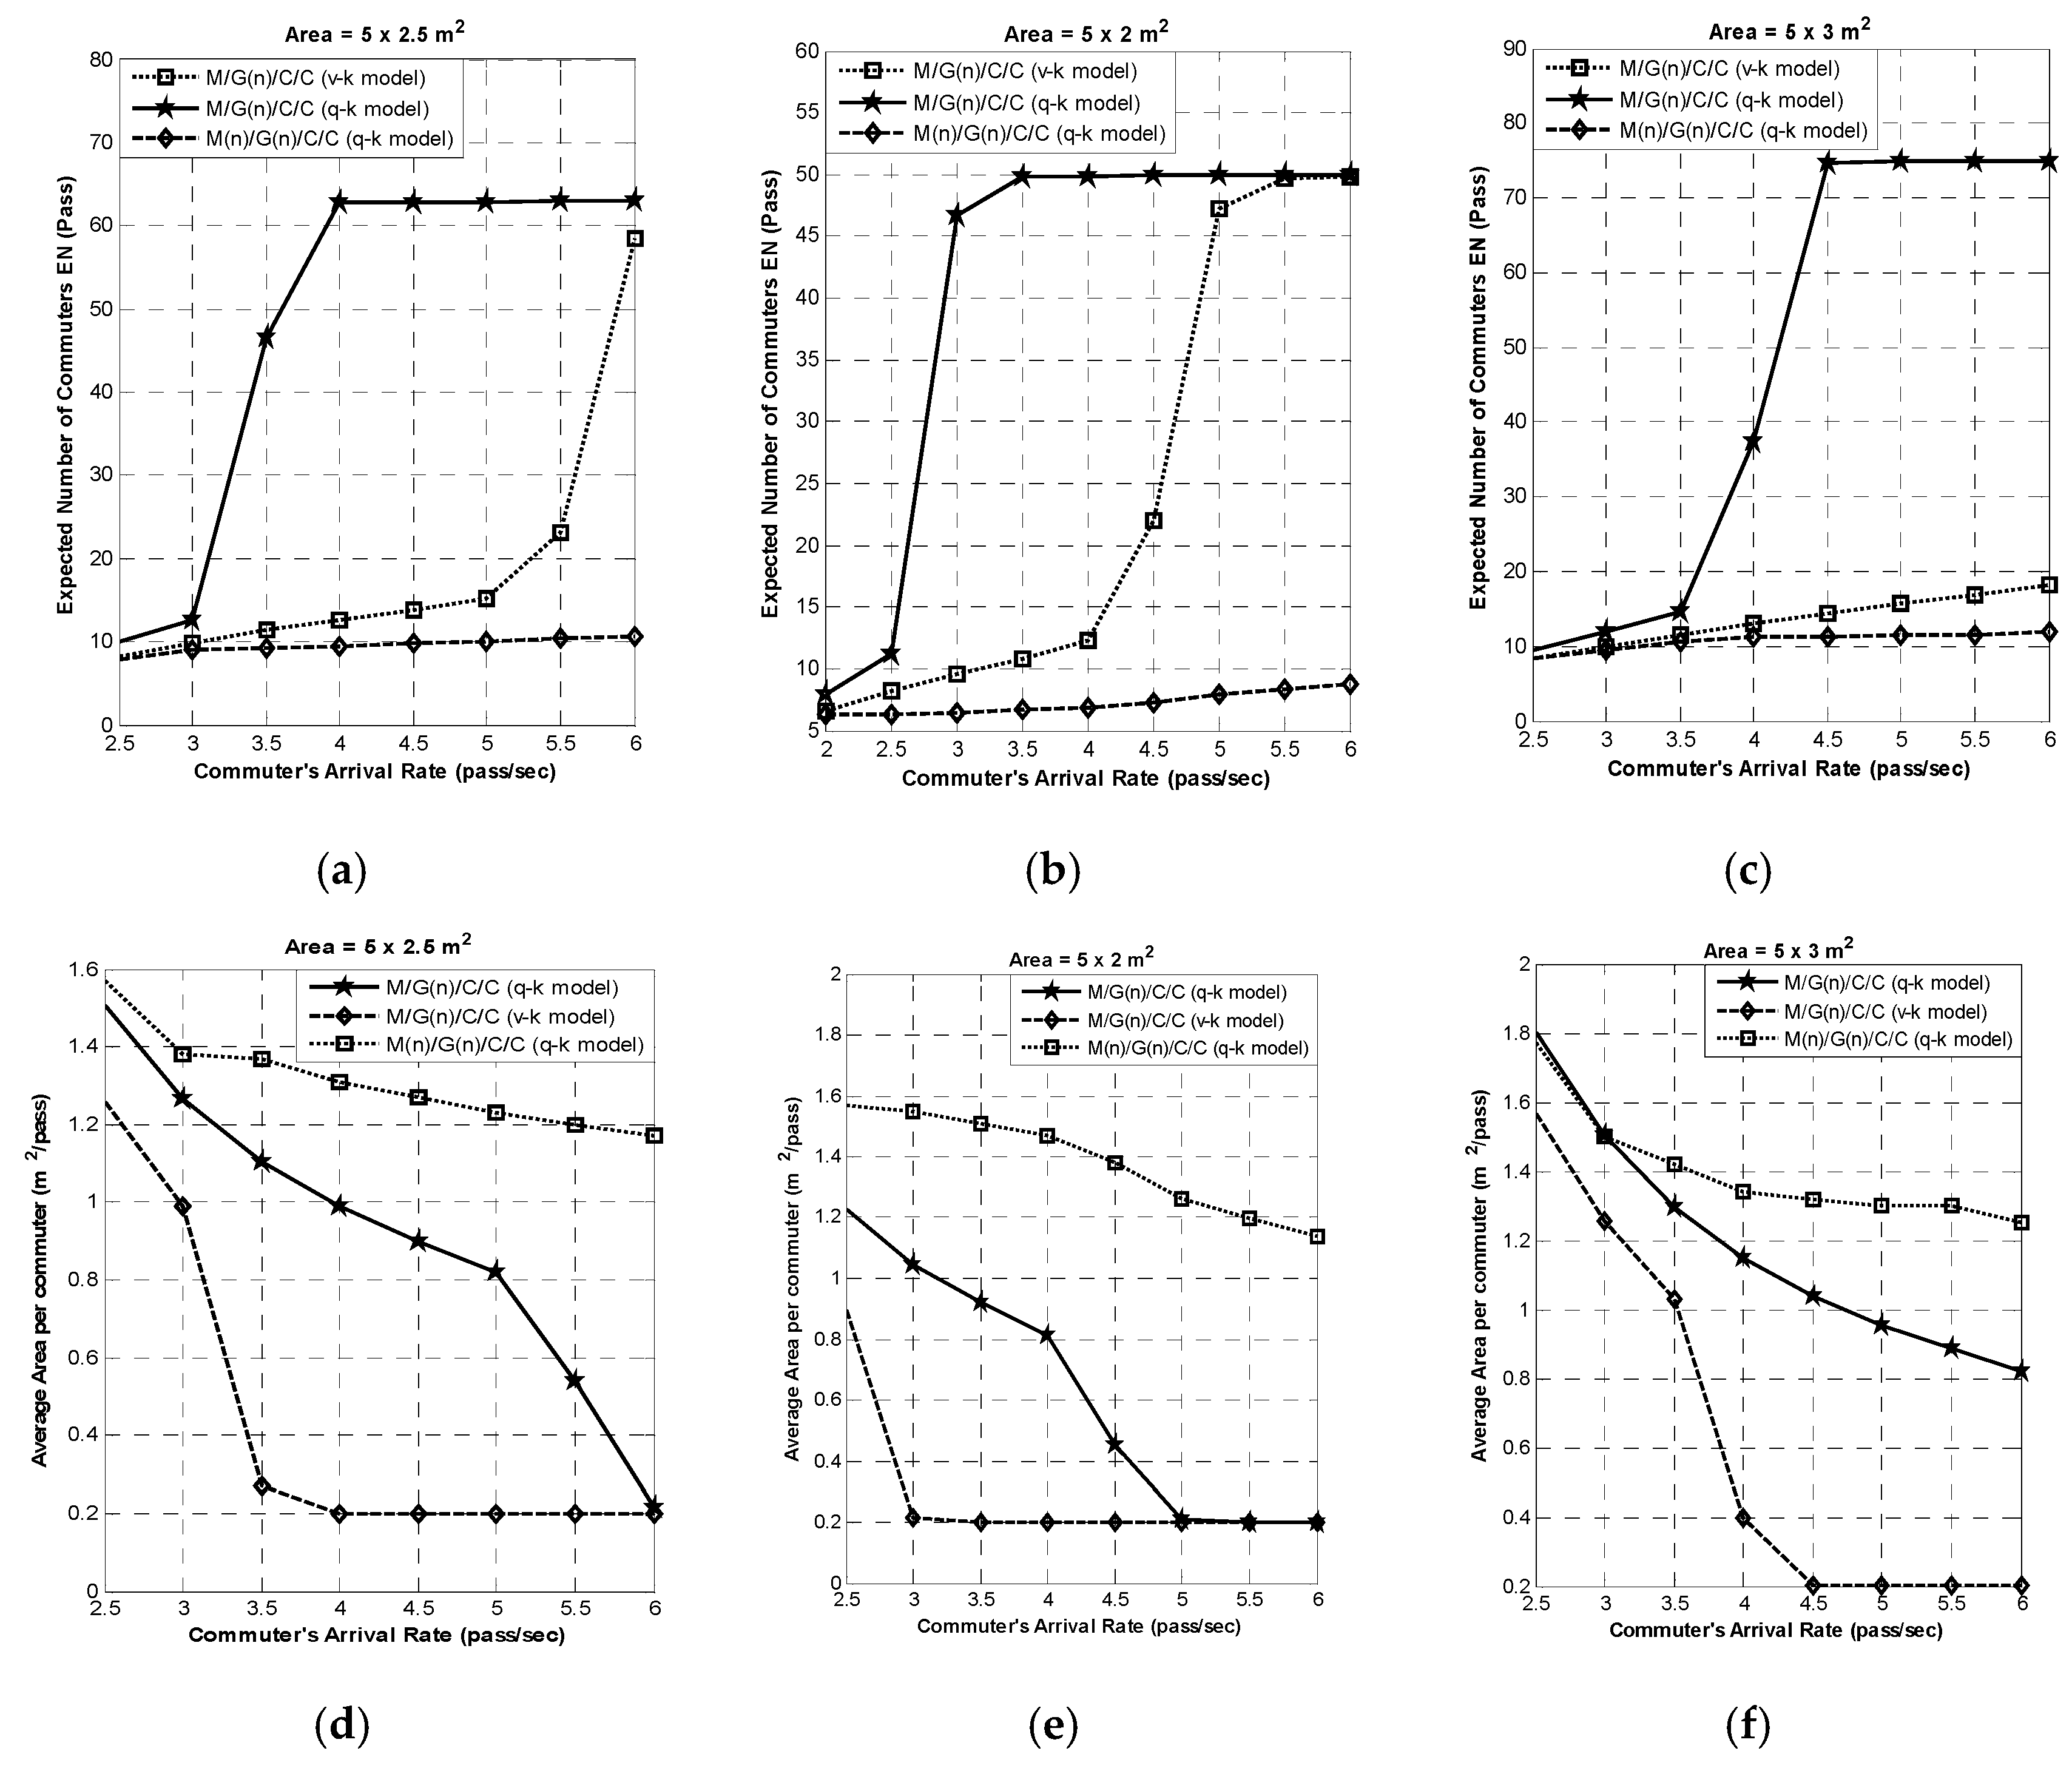
3.3.1. Effect of Average Commuter Arrival Demand on EN and EA
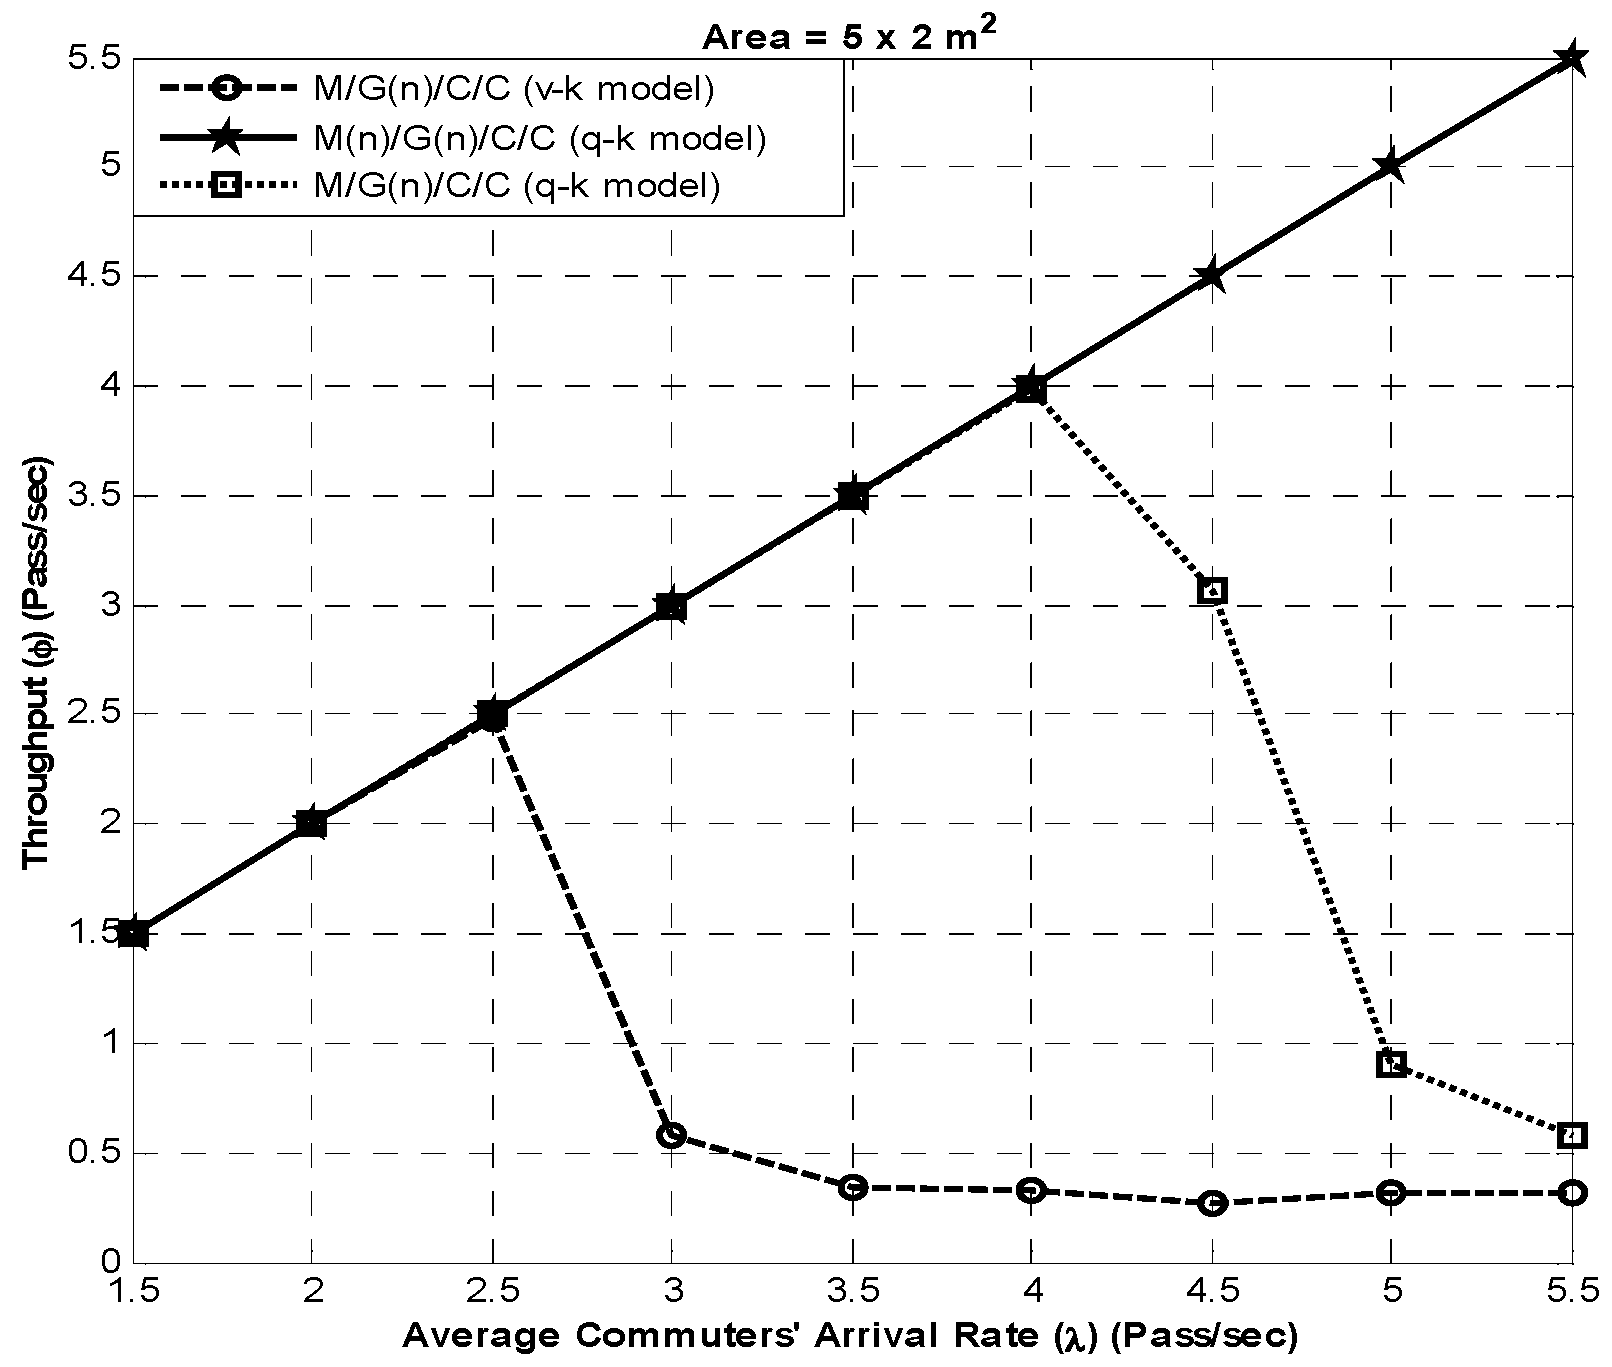
3.3.2. Effect of Commuter Arrival Demand on the Throughput
3.3.3. Effect of Corridor Width (W) on EN and EA
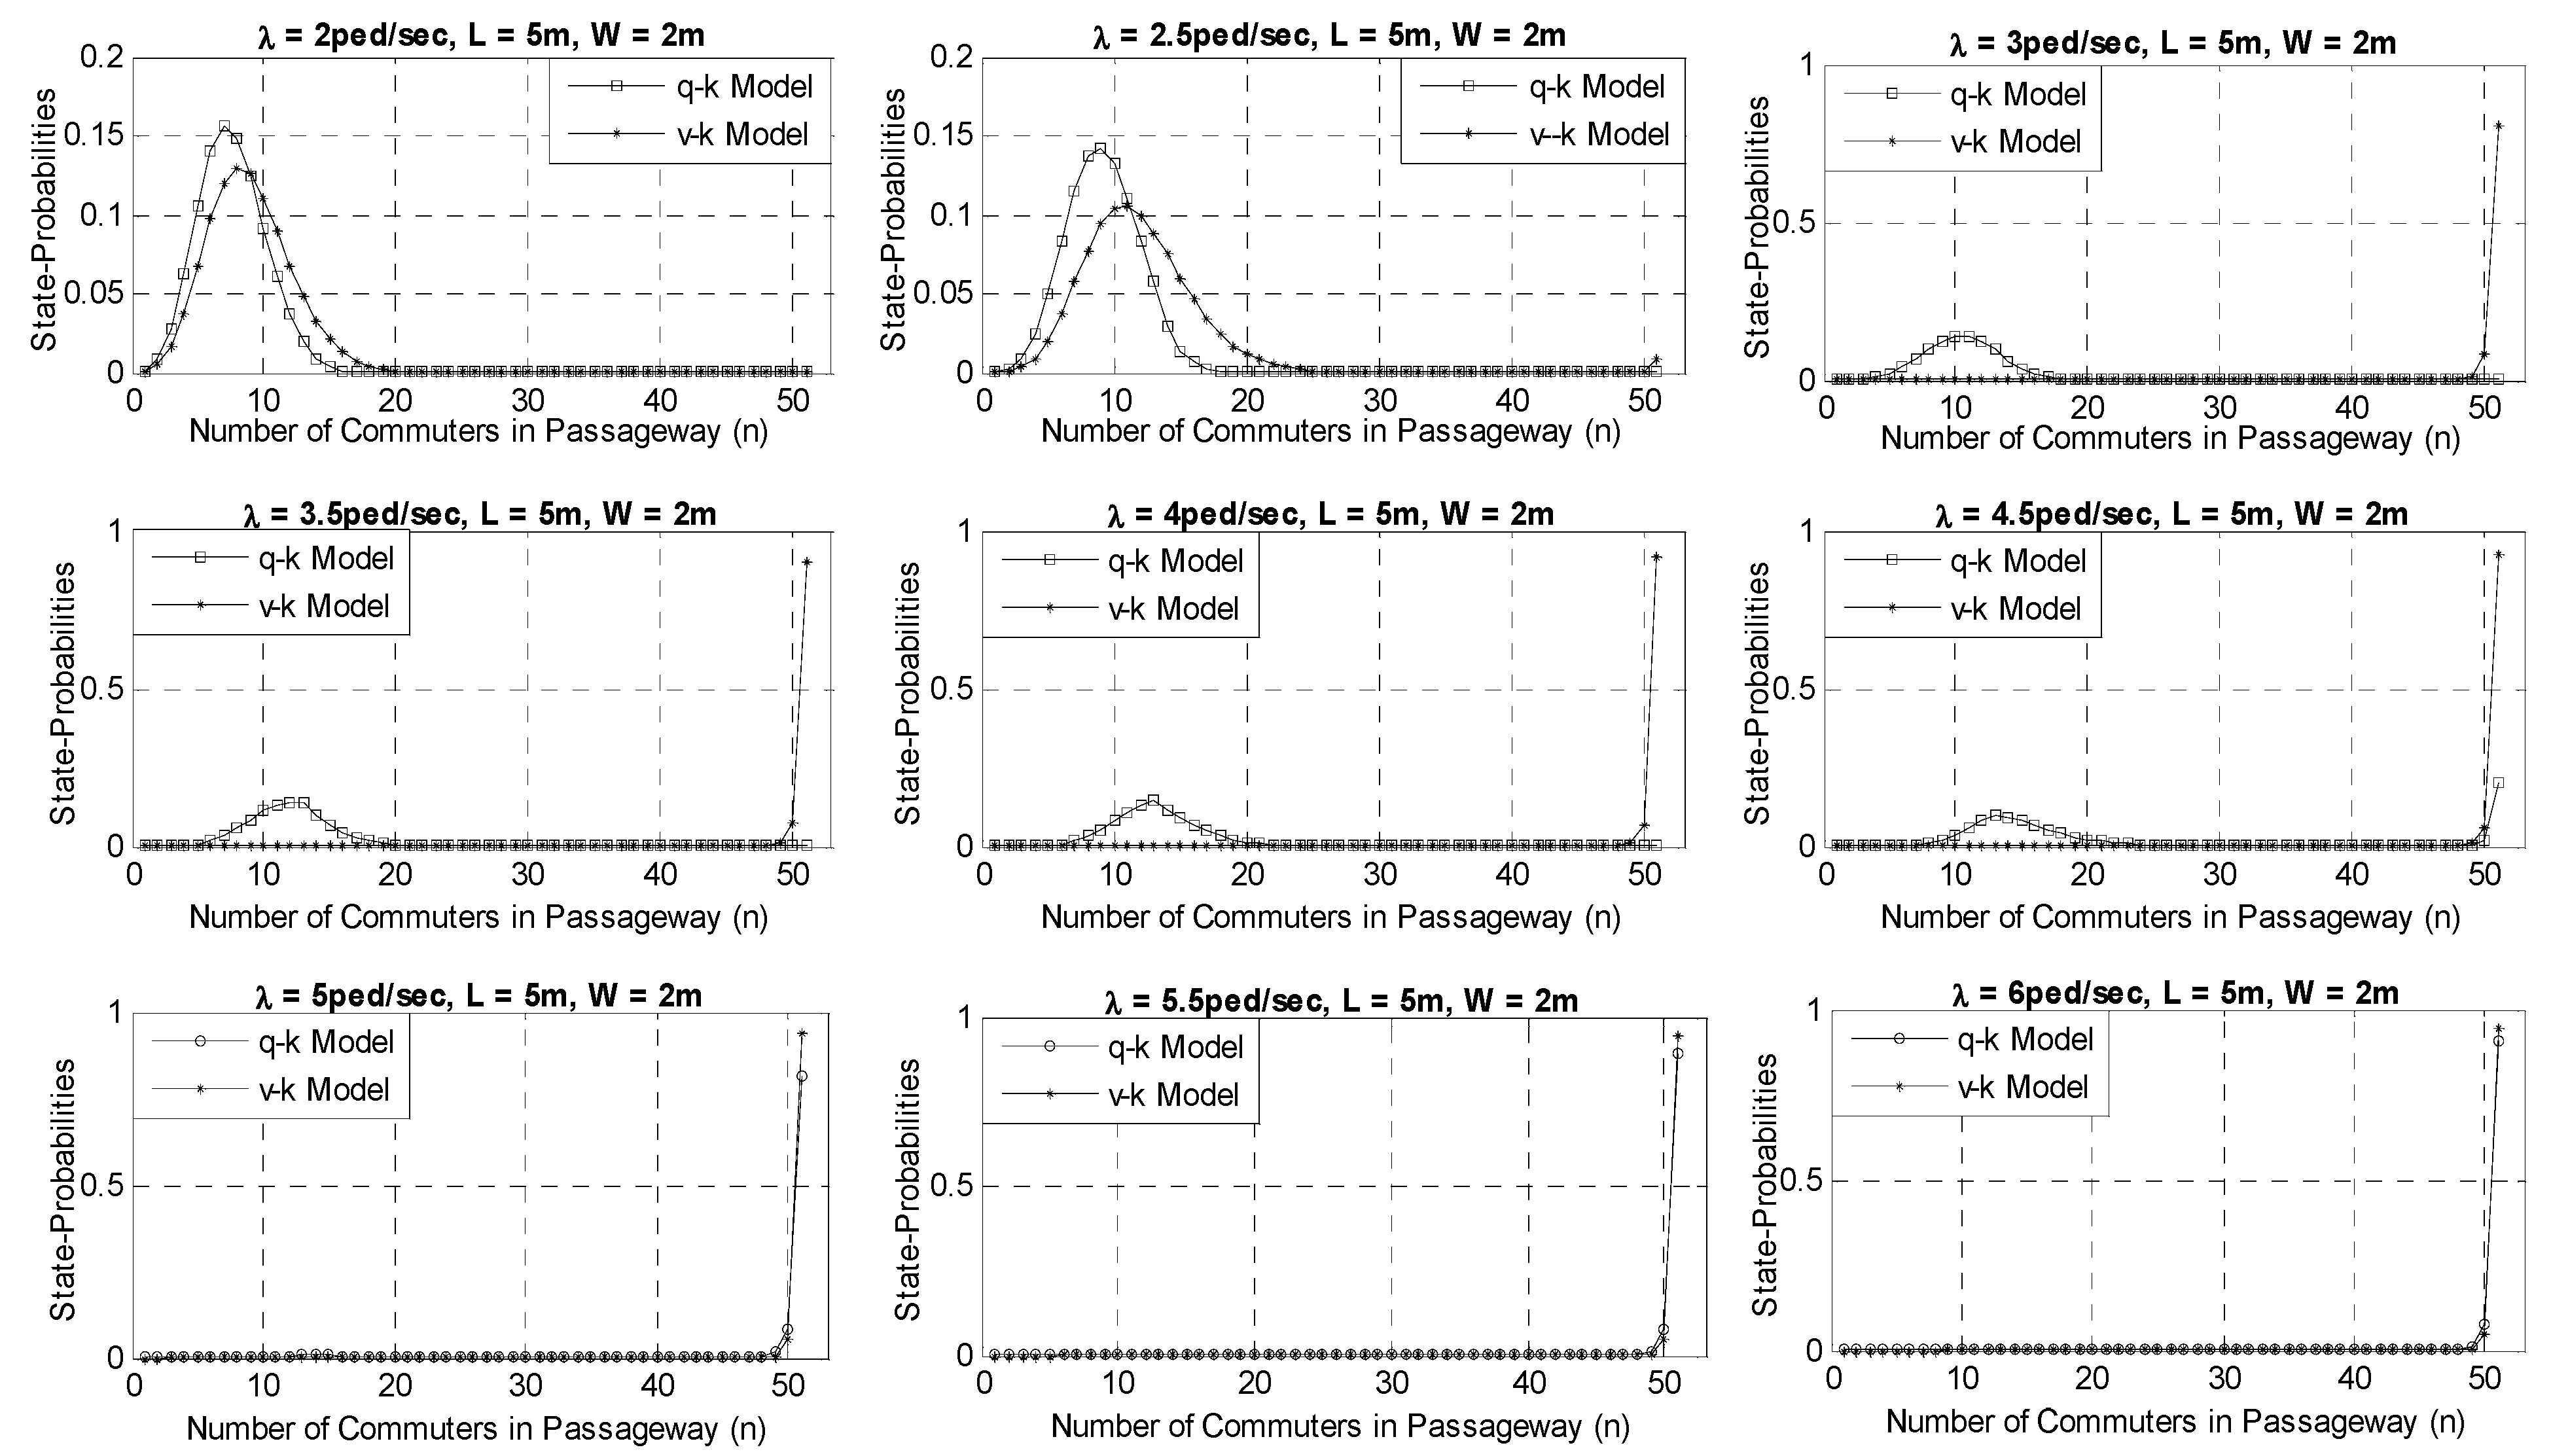
3.3.4. Effect of Commuter Arrival Demand on the Steady-State Probability Distribution
4. Conclusions
- The transient solution of our proposed queuing models derived using the BD process appears to agree quite well with the values determined using the DES framework
- For the data considered herein, the computational experiments indicate that the expected number of commuters (EN) and blocking probability for the model are smaller than for the model. The values of EN for the model are much smaller due to a state-dependent arrival rate effect, depicting the social distancing protocol of COVID-19.
- The model for the service facility capacity analysis in the COVID-19 situation overestimates the results and shows a larger value of EN, even at a smaller arrival demand . Therefore, the model cannot be used for the analysis when pandemic conditions are considered.
- The sensitivity analysis also revealed that the throughput value drops rapidly for the model, even at a lower arrival demand compared to . However, for the model, the values of throughput increase linearly with arrival rates and no blocking is observed.
- The average area occupied per commuter (EA) is higher in the case of the model, while it is smaller in the case of the model. The average area occupied per commuter (EA) is highest in the case of . This means that at a certain density, when arrival rates are discouraged, social distancing is ensured, allowing commuters to travel at a free-flowing speed despite a small corridor area.
- For model, the blocking remains at zero for all arrival rates to ensure social distancing in the corridor.
Author Contributions
Funding
Institutional Review Board Statement
Informed Consent Statement
Data Availability Statement
Acknowledgments
Conflicts of Interest
References
- Sipetas, C.; Keklikoglou, A.; Gonzales, E.J. Estimation of left behind subway passengers through archived data and video image processing. Transp. Res. Part C Emerg. Technol. 2020, 118, 102727. [Google Scholar] [CrossRef]
- Basu, R.; Ferreira, J. Sustainable mobility in auto-dominated Metro Boston: Challenges and opportunities post-COVID-19. Transp. Policy 2021, 103, 197–210. [Google Scholar] [CrossRef]
- Dzisi, E.K.J.; Dei, O.A. Adherence to social distancing and wearing of masks within public transportation during the COVID 19 pandemic. Transp. Res. Interdiscip. Perspect. 2020, 7, 100191. [Google Scholar] [CrossRef] [PubMed]
- Auad, R.; Dalmeijer, K.; Riley, C.; Santanam, T.; Trasatti, A.; Van Hentenryck, P.; Zhang, H. Resiliency of on-demand multimodal transit systems during a pandemic. Transp. Res. Part C Emerg. Technol. 2021, 133, 103418. [Google Scholar] [CrossRef] [PubMed]
- Naveen, B.R.; Gurtoo, A. Public transport strategy and epidemic prevention framework in the Context of COVID-19. Transp. Policy 2022, 116, 165–174. [Google Scholar] [CrossRef]
- KFH Group. Transit Capacity and Quality of Service Manual; The National Academies Press: Washington, DC, USA, 2013. [Google Scholar]
- Hu, L.; Jiang, Y.; Zhu, J.; Chen, Y. A PH/PH (n)/C/C state-dependent queuing model for metro station corridor width design. Eur. J. Oper. Res. 2015, 240, 109–126. [Google Scholar] [CrossRef]
- Jiang, Y.; Zhu, J.; Hu, L.; Lin, X.; Khattak, A. AG/G (n)/C/C state-dependent simulation model for metro station corridor width design. J. Adv. Transp. 2016, 50, 273–295. [Google Scholar] [CrossRef]
- Khattak, A.; Yangsheng, J.; Lu, H.; Juanxiu, Z. Width design of urban rail transit station walkway: A novel simulation-based optimization approach. Urban Rail Transit 2017, 3, 112–127. [Google Scholar] [CrossRef] [Green Version]
- Zhu, J.; Hu, L.; Jiang, Y.; Khattak, A. Circulation network design for urban rail transit station using a PH (n)/PH (n)/C/C queuing network model. Eur. J. Oper. Res. 2017, 260, 1043–1068. [Google Scholar] [CrossRef]
- Khattak, A.; Yangsheng, J.; Hussain, A. Design of passengers’ circulation areas at the transfer station: An automated hybrid simulation-differential evolution framework. Simul. Model. Pract. Theory 2018, 87, 293–310. [Google Scholar] [CrossRef]
- Khattak, A.; Hussain, A. Hybrid DES-PSO framework for the design of commuters’ circulation space at multimodal transport interchange. Math. Comput. Simul. 2021, 180, 205–229. [Google Scholar] [CrossRef]
- Khalid, R.; Mnawawi, M.K.; Kawsar, L.A.; Ghani, N.A.; Kamil, A.A.; Mustafa, A. A discrete event simulation model for evaluating the performances of an M/G/C/C state dependent queuing system. PLoS ONE 2013, 8, e58402. [Google Scholar]
- Weiss, A.; Williams, L.; MacGregor Smith, J. Performance & optimization of M/G/c/c building evacuation networks. J. Math. Model. Algorithms 2012, 11, 361–386. [Google Scholar]
- Park, Y.; Ahn, S.B. Optimal assignment for check-in counters based on passenger arrival behaviour at an airport. Transp. Plan. Technol. 2003, 26, 397–416. [Google Scholar] [CrossRef]
- Regattieri, A.; Gamberini, R.; Lolli, F.; Manzini, R. Designing production and service systems using queuing theory: Principles and application to an airport passenger security screening system. Int. J. Serv. Oper. Manag. 2010, 6, 206–225. [Google Scholar] [CrossRef]
- Wang, C.; Ye, Z.; Fricker, J.D.; Zhang, Y.; Ukkusuri, S.V. Bus capacity estimation using stochastic queuing models for isolated bus stops in China. Transp. Res. Rec. 2018, 2672, 108–120. [Google Scholar] [CrossRef]
- Gunawan, F.E. Design and implementation of discrete-event simulation framework for modeling bus rapid transit system. J. Transp. Syst. Eng. Inf. Technol. 2014, 14, 37–45. [Google Scholar] [CrossRef]
- Gunawan, F.E.; Gunawan, A.A. Simulation model of bus rapid transit. EPJ Web Conf. 2014, 68, 00021. [Google Scholar] [CrossRef]
- Tian, X.Y.; Jiang, H.Y.; Zha, J. Scheduling Optimization of Inter-City Bus Rapid Transit Based on M/M/C/N/∞ Queuing Model. Appl. Mech. Mater. 2012, 235, 294–297. [Google Scholar] [CrossRef]
- Bunker, J.M. Probabilistic Modeling of Bus Rapid Transit Station Loading Area Selection for Bus Capacity Estimation. Transp. Res. Rec. 2022, 2676, 03611981221082553. [Google Scholar] [CrossRef]
- De Haas, M.; Faber, R.; Hamersma, M. How COVID-19 and the Dutch ‘intelligent lockdown’change activities, work and travel behaviour: Evidence from longitudinal data in the Netherlands. Transp. Res. Interdiscip. Perspect. 2020, 6, 100150. [Google Scholar] [PubMed]
- Gutiérrez, A.; Miravet, D.; Domènech, A. COVID-19 and urban public transport services: Emerging challenges and research agenda. Cities Health 2021, 5, S177–S180. [Google Scholar] [CrossRef]
- Shen, J.; Duan, H.; Zhang, B.; Wang, J.; Ji, J.S.; Wang, J.; Pan, L.; Wang, X.; Zhao, K.; Ying, B. Prevention and control of COVID-19 in public transportation: Experience from China. Environ. Pollut. 2020, 266, 115291. [Google Scholar] [CrossRef] [PubMed]
- Liu, J.; Hu, L.; Xu, X.; Wu, J. A queuing network simulation optimization method for coordination control of passenger flow in urban rail transit stations. Neural Comput. Appl. 2021, 33, 10935–10959. [Google Scholar] [CrossRef]
- Stewart, W.J. Probability, Markov Chains, Queues, and Simulation: The Mathematical Basis of Performance Modeling; Princeton University Press: Princeton, NJ, USA, 2009. [Google Scholar]
- Cruz, F.R.; Smith, J.M.; Medeiros, R. An M/G/C/C state-dependent network simulation model. Comput. Oper. Res. 2005, 32, 919–941. [Google Scholar] [CrossRef]


| Fluctuated Arrival Rate | Fluctuated Service Rate |
|---|---|
| Corridor Dimensions (Area: 8 × 2.5 m2) | Corridor Dimensions (Area: 7 × 2 m2) | |||
|---|---|---|---|---|
Model | State-Dependent DES Model (95% Confidence Interval) | Model | State-Dependent DES Model (95% Confidence Interval) | |
| ped/s | ped/s | |||
| EN (ped) | 9.33 | 9.13 (9.05, 9.21) | 26.81 | 25.38 (26.46, 24.77) |
| 0.00 | 0.00 (0.00, 0.00) | 0.15 | 0.141 (0.135, 0.146) | |
| EA (m2/ped) | 2.14 | 2.09 (1.99, 2.19) | 0.52 | 0.51 (0.443, 0.541) |
| 1.75 | 1.75 (1.73–1.84 | 3.69 | 3.72 (3.63, 3.78) | |
Publisher’s Note: MDPI stays neutral with regard to jurisdictional claims in published maps and institutional affiliations. |
© 2022 by the authors. Licensee MDPI, Basel, Switzerland. This article is an open access article distributed under the terms and conditions of the Creative Commons Attribution (CC BY) license (https://creativecommons.org/licenses/by/4.0/).
Share and Cite
Khattak, A.; Almujibah, H.; Chen, F.; Alyami, H.S.
Modified State-Dependent
Khattak A, Almujibah H, Chen F, Alyami HS.
Modified State-Dependent
Khattak, Afaq, Hamad Almujibah, Feng Chen, and Hussain S. Alyami.
2022. "Modified State-Dependent