Abstract
The freeze–thaw process plays a dominant role as far as the exploration and development of natural resources in cold regions are concerned. Freeze–thaw cycles can cause frost heaving pressure in the rock matrix and result in micro cracking, which influences its physical and mechanical properties. A series of physical and mechanical tests are performed on red sandstone to investigate the fracture behavior and mechanical properties induced by freeze–thaw cycles. The testing results show that after being treated by freeze–thaw cycles, the mass, density, and P-wave velocity of rocks decrease, while the volume of rocks increases. The peak stress and elastic modulus decrease with the increase in freeze–thaw cycles, while peak strain and Poisson’s rate increase. When 30 MPa confining pressure is applied, the peak stress and elastic modulus of untreated samples reach the maximum values of 92.49 MPa and 12.84 GPa, respectively. However, after being treated by 30 freeze–thaw cycles, the peak strain and Poisson’s rate reach the maximum values of 0.631 % and 0.18, respectively. The development of micro-cracks and the growth of pores induced by frost heaving stress are the main reasons for the deterioration of the mechanical properties of rocks. Confining pressure and freeze–thaw cycles can transfer the rock’s failure mode from tensile to shear and make red sandstone show more ductility features.
1. Introduction
Permafrost accounts for almost half of the land in the world [1,2] and a great deal of the mineral resources, such as coal [3,4,5], oil [6,7], and gas [8,9,10], stored in cold regions. In this area, temporal cyclic variations in temperature result in freeze–thaw cycles, exposing the rock and causing micro-damage, and further leading to the failure of the rock matrix and the instability of rock engineering. The micro-damage effect of freeze–thaw cycles on the rocks can be explained by the concept of volumetric expansion or the concept of ice segregation. This theory argues that the water inside the pores, cracks, and joints changes its phase resulting in ice, and its volume expands by 9% due to freezing [11,12]. In the freezing process, the transformation of water to ice provides the frost heaving force between the ice and the pore wall, and pressurizes the micro-cavities in the rock, leading to the widening of pre-existing cracks or the generation of new cracks [13]. Therefore, for rock engineering in cold regions, the influence of the freeze–thaw cycles on the physical and mechanical rock matrix must be considered a very important factor to evaluate the stability of rock engineering.
To investigate the significant influence of freeze–thaw weathering on rock properties, extensive research has been conducted in which the number of freeze–thaw cycles is an important parameter. Previous studies indicate that the duration of freeze–thaw cycles has a remarkable effect on the physical and mechanical properties of rocks, such as the mass [14,15], volume [16], porosity [17,18,19], uniaxial compression strength (UCS) [20,21,22], Brazilian tensile strength (BTS), and Young’ modulus [23,24,25,26]. With the increase in freeze–thaw cycles, the mass, porosity, UCS, BTS, and Young’s modulus of rocks decrease, while the volume of rocks increases. Other researchers have performed a series of shear strength [27,28] or triaxial compression strength (TCS) [29,30] tests to investigate the influence of freeze–thaw cycles on the cohesion and internal friction angle of rocks. Accompanying these experimental studies, plenty of numerical models for predicting the mechanical deterioration induced by freeze–thaw cycles have been put forward [31,32].
In previous studies, scholars have mainly concentrated on investigating the variation of macroscopic physical and mechanical properties of rocks induced by freeze–thaw cycles, and few analyses discuss the reason behind the variation on the microscopic scale. However, the generation and propagation of micro-cracks and pore structures significantly influence the macroscopic physical properties, mechanical behavior, and failure modes of rocks [33,34,35]. Additionally, in tectonically active areas where the bedrock is under high in situ stress, the confining pressure has an important effect on the mechanical behaviors of rocks after freeze–thaw cycles, which has not received enough attention. Therefore, the correlation between the generation and development of micro-cracks and the variation of physical and mechanical properties should be studied sufficiently. In this research, the influence of freeze–thaw cycles and confining pressure on fracture behavior and mechanical properties of the red sandstone rock is experimentally investigated. By comparing the testing results of samples pre- and post-treatment, the influence of freeze–thaw cycles on the rock’s physical properties (i.e., the mass, volume, density, and P-wave velocity) were investigated. X-ray diffraction (XRD) analysis was utilized to obtain the mineral composition of the testing rock. Then, a scanning electron microscope (SEM) was used to analyze the micro-crack propagation and pore structure development of the rock induced by the freeze–thaw cycles. Finally, triaxial compression tests were conducted to investigate the mechanical performance and failure mode of the treated granite rock.
2. Materials and Methods
2.1. Samples and Mineral Compositions
Red sandstone is one of the typical sedimentary rocks, which has obvious pore characteristics, high porosity, and is significantly affected by water. The red sandstone blocks tested in this research were collected from a working face approximately 450 m in depth, located in Jinhegou Town, Xinjiang Province, China (Geographical coordinates: 85.68° E, 44.31° N). By measuring the temperature in this working face monthly, we revealed that the minimum and maximum mean temperatures are approximately −12 °C in February and +13.2 °C in August, respectively. However, the maximum temperature in this town reaches up to +32 °C in the summer season. Based on the International Society of Rock Mechanics (ISRM)’s suggested specification [36,37], cylindrical samples with a standard size of 50 mm in diameter and 100 mm in height were prepared for testing. To minimize the scatter of the testing results, all the samples were cored in the same rock, which has no obverse fissure and stratification planes. Meanwhile, the ends of all testing samples were carefully polished by a grinding machine until the deviation ranges of the flatness and roughness were less than 0.5 mm and 0.05 mm, respectively. Table 1 shows the basic physical properties of testing rock samples.

Table 1.
Basic physical properties of testing rock samples.
In addition, X-ray diffraction analysis was used to obtain the mineralogical compositions and the proportion of materials. Figure 1 shows the XRD results of the red sandstones, which indicate that the testing rocks mainly consist of 38.1% quartz, 25.4% Kaolin, 20.7% Calcium aluminosilicate, and 15.8% other minerals.
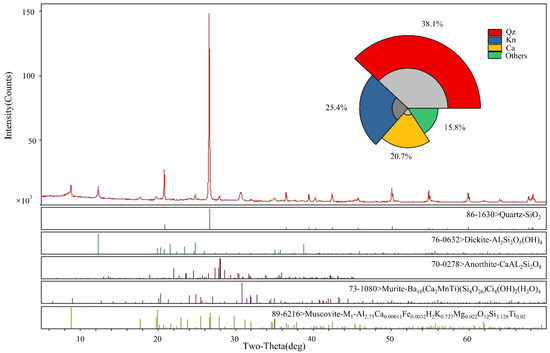
Figure 1.
XRD analysis of samples.
2.2. Test Schemes and Instruments
Figure 2 illustrates the complete testing scheme and the instruments used in this research. To avoid discreteness of the test results, all the freeze–thaw treatments and physical-mechanical tests of the red sandstone in each scenario were repeated three times and the test results in the study are expressed as mean values.
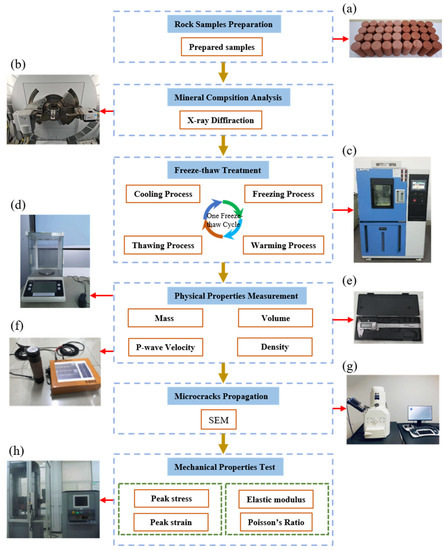
Figure 2.
Experimental procedures and instruments: (a) Standard red sandstone samples; (b) XRD-6100 device; (c) CLM-800 heating machine; (d) Electronic balance; (e) Vernier caliper; (f) P-wave instrument; (g) S-4800 SEM device; and (h) CMT5305 mechanical test machine.
2.3. Physical Property Measurement
Four basic physical properties (i.e., mass, volume, density, and P-wave velocity) of the testing samples were measured before and after freeze–thaw cycles for comparison. The dimensions of the sample were measured by a conventional vernier caliper with a precision of 0.01 mm. In particular, the values of diameter and height were the average values of five measuring points in the diameter direction and two measuring points in the height direction, respectively. An electronic balance with an accuracy of 0.01 g was used to measure the mass of the specimen. The density was obtained from the ratio of the sample mass to the sample volume. Moreover, the P-wave velocity tests were taken along the sample axis using a 5058PR high-voltage ultrasonic pulse instrument. Some Vaseline was daubed between the transducers and sample surface to provide a good acoustic coupling, and a small load of approximately 5 N was applied to improve the contact and reproducibility.
2.4. SEM Tests
Scanning electron microscope (SEM) technology was utilized to investigate the micro cracks’ propagation within the samples subjected to the thermal cycling treatment. After freeze–thaw cycles, thin sections approximately 5 mm in thickness were made, from which the micro crack images were obtained through an S-4800 SEM device. The mains voltage of the equipment was 220 V alternating current (AC) and the frequency was 70 Hz. In addition, before SEM tests, thin sections were sprayed with gold on the surface for 70 s to make sure the micro cracks can be easily observed. During SEM tests, thin sections were in a vacuum environment.
2.5. Freeze–Thaw Cycles Procedure
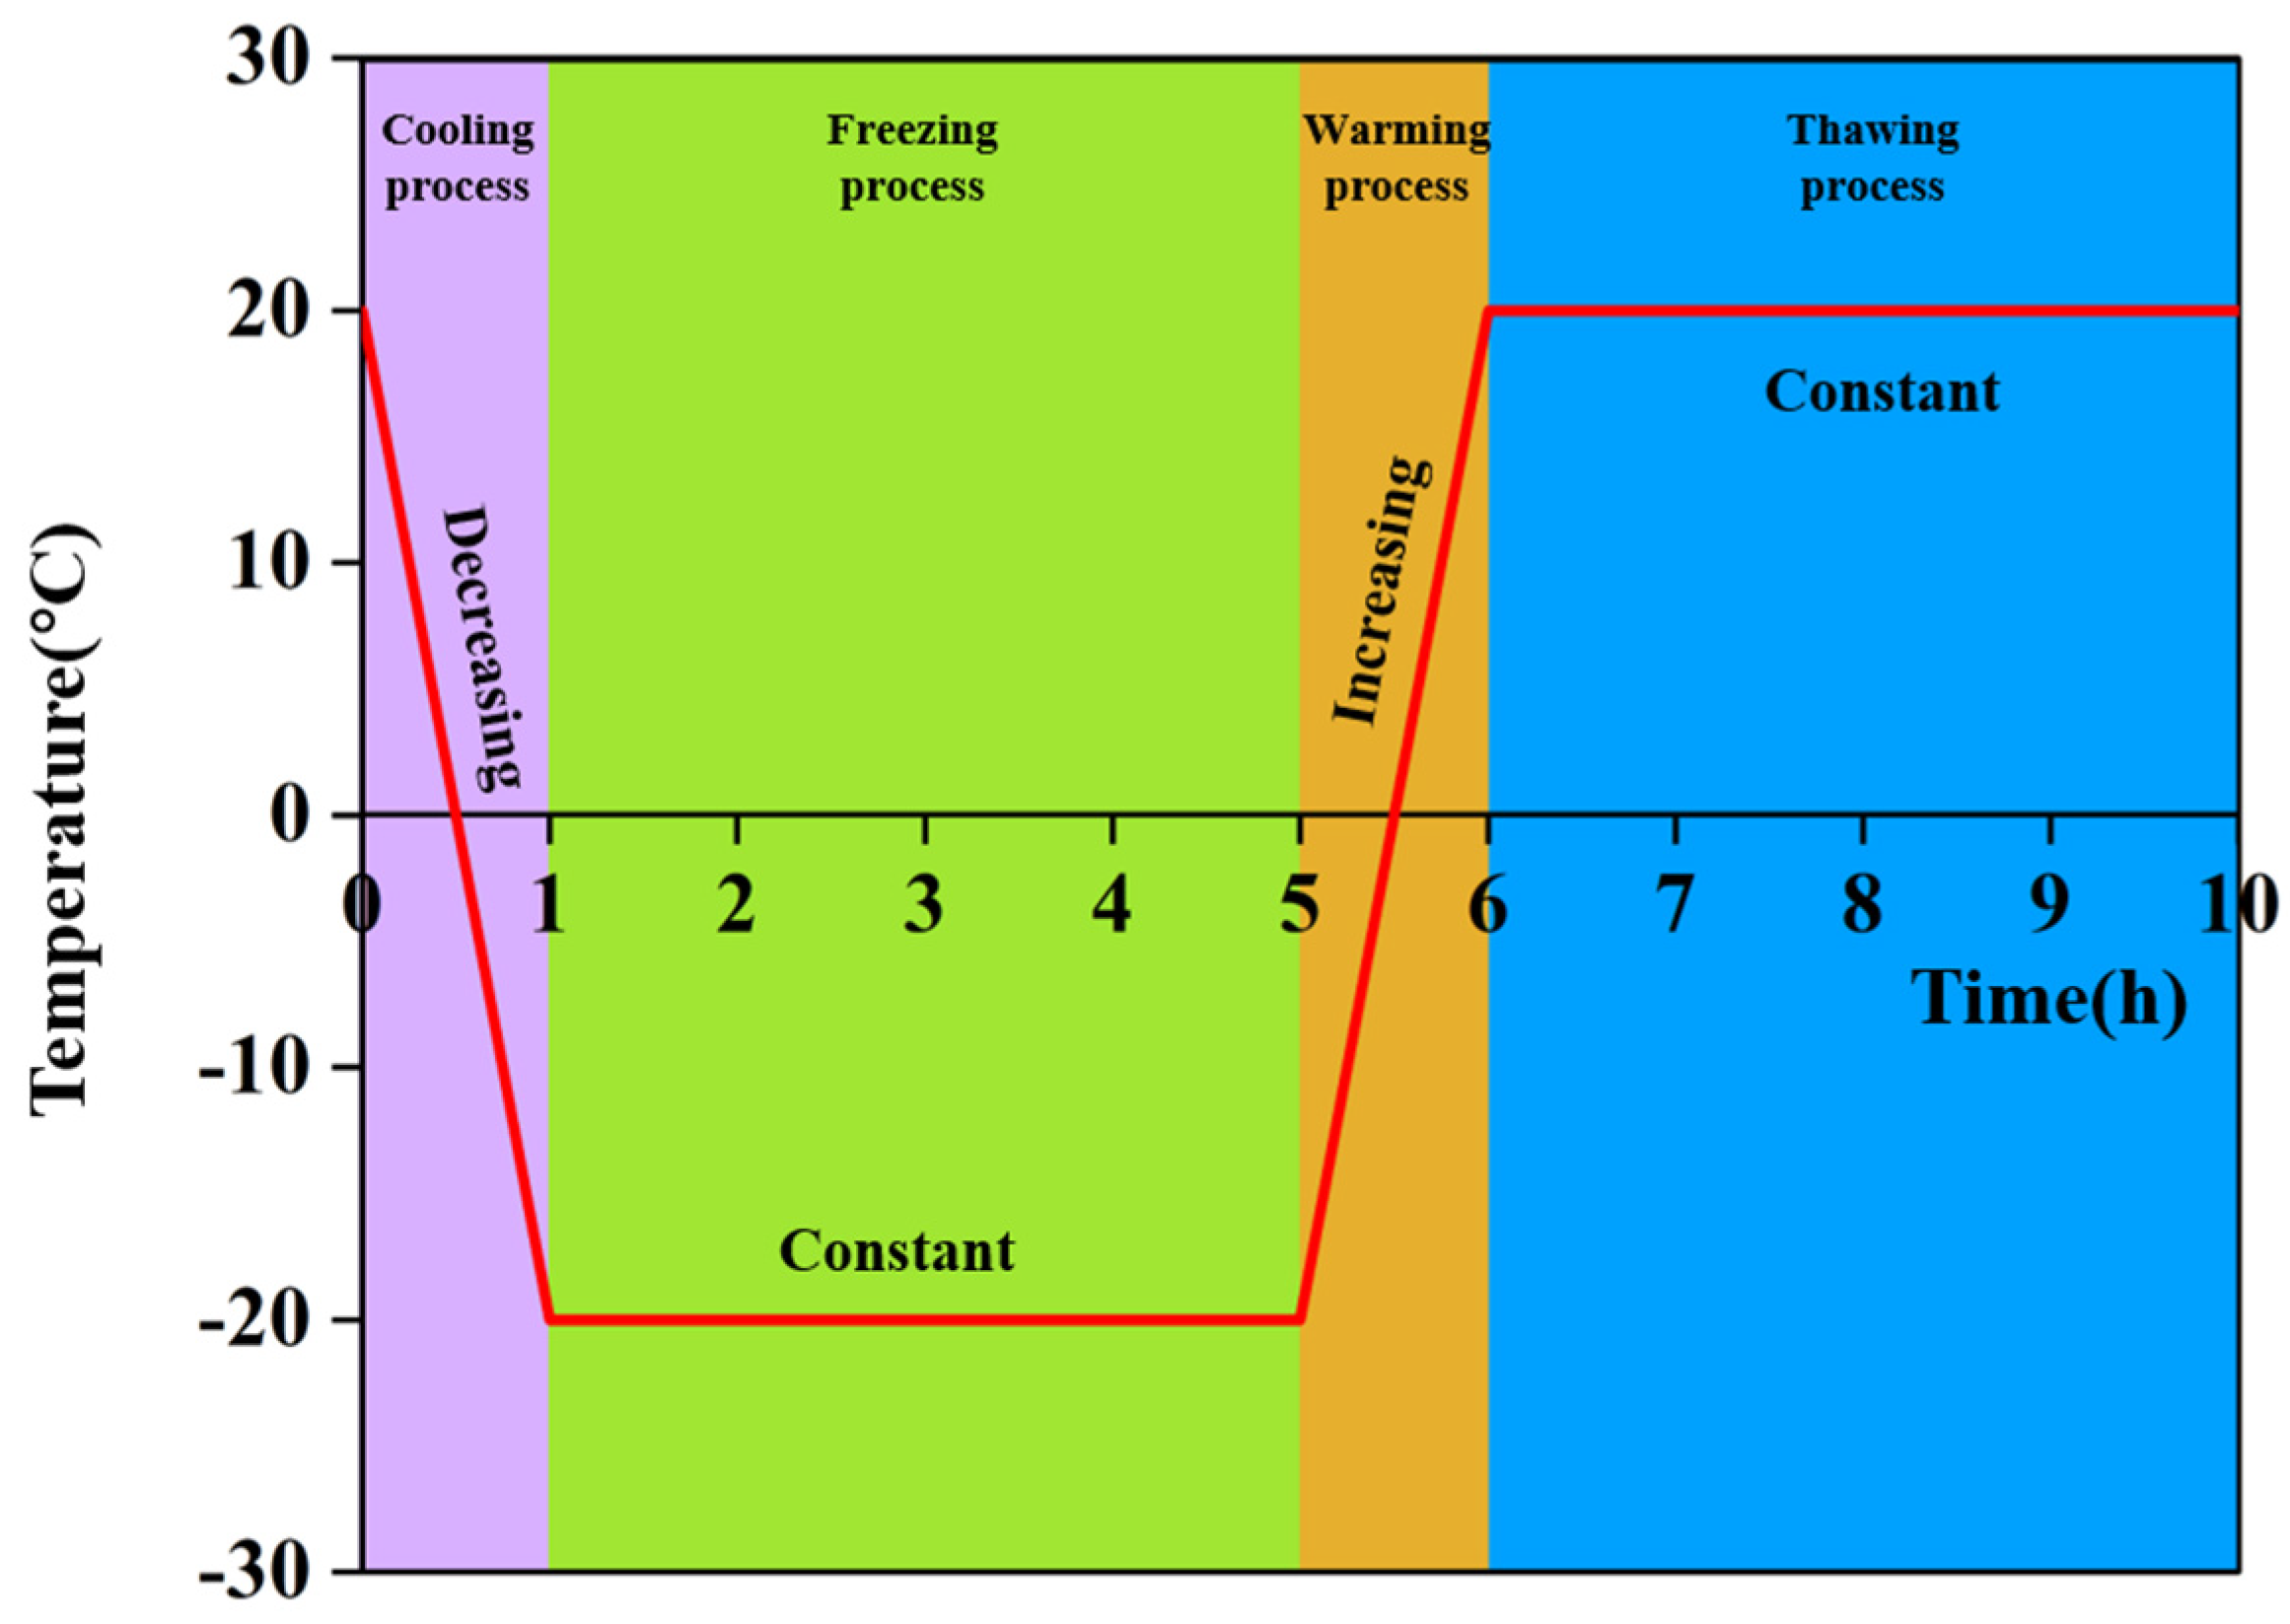
A CLM-800 heat test chamber, with a temperature range of −40 °C to 150 °C and a temperature rise rate of 0.5–3 °C/min, was utilized to treat the red sandstone samples. Before freeze–thaw cycles, all red sandstone samples were soaked in water at 20 °C for a duration of 2 days to ensure complete saturation. Then, based on the previous studies [38,39], the saturated samples were subjected to freeze–thaw cycles (as shown in Figure 3), in which the treatment temperature was set to ±20 °C for 4 h. One freeze–thaw cycle includes a cooling process, freezing process, warming process, and thawing process with a total duration of 10 h. Meanwhile, the number of freeze–thaw cycles was set at 0 (as the comparison group), 10, 20, and 30. Additionally, all samples were sealed with preservative films to minimize the loss of water induced by freeze–thaw cycles.

Figure 3.
One freeze-thaw treatment cycle.
2.6. Mechanical Property Tests
Triaxial compression strength (TCS) tests were carried out using the CMT5305 electronic universal testing machine (Figure 2h), with a maximum axial load of 1000 kN and a maximum confining pressure of 60 MPa. The confining pressures were set at 10 MPa, 20 MPa, and 30 MPa. The loading procedure of the TCS tests was as follows: First, load the confining pressure to a predetermined value using the stress-controlled loading method, with a loading rate of 0.5 MPa/min. Then, the displacement-controlled loading method was used to apply axial stress at a constant rate of 0.1 mm/min until the samples reached failure. The TCS test machine was able to record the applied loads and the displacement of samples in real-time.
3. Results
3.1. Mass, Volume, and Bulk Density
The variation of mass, volume, and bulk density are widely used as crucial parameters for evaluating the degradation characteristics of rocks caused by freeze–thaw cycles. Table 2 shows the testing results of red sandstone subjected to freeze–thaw treatment. The variation trends of the mass, volume, and density of the rock samples induced by freeze–thaw cycles are plotted in Figure 4. Meanwhile, the variation of mass, volume, and density is calculated as follows:
where , , and are the variation of mass, volume, and density of rock samples, respectively; , , and are the initial mass, volume, and density of rock samples, respectively; , , and are the mass, volume, and density of rock samples treated by freeze–thaw cycles, respectively.
Table 2.
Testing results of mass, volume, and density of samples subjected to freeze–thaw cycles.
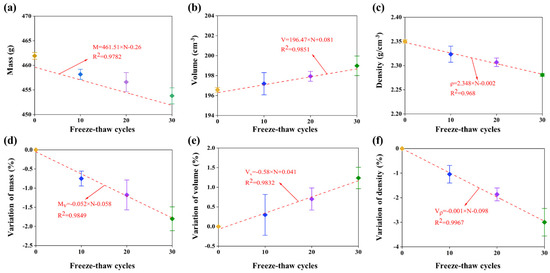
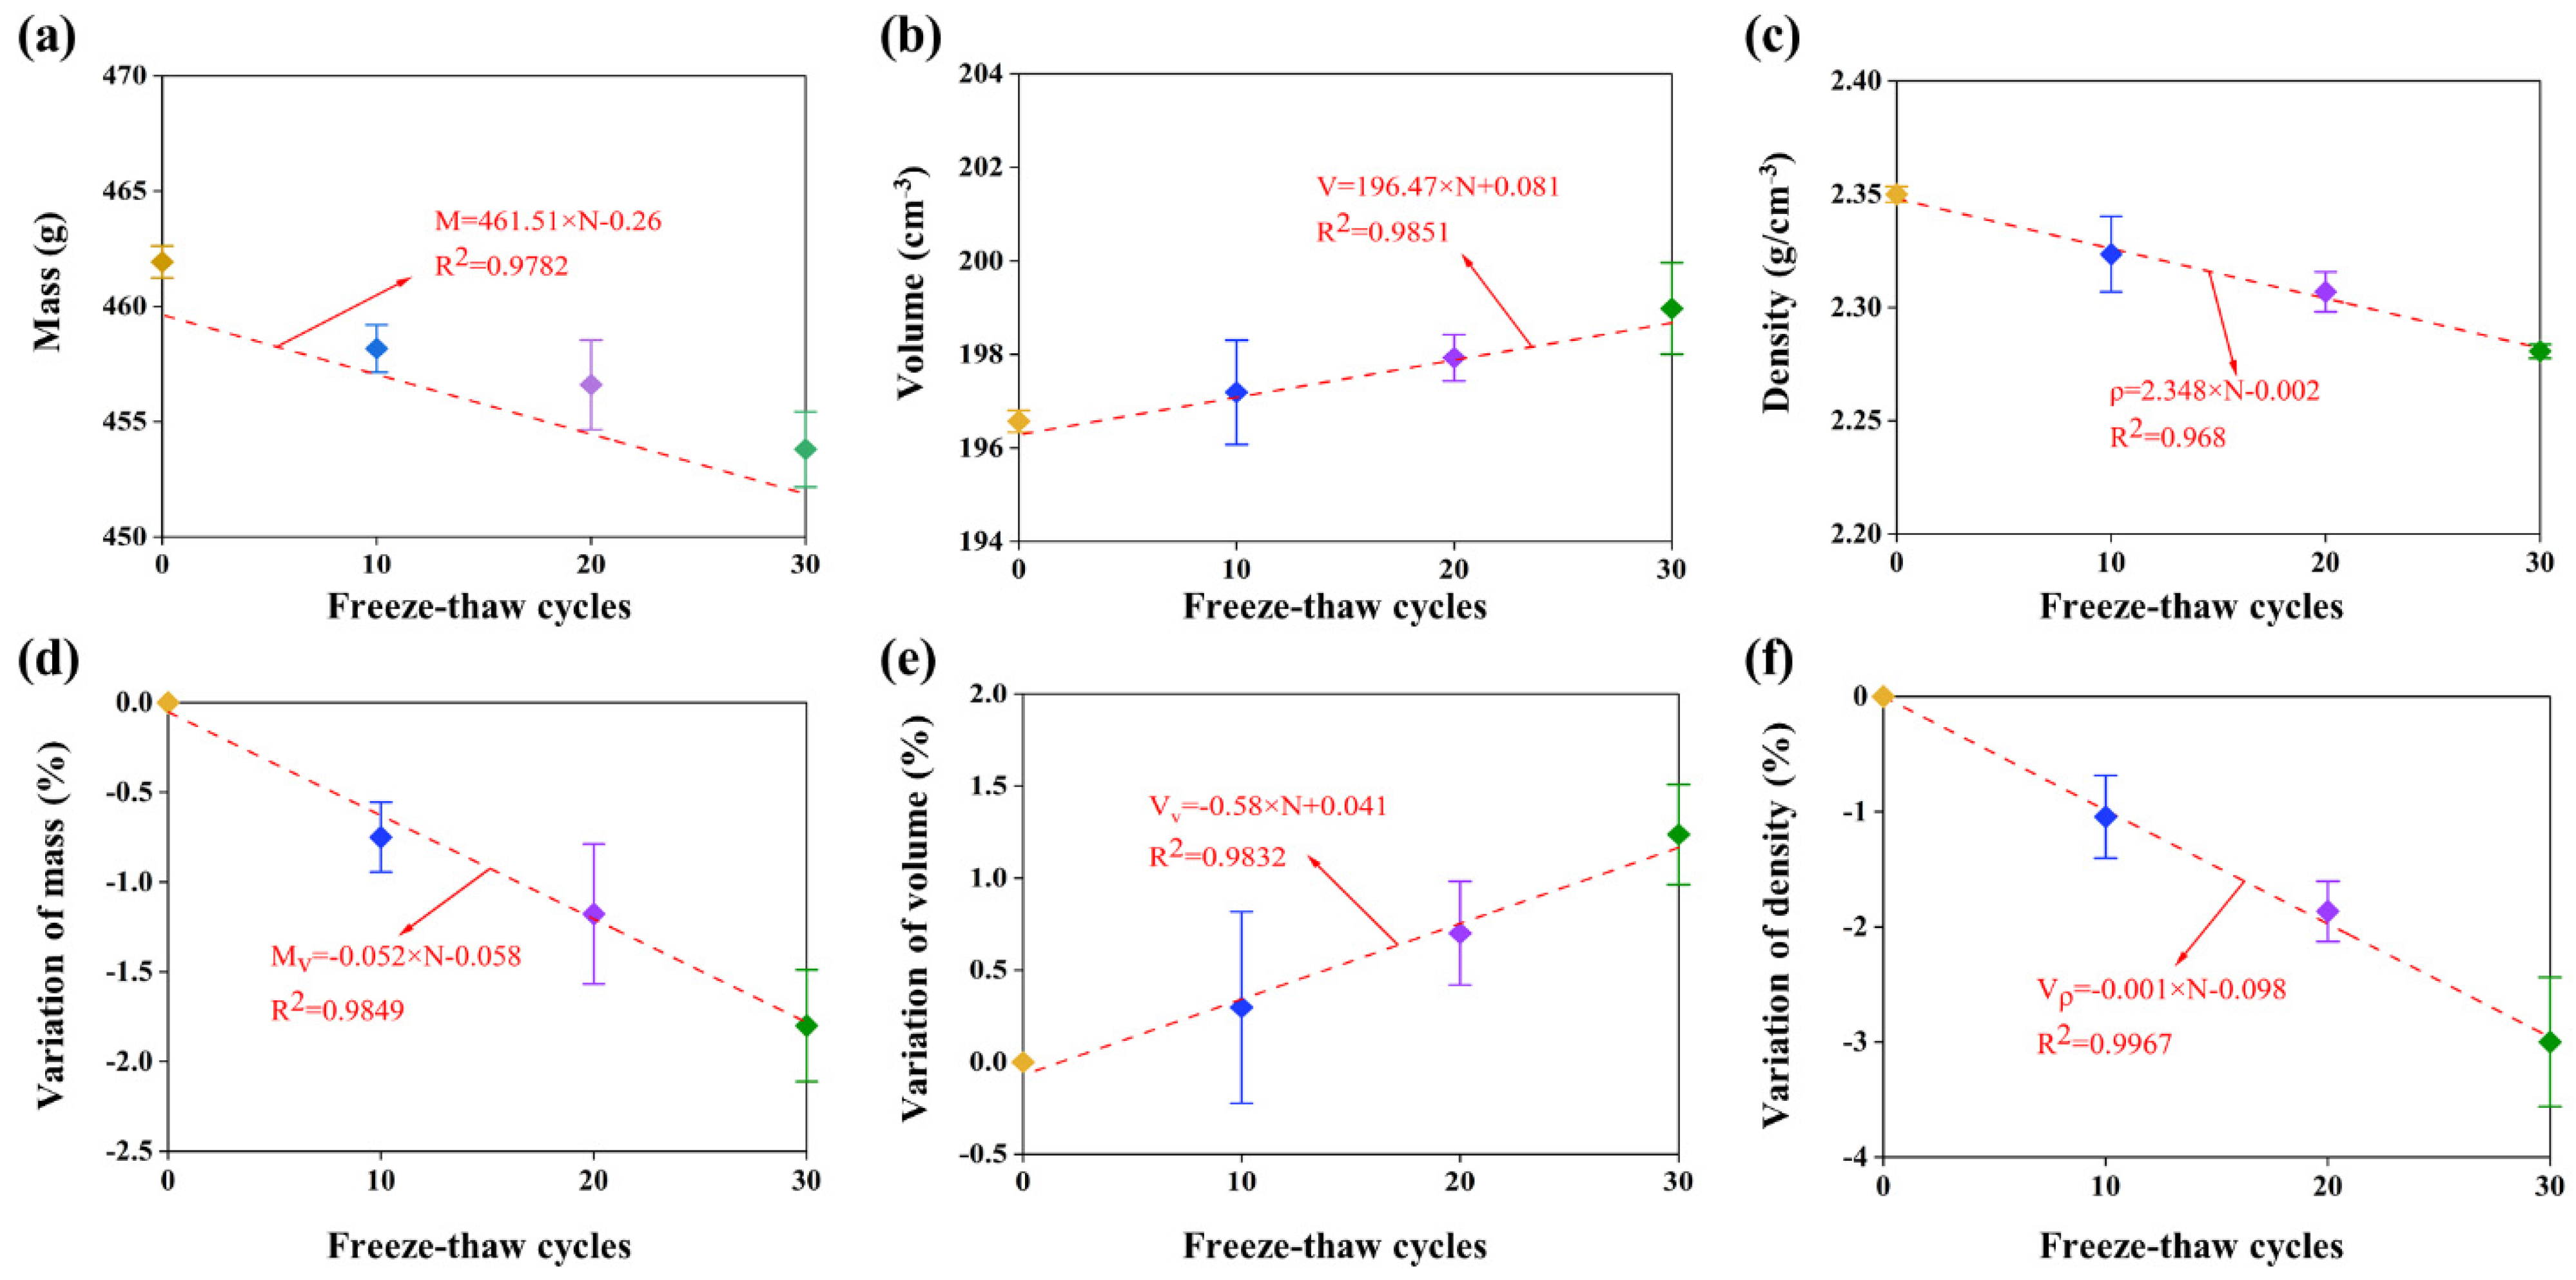
Figure 4.
Testing results of mass, volume, and density of samples subjected to freeze-thaw cycles.
It is revealed from Figure 4 that the mass and density of the samples decrease with the increase in freeze–thaw cycles, while the volume of rocks increases. Specifically, after being treated by 30 freeze–thaw cycles, the maximum variation of mass and density of rock appear and the samples lose 1.81% in mass and 3.01% in density. At the same time, the volume of the rock samples reached its peak value at 198.98 cm3 on average, which increases by 1.24% from the original at 196.61 cm3. The main reason for such an increase in volume is the water in the pores and flaws turns to ice during the freezing period and different minerals expand at different rates during the heating process. The frozen water and non-uniform expansion between different minerals result in the volumetric expansion in pores and micro-cracks, which generates frost heave stress. Some particles with relatively weak cementation will peel off from the rock surface exposed to the frost heave stress. In addition, the correlation of mass, volume, and density with the freeze–thaw cycles can be characterized as follows:
where , , and is the mass, volume, and density of rock samples, respectively; represents freeze–thaw cycles. Meanwhile, the fitting factors of the mass, volume, and density velocity are 0.9922, 0.9921, and 0.9209, respectively.
3.2. P-Wave Velocity
The ultrasonic wave test, especially the P-wave velocity test, is a frequently used method to assess the structural integrity of the rock. Figure 5 illustrates the variation of the P-wave velocity of the rock samples subjected to freeze–thaw cycles, and the detailed analysis of the testing data is presented in Table 3. Meanwhile, the variation of P-wave velocity () can be calculated by Equation (7):
where is the initial P-wave velocity of the samples, and is the P-wave velocity of the samples after freeze–thaw cycles.
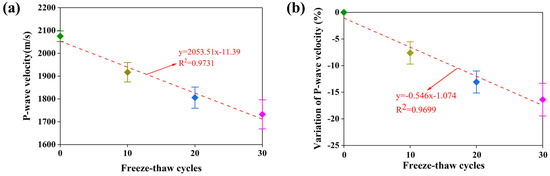
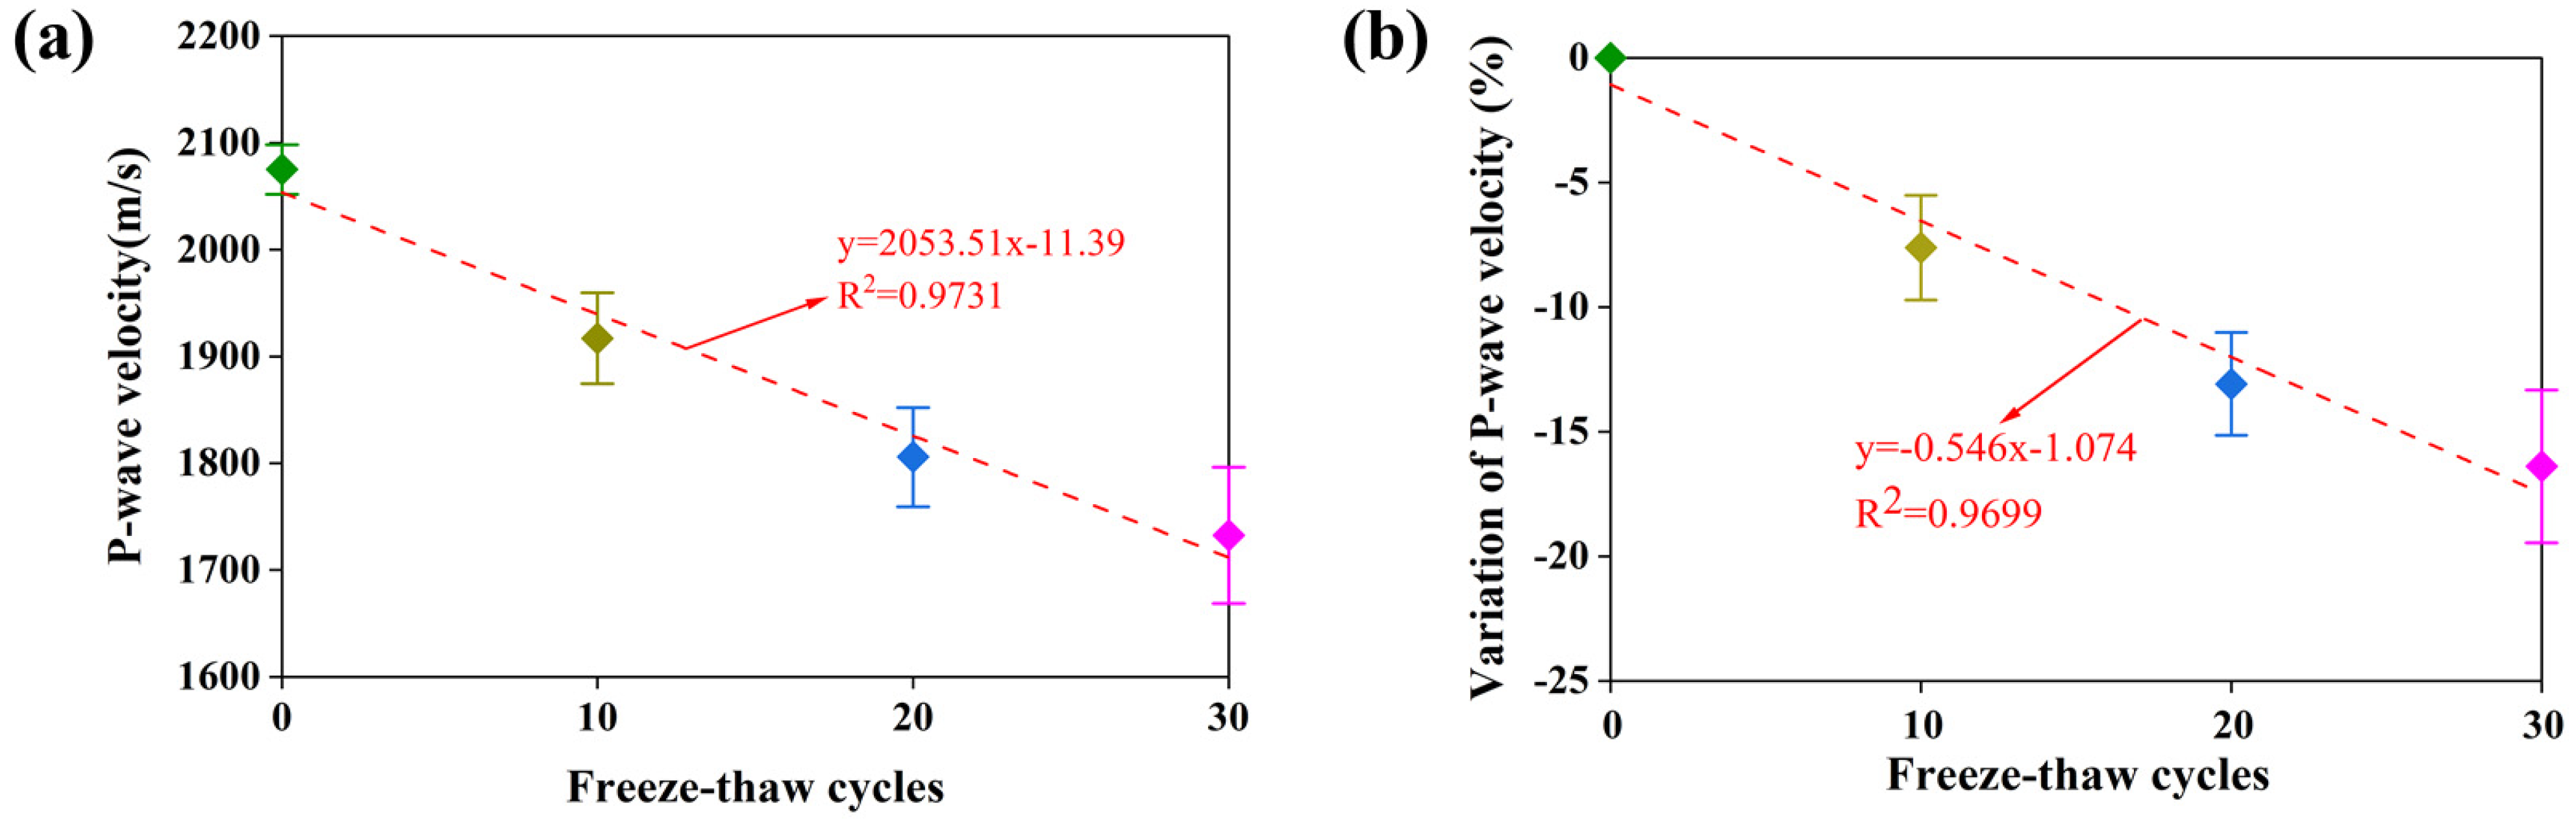
Figure 5.
P-wave velocity of samples against freeze-thaw cycles: (a) P-wave; (b) variation ratio.
Table 3.
Testing results of P-wave velocity of samples induced by freeze–thaw cycles.
Generally, the average value of the P-wave velocity of the original standard samples is 2075.09 m/s, the coefficient of variation of which is 0.2132, revealing that the rocks used in this research are intact in their natural state. Specifically, with the increase in freeze–thaw cycles, the P-wave velocity of the rock samples decreases monotonically, which indicates that micro-cracks are generated and developed in the rock induced by freeze–thaw treatment. The P-wave velocity of the samples significantly decreases from 2075.09 m/s to 1732.41 m/s sn average after 30 freeze–thaw cycles, and the average rate of decrease in P-wave velocity is 16.51 %. In addition, the correlation of P-wave velocity with the freeze–thaw cycles trend can be characterized as follows:
where is the P-wave velocity and represents the freeze–thaw cycles. Meanwhile, the fitting factor of the P-wave velocity is 0.9731.
3.3. Typical Stress-Strain Responses
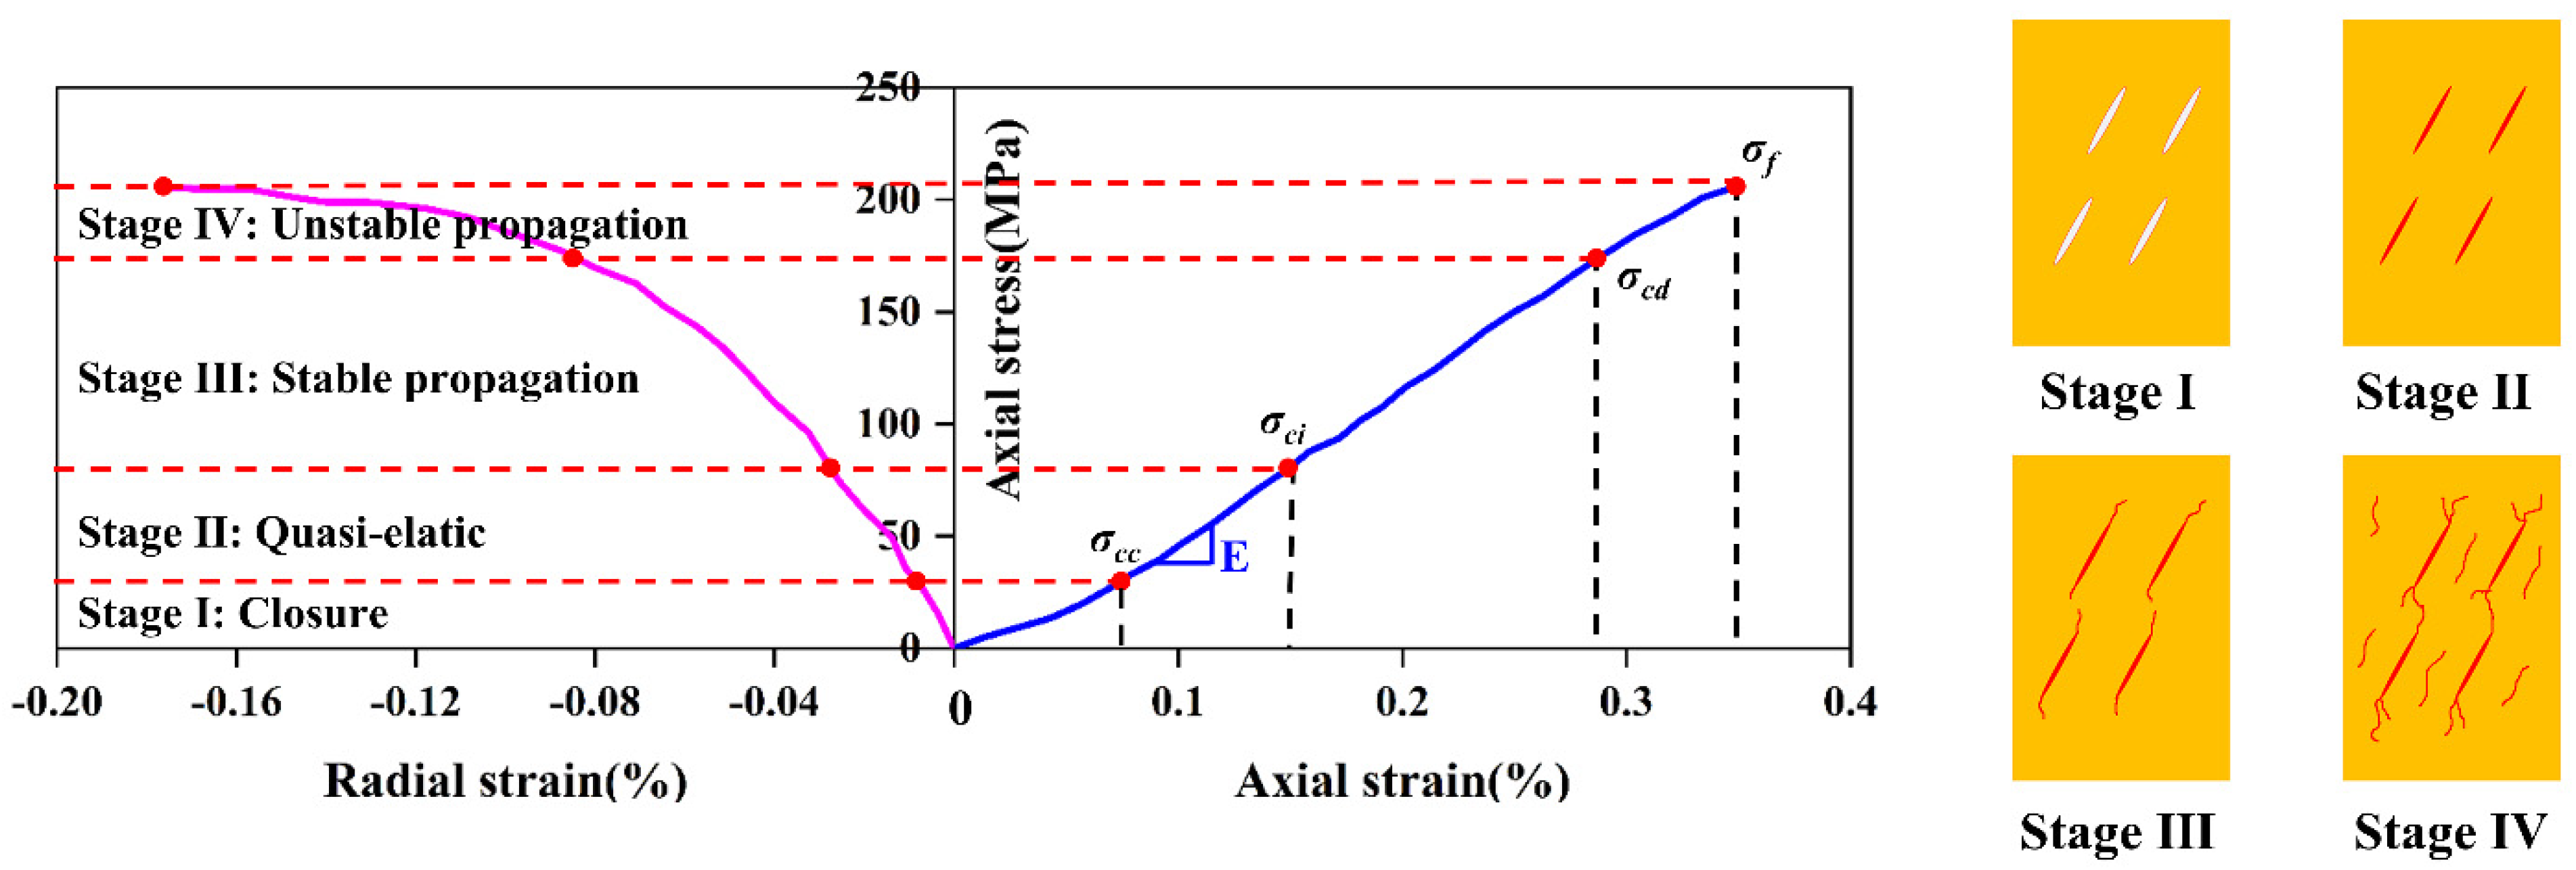
Before failure occurs, stress–strain curves of rocks under external loads can be divided into four stages as follows (shown in Figure 6):
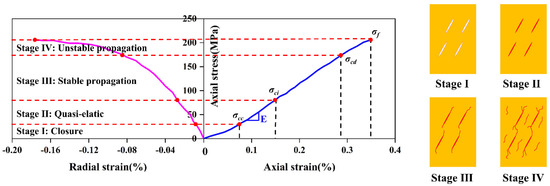
Figure 6.
Cracks propagation patterns of rocks.
- The fracture surface closure stage: In the closure stage, the stiffness of the fracture surface is less than that of the rock mass, thus mainly resulting in the occurrence of fracture closure during the first stage.
- The quasi-elastic stage: In the quasi-elastic stage, the deviator stress versus axial (or lateral) strain curve appears to ascend.
- The stable propagation stage of new cracks: Since the bonding strength of the fracture surface is much less than that of the rock mass, new fractures start to initiate and develop along the original fracture surface during this stage; in other words, the fracture surface starts to debone.
- The unstable propagation of new cracks: During the unstable stage of new fracture initiations, most of the original fracture surfaces start to debone and crack, which is manifested in the process of the loss of bonding strength of the original fracture surfaces. During the stage of new fracture development, in addition to the loss of bonding strength of the original fracture surfaces, the damage of the rock mass originating from the initial fracture surfaces is also accompanied by the occurrence of adjacent new fracture surfaces. The new fractures gradually coalesce and eventually become inter-connected. That is, the overall strength of the fractured rock mass is lost, and ultimate failure occurs.
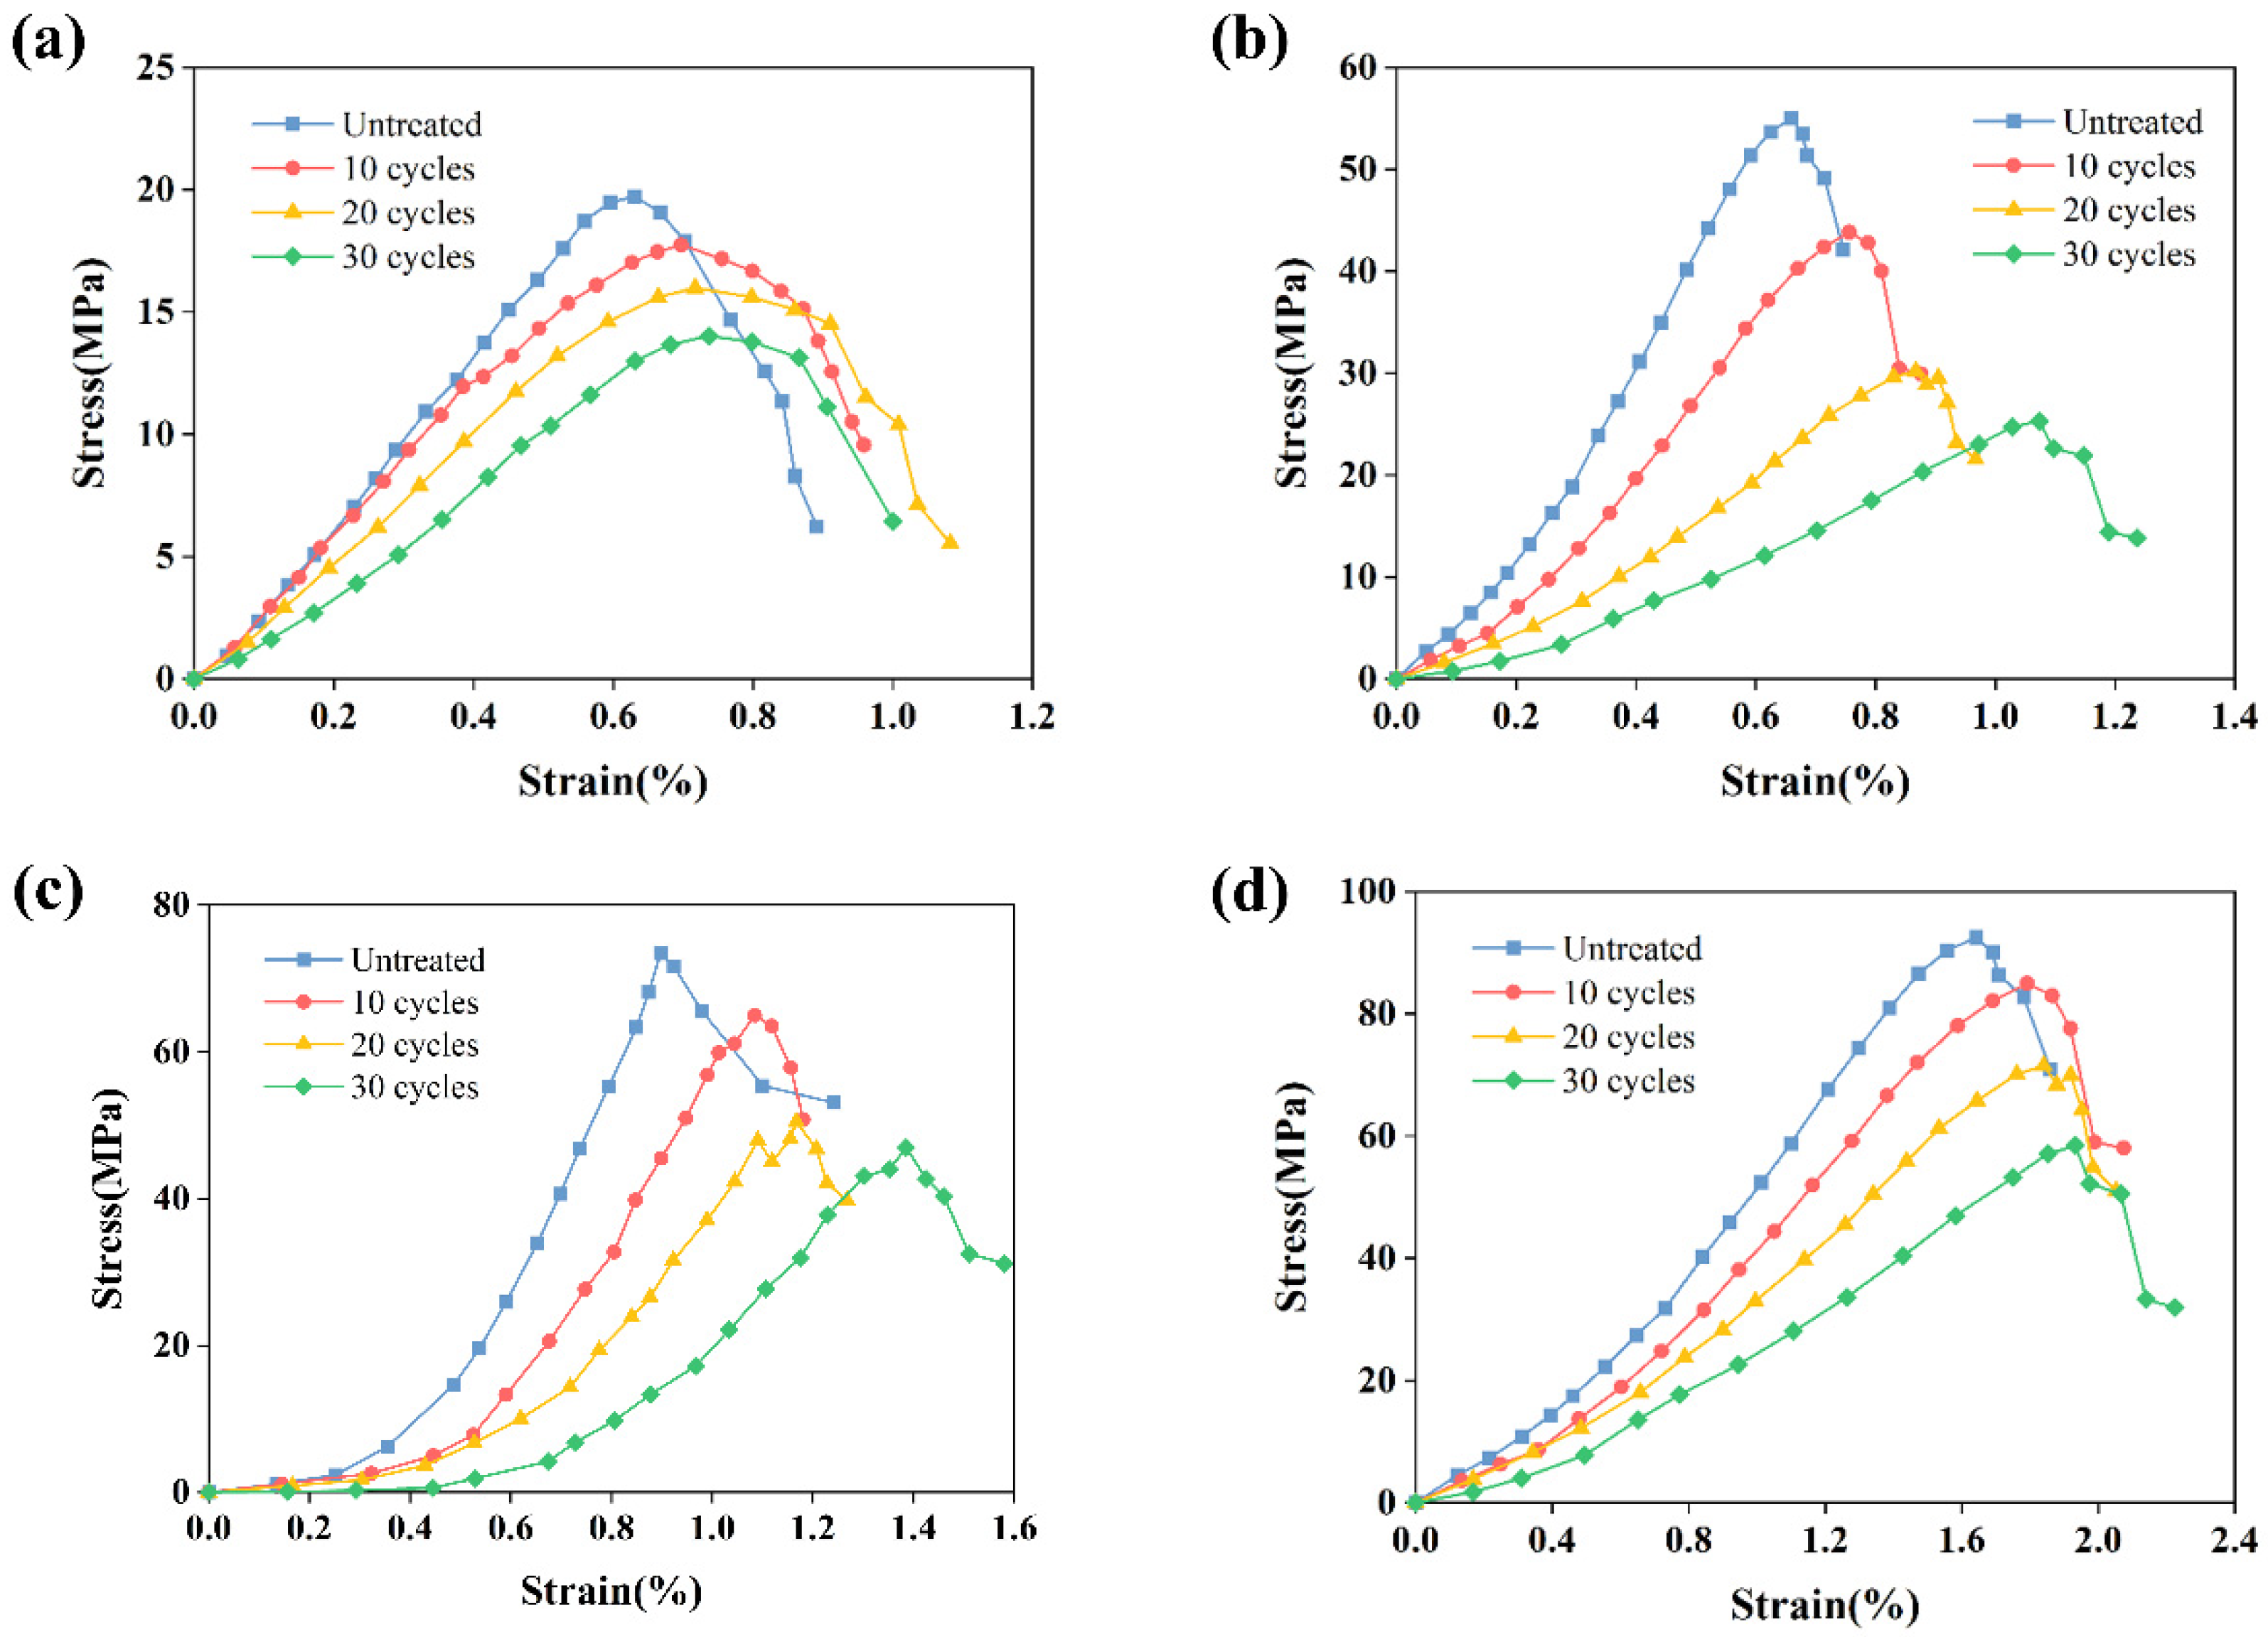
Figure 7 shows the representative stress–strain curves of the red sandstones subjected to freeze–thaw cycles under different confining pressures. At the beginning of the applied load, the stress –strain curves of the samples present a concave-upward shape, which is mainly due to the closure of the natural micro cracks. Meanwhile, the initial non-linear deformation stage becomes more and more evident with the increase in freeze–thaw cycle treatments, which is mainly due to the massive microcracks generated induced by freeze–thaw cycles. Then, as the load is continuously applied, the samples deformed elastically, which means that the stress increased approximately linearly with increasing strain. Specifically, the slopes of the stress–strain curves of the samples decrease gradually with the increase in the freeze–thaw cycles, which indicated that the mechanical properties of rocks deteriorate after freeze–thaw treatment. Before the rocks’ failure, the yield stage of the samples subjected to the freeze–thaw cycles is expanded, the stress–strain curves of which turn smoothly. Finally, the stress–strain curves collapse when the load exceeds the bearing capacity of the red sandstone rocks.
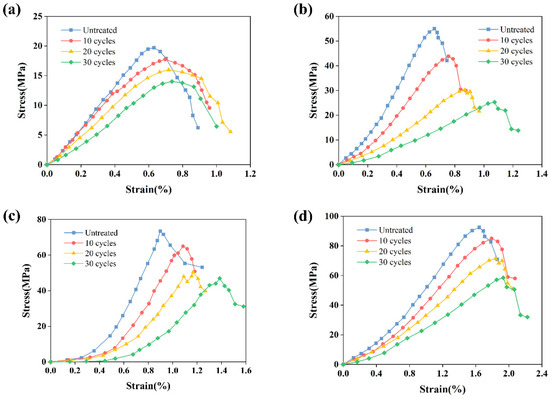
Figure 7.
Representative stress–strain curves of samples under different confining pressures: (a) 0 MPa; (b) 10 MPa; (c) 20 MPa; (d) 30 MPa.
3.4. Mechanical Parameters
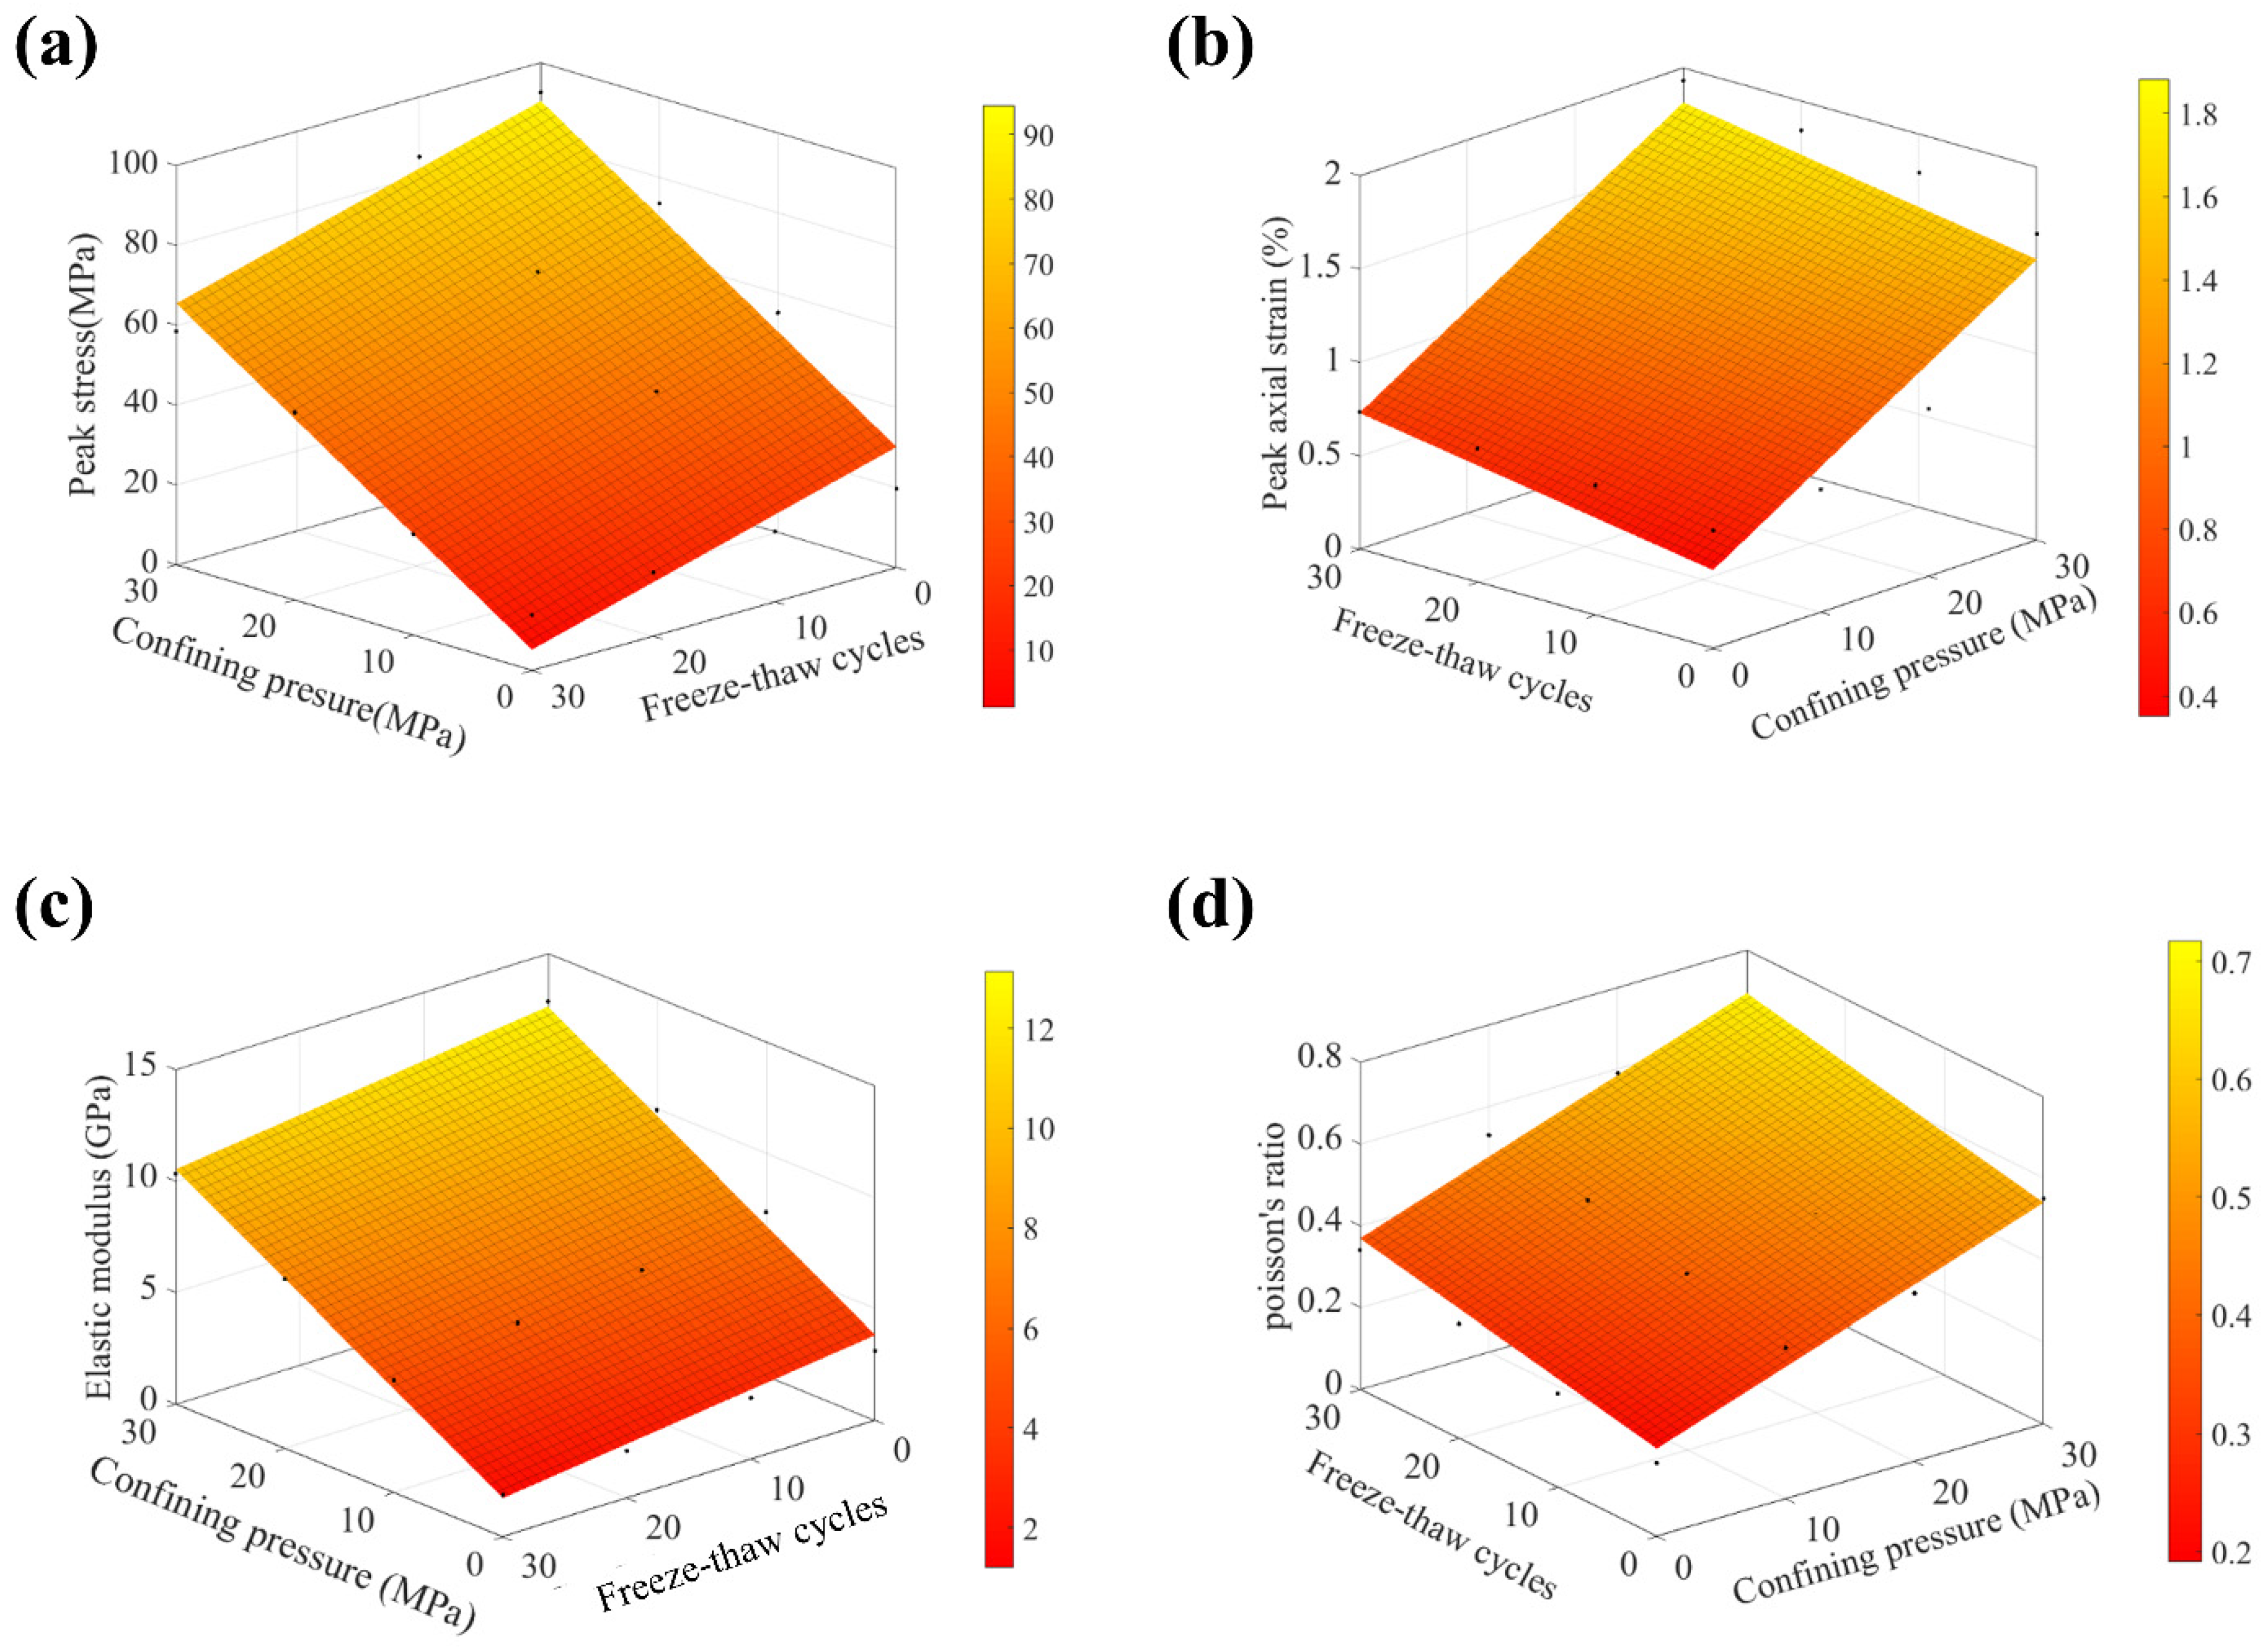
Peak stress, peak strain, elastic modulus, and Poisson’s ratio are four important parameters to assess the mechanical behaviors of red sandstone rocks. The mechanical testing results of the samples induced by freeze–thaw cycles are listed in Table 4. It can be obtained that the peak stress, peak strain, elastic modulus, and Poisson’s ratio of the red sandstone rocks increase as the confining pressures increase. However, with the increase in freeze–thaw cycles, the peak stress and elastic modulus of the samples decrease gradually, while the peak strain and Poisson’s ratio increase. Moreover, based on the regression analysis, the variation trends of the mechanical properties of the red sandstone rocks can be characterized by the confining pressures and the freeze–thaw cycle durations. Figure 8 illustrates the variation trends of the peak stress, peak strain, elastic modulus, and Poisson’s ratio of the samples subjected to freeze–thaw cycles under different confining pressures. The equations of the regression analysis are as follows:
where , , , , , and represent the peak stress, peak axial strain, elastic modulus, Poisson’s ratio, freeze–thaw cycles, and confining pressure, respectively. Meanwhile, the fitting factors of the peak stress, peak axial strain, elastic modulus, and Poisson’s ratio are 0.959, 0.877, 0.987, and 0.927, respectively.
Table 4.
Testing results of mechanical parameters induced by freeze–thaw cycles under different confining pressures.
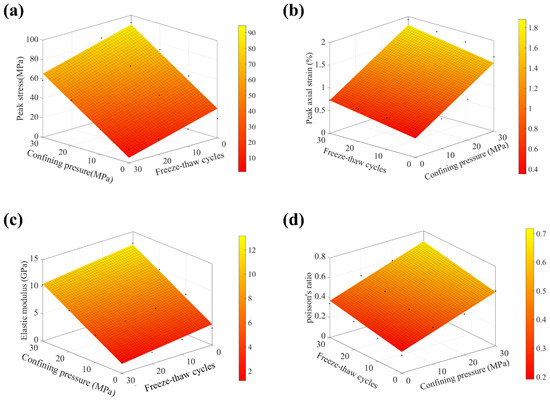
Figure 8.
Variation of (a) peak stress, (b) peak strain, (c) elastic modulus, and (d) Poisson’s ratio with freeze–thaw cycles and confining pressures.
4. Discussion
4.1. Microcracks Propagation
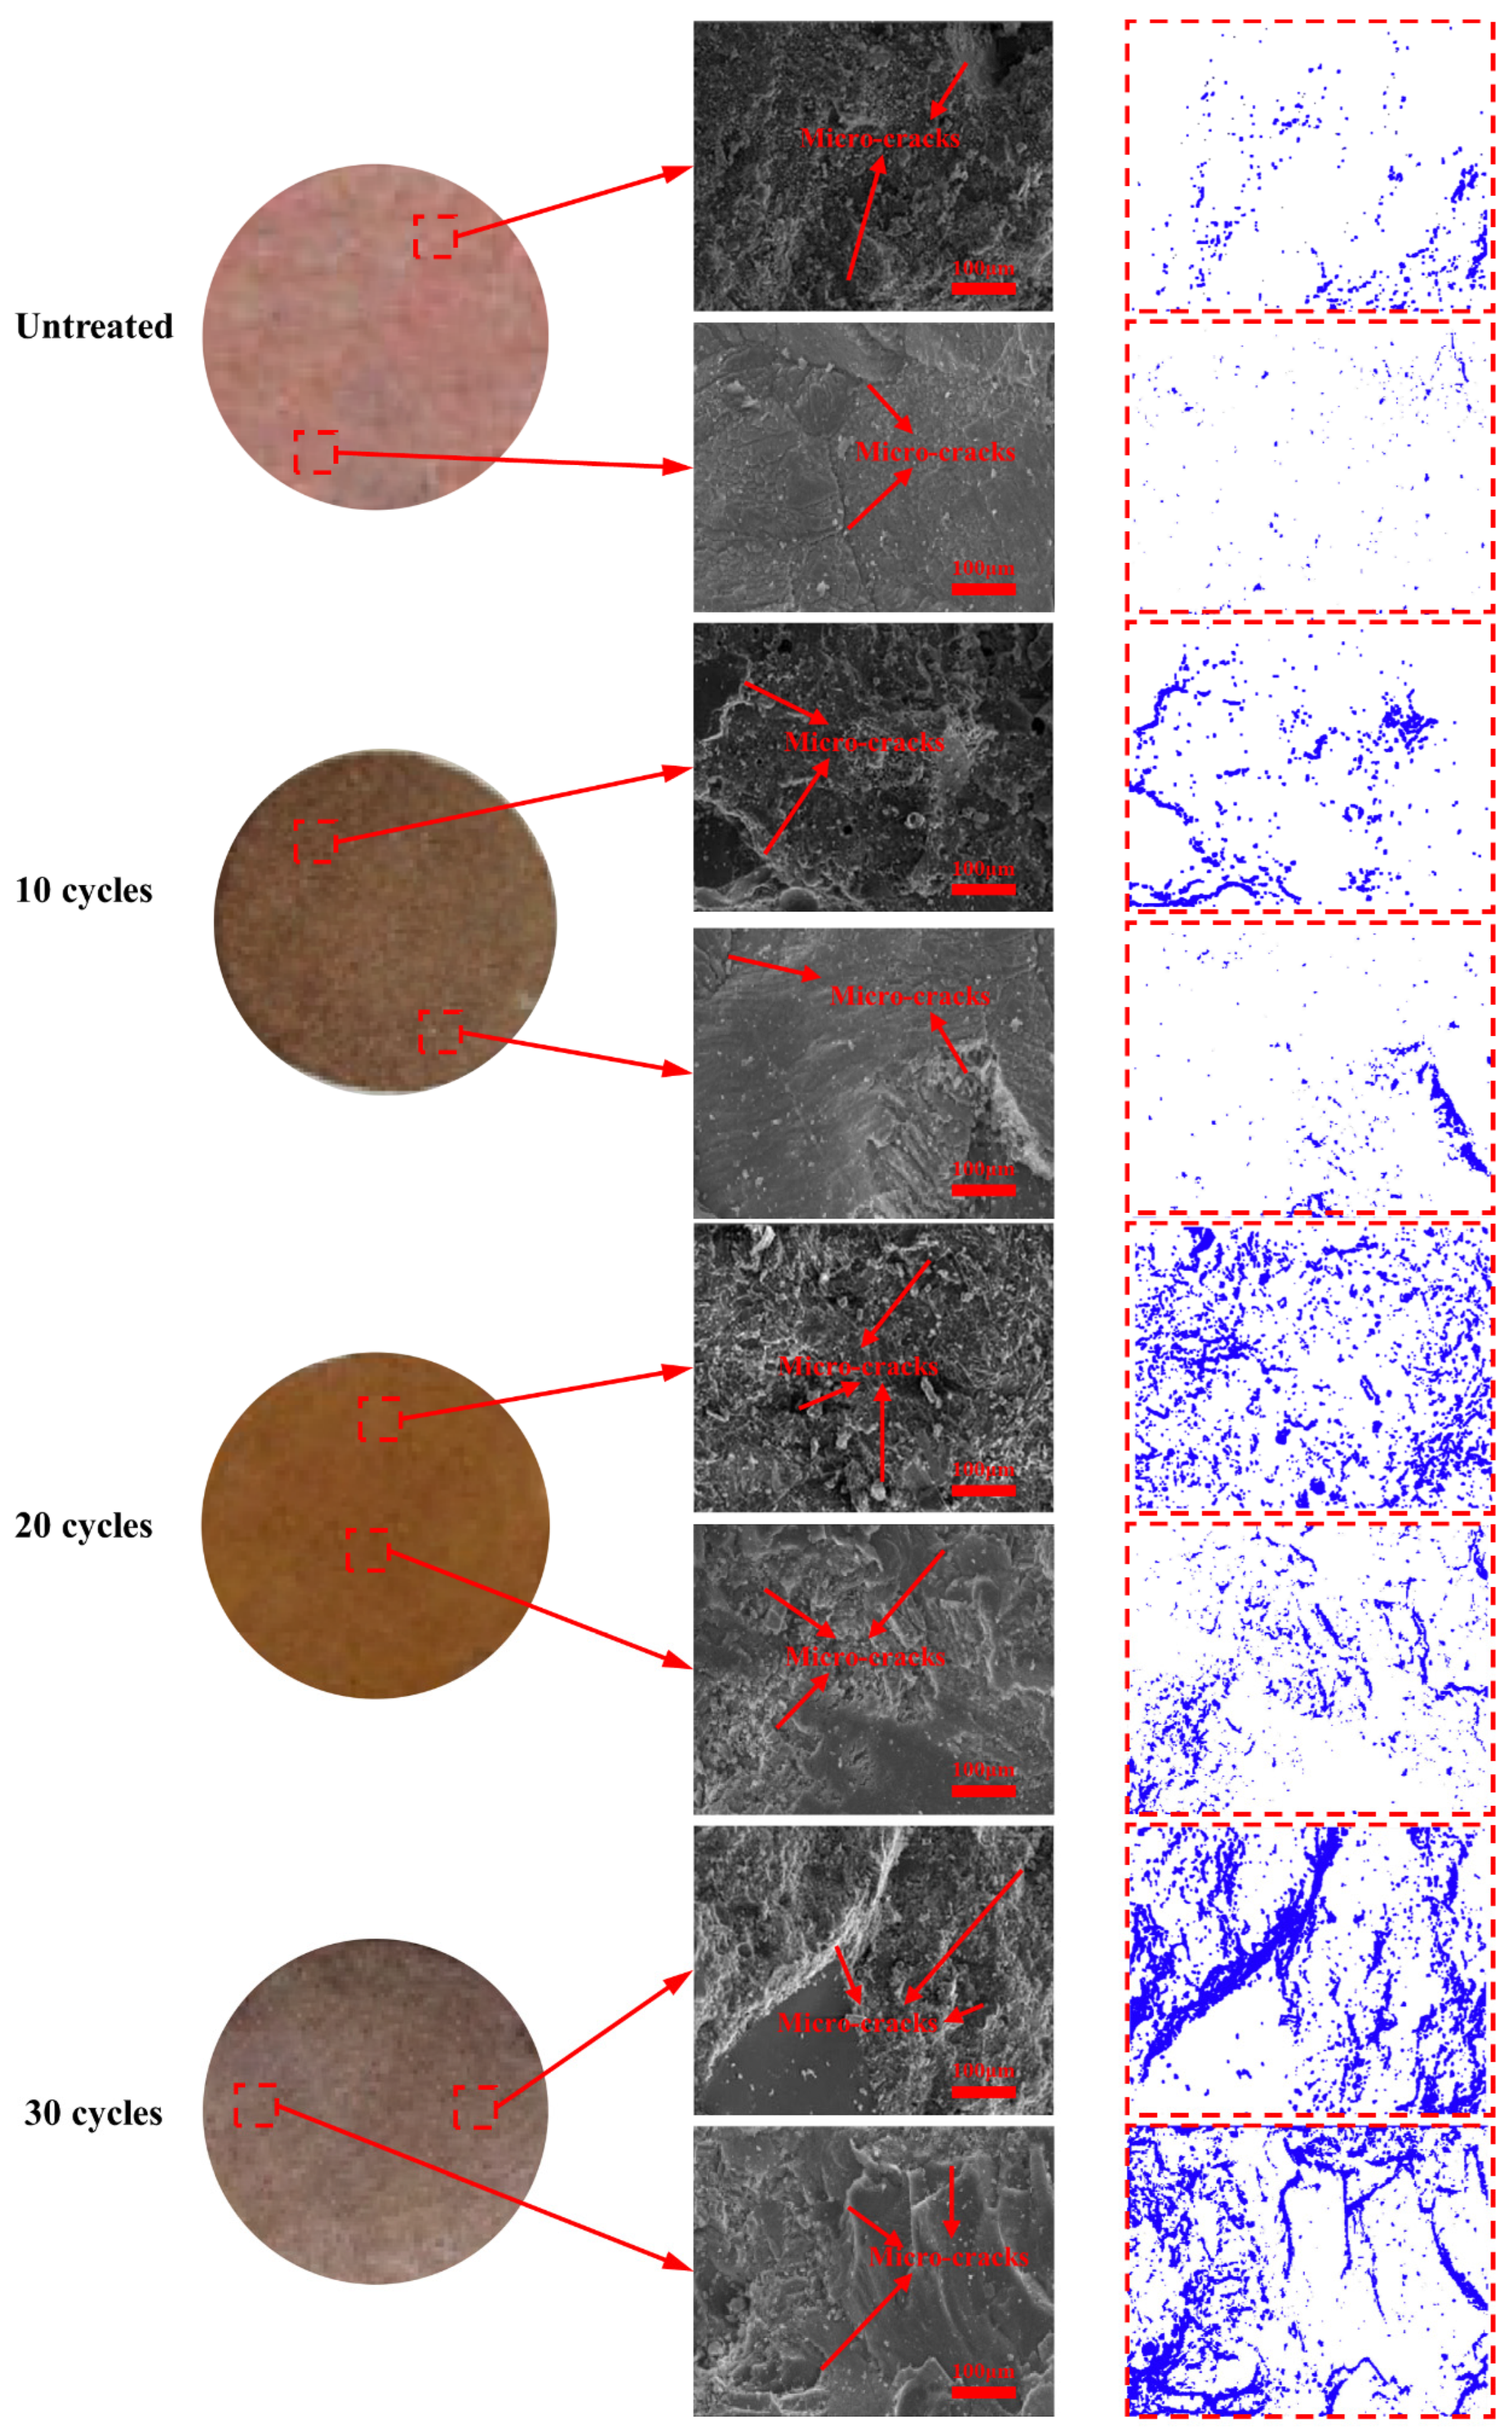
After samples were subjected to the freeze–thaw cycles and different confining pressures, the images of the microcracks and pore structures of the red sandstone rocks were obtained by an SEM device. The observed images and energy spectrum analysis of the samples with a magnification of 500 times are illustrated in Figure 9. Generally, one can observe plenty of microcracks and small pores implied by dark or black region inside the rock samples, all of which present a compact structure. However, after the rock was treated by the freeze–thaw cycles, internal micro-cracks and small pores develop. The rock shows a more fragmental and flaky texture, and its compactness is much lower after the freeze–thaw cycles. After magnification, it was found that the number of micro-cracks and small pores in the treated rocks is much more than that in the natural rocks. The size of the pores in the treated rocks is also relatively larger. Moreover, by using ImageJ software, it can be obtained that the surface porosity of the red sandstone samples subjected to 10, 20, and 30 freeze–thaw cycles are 9.75 %, 11.04%, and 12.11%, respectively, while the surface porosity of the original samples is 7.81%. The statistical results of the micro-cracks and pores of samples induced by freeze–thaw cycles are listed in Table 5.
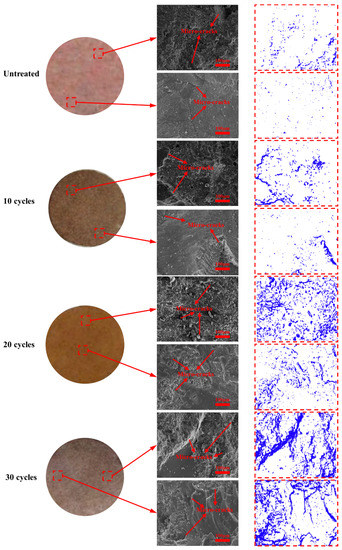
Figure 9.
Micro testing results of samples subjected to freeze–thaw cycles: Left are sample images; middle are SEM images; right are pore structure images.
Table 5.
The statistical results of micro-cracks and pores induced by freeze–thaw cycles.
For rock subjected to freeze–thaw cycles, when water turns to ice in a cold environment, a volumetric expansion would produce an increase in pressure within the pores and micro-cracks. The frost heaving pressure drives the propagation of micro-cracks, the generation of new micro-cracks, and the widening and deepening of existing micro-cracks resulting in a variety of rock microstructures. These microstructural changes of rock determine its macroscopic mechanical behaviors, such as deformation, strength, and failure mode.
4.2. Failure Modes
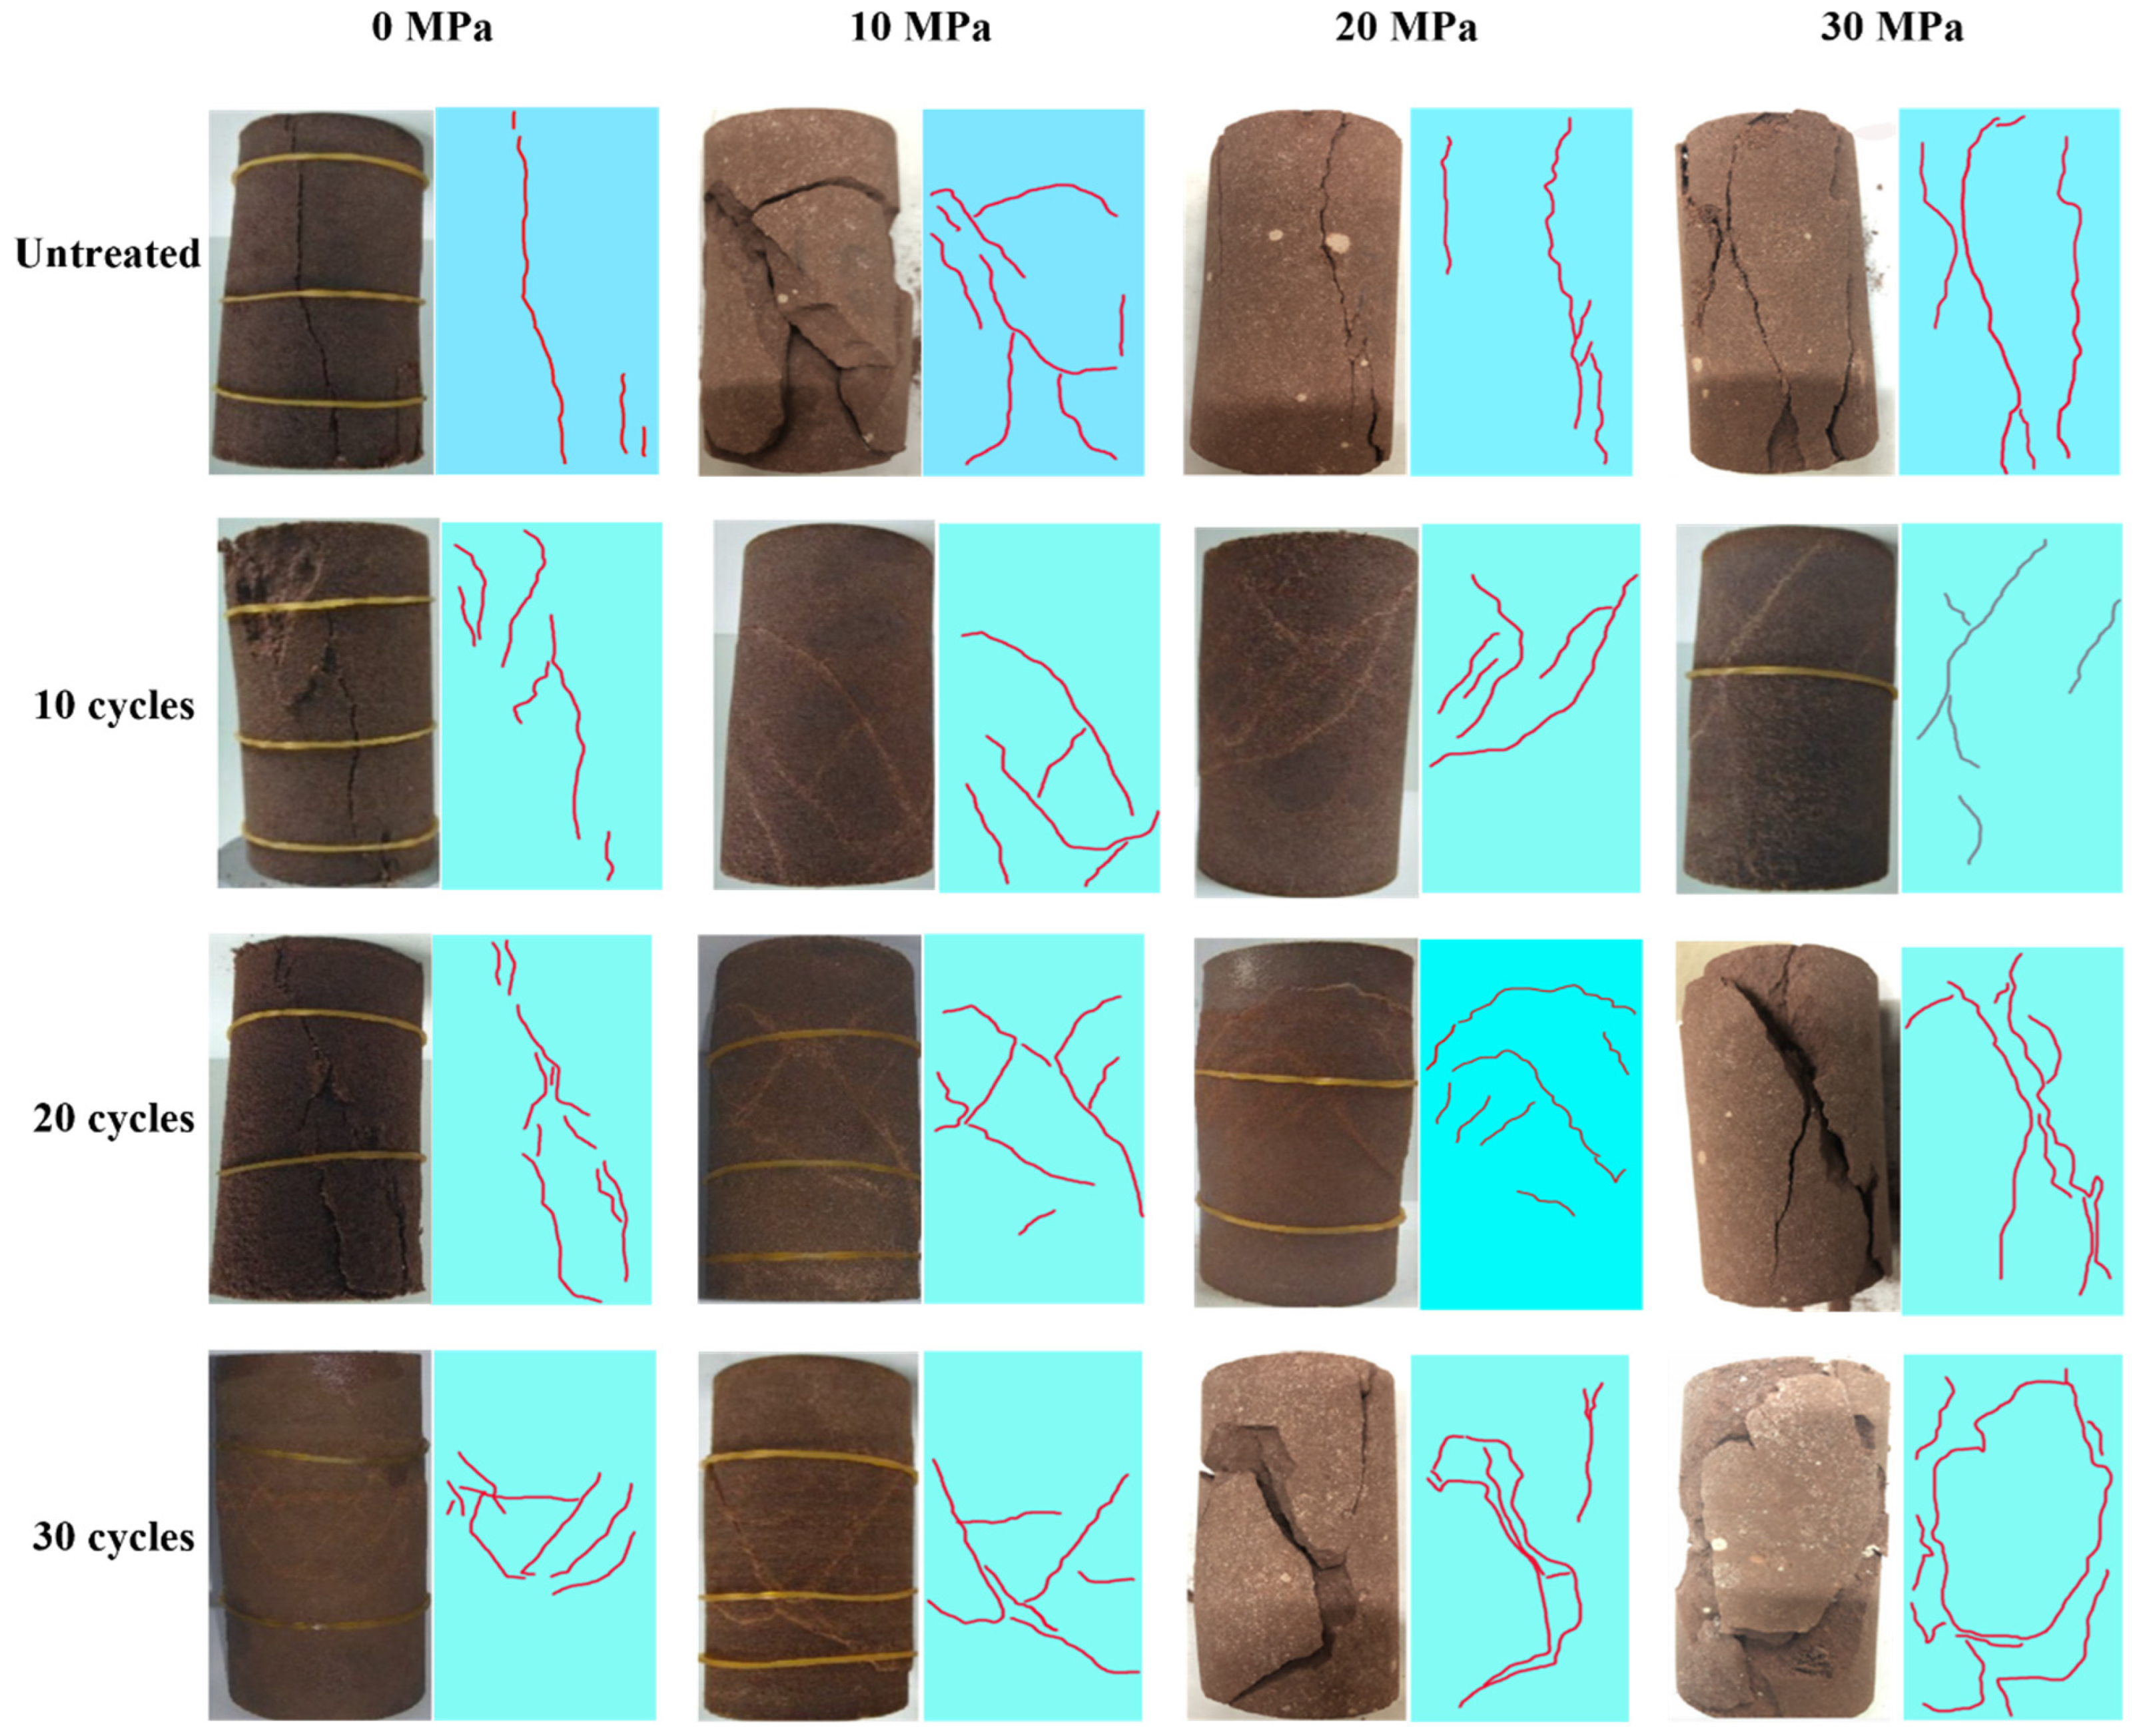
The deformation and failure of rocks under external loads are mainly due to the expansion and propagation of internal micro-cracks. Freeze–thaw cycles and confining pressures applied to the rocks influence the morphology of the micro-cracks, and further result in a variety of macro-fracture networks and failure modes. Typical images of the failure modes of samples are presented in Figure 10. Generally, the density of the fracture network of treated samples can be correlated with the freeze–thaw cycles. In the non-confining tests, the failure modes of the samples mainly show single or multiple macro-cracks that develop along the axial direction, presenting an obvious tensile failure mode caused by the Poisson effect. This is because the low tensile strength of rock forms macro-cracks by tension. Some samples show tension-shear failure mode, and the friction trace on the shear surface is obvious with red lines. However, under triaxial compression conditions, the macro-cracks begin to propagate at the edge of the sample’s end face and the failure modes of the rock samples gradually transfer from splitting to shear and the swelling phenomenon becomes more obvious. Moreover, the number of shear failure surfaces on the rock samples increase with the freeze–thaw cycles. Specifically, when treated by over 20 freeze–thaw cycles, the failure modes of rock samples are mainly multiple shear failure and an “X”-shaped shear failure mode appears. In addition, the tensile cracks on the main fracture surface of rock samples are more evident due to the cumulative effect of freeze–thaw cycles. The failure modes conform to the Mohr–Coulomb strength criterion.

Figure 10.
Failure mode and geological sketches of samples (left and right images are original failure pictures and geological sketch pictures, respectively).
5. Conclusions
In this study, a series of physical and mechanical tests were conducted to investigate the influence of freeze–thaw cycles and confining pressures on the fracture behavior and mechanical properties of the red sandstone rock. The conclusions of this research are summarized below:
- (1)
- The mass, volume density, and P-wave velocity of the red sandstone show a significant correlation with the number of freeze–thaw cycles. After being treated by freeze–thaw cycles, the mass, density, and P-wave velocity of rocks decrease, while the volume of rocks increases. The variation trend of mass, volume, density, and P-wave velocity of rocks show linear correlations with freeze–thaw cycles.
- (2)
- The mechanical properties of the red sandstone are highly influenced by the freeze–thaw cycles and confining pressures. The peak stress and elastic modulus are decreased with the increase in freeze–thaw cycles, while peak strain and Poisson’s rate are increased. Results also show that the confining pressure significantly influences the mechanical performance of rocks, while the freeze–thaw cycles influence the deterioration of the mechanical performance of rocks.
- (3)
- After being treated by freeze–thaw cycles, the number of micro-cracks and pores within the saturated rocks increased. The frost heaving stress induced in the freezing process drives the propagation of micro-cracks and the generation of new micro-cracks. The micro-structural changes in rock determine its macroscopic mechanical behaviors, such as deformation, strength, and failure mode.
- (4)
- Before freeze–thaw cycles, red sandstone presents a typical brittleness feature since the failure mode shows single or multiple macro-cracks that develop along the axial direction. However, when confining pressure is applied, the rocks subjected to freeze–thaw cycles show more and more ductility characteristics, and the failure modes gradually transfer from splitting to shear.
Author Contributions
Investigate, methodology and writing- original draft, X.-W.Z.; Validation, supervision and funding, J.-H.X.; Designed and analysis, Y.C.; Collected the data and visualization, L.S.; Writing- reviewing and editing, F.S., All authors have read and agreed to the published version of the manuscript.
Funding
This paper was supported by the Key projects of the Joint Fund of the National Natural Science Foundation of China (Grant Number U21A20107).
Institutional Review Board Statement
Not applicable.
Informed Consent Statement
Not applicable.
Data Availability Statement
The data used to support the findings of this study are included within the article.
Conflicts of Interest
The authors declare that they have no conflict of interest.
References
- Treat, C.C.; Jones, M.C.; Alder, J.; Sannel, A.B.K.; Camill, P.; Frolking, S. Predicted Vulnerability of Carbon in Permafrost Peatlands with Future Climate Change and Permafrost Thaw in Western Canada. J. Geophys. Res. Biogeosci. 2021, 126, E2020JG005872. [Google Scholar] [CrossRef]
- Obu, J. How Much of the Earth’s Surface is Underlain by Permafrost? J. Geophys. Res. Earth Surf. 2021, 126, E2021JF006123. [Google Scholar] [CrossRef]
- Wu, C.; Deng, R. Research on the Extraction Technology of Gas-Integrated Working-Face in Close Coal Seam Mining in Permafrost Area. Geofluids 2022, 2022, 2379040. [Google Scholar] [CrossRef]
- Gong, S.; Wang, W.; Xi, F.; Shen, W. Investigation of Dynamic Mechanical Properties of Coal after Freeze-Thaw Cyclic Conditions. Geofluids 2021, 2021, 8602301. [Google Scholar] [CrossRef]
- Qi, X.L.; Xu, H.J.; Chen, T.; Shan, S.Y.; Chen, S.Y. Effects of climate change, coal mining and grazing on vegetation dynamics in the mountain permafrost regions. Ecol. Inform. 2022, 69, 101684. [Google Scholar] [CrossRef]
- Kraev, G.; Belonosov, A.; Veremeeva, A.; Grabovskii, V.; Sheshukov, S.; Shelokhov, I.; Smirnov, A. Fluid Migration through Permafrost and the Pool of Greenhouse Gases in Frozen Soils of an Oil and Gas Field. Remote Sens. 2022, 14, 3662. [Google Scholar] [CrossRef]
- Li, X.; Jin, X.; Wang, X.; Jin, H.; Tang, L.; Li, X.; He, R.; Li, Y.; Huang, C.; Zhang, S. Investigation of permafrost engineering geological environment with electrical resistivity tomography: A case study along the China-Russia crude oil pipelines. Eng. Geol. 2021, 291, 106237. [Google Scholar] [CrossRef]
- Li, B.; Chen, L.L.; Wan, Q.C.; Han, X.; Wu, Y.Q.; Luo, Y.J. Experimental study of frozen gas hydrate decomposition towards gas recovery from permafrost hydrate deposits below freezing point. Fuel 2020, 280, 118557. [Google Scholar] [CrossRef]
- Pandey, J.S.; Almenningen, S.; von Solms, N.; Ersland, G. Pore-Scale Visualization of CH4 Gas Hydrate Dissociation under Permafrost Conditions. Energy Fuels 2021, 35, 1178–1196. [Google Scholar] [CrossRef]
- Wang, J.; Lau, H.C. Thickness of gas hydrate stability zone in permafrost and marine gas hydrate deposits: Analysis and implications. Fuel 2020, 282, 118784. [Google Scholar] [CrossRef]
- Draebing, D.; Krautblatter, M. The Efficacy of Frost Weathering Processes in Alpine Rockwalls. Geophys. Res. Lett. 2019, 46, 6516–6524. [Google Scholar] [CrossRef]
- Lin, H.; Lei, D.; Zhang, C.; Wang, Y.; Zhao, Y. Deterioration of non-persistent rock joints: A focus on impact of freeze–thaw cycles. Int. J. Rock Mech. Min. Sci. 2020, 135, 104515. [Google Scholar] [CrossRef]
- Tharp, T.M. Conditions for crack propagation by frost wedging. Geol. Soc. Amercia Bull. 1987, 99, 94–102. [Google Scholar] [CrossRef]
- Lin, H.; Lei, D.; Zhang, C.; Wang, Y.; Zhao, Y. Freeze-thaw damage evolution of fractured rock mass using nuclear magnetic resonance technology. Cold Reg. Sci. Technol. 2020, 170, 102951. [Google Scholar]
- Yi, X.; Su, D.; Bussière, B.; Mayer, K.U. Thermal-Hydrological-Chemical Modeling of a Covered Waste Rock Pile in a Permafrost Region. Minerals 2021, 11, 565. [Google Scholar] [CrossRef]
- Zhang, J.; Deng, H.; Taheri, A.; Ke, B.; Liu, C.; Yang, X. Degradation of physical and mechanical properties of sandstone subjected to freeze-thaw cycles and chemical erosion. Cold Reg. Sci. Technol. 2018, 155, 37–46. [Google Scholar] [CrossRef]
- Li, X.; Qu, D.; Luo, Y.; Ma, R.; Xu, K.; Wang, G. Damage evolution model of sandstone under coupled chemical solution and freeze-thaw process. Cold Reg. Sci. Technol. 2019, 162, 88–95. [Google Scholar] [CrossRef]
- Song, Y.; Tan, H.; Yang, H.; Chen, S.; Che, Y.; Chen, J. Fracture evolution and failure characteristics of sandstone under freeze-thaw cycling by computed tomography. Eng. Geol. 2021, 294, 106370. [Google Scholar] [CrossRef]
- Zhao, R.; Zhai, Y.; Meng, F.; Li, Y.; Li, Y. Research on interactions among parameters affecting dynamic mechanical properties of sandstone after freeze-thaw cycles. Eng. Geol. 2021, 293, 106332. [Google Scholar] [CrossRef]
- Gao, F.; Xiong, X.; Xu, C.; Zhou, K. Mechanical property deterioration characteristics and a new constitutive model for rocks subjected to freeze-thaw weathering process. Int. J. Rock Mech. Min. Sci. 2021, 140, 104642. [Google Scholar] [CrossRef]
- Liu, Y.; Cai, Y.; Huang, S.; Guo, Y.; Liu, G. Effect of water saturation on uniaxial compressive strength and damage degree of clay-bearing sandstone under freeze-thaw. Bull. Eng. Geol. Environ. 2020, 79, 2021–2036. [Google Scholar] [CrossRef]
- Yang, C.; Zhou, K.; Xiong, X.; Deng, H.; Pan, Z. Experimental investigation on rock mechanical properties and infrared radiation characteristics with freeze-thaw cycle treatment. Cold Reg. Sci. Technol. 2021, 183, 103232. [Google Scholar] [CrossRef]
- Liu, C.; Deng, H.; Zhao, H.; Zhang, J. Effects of freeze-thaw treatment on the dynamic tensile strength of granite using the Brazilian test. Cold Reg. Sci. Technol. 2018, 155, 327–332. [Google Scholar] [CrossRef]
- Luo, Y.; Qu, D.; Wang, G.; Li, X.; Zhang, G. Degradation model of the dynamic mechanical properties and damage failure law of sandstone under freeze-thaw action. Soil Dyn. Earthq. Eng. 2020, 132, 106094. [Google Scholar] [CrossRef]
- Wang, P.; Xu, J.; Fang, X.; Wang, P. Energy dissipation and damage evolution analyses for the dynamic compression failure process of red-sandstone after freeze-thaw cycles. Eng. Geol. 2017, 221, 104–113. [Google Scholar] [CrossRef]
- Zhang, H.; Meng, X.; Yang, G. A study on mechanical properties and damage model of rock subjected to freeze-thaw cycles and confining pressure. Cold Reg. Sci. Technol. 2020, 174, 103056. [Google Scholar] [CrossRef]
- Lu, Y.; Li, X.; Han, Y.; Wu, J. Mechanical properties of rock samples with a single natural weak plane after freeze-thaw action. Cold Reg. Sci. Technol. 2021, 181, 103179. [Google Scholar] [CrossRef]
- Mu, J.Q.; Pei, X.J.; Huang, R.Q.; Rengers, N.; Zou, X.Q. Degradation characteristics of shear strength of joints in three rock types due to cyclic freezing and thawing. Cold Reg. Sci. Technol. 2017, 138, 91–97. [Google Scholar] [CrossRef]
- Yu, J.; Chen, X.; Li, H.; Zhou, J.W.; Cai, Y.Y. Effect of freeze-thaw cycles on mechanical properties and permeability of red sandstone under triaxial compression. J. Mt. Sci. 2015, 15, 218–231. [Google Scholar] [CrossRef]
- Wang, L.; Li, N.; Qi, J.; Tian, Y.; Xu, S. A study on the physical index change and triaxial compression test of intact hard rock subjected to freeze-thaw cycles. Cold Reg. Sci. Technol. 2019, 160, 39–47. [Google Scholar]
- Yahaghi, J.; Liu, H.; Chan, A.; Fukuda, D. Experimental and numerical studies on failure behaviours of sandstones subject to freeze-thaw cycles. Transp. Geotech. 2021, 31, 100655. [Google Scholar] [CrossRef]
- Tang, X.; Tao, S.; Li, P.; Rutqvist, J.; Hu, M.; Sun, L. The propagation and interaction of cracks under freeze-thaw cycling in rock-like material. Int. J. Rock Mech. Min. Sci. 2022, 154, 105112. [Google Scholar] [CrossRef]
- Niu, C.; Zhu, Z.; Zhou, L.; Li, X.; Ying, P.; Dong, Y.; Deng, S. Study on the microscopic damage evolution and dynamic fracture properties of sandstone under freeze-thaw cycles. Cold Reg. Sci. Technol. 2021, 191, 103328. [Google Scholar] [CrossRef]
- Yu, S.; Ke, Y.; Deng, H.; Tian, G.; Deng, J. Experimental Investigation of Porous and Mechanical Characteristics of Single-Crack Rock-like Material under Freeze-Thaw Weathering. Minerals 2021, 11, 1318. [Google Scholar] [CrossRef]
- Liu, B.; Ma, Y.; Zhang, G.; Xu, W. Acoustic emission investigation of hydraulic and mechanical characteristics of muddy sandstone experienced one freeze-thaw cycle. Cold Reg. Sci. Technol. 2018, 151, 335–344. [Google Scholar] [CrossRef]
- Hou, P.Y.; Cai, M. Post-Peak Stress–Strain Curves of Brittle Hard Rocks Under Different Loading Environment System Stiffness. Rock Mech. Rock Eng. 2022, 55, 3837–3857. [Google Scholar] [CrossRef]
- Fairhurst, C.E.; Hudson, J.A. Draft ISRM suggested method for the complete stress-strain curve for intact rock in uniaxial compression. Int. J. Rock Mech. 1999, 36, 279–289. [Google Scholar]
- Lan, Y.; Gao, H.; Zhao, Y. Pore Structure Characteristics and Strength Variation of RedSandstone under Freeze–Thaw Cycles. Materials 2022, 15, 3856. [Google Scholar] [CrossRef]
- Hou, C.; Jin, X.; He, J.; Li, H. Statistical Damage Constitutive Model for Anhydrite Rockunder Freeze–Thaw Cycles Considering the Residual Strength and Postpeak Stress Dropping Rate. Int. J. Geomech. 2022, 20, 04022126. [Google Scholar] [CrossRef]


Publisher’s Note: MDPI stays neutral with regard to jurisdictional claims in published maps and institutional affiliations. |
© 2022 by the authors. Licensee MDPI, Basel, Switzerland. This article is an open access article distributed under the terms and conditions of the Creative Commons Attribution (CC BY) license (https://creativecommons.org/licenses/by/4.0/).