Abstract
Based on a new development philosophy, this paper constructs an index system for measuring and evaluating high-quality developments in the Yellow River Basin using the entropy weight TOPSIS model and the obstacle degree analysis model to carry out a diagnostic analysis of the spatio-temporal differences in the level of high-quality development and obstacle factors in nine Yellow River Basin provinces from 2010 to 2020. The results show that: (1) During the period 2010–2020, the Yellow River Basin’s high-quality development index showed a rising trend and the subindexes showed a trend of “coordinated development > shared development > green development > open development > innovative development”. However, the overall level of high-quality development in the basin is not high, and there is still much room for improvement. (2) The global Moran’s I of the high-quality development indexes in 2010, 2015 and 2020 are −0.216, −0.204 and −0.103, respectively, indicating that the level of high-quality development in each province and region within the Yellow River Basin is discrete and develops in a spatially unbalanced direction. (3) The obstacle degree analysis shows that green development, innovation development and open development are the main bottlenecks affecting the high-quality development of the basin. The restrictive role of green development is increasingly prominent, and the low level of scientific and technological innovation and achievement transformation, serious resource consumption and low resource utilization rate of industrial development, in addition to the low level of openness to the outside world are becoming key factors hindering the high-quality development of the provinces in the Yellow River Basin.
1. Introduction
In 2017, the 19th National Congress of the Communist Party of China first proposed that China’s economy had shifted from a stage of high-speed growth to a stage of high-quality development (HQD), which will become the main theme of China’s future development in all areas of the economy and society. HQD is a shift from traditional development, which simply pursues quantity and growth rate, to development where quality and efficiency are the primary objectives. Its basic requirements are low input of production factors, high efficiency of resource allocation, low cost of resources and environment, and positive economic and social benefits [1]. Fundamentally, HQD does not simply refer to growth at the quantitative level of economic aggregates and material wealth but includes the comprehensive enhancement of economic, political, cultural, social and ecological aspects; therefore, it requires a focus on solving the outstanding imbalances and inadequacies in the development of economic and social environments. Additionally, it means realising a shift in the mode of economic and social development from one that focuses on speed to one that focuses on quality and efficiency [2]. As an important birthplace of Chinese civilization, the Yellow River Basin (YRB) is rich in coal, oil, natural gas and non-ferrous metals [3], containing more than 30% of China’s population and nearly 26% of the country’s Gross National Product (GNP). It is also a key area for China to win the fight against poverty and build a moderately prosperous society in all respects, it also has an important position in the country’s economic and social development and ecological security [4]. In 2019, at the symposium on the ecological protection and high-quality development of YRB, General Secretary Xi Jinping proposed that “ecological protection and HQD of YRB is a major national strategy”. However, due to regional conditions, natural environment and certain historical reasons, rapid economic and social development has greatly exceeded the carrying capacity of the basin’s ecosystem, resulting in serious soil erosion and environmental pollution [5,6]. In addition, there has been a range of watershed zonality issues, such as the extensive mode of growth, the obvious tendency towards energy and heavy chemical industry [7], the high degree of homogenisation of industrial structures between regions, the high intensity of internal consumption competition [8,9], low efficiency of scientific and technological innovation [10], unbalanced and insufficient improvement of people’s livelihoods [11], etc., which are prominent. These problems have seriously restricted the sustainable development of YRB’s economy and environment. Therefore, a study on the spatio-temporal measurement of HQD in YRB and revealing the main obstacles affecting the basin’s high-quality development can provide a theoretical basis and policy reference for promoting high-quality development in YRB.
The goal of HQD is to improve the quality and efficiency of development and to build a modern economic system. Implementing high-quality development means changing economic development from quantity and scale to quality and efficiency, achieving more sustainable economic development, a greener ecological environment and more equitable social distribution. In the past, scholars have mostly studied the issues of quality of development in terms of the speed, efficiency and balance of economic development. For example, Wang Zhanxiang (2017) [12] studied the influence of factors such as technological progress, industrial structure and population structure on the speed of regional economic development; Niu Liang (2021) [13] analysed the economic efficiency of China’s Guangdong-Hong Kong-Macao Greater Bay Area and its influencing factors through principal component analysis, data envelopment analysis and spatial analysis models; and Han Zhaozhou et al. (2005) [14] used kernel density function estimation and factor decomposition to analyse the spatial variation status and spatio-temporal evolution characteristics of China’s economic development. In recent years, research on the quality of development has gradually expanded from an economic to a social dimension. Research on high-quality development has continued to deepen and is mainly reflected in the following aspects: (1) Research on the connotations of HQD. At present, scholars generally understand HQD from a comprehensive perspective, for example, Ma Jing (2021) [15] believes that HQD includes many aspects such as high-quality economic development, high-quality ecological environment and high quality of life. Ren Baoping (2020) [16] believes that HQD includes high-quality economic development, high-quality reform and opening-up, high-quality urban and rural construction, high-quality ecological environment and high quality of life and other dimensions; (2) Construction of an HQD evaluation index system. For example, Shi Bo et al. (2018) [17] constructed the HQD evaluation index system based on the fundamentals of development, the social outcomes of development and the ecological outcomes of development. Zhang Helin et al. (2020) [18] constructed an HQD evaluation index system based on the aspects of high-quality economic development, high-quality social development and high-quality environmental development; and (3) Research on the impact factors of HQD. For example, Xu Pengjie et al. (2019) [19] conducted a study on the influencing factors of HQD in 30 provinces and regions in China using spatial econometric models and concluded that expanding on opening up to the outside world and improving total factor productivity both have obvious positive effects on China’s HQD.
As an important birthplace of Chinese civilization, the development of YRB has been a hot topic of concern for scholars, and a series of studies have been conducted on water–soil disasters and governance [20], the impacts of climate change [21], the functions of ecological service [22], the directions of industrial development [7], the differences of economic development [23], education, healthcare and poverty alleviation and other livelihood issues [24,25], etc. Since 2019, the issue of HQD in YRB has gradually become a key focus for scholars, who have focused on “the logical relationship between ecological protection and HQD in the basin [26], the policy combing, experience learning and development path of HQD in the basin [27,28], the coupling characteristics of ecological protection and HQD [29], the HQD of industries in urban clusters [4], the HQD of water conservancy, agriculture, transportation and other industries [30,31], and the integrated and coordinated development of socio-economic environment [18,32]”. For example, Yu et al. (2021) [33] used the entropy value method to analyze and evaluate the HQD of tourism in the Shandong section of YRB in China; Zhang Guoxing et al. (2020) [34] constructed an HQD evaluation index system based on the dimensions of economic structure optimization, innovation-driven development, ecological moderate livability, effective resource allocation, and public service sharing, and used the entropy value method to measure the development level of central cities in YRB; and Chen et al. (2022) [35] used seven urban agglomerations in YRB as samples and established an evaluation system for HQD using the entropy value method to analyze the level of human living environment quality in urban agglomerations in YRB.
A review of the literature shows that research on HQD in the YRB has switched from qualitative research on the essence and connotation to quantitative research on the comprehensive and coordinated development of the economy, industry and even the socio-economic environment, providing important support for promoting the HQD of the YRB. However, the following shortcomings still exist in the current research on the assessment of HQD in the YRB: (1) Most of the existing studies take YRB’s urban agglomerations, with specific provinces or cities as the research objects, and fewer studies have been conducted to assess the level of HQD in YRB as a whole; (2) Scholars mostly understand the connotations of HQD from the perspectives of economic development and ecological protection, and construct an HQD evaluation index system accordingly, while fewer studies have constructed the evaluation index system of HQD based on the new development concept from the perspective of system balance; and (3) Most of the existing studies have used Analytic Hierarchy Process (AHP) and the entropy method to evaluate the current situation of the basin’s HQD level, but very few studies have conducted quantitative diagnostic studies on the obstacles to the basin’s HQD based on the evaluation of the HQD level. Therefore, the main research objectives of this paper include: (1) To build a comprehensive evaluation index system for HQD in the basin, based on the following five new development concepts of “innovative development, coordinated development, green development, open development and shared development” from the perspective of system balance, and to adopt the entropy TOPSIS model for the entire YRB as the research object; (2) Combining the entropy-weighted TOPSIS model and the obstacle factor diagnostic model. A diagnostic model of the obstacles to HQD in the basin is constructed to provide an in-depth analysis of the main obstacles to HQD in YRB and its provinces and regions based on evaluating the level of HQD with the aim of providing a basis for the formulation of strategies and policy adjustments for HQD in the basin, and each of its units in the future.
2. Study Area and Data
2.1. Study Area
The Yellow River is the second longest river in China, with a total length of about 5464 km, originating from the Tibetan Plateau and flowing from west to east through nine provinces and regions, including: Qinghai, Sichuan, Gansu, Ningxia, Inner Mongolia, Shanxi, Shaanxi, Henan and Shandong, before finally flowing into the Bohai Sea, with a basin area of 752,000 square kilometres (Figure 1). This paper uses the nine provinces and regions of YRB as the research object to conduct a study on measuring the level of HQD in the basin and to reveal the characteristics of the spatial and temporal patterns of the HQD level in the nine provinces and regions of the basin.
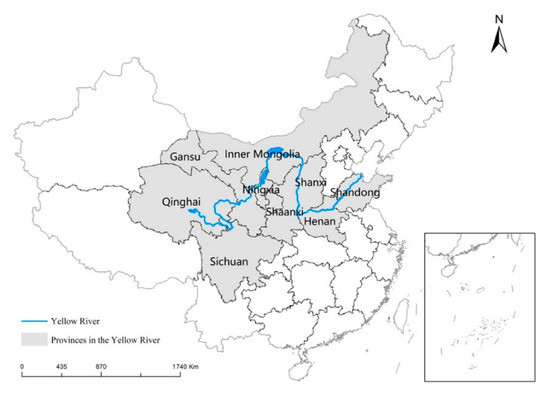
Figure 1.
Map of the study area.
2.2. Data Sources and Processing
The time range of this study is from 2010 to 2020. The data were mainly obtained from the 2011–2021 China Statistical Yearbook, China Science and Technology Statistical Yearbook, China Energy Statistical Yearbook and the statistical yearbooks of the provinces and regions in the basin. The data were processed and analyzed using Microsoft Excel 2018 and Geoda. The map was generated using ArcGIS 10.8.
3. Methodology
3.1. Connotation of HQD and Construction of Evaluation Index System
The report of the 19th National Congress put forward that “China’s economy has switched from the stage of high-speed growth to a stage of high-quality development” for the first time and gave more profound connotations to HQD in terms of common prosperity, targeted poverty reduction, livelihood development, balanced development in both urban and rural areas, and ecological civilisation in the new era. Scholars have also deepened their understanding of the connotations of HQD. For example, Shi Dan [36] believes that HQD is mainly reflected in stable and positive macroeconomic development, the continuous optimisation of industrial layout, the steady improvement of industrial efficiency and the continuous improvement of enterprise competitiveness and brand power; Li Wei [37] believes that HQD is mainly reflected in the six aspects of supply, demand, allocation, input and output, income distribution and economic circulation from the perspective of economics; and Tian Qiusheng et al. [38] believe that HQD is based on the concept of economic development with economic construction as the core and support, and is mainly reflected in the optimization of economic structures such as industrial structure, investment and consumption structure, the improvement of resource utilization efficiency, the minimization of environmental costs, and the improvement of people’s well-being brought about by economic growth. Thus, it can be seen that, as a new development concept, HQD does not only refer to the transformation of the economic development model, but also the transformation of economic and social development. It is also a new development model with quality and efficiency as its value orientation and a high degree of integration with the five new development philosophies of “innovation, coordination, green, openness and sharing”, which reflects the new development philosophy [2].
Innovation development is the “new engine” to promote HQD in the YRB, which requires increasing investment in innovation such as human resources and research and development (R&D) funds to enhance the level of innovation output in order to cultivate and strengthen the new momentum of regional economic development. Therefore, the innovative development of the YRB needs to continuously increase innovation investment such as human and financial resources to obtain more innovation output, replace old growth drivers with new ones, promote the quality and efficiency of traditional industries, actively cultivate emerging sectors of strategic importance, and build a modern industrial system that supports HQD. Coordinated development is an inherent requirement for promoting HQD in the YRB, and its core meaning is the comprehensive coordination of urban and rural development and regional coordinated development. On the one hand, we should pay more attention to the development of the countryside, achieve comprehensive and integrated urban and rural development, and gradually narrow the gap between urban and rural areas; on the other hand, the comparative advantages of different regions in the basin should be given full play. In addition, we should promote the integrated development pattern of upper, middle and lower reaches and gradually reverse the widening development gap between different provinces. Green development is the universal form of promoting HQD in the YRB, the core meaning of which requires that, based on ecological protection, the traditional extensive development model should be changed and that green, low-carbon and recycling should be core objectives. Furthermore, the industrial structure should be adjusted; the development mode should be changed; the consumption of resources and energy should be reduced; the production and emission of pollutants such as waste gas, wastewater and solid waste should be reduced; and the construction of an ecological civilisation should be the foremost motivator to increase the investment in environmental management. In addition, we will take the construction of ecological civilisation as a starting point, increasing investment in environmental management and winning the battle for “our skies blue, our waters clear, and our land pollution-free”. Open development is the only way to promote HQD of the YRB. The open development of the YRB requires giving full play to the respective advantages of connecting roads to the sea, taking the main transport routes as the backbone, improving the open channels, expanding the open platform, cultivating both inside and outside to build a new pattern of comprehensive opening to the outside world, and expanding and upgrading the level of openness to the outside world. Shared development is the fundamental purpose of HQD in the YRB, the core of which is to better benefit the people’s well-being by improving the quality and equalisation of basic public services such as education, healthcare, employment and social security, while also allowing all people to share in the ecological benefits of blue skies and clear water.
With the new development philosophy of “innovative development, coordinated development, green development, open development and shared development” as the guiding ideology and in accordance with the principles of comprehensiveness, systematicity and data accessibility, this paper constructs a system of indicators for measuring and evaluating the level of HQD in the YRB, including five sub-system layers, 11 element layers and 20 indicator layers (Table 1).

Table 1.
HQD Evaluation Indicator System.
3.2. Measuring the Level of HQD: The Entropy Weight TOPSIS Model
The TOPSIS model [39] was first proposed in 1981 by Hwang C.L and Yoon K.S. The basic principle of this method is to determine the superiority of a solution with the help of “positive ideal solutions” and “negative ideal solutions” of a multi-objective decision problem. It is often used in the fields of economics and management. In this paper, an improved TOPSIS (Technique for Order Preference by Similarity to Ideal Solution) model based on entropy weights is applied, namely the entropy weight TOPSIS model. The entropy weight TOPSIS model is an objective evaluation method that combines the entropy method and the TOPSIS model [40], a research method that first uses the entropy method to determine the weights of indicators and then uses the TOPSIS model to carry out the ranking of the strengths and weaknesses of evaluated objects. The method allows for the study of the distance between the evaluated object and the ‘ideal solution’, which when combined with the ‘ideal solution’ allows for better construction of an analytical model of the obstacle factors. Drawing on previous research [41], this paper uses the entropy weight TOPSIS model to measure the HQD level of nine provinces in the YRB from 2010 to 2020, with the following calculation process.
3.2.1. Construct the Original Matrix
Assuming that there are n measurement units and m measurement indicators, and xij represents the data value of the i-th indicator of the j-th measurement unit, the evaluation raw data matrix can be constructed (Equation (1)).
3.2.2. Indicator Weights Are Determined as Follows
1. Determine the ratio rij of the i-th indicator in the j-th cell.
2. Calculation of entropy values for each indicator.
where is the entropy value of the i-th indicator.
3. Calculation of weights for each indicator.
where is the weight of the i-th indicator.
3.2.3. Data Standardisation
As there are positive and negative indicators in the evaluation index, this paper adopts the extreme value method, i.e., Equations (5) and (6) to standardize original data so as to obtain the standardized data matrix .
3.2.4. Establish a Weighted Decision Matrix(WDM)
Construct a weight vector matrix W using the weights of each indicator and build a weighted decision matrix V by using Equation (7).
3.2.5. Determine the Ideal Solution
Determine the Positive Ideal Solution and the Negative Ideal Solution for the Indicator (Equations (8) and (9)).
3.2.6. Calculate the Distance
Calculate the distances and for each evaluation vector to and , respectively (Equations (10) and (11)).
3.2.7. Calculate the Nearness Degree
The nearness degree (i.e., the HQD index of this paper) indicates the nearness degree of each evaluation unit to the optimal situation, and its value ranges from 0 to 1 (Equation (12)). The higher the value, the higher the level of HQD, and vice versa.
3.3. Analysis of the Obstacle Factors Impeding HQD: The Obstacle Degree Analysis Model
The evaluation of HQD focuses not only on judging the quality of development but also on identifying the main obstacles that limit the improvement of HQD so that development strategies and measures can be targeted and adjusted. Therefore, this paper introduces the Obstacle Degree Analysis Model [42] based on the evaluation of HQD to diagnose and analyse the factors that affect the improvement of HQD in YRB. The obstacle analysis model is based on three variables: the contribution of the factor , the irrelevance of the factor and the obstacle of the factor (Equation (13)). Factor contribution indicates the extent to which the indicator i contributes to the study objectives, expressed as the indicator weight ; deviation indicates the difference between the actual value and the optimal value, expressed as the difference between 1 and the standardised value (); and obstacle indicates the degree of obstacle of the indicator i.
4. Measurement of Spatio-Temporal Differences in the Level of HQD in YRB
4.1. Spatio-Temporal Distribution Patterns of HQD Levels in YRB
Table 2 shows the results of the measured HQD index for each province and region in the YRB for three cross-sections of time: 2010, 2015 and 2020. The results show that the YRB’s HQD index was 0.4079, 0.4864 and 0.4924 in 2010, 2015 and 2020, respectively, and the average annual rate of change between 2010 and 2020 was 2.07%. This shows that YRB’s HQD index is on a rising trend and the level of HQD has been constantly improving. However, the average value of the YRB’s HQD index between 2010 and 2020 was only 0.4693, indicating that the overall level of HQD in the basin is relatively low and still has great potential for improvement. Further analysis shows that from 2010 to 2020, Shaanxi, Sichuan and Shandong provinces ranked in the top three in terms of HQD index, while Inner Mongolia, Shanxi and Qinghai ranked relatively low in terms of HQD index. In terms of temporal changes, as of 2020, Gansu and Sichuan provinces are relatively stable in the ranking of the nine provinces in the basin in terms of HQD level, with an up and down range of only one ranking, while Henan and Qinghai provinces have the most obvious fluctuations in their HQD level rankings, rising and falling by five rankings, respectively.
Table 2.
Dynamics of the HQD Index in YRB by province and region.
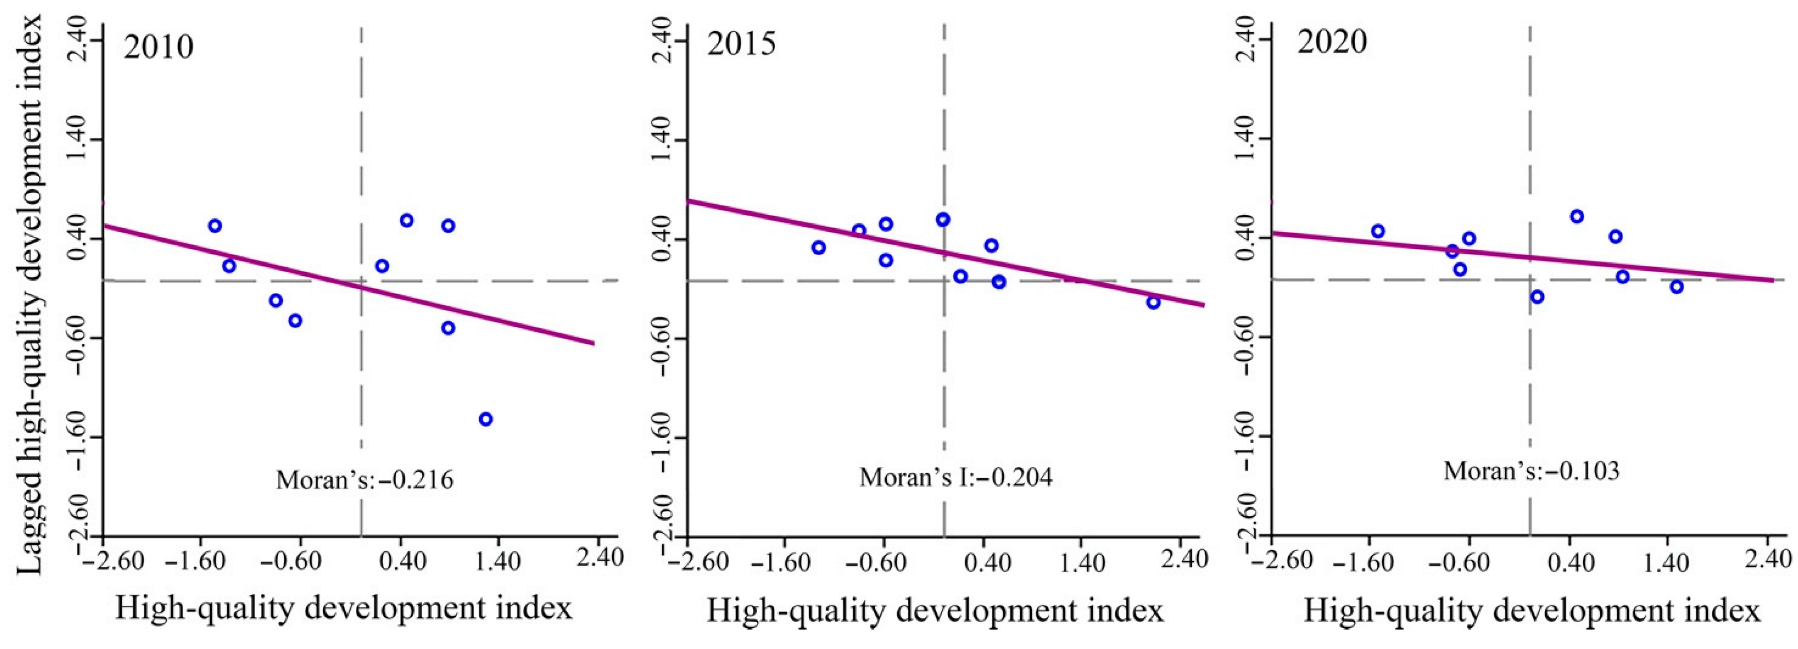
This paper uses Geoda to measure the global Moran’s I for YRB for the years 2010, 2015 and 2020. The global Moran’s I [43] measures the structural pattern and agglomeration (dispersion) of HQD in the YRB as a whole. The Moran’s I takes values between −1 and 1. If I > 0, it means that the level of HQD in the basin is positively correlated in space, i.e., HQD tends to be spatially aggregated and there is spatial spillover effect, while I < 0 means that the level of HQD is negatively correlated, i.e., HQD tends to be spatially dispersed. The results show that the global Moran’s I for 2010, 2015 and 2020 are −0.216, −0.204 and −0.103, respectively (Figure 2), indicating that there is a negative correlation between the level of HQD in neighbouring provinces in the YRB, i.e., the level of HQD tends to be spatially disperse. This differs from the positive correlation between the green development of the provinces in the Yangtze River Economic Belt as suggested by Cai Shaohong et al. [44] The negative correlation between the levels of HQD in neighbouring provinces in the YRB also indicates that there is no obvious spatial spillover effect of HQD between different provinces, i.e., the radiative diffusion effect of provinces with higher levels of HQD is missing.
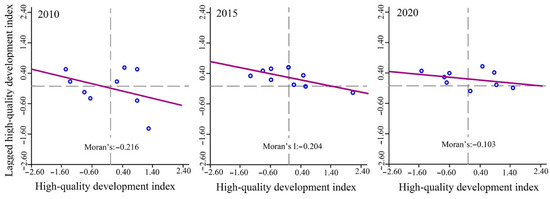
Figure 2.
Moran’s I scatter plot of YRB’s HQD Index for 2010, 2015 and 2020.
In addition, this paper introduces the coefficient of variation [45] to calculate the standard deviation rate of the HQD index for each province and region in the YRB to characterise the difference in the level of HQD among the provinces within the YRB. The results show that the coefficient of variation of the YRB’s HQD index in 2010, 2015 and 2020 are 0.2250, 0.2637 and 0.3340, respectively, showing an increasing trend, indicating that the spatial “polarisation” effect of the HQD level of each province and region within the YRB is obvious. This means that the gap between the levels of HQD in each province and region is widening and developing in the direction of spatial unevenness. This may be due to the fact that the process of HQD is a dynamic transformation from “total expansion” to “structural optimization” and from “quantitative change” to “qualitative change”. For provinces and regions with a high level of economic development, the basic conditions for changing the growth mode, switching the growth momentum and improving the development efficiency are better, and the speed of upgrading the level of HQD is greater, while for provinces with a relatively low level of economic development, it is more difficult to change the traditional extensive development model in the short term, and there is even the possibility and need for crude expansion. For example, in the context of the battle against pollution and the industrial transfer inland, some provinces in the middle and upper reaches of the basin with lower levels of economic development have taken on a large number of low- and medium-end industries from developed eastern regions [4], which will seriously hinder the upgrading of their HQD levels.
4.2. Distribution Pattern of Subsystems for HQD in YRB
Table 3 shows that the HQD Subsystem Index in the YRB shows a trend of “Coordinated Development (0.5566) > Shared Development (0.5155) > Green Development (0.4482) > Open Development (0.3535) > Innovative Development (0.3113)”, indicating that the contribution of each system differs significantly in its overall contribution to the HQD of the basin, and the spatial pattern of development status of each subsystem shows the following characteristics.
Table 3.
Sub-indices of high-quality development in YRB and its provinces.
- The level of innovation development is “low overall and unipolar”.
The 2010–2020 innovation development index of the YRB is only 0.3113, indicating an overall low level of innovation development in the YRB. However, thanks to its advantages in high-tech industries and human resources, as well as its research base in aerospace equipment, integrated circuits and agricultural and forestry technologies [18], Shaanxi Province has a higher innovation development index of 0.7839, which is twice as high as Shandong in second place and nearly seven times as high as Ningxia in ninth place, with a clear “unipolar” effect on innovation development in the basin. The “unipolar” effect of innovation development in the basin is obvious.
- 2.
- The level of coordinated development shows a pattern of “convergence in the middle and lower reaches, collapse in the upper reaches”.
In 2010–2020, the coordinated development index of the YRB is 0.5566, and the high-quality development index of Henan, Shandong, Shanxi and Shaanxi provinces in the middle and lower reaches of YRB ranges from 0.6330 to 0.9266, with relatively small differences between provinces. However, in the upper reaches of the Yellow River, Gansu, Qinghai and Ningxia provinces only have a coordinated development index of 0.1026, 0.1326 and 0.3734, respectively, showing a “collapse” pattern in the upper reaches.
- 3.
- The overall level of green development is low, and the phenomenon of “backwardness” is obvious in Qinghai Province.
The Green Development Index of the YRB from 2010 to 2020 is only 0.4482, which indicates that the overall ecological and environmental management pressure in the basin is still high, especially as the Green Development Index of Qinghai Province is only 0.2576, and the level of green development is decreasing, indicating that the extensive and extensional development of Qinghai Province. This is mainly characterised by “high pollution and high emission”, which still intensifying. For example, the amount of industrial solid waste generated in Qinghai Province in 2020 (157.24 million tons) is 8.77 times that generated in 2010, and is continuously and rapidly increasing.
- 4.
- The shortcomings of open development are prominent, and its leading role is insufficient.
Shandong Province, relying on its coastal location, open cities and the construction of “One Belt, One Road” [15] has become the “leader” of the open development of YRB, with a relatively high open development index (0.5558). However, the overall open development index of the basin during the study period was only 0.3535, and the shortcomings of open development are still prominent. In the future, the provinces in the basin should take “the Belt and Road” construction as an opportunity to further expand the construction of freight railways, high-speed railways and motorway networks, improve the transportation network system, enhance the economic links between the leading region of Shandong and the hinterland provinces in the basin, and take full advantage of the “Belt and Road” construction.
- 5.
- Economic development deviates from people’s well-being.
Shandong and Henan provinces in the lower reaches of the YRB are relatively economically developed, but their Shared Development Index is low, at 0.0808 and 0.2068, respectively, while Qinghai, Gansu and Ningxia in the upper reaches have lower levels of economic development, but their Shared Development Index is higher, at 0.9161, 0.8688 and 0.6830, respectively, indicating that the fruits of economic development in the basin have not effectively benefited people’s livelihoods, and even seriously constrained the enhancement of people’s well-being. For example, in Shandong and Henan provinces in the middle and lower reaches of the basin, the long-term “high-input, high-consumption, high-pollution” model of rough and resource-dependent development has brought about rapid economic growth. However, environmental pollution has become increasingly serious, especially air pollution, which has become a high-value area of pollution in the river basin and the country as a whole [46]. Atmospheric pollution has become an important factor limiting the improvement of livelihoods and well-being.
5. Measuring the Obstacles to HQD in YRB
5.1. Obstacle Analysis in Sub-System Level
Table 4 shows the differences in the degree of obstacles to HQD in the YRB across the five subsystems. Among them, the degree of obstacles to green development is 38.37% during the 2010–2020 period, indicating that the low level of green development is the biggest barrier to HQD in the basin. The obstacles to innovative development and open development are 32.53% and 24.02%, respectively, making them the main bottlenecks to HQD in the basin. The obstacles to shared development and coordinated development are smaller, at 2.85% and 2.02%, respectively. Therefore, the continuous promotion of green development, innovation and open development will be an important “grip” for the quality development of the basin in the future. In terms of development trends, there are some differences in the trends of constraints on HQD of the basin in different subsystems. In particular, the overall trend of obstacles to innovation and openness in the basin from 2010 to 2020 is decreasing, which may be related to the implementation of the innovation-driven development strategy in all provinces since the 18th National Congress and the active integration into “the Belt and Road” construction. However, the degree of obstacles to green development in the basin is on the rise, which may be related to the increasing pressure on green development in some provinces in the middle and upper reaches of the Yellow River (e.g., Shanxi, Qinghai and Ningxia) due to their own weak foundation for development and the transfer of low-end and middle-range industries.
Table 4.
Obstacles to HQD in YRB in five major subsystems.
In terms of regional differences (Table 5), for the green development subsystem, Shaanxi, Shandong and Henan provinces have the highest obstacle degrees, at 41.96%, 41.39% and 39.29%, respectively, indicating that the cost of resource use and ecological environment for economic development in this category remains high. This is also consistent with the serious air pollution situation in the three provinces. For the innovation subsystem, Shaanxi Province has a relatively small degree of obstruction in the innovation development subsystem from 2010 to 2020, at 20.08%, while Ningxia has the highest degree of obstruction in the innovation development subsystem, at 35.16%. This is consistent with Shaanxi and Ningxia being the provinces with the highest and lowest innovation development indexes in the basin, respectively. For the openness subsystem, Shandong Province, with its advantages of coastal ports and regional resources [18], ranks first of the nine provinces in the basin in terms of foreign trade dependency and foreign investment as a proportion of regional GDP, and becomes the province with the lowest obstacle to open development in the basin, with an obstacle degree of 22.19%. The obstacle degree of the shared and coordinated development subsystems is lower overall, and the inter-provincial differences are smaller.
Table 5.
Obstacles degrees of the five major subsystems of HQD in the basin’s provinces.
5.2. Obstacle Analysis in Indicator Level
Table 6 shows the top eight obstacles to HQD in different provinces and their obstacle degrees. The results show that the sum of the obstacle degrees of the top eight obstacle factors in each province ranges from 71.37% to 73.55%. Although there are differences in the ranking of the obstacles among the provinces in the basin, they all focus on indicators such as the proportion of technology market turnover to GDP (C4), solid waste generation per 10,000 Yuan GDP (C12), the proportion of total import and export to GDP (C17), water consumption per 10,000 Yuan GDP (C9), and the number of people employed in the aviation industry per 10,000 people (C14). Further analysis shows that the number of patent applications per 10,000 people and the technology market turnover per 10,000 people in the basin in 2020 are 21.88 and 3,356,700, respectively, accounting for only 58.86% and 60.63% of the national average, respectively. Additionally, the per capita foreign trade import and export of the basin is 0.69 million yuan, accounting for only 28.99% of the national average (23,900 yuan). However, the amount of solid waste generated and emissions per unit of GDP in the basin are 4.08 times and 2.70 times higher than the national average. The results show that the low level of scientific and technological innovation and transformation, serious resource consumption, low resource utilisation and a low level of openness to the outside world are becoming key factors hindering HQD of the basin’s provinces.
Table 6.
The top 8 obstacles to HQD in different provinces of YRB and their obstacle degrees.
6. Conclusions
This paper constructs an HQD measurement and evaluation index system based on the new development philosophy and uses the data of nine provinces in the YRB from 2010 to 2020 as samples, combined with the entropy-weighted TOPSIS model and the obstacle degree analysis model to carry out the measurement of spatio-temporal differences in HQD and diagnostic analysis of obstacle factors in the basin. The main findings are as follows:
- In 2010, 2015 and 2020, the YRB’s HQD index was 0.4079, 0.4864 and 0.4924, respectively, indicating that the overall level of HQD in the YRB is on an upward trend; the average value of the YRB’s HQD index from 2010 to 2020 was only 0.4693, indicating that the overall level of HQD in the basin is relatively low and there is still much room for improvement.
- The global Moran’s I for HQD index in 2010, 2015 and 2020 are −0.216, −0.204 and −0.103, respectively, indicating that the HQD of provinces and regions within the YRB is discrete, and the gap between the HQD of provinces and regions within the basin is on a widening trend towards spatial non-equilibrium, which indicates that the task of promoting the coordinated and balanced development of all provinces and regions will be daunting in the future.
- The obstacles of green development, innovative development and open development to the HQD of the YRB during 2010–2020 are 38.37%, 32.53% and 24.02%, respectively, indicating that green development, innovative development and open development are the main bottlenecks limiting HQD in the basin, especially the increasing trend of the constraint of green development.
7. Limitations and Prospects
This paper reveals the spatio-temporal patterns of the HQD level of the nine provinces and regions in the YRB and the characteristics of their main obstacle factors through the measurement of the level of HQD and the diagnostic analysis of the obstacle factors. This provides a reference basis for the adjustment and formulation of HQD policies in the nine provinces and regions in the Basin in the future. However, the resource endowment conditions and advantages of each province and region in the basin are also important factors affecting the choice of the path of HQD in the basin. How to fully consider the resource endowment conditions and the characteristics of the obstacles to HQD in each province and region in the basin; to give full play to their comparative advantages as a starting point; to break through the key constraints and bottlenecks as a basis; to reasonably formulate and adjust HQD policies; to build a characteristic industrial system, energy system, ecological governance system, open system, etc.; and to actively explore the new path of characteristic HQD in different provinces and regions in the basin will be an important research direction in the future. This is also the main limitation of this paper.
Author Contributions
Data curation, Y.C.; Funding acquisition, X.Y.; Writing—original draft, Z.F. and X.Y.; Writing—review & editing, Z.F. and X.Y. All authors have read and agreed to the published version of the manuscript.
Funding
This research was funded by the National Social Science Fund of China grant number 20BJY043. And the APC was also funded by the National Social Science Fund of China (Grant No. 20BJY043).
Data Availability Statement
The original data were mainly obtained from the 2011–2021 China Statistical Yearbook, China Science and Technology Statistical Yearbook, China Energy Statistical Yearbook and the statistical yearbooks of the provinces and regions in the YRB basin. The original data to this article can be found online at http://www.stats.gov.cn (accessed on 3 September 2022).
Conflicts of Interest
The authors declare that they have no known competing financial interests or personal relationships that could have appeared to influence the work reported in this paper.
References
- Jin, B. Study on the “High-Quality Development” economics. China Ind. Econ. 2018, 1, 5–18. [Google Scholar]
- Zhao, J.; Shi, D.; Deng, Z. A framework of china’s high-quality economic development. Res. Econ. Manag. 2019, 40, 15–31. [Google Scholar]
- Yang, K.; Dong, Y. Research on restricting factors and countermeasures of ecological protection and high-quality development of yellow river basin—Analysis based on the multi-dimensional framework of "element-space-time". J. Hydraul. Eng. 2020, 51, 1038–1047. [Google Scholar]
- Li, L.; Zhao, H.; Guo, F.; Wang, Y. High-quality development spatio-temporal evolution of industry in urban agglomeration of the yellow river basin. Sci. Geogr. Sin. 2021, 41, 1751–1762. [Google Scholar]
- Tang, J.; Ding, W.; Li, W.; Liu, X. Study on evaluation of water resources carrying capacity and obstacle factors in the yellow river. basin. Yellow River 2021, 43, 73–77. [Google Scholar]
- Li, J.; Zhang, J. Soil erosion remains an important ecological issue in the yellow river basin. China Sci. Dly. 2021, 11, 18. [Google Scholar]
- Ren, B.; Dou, Y. Restrictive factors and path of industrial structure adjustment in the yellow river basin under the goal of carbon neutralization. Inn. Mong. Soc. Sci. 2022, 43, 121–127. [Google Scholar]
- Deng, X.; Yang, K.; Shan, J.; Dong, S.; Zhang, W.; Guo, R.; Tan, M.; Zhao, P.; Li, Y.; Miao, C.; et al. Urban agglomeration and industrial transformation and development in the yellow river basin. J. Nat. Resour. 2021, 36, 273–289. [Google Scholar] [CrossRef]
- Xu, Y.; Zhang, X.; Yang, L. Evaluation of urban competitiveness in the yellow river basin and its spatial and temporal evolution. North. Econ. 2020, 9, 49–52. [Google Scholar]
- Zhang, C.; Song, X.; Sun, Y. Measurement of efficiency difference, source decomposition and formation mechanism of scientific and. technological innovation in the yellow river basin. Rev. Econ. Manag. 2021, 37, 38–50. [Google Scholar]
- Qiao, J.; Zhu, Q.; Xin, X. Spatial characteristics and influencing factors of rural poverty in the yellow river basin. Resour. Sci. 2020, 42, 184–196. [Google Scholar] [CrossRef]
- Wang, Z. Factors influencing the speed of economic development and its contemporary implications. Theory J. 2017, 6, 81–88. [Google Scholar]
- Niu, L. Evaluation of Regional Economic Development Efficiency in Guangdong-Hong Kong-Macao Greater Bay Area of China; Graduate School of Chinese Academy of Social Sciences (GSCASS): Beijing, China, 2021. [Google Scholar] [CrossRef]
- Han, Z.; Deng, Q.; Li, Z. A study on the dynamics of economic development differences in the Greater Bay Area of Guangdong, Hong Kong and Macau. Stat. Decis. 2021, 37, 118–122. [Google Scholar]
- Ma, J.; Liu, Y.; Wang, Y. Spatial pattern and network structure characteristics of high-quality development in the yellow river basin. Stat. Decis. 2021, 37, 125–128. [Google Scholar]
- Ren, B. The specificity of high-quality development in the Yellow River Basin and its model options. J. Humanit. 2020, 1, 1–4. [Google Scholar]
- Shi, B.; Zhang, B. The new Era, new Momentum, and new Economy—Analyzing the current high quality develpment of China’s economy. Shanghai J. Econ. 2018, 5, 25–33. [Google Scholar]
- Zhang, H.; Wang, Y.; Wang, Y. Measurement and improvement of high quality development level in yellow river basin. Reg. Econ. Rev. 2020, 4, 8–22. [Google Scholar]
- Xu, P.; Yang, P. Opening-up, total factor productivity and high-quality development. Reform Econ. Syst. 2019, 37, 32–38. [Google Scholar]
- Zhu, Y.; Lan, H.; Peng, J.; Li, J.; Zhang, P.; Zhang, P.; Zhu, X.; Zhang, Y.; Liu, X.; Gu, T.; et al. Research progress of water-soil disaster mechanism and disaster chain effect in the middle reaches of the yellow river basin. Yellow River 2021, 43, 108–116+147. [Google Scholar]
- Zhang, Z.; Feng, D.; Hou, Y. Study on drought characteristics in yellow river basin based on copula function. J. Arid. Land Resour. Environ. 2022, 36, 66–72. [Google Scholar]
- Yang, J.; Xie, B.; Zhang, D. Spatial-temporal heterogeneity of ecosystem services trade-off synergy in the yellow river basin. J. Desert Res. 2021, 41, 78–87. [Google Scholar]
- Zhen, W.; Chen, S. Study on the spatial variability and convergence of economies in the yellow river basin—Analysis based on economic data of counties in nine provinces. Price Theory Pract. 2021, 5, 189–192+196. [Google Scholar]
- Wang, Q. Research on Spatial-Temporal Evolution and Influencing Factors of Medical Resources in the Yellow River Basin; Northwest Normal University: Lanzhou, China, 2021. [Google Scholar] [CrossRef]
- Zhu, N.; Ren, B. Research on the long-term mechanism for high-quality poverty alleviation in the yellow river basin under ecological. constraints. Shandong Soc. Sci. 2022, 1, 39–48. [Google Scholar]
- Liu, L.; Liang, L.; Gao, P.; Fan, C.; Wang, H.; Wang, H. Coupling relationship and interactive response between ecological protection and high-quality development in the yellow river basin. J. Nat. Resour. 2021, 36, 176–195. [Google Scholar] [CrossRef]
- Wen, Y.; Li, X.; Liu, S. High-quality development of the yellow river basin from the perspectives of comparative advantage and development path. Reg. Econ. Rev. 2021, 2, 70–82. [Google Scholar]
- Chen, Y.; Zhang, K.; Chen, X.; Liao, Y.; Song, B.; Huang, H.; Wang, X. Ecological conservation and high-quality development in the yellow river basin. Reg. Econ. Rev. 2020, 1, 8–22. [Google Scholar]
- Li, F.; Miao, Q. Spatial network characteristics of the coupling of urban ecological conservation and high-quality economic development in the yellow river basin. Stat. Decis. 2022, 5, 80–84. [Google Scholar]
- Wang, A. Guided by the sixteen-character water governance concepts, to accelerate new stage high-quality water development in the yellow river basin. Yellow River 2022, 44, 1–4. [Google Scholar]
- Jing, L.; Feng, Y. Measurement and coupling coordination analysis of agricultural green development level in the yellow river basin. J. Cent. South Univ. For. Technol. (Soc. Sci.) 2021, 15, 31–38+52. [Google Scholar]
- Xu, H.; Shi, N.; Wu, L.; Zhang, D. High-quality development level and its spatiotemporal changes in the Yellow River Basin. Resour. Sci. 2020, 42, 115–126. [Google Scholar] [CrossRef]
- Yu, J.; Liu, Y. Evaluation of tourism development potential and high-quality development countermeasures in Shandong section of the Yellow River Basin. E3S Web Conf. 2021, 251. [Google Scholar]
- Zhang, G.; Su, Z. Construction and measurement of high-quality development evaluation system for the central cities in the Yellow River Basin. Ecol. Econ. 2020, 36, 37–43. [Google Scholar]
- Chen, Y.; Miao, Q.; Zhou, Q. Spatiotemporal differentiation and driving force analysis of the high-quality development of urban agglomerations along the Yellow River Basin. Int. J. Environ. Res. Public Health 2022, 19. [Google Scholar]
- Shi, D.; Zhao, J.; Deng, Z. Mechanisms for change and policy measures to promote high-quality development. Res. Financ. Econ. Issues 2018, 9, 19–27. [Google Scholar]
- Li, W. Five relationships to manage for high-quality development. Econ. Dly. 2018, 2, 22. [Google Scholar]
- Tian, Q. Theoretical connotation and practical requirements for high-quality development. J. Shandong Univ. (Philos. Soc. Sci.) 2018, 6, 1–8. [Google Scholar]
- Hwang, C.L.; Yoon, K.S. Multiple Attribute Decision Making; Springer: Berlin/Heidelberg, Germany, 1981; pp. 1–50. [Google Scholar]
- Wang, J.; Li, J.; Wei, H.; Tian, P. The forecast evaluation of water resources carrying capacity of regional water resources based on TOPSIS model—A case study of Guanzhong region in Shaanxi province. Res. Soil Water Conserv. 2008, 3, 161–163. [Google Scholar]
- Wu, C.; Zhu, B. An evaluation of innovative city based on the entropy-weight topsis method and diagnosis of its obstacle indicators: A case study of Putian city. Sci. Technol. Manag. Res. 2015, 35, 76–81. [Google Scholar]
- Gao, S.; Sun, H.; Liu, W. Vulnerability assessment and obstacle degree analysis of marine economic system based on entropy weight topsis model. Ecol. Econ. 2021, 37, 77–83. [Google Scholar]
- Tobler, W.R. A computer movie simulating urban growth in the detroit region. Econ. Geogr. 1970, 46, 234–240. [Google Scholar] [CrossRef]
- Cai, S.; Gu, C.; Zhang, Z. Research on green development level measurement and spatiotemporal evolution characteristics of the yangtze river economic belt. East China Econ. Manag. 2021, 35, 25–34. [Google Scholar]
- Hou, L. Research on Spatial and Temporal Disparity of Quality of Tourism Economic Development in China; Anhui University: Hefei, China, 2016; Available online: https://kns.cnki.net/KCMS/detail/detail.aspx?dbname=CMFD201602&filename=1016137269.nh (accessed on 3 September 2022).
- Wang, M.; Feng, X.; Du, X.; Zhao, M.; Liang, Q. Spatial-temporal distribution of air quality and its influencing factors in the yellow river basin. Environ. Prot. 2019, 47, 56–61. [Google Scholar]

Publisher’s Note: MDPI stays neutral with regard to jurisdictional claims in published maps and institutional affiliations. |
© 2022 by the authors. Licensee MDPI, Basel, Switzerland. This article is an open access article distributed under the terms and conditions of the Creative Commons Attribution (CC BY) license (https://creativecommons.org/licenses/by/4.0/).