

Smart Wireless Particulate Matter Sensor Node for IoT-Based Strategic Monitoring Tool of Indoor COVID-19 Infection Risk via Airborne Transmission


Abstract
:1. Introduction
2. Materials and Methods
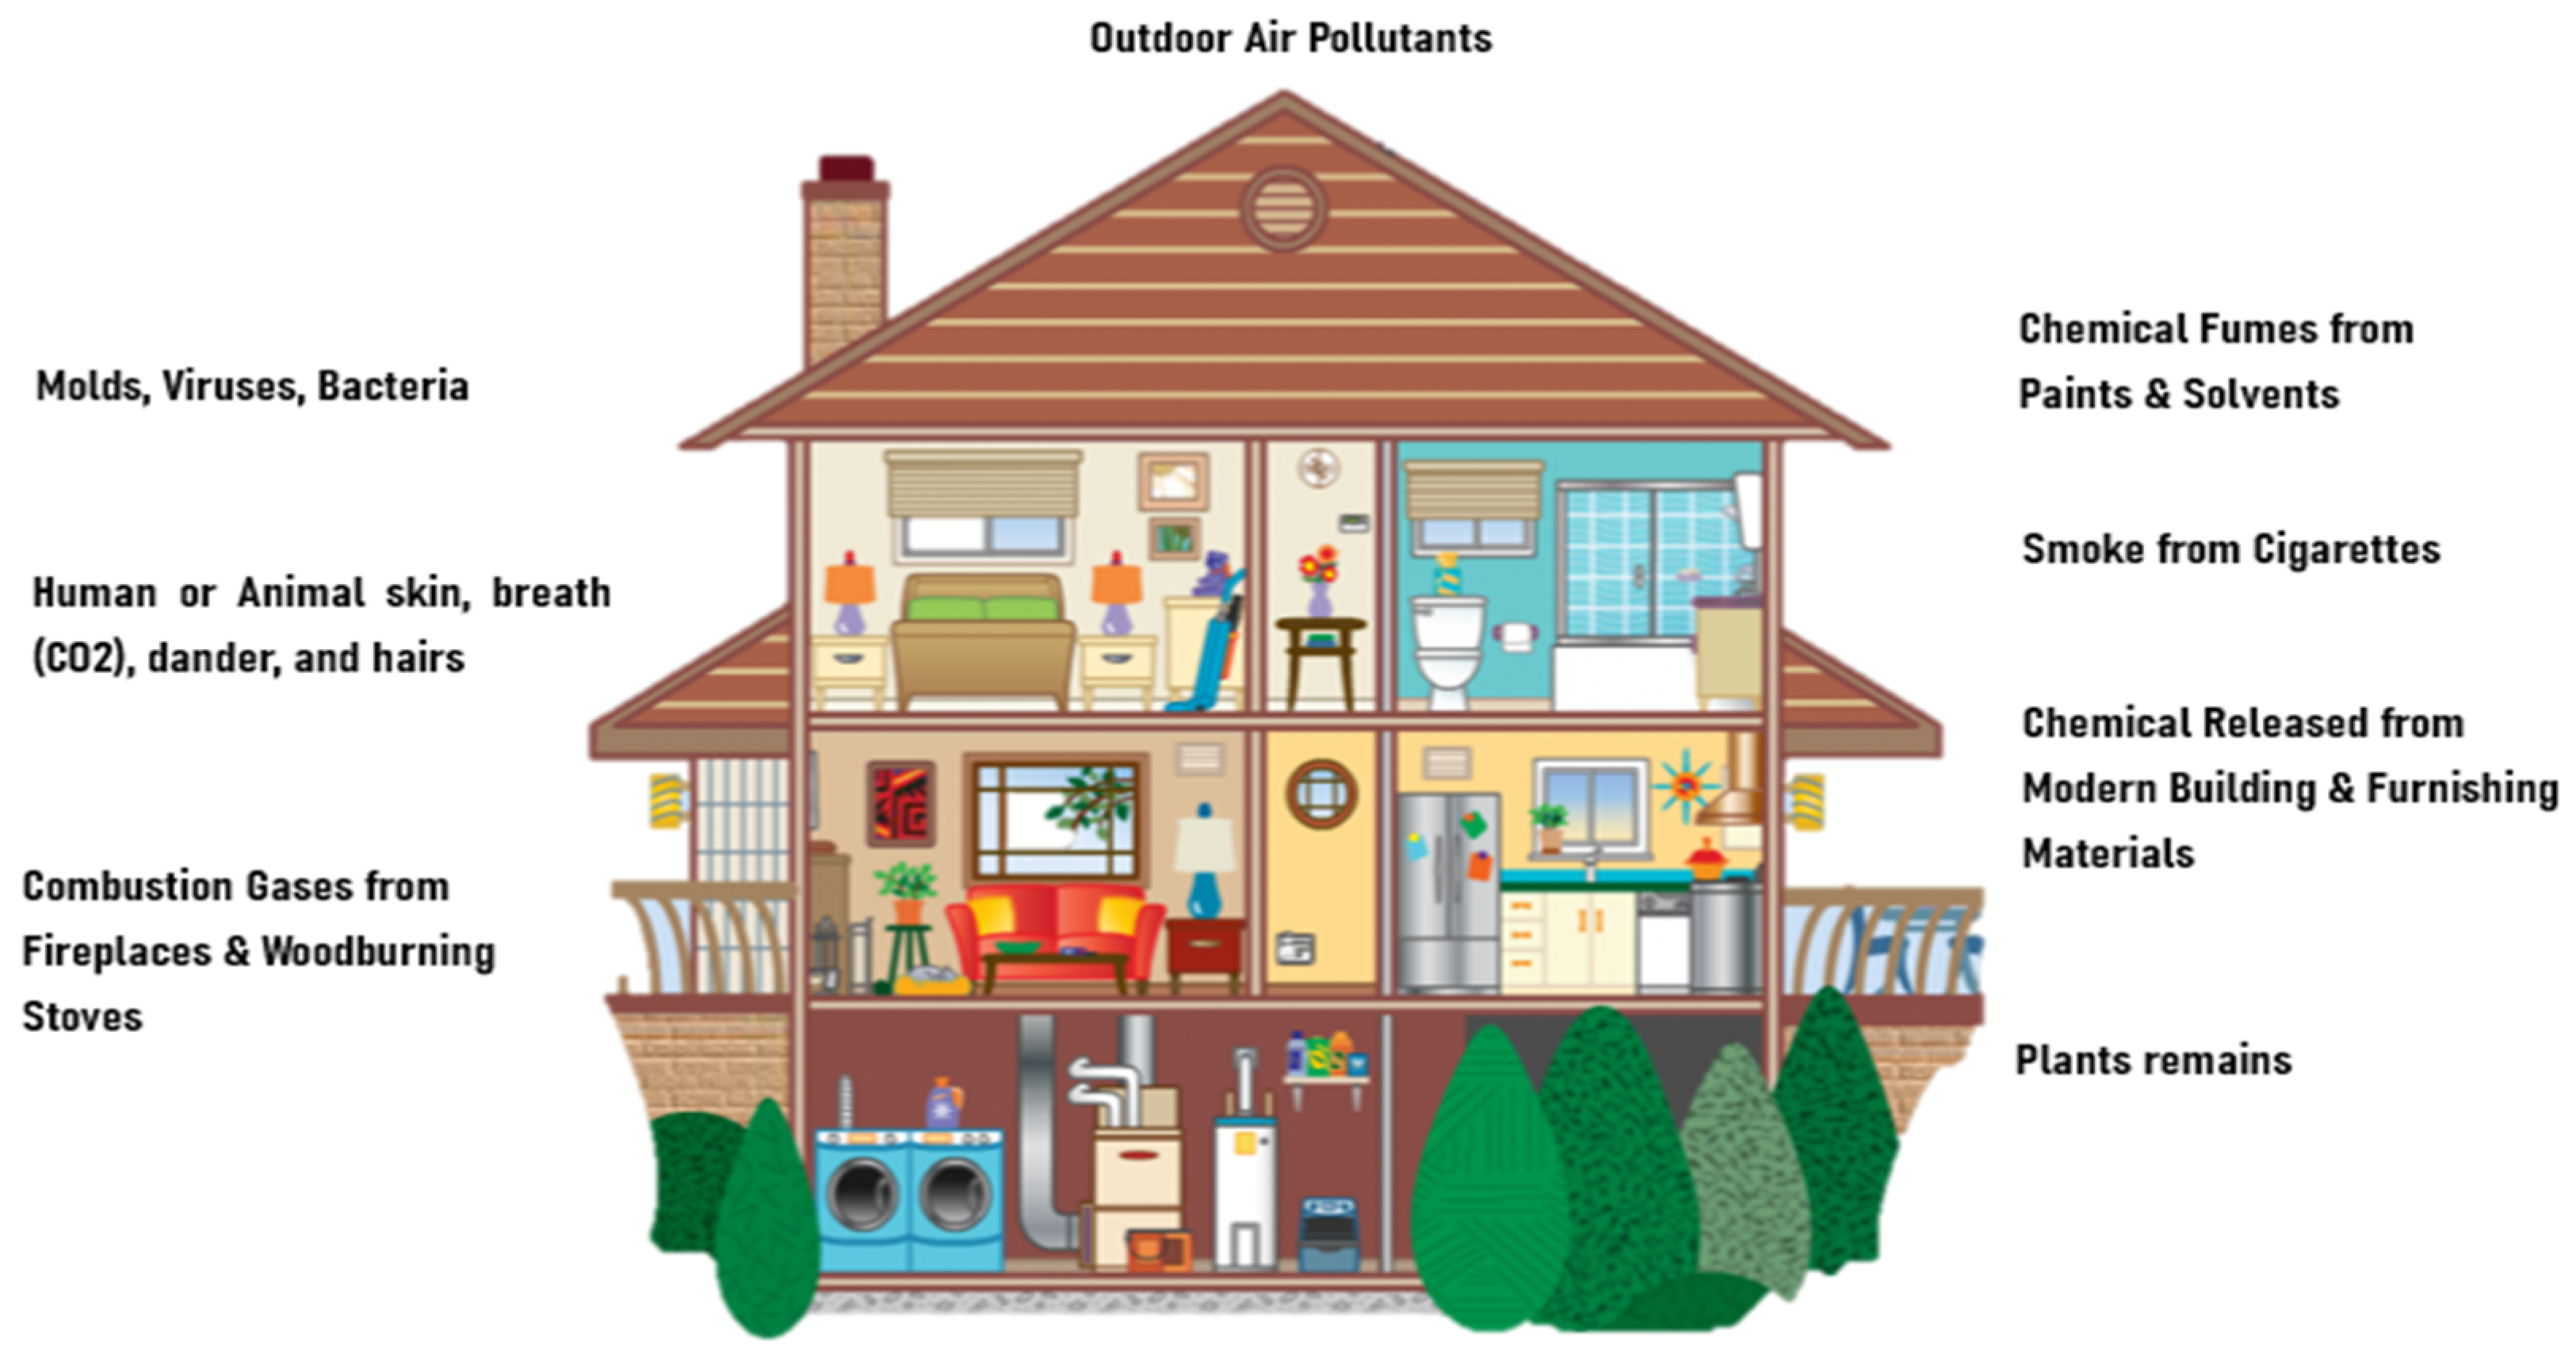
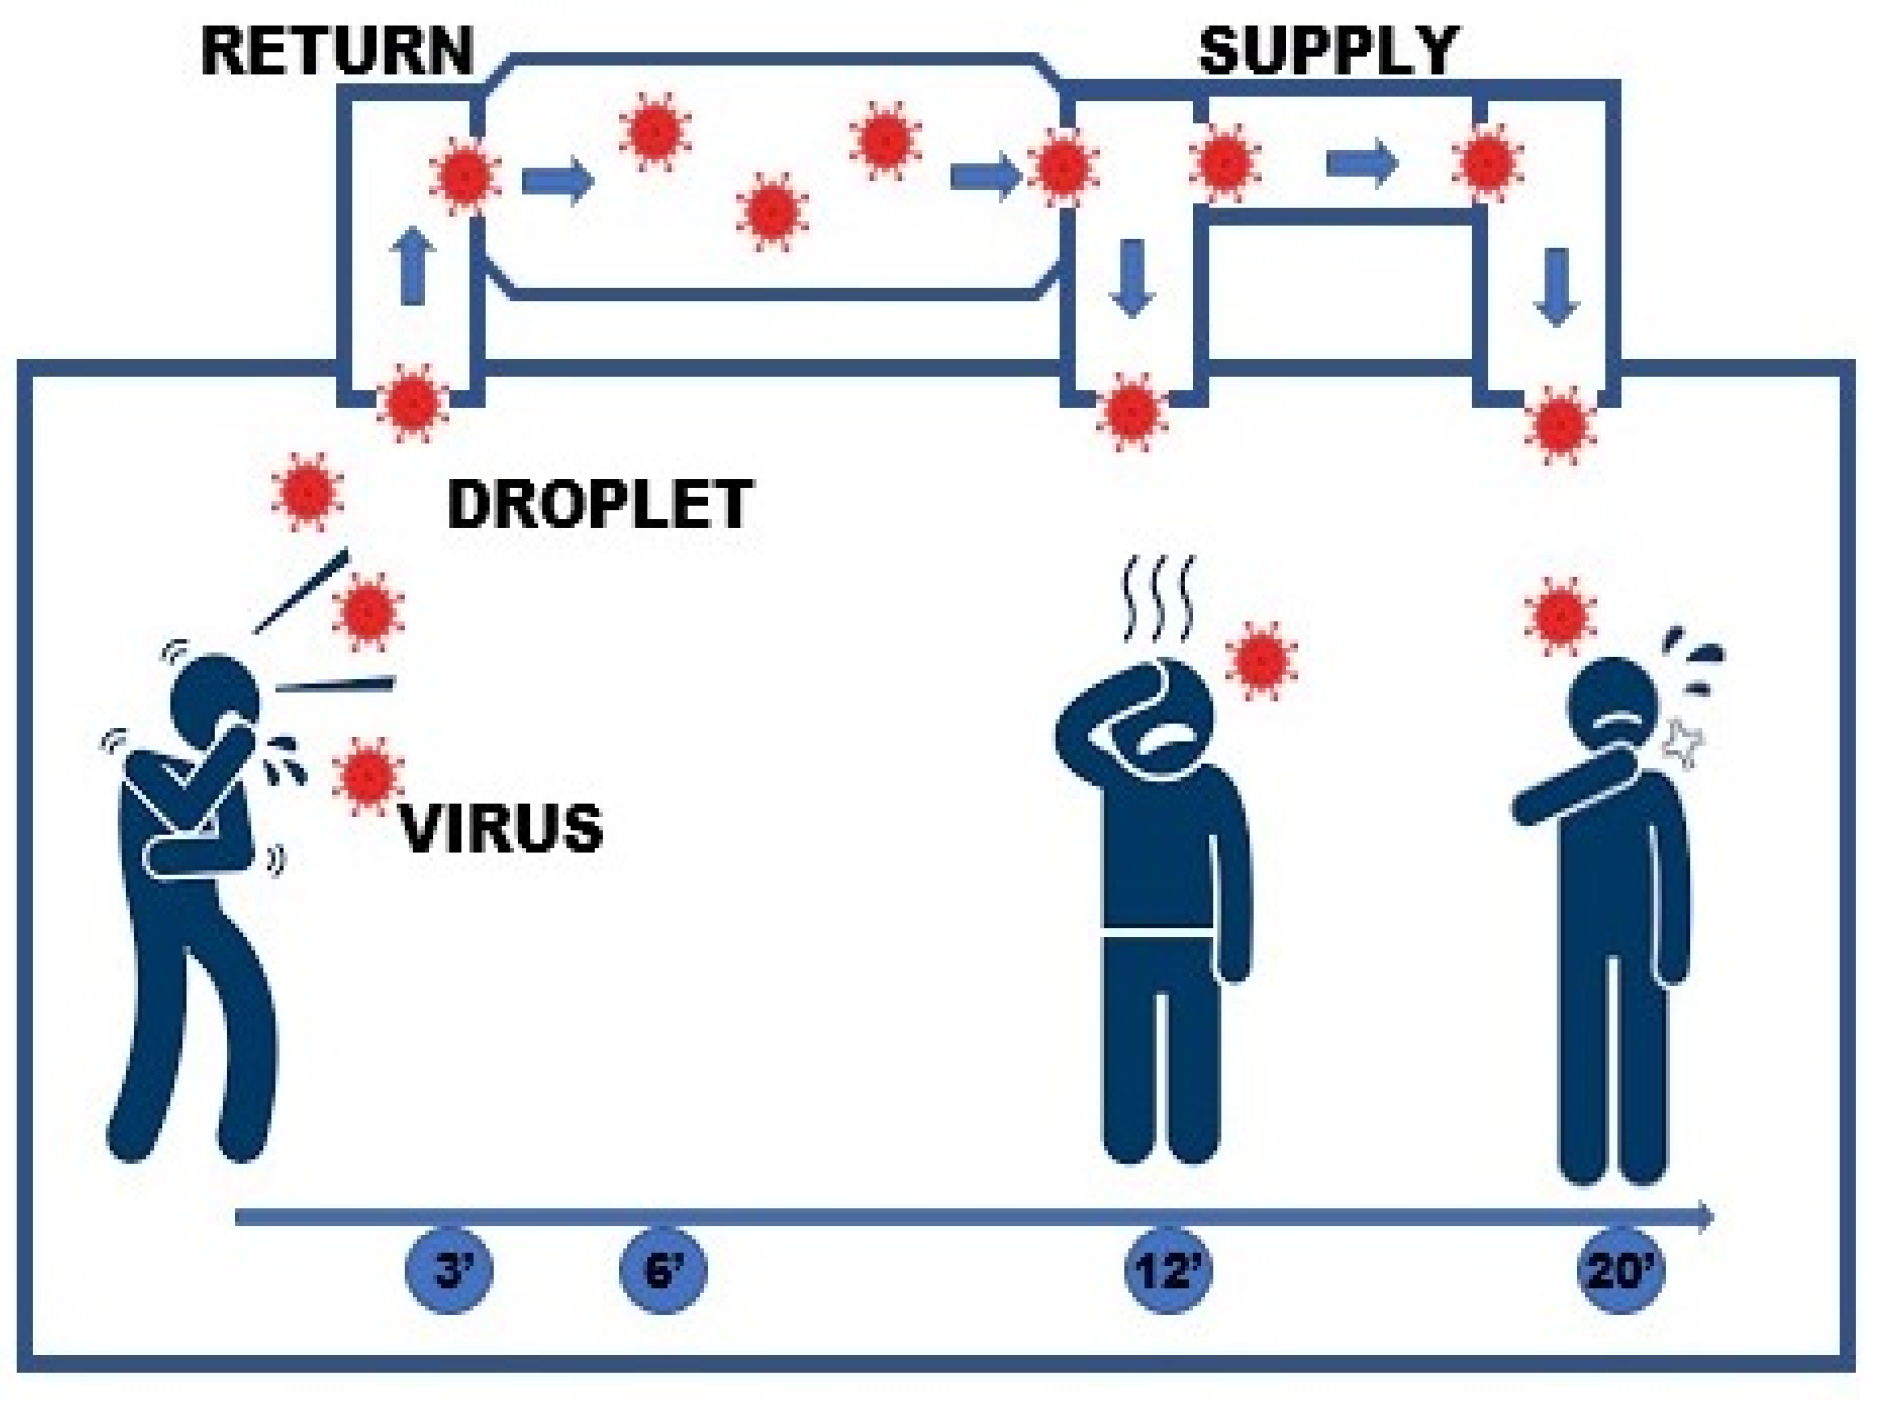
2.1. COVID-19 Infection Indoor Transmission
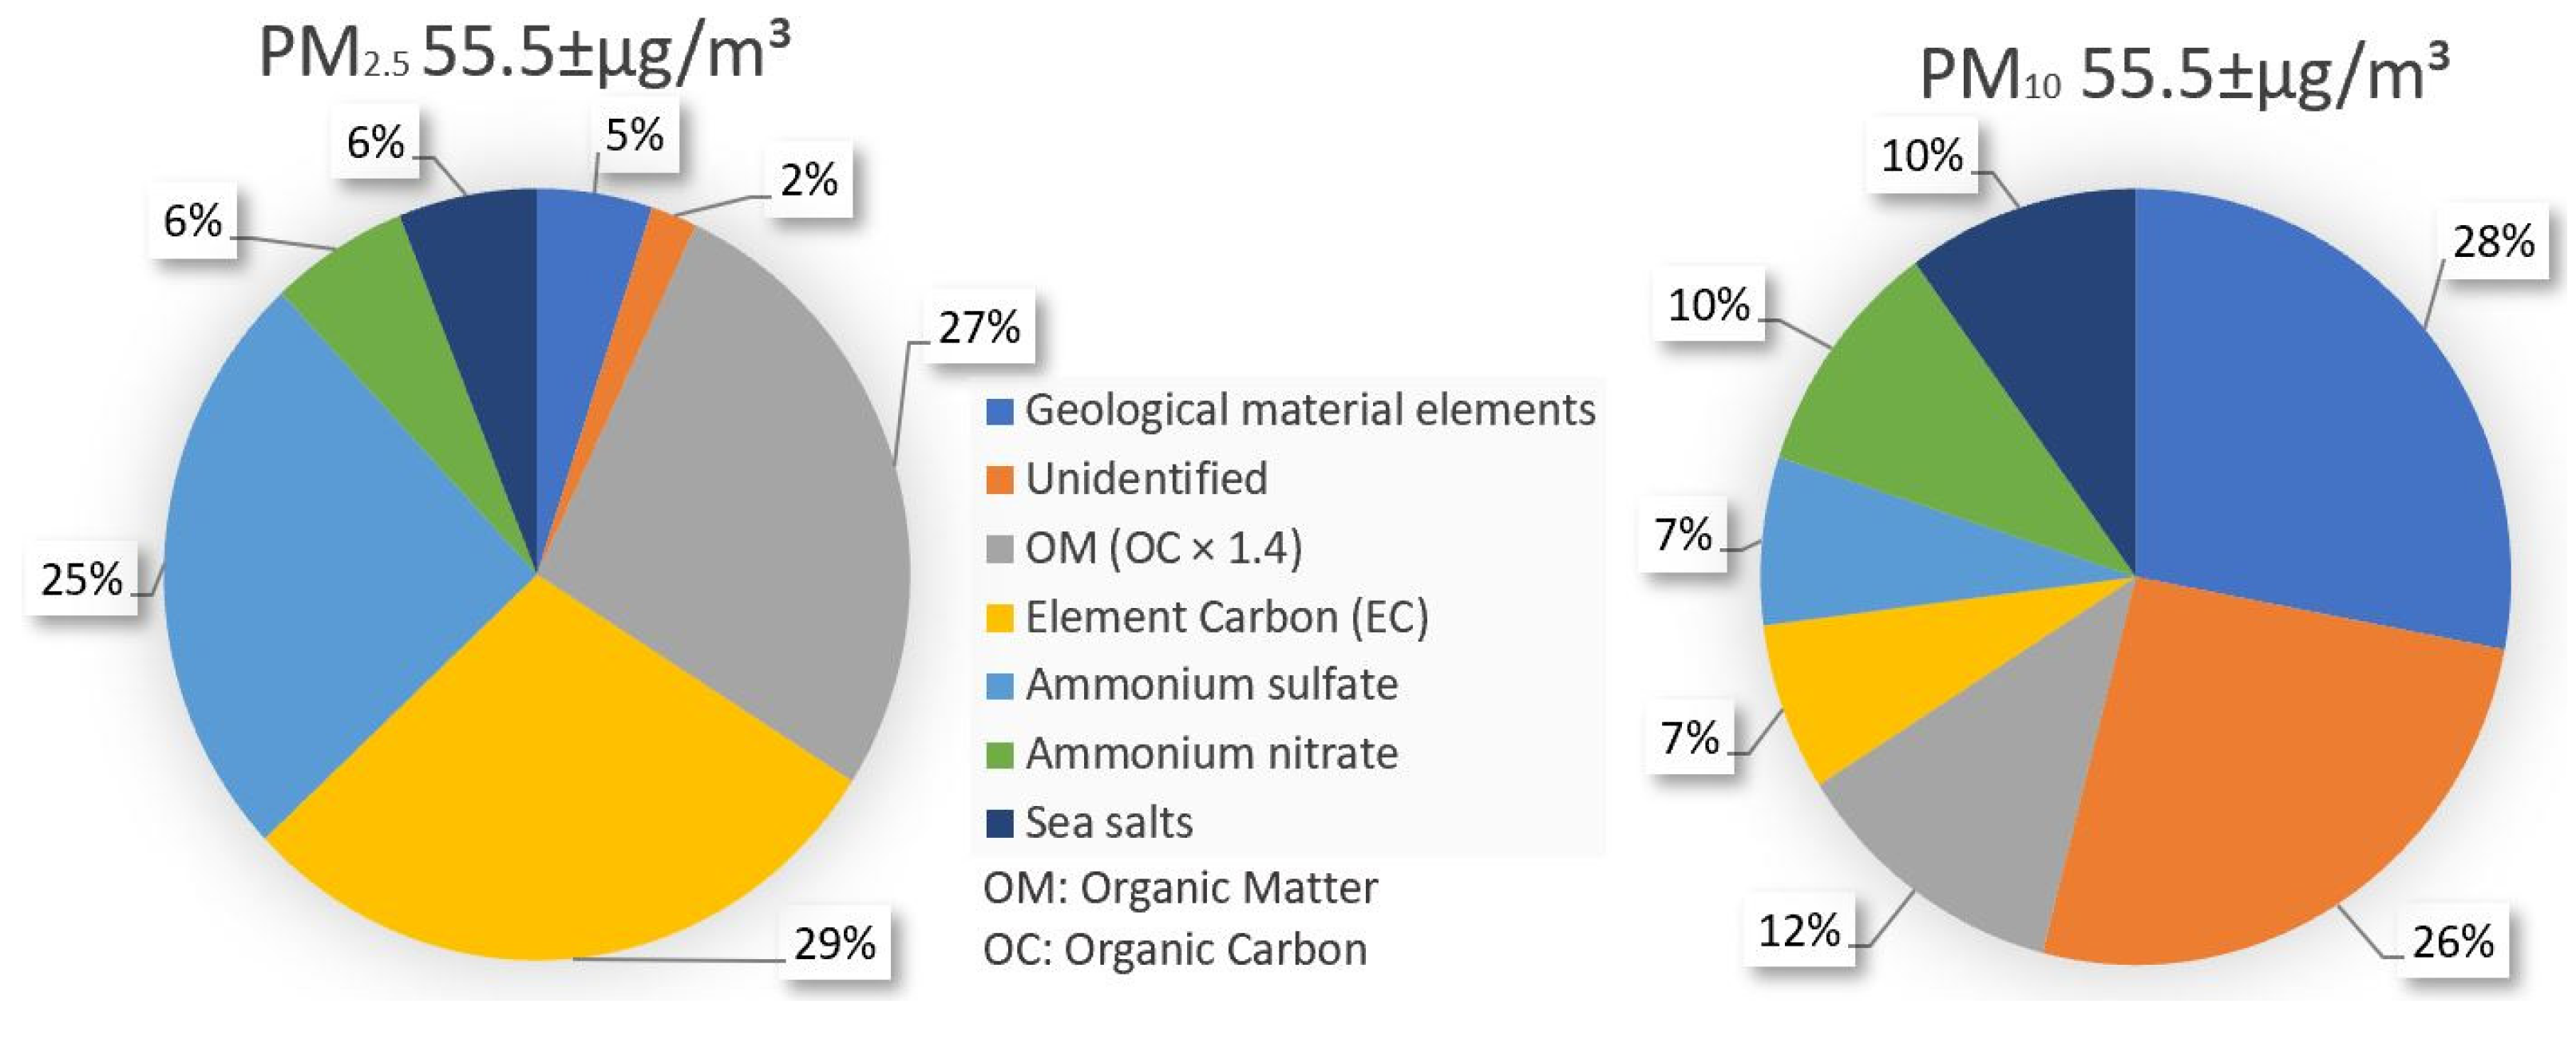
2.2. Particulate Matter (PM)
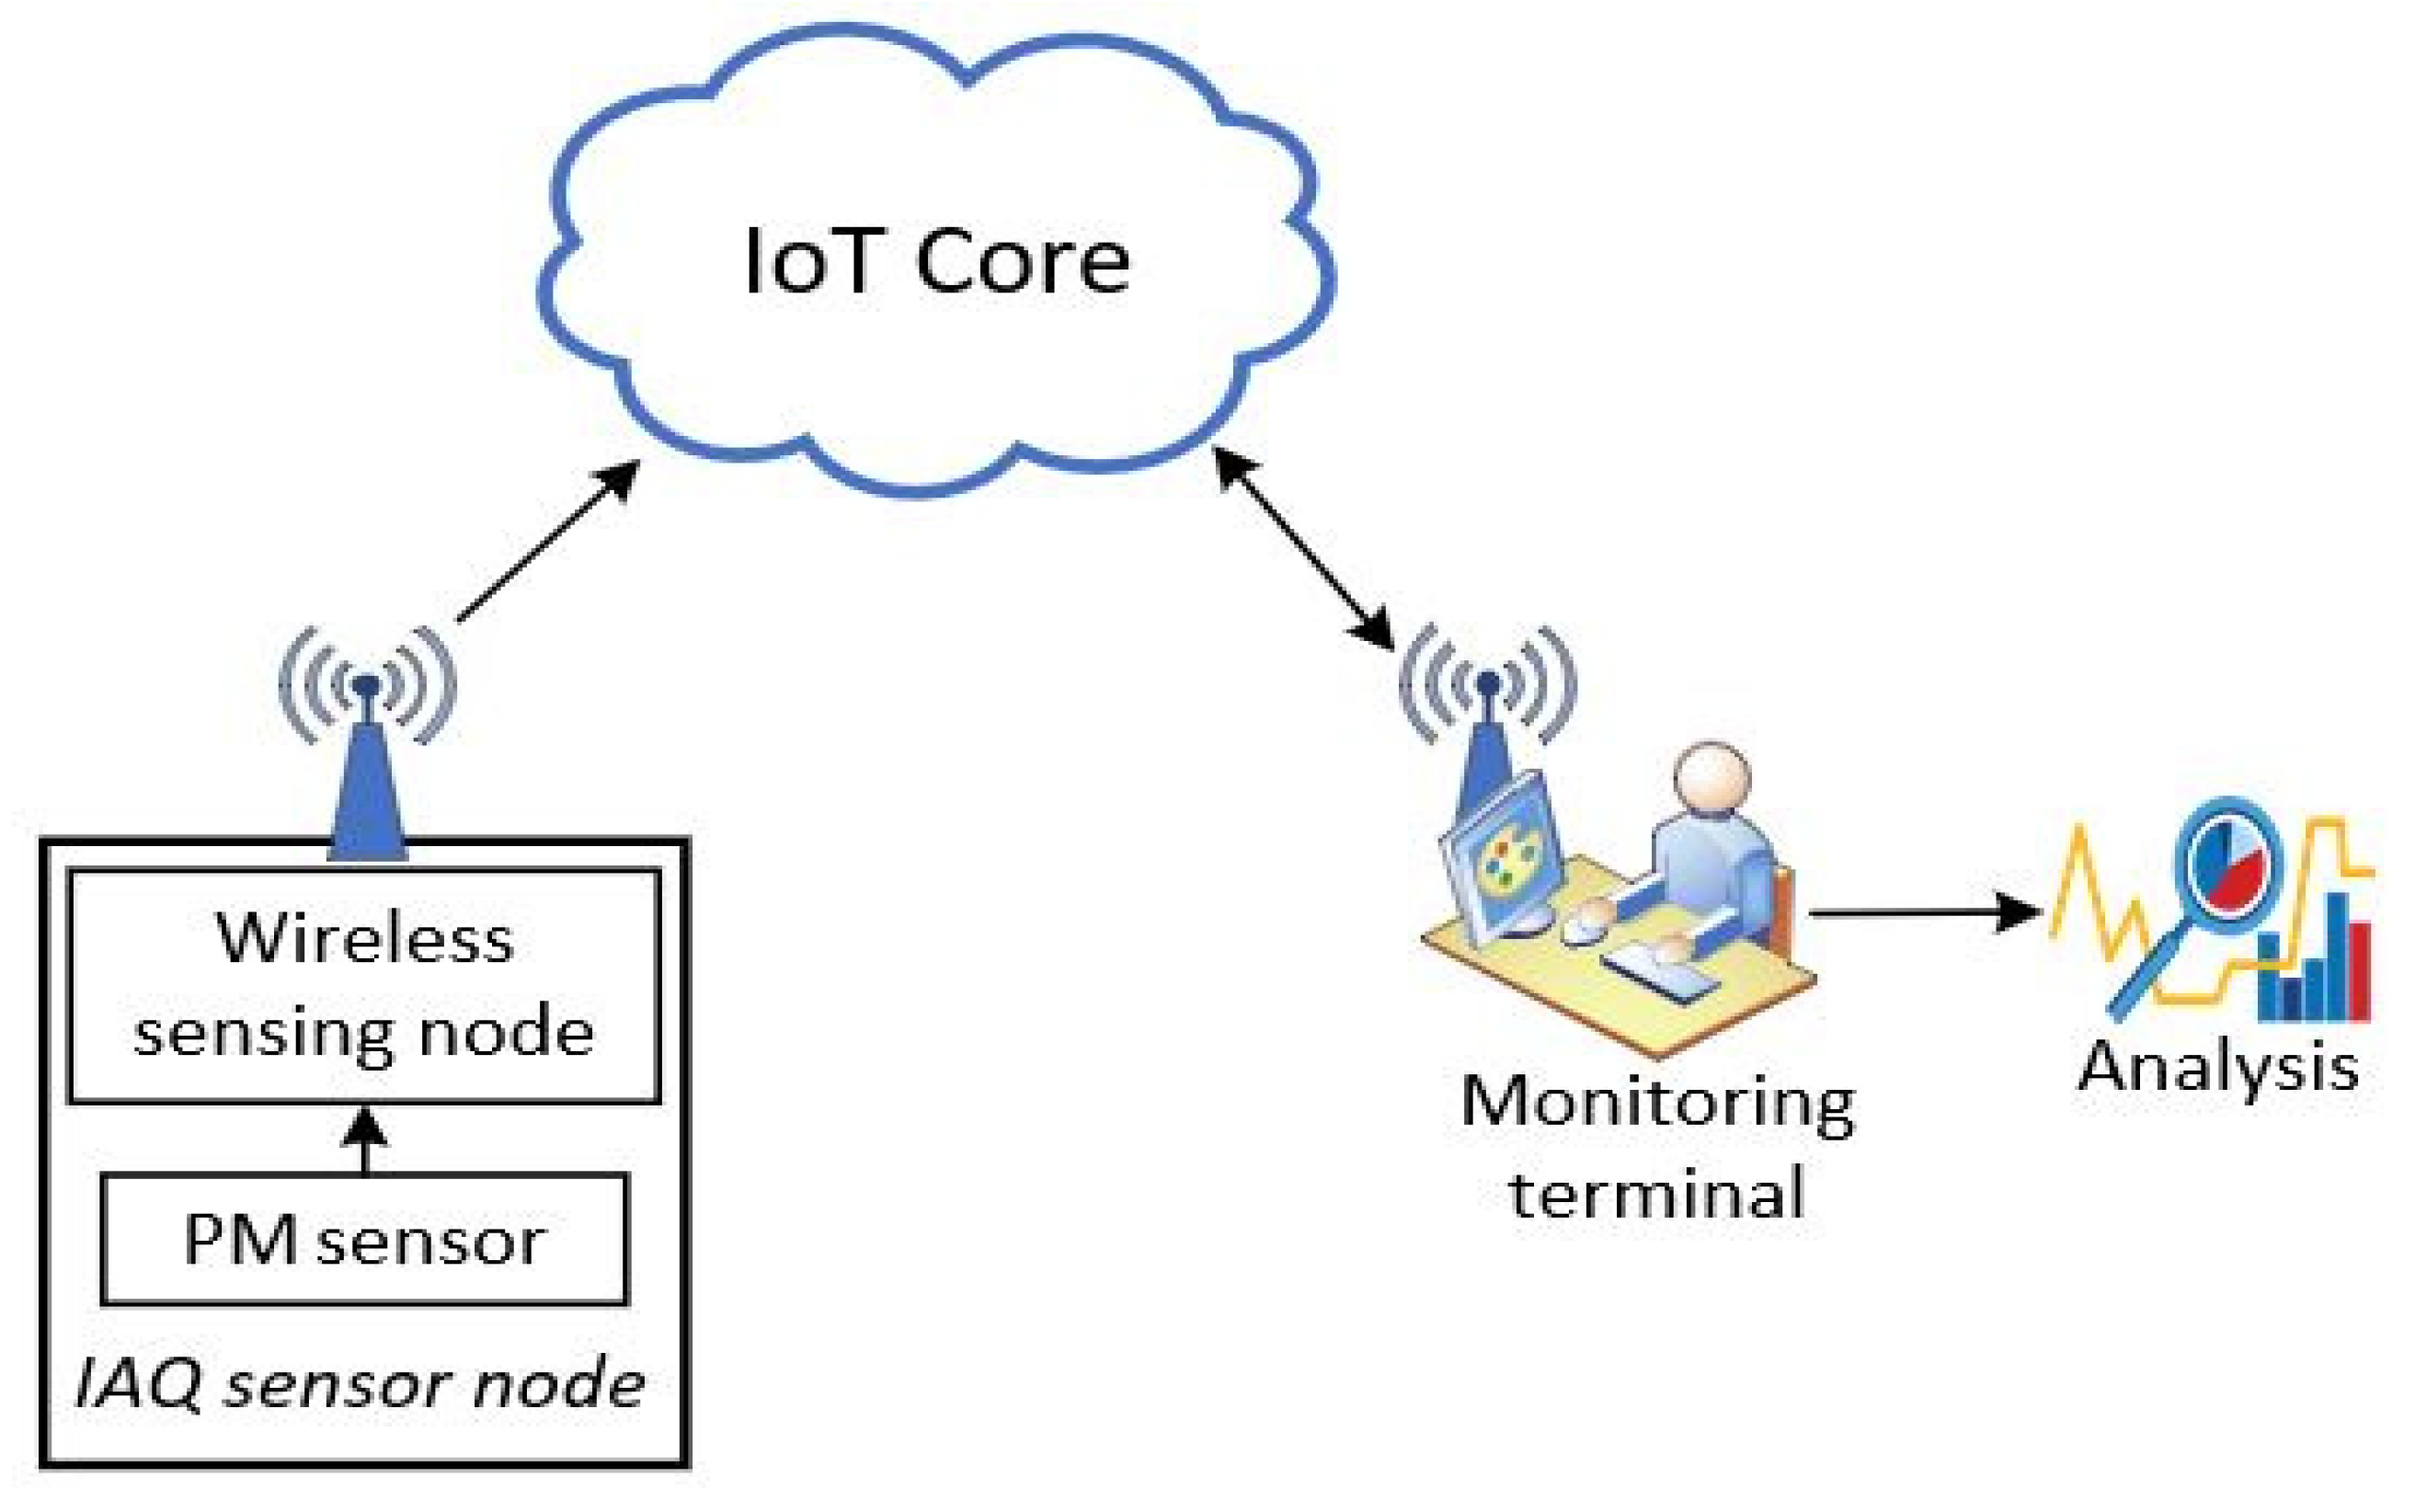
2.3. Proposed PM Sensor Node
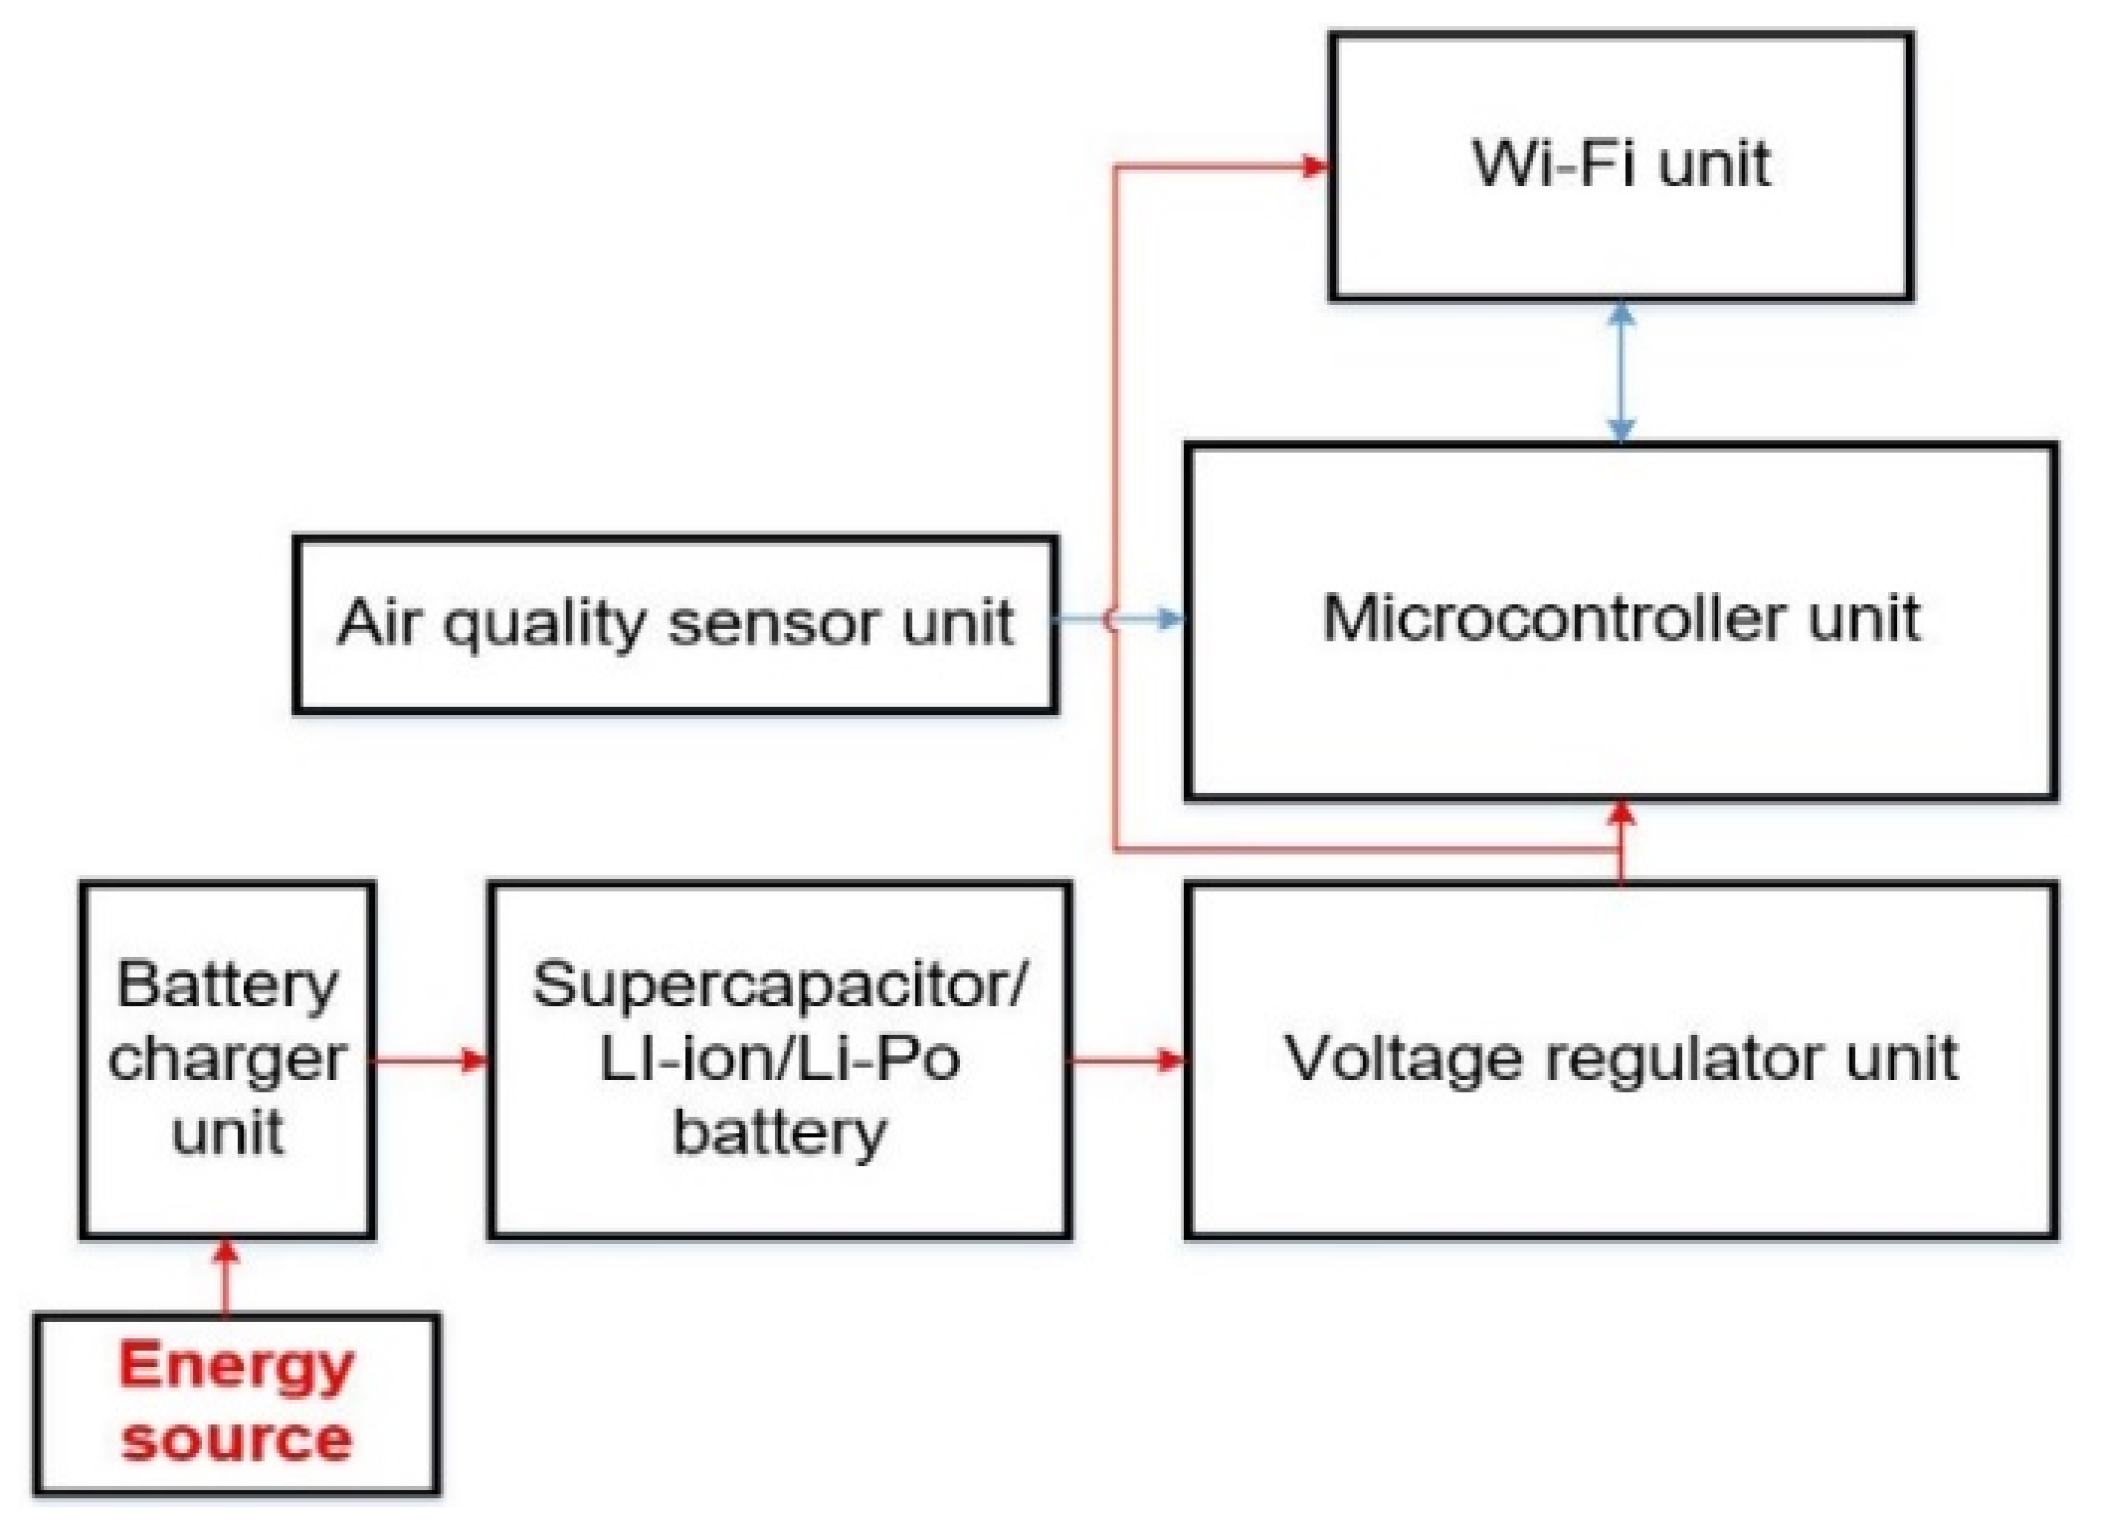
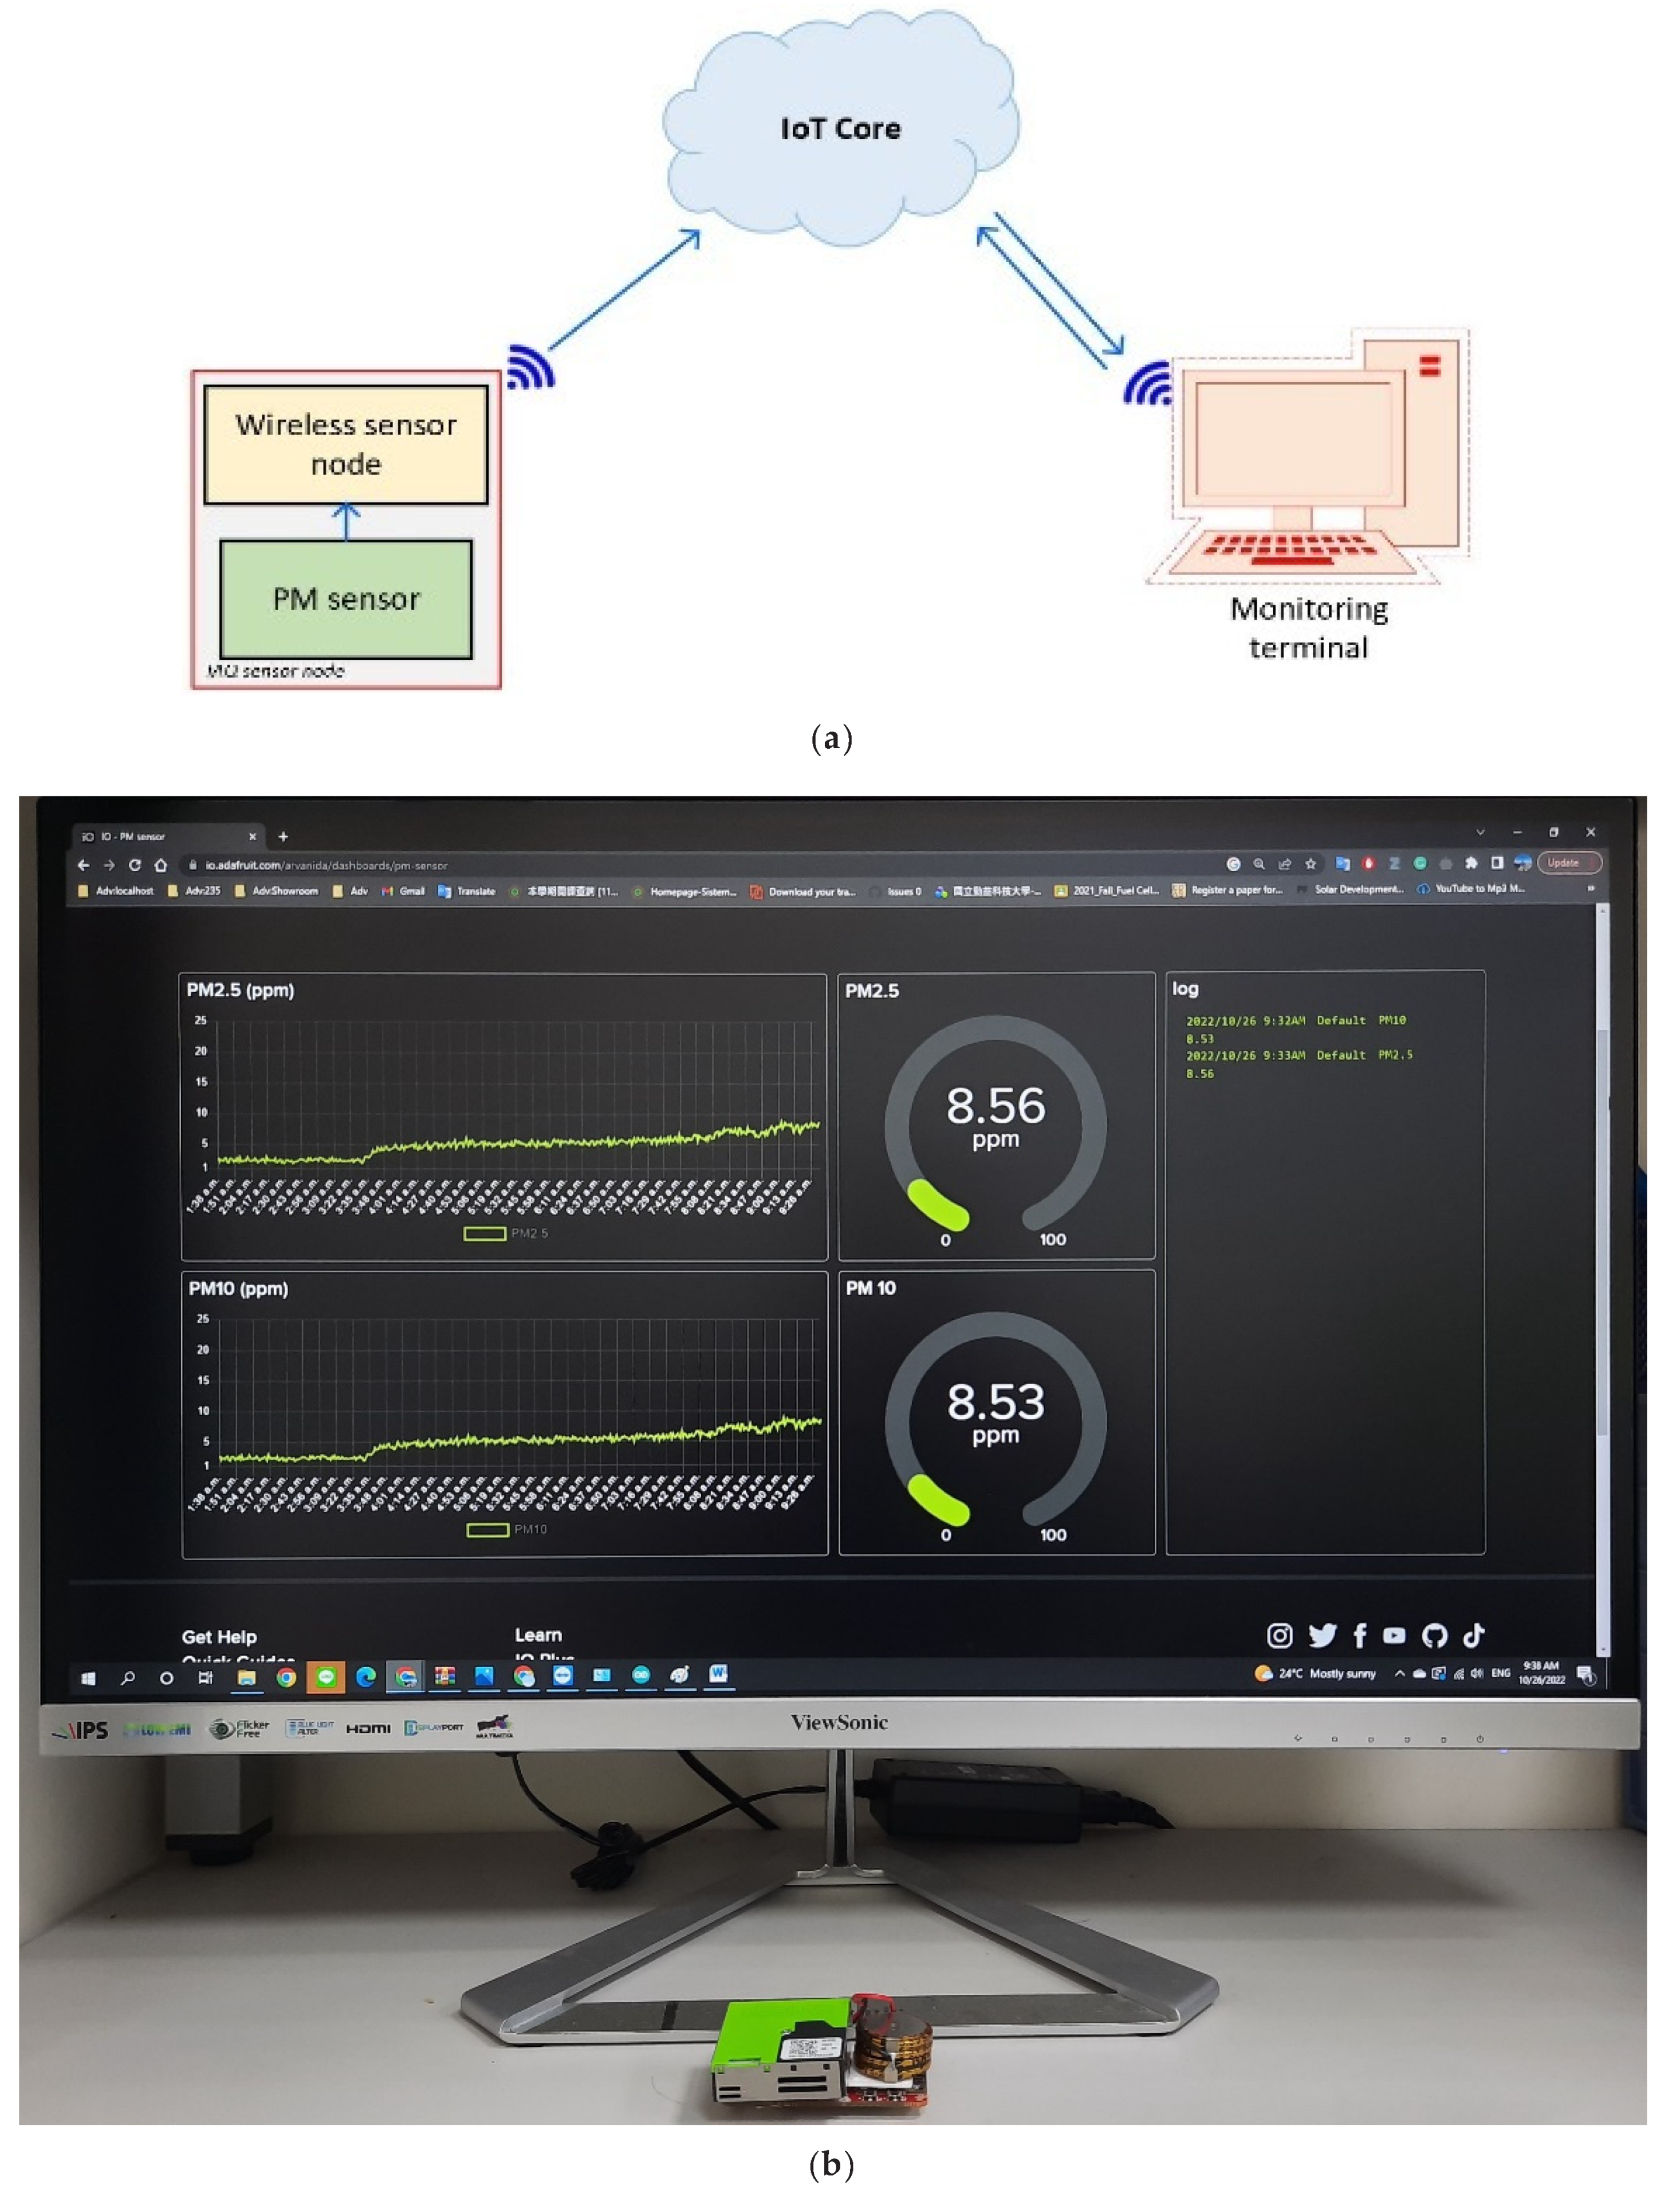
2.3.1. Design Overview
2.3.2. Hardware Design
- A.
- The node board layout
- B.
- PM sensor
- C.
- The ATMega4808
- D.
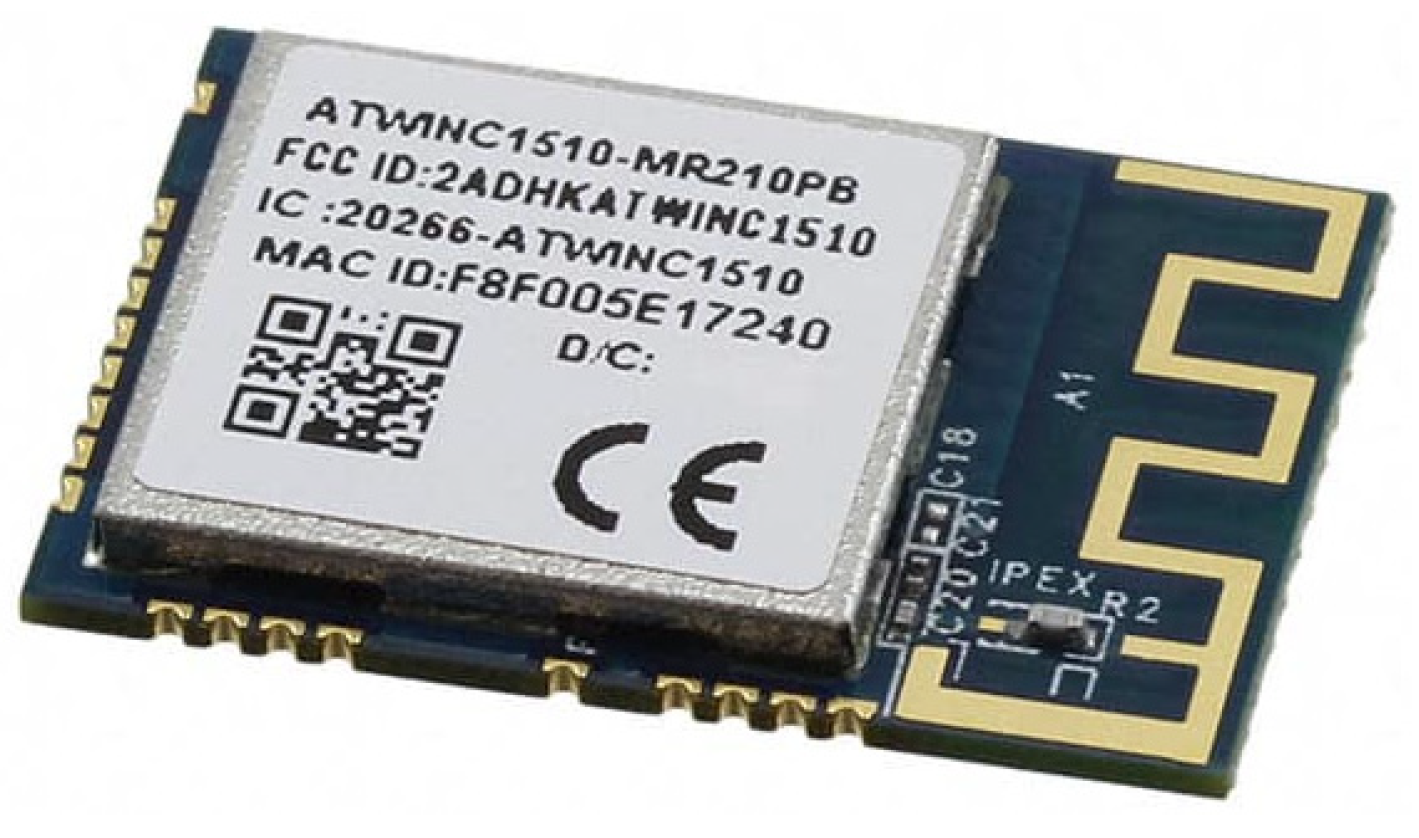
- The ATWINC1510
- E.
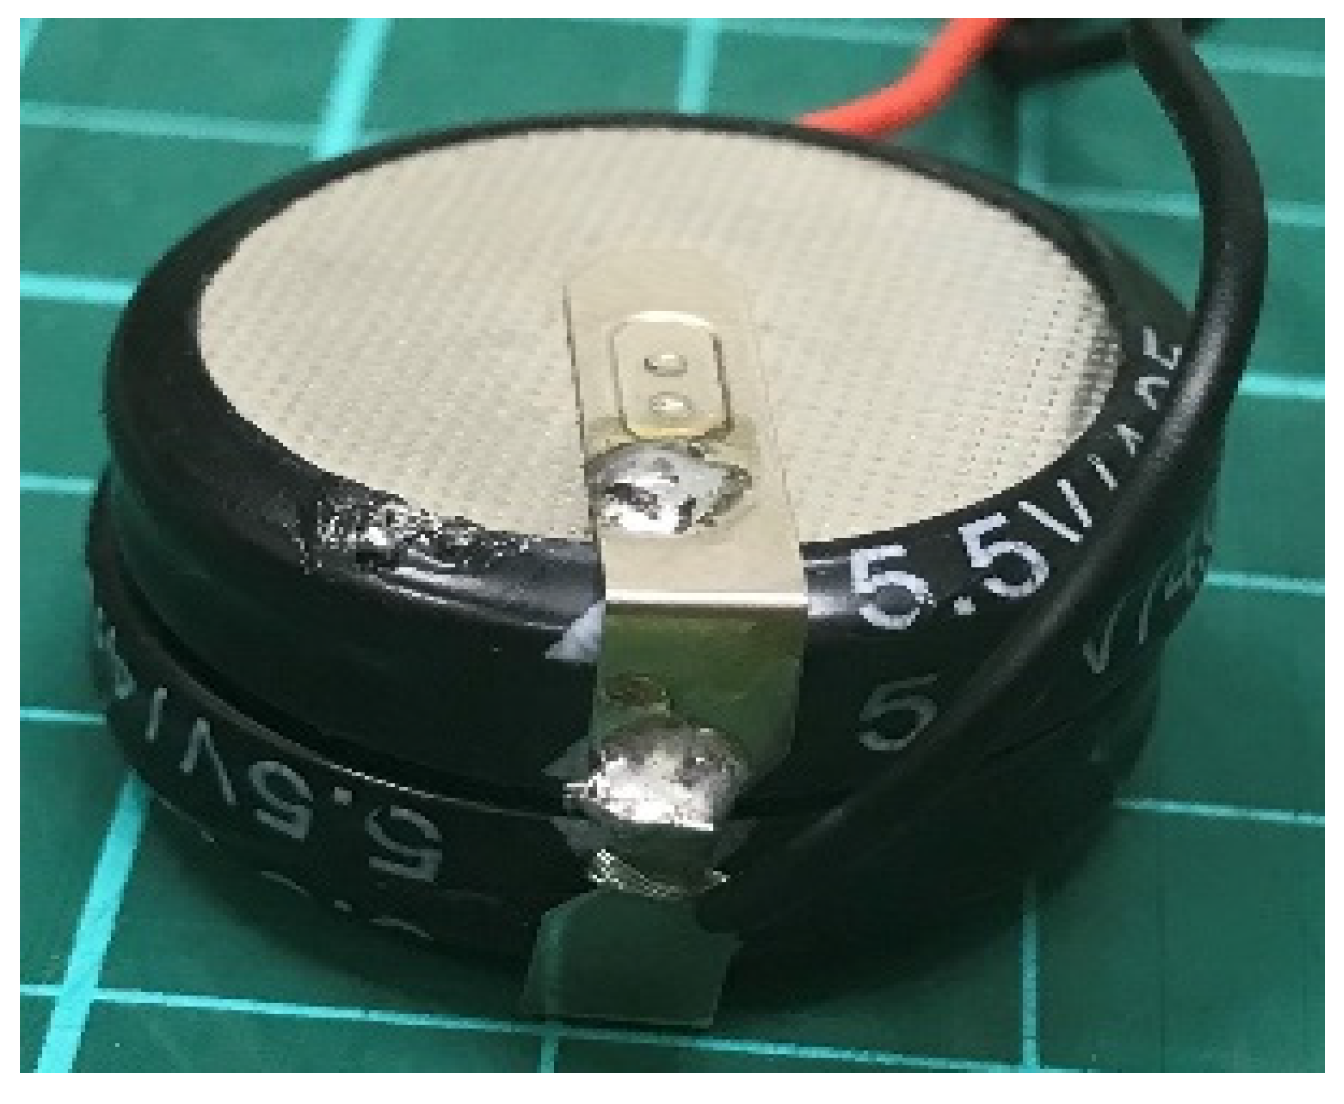
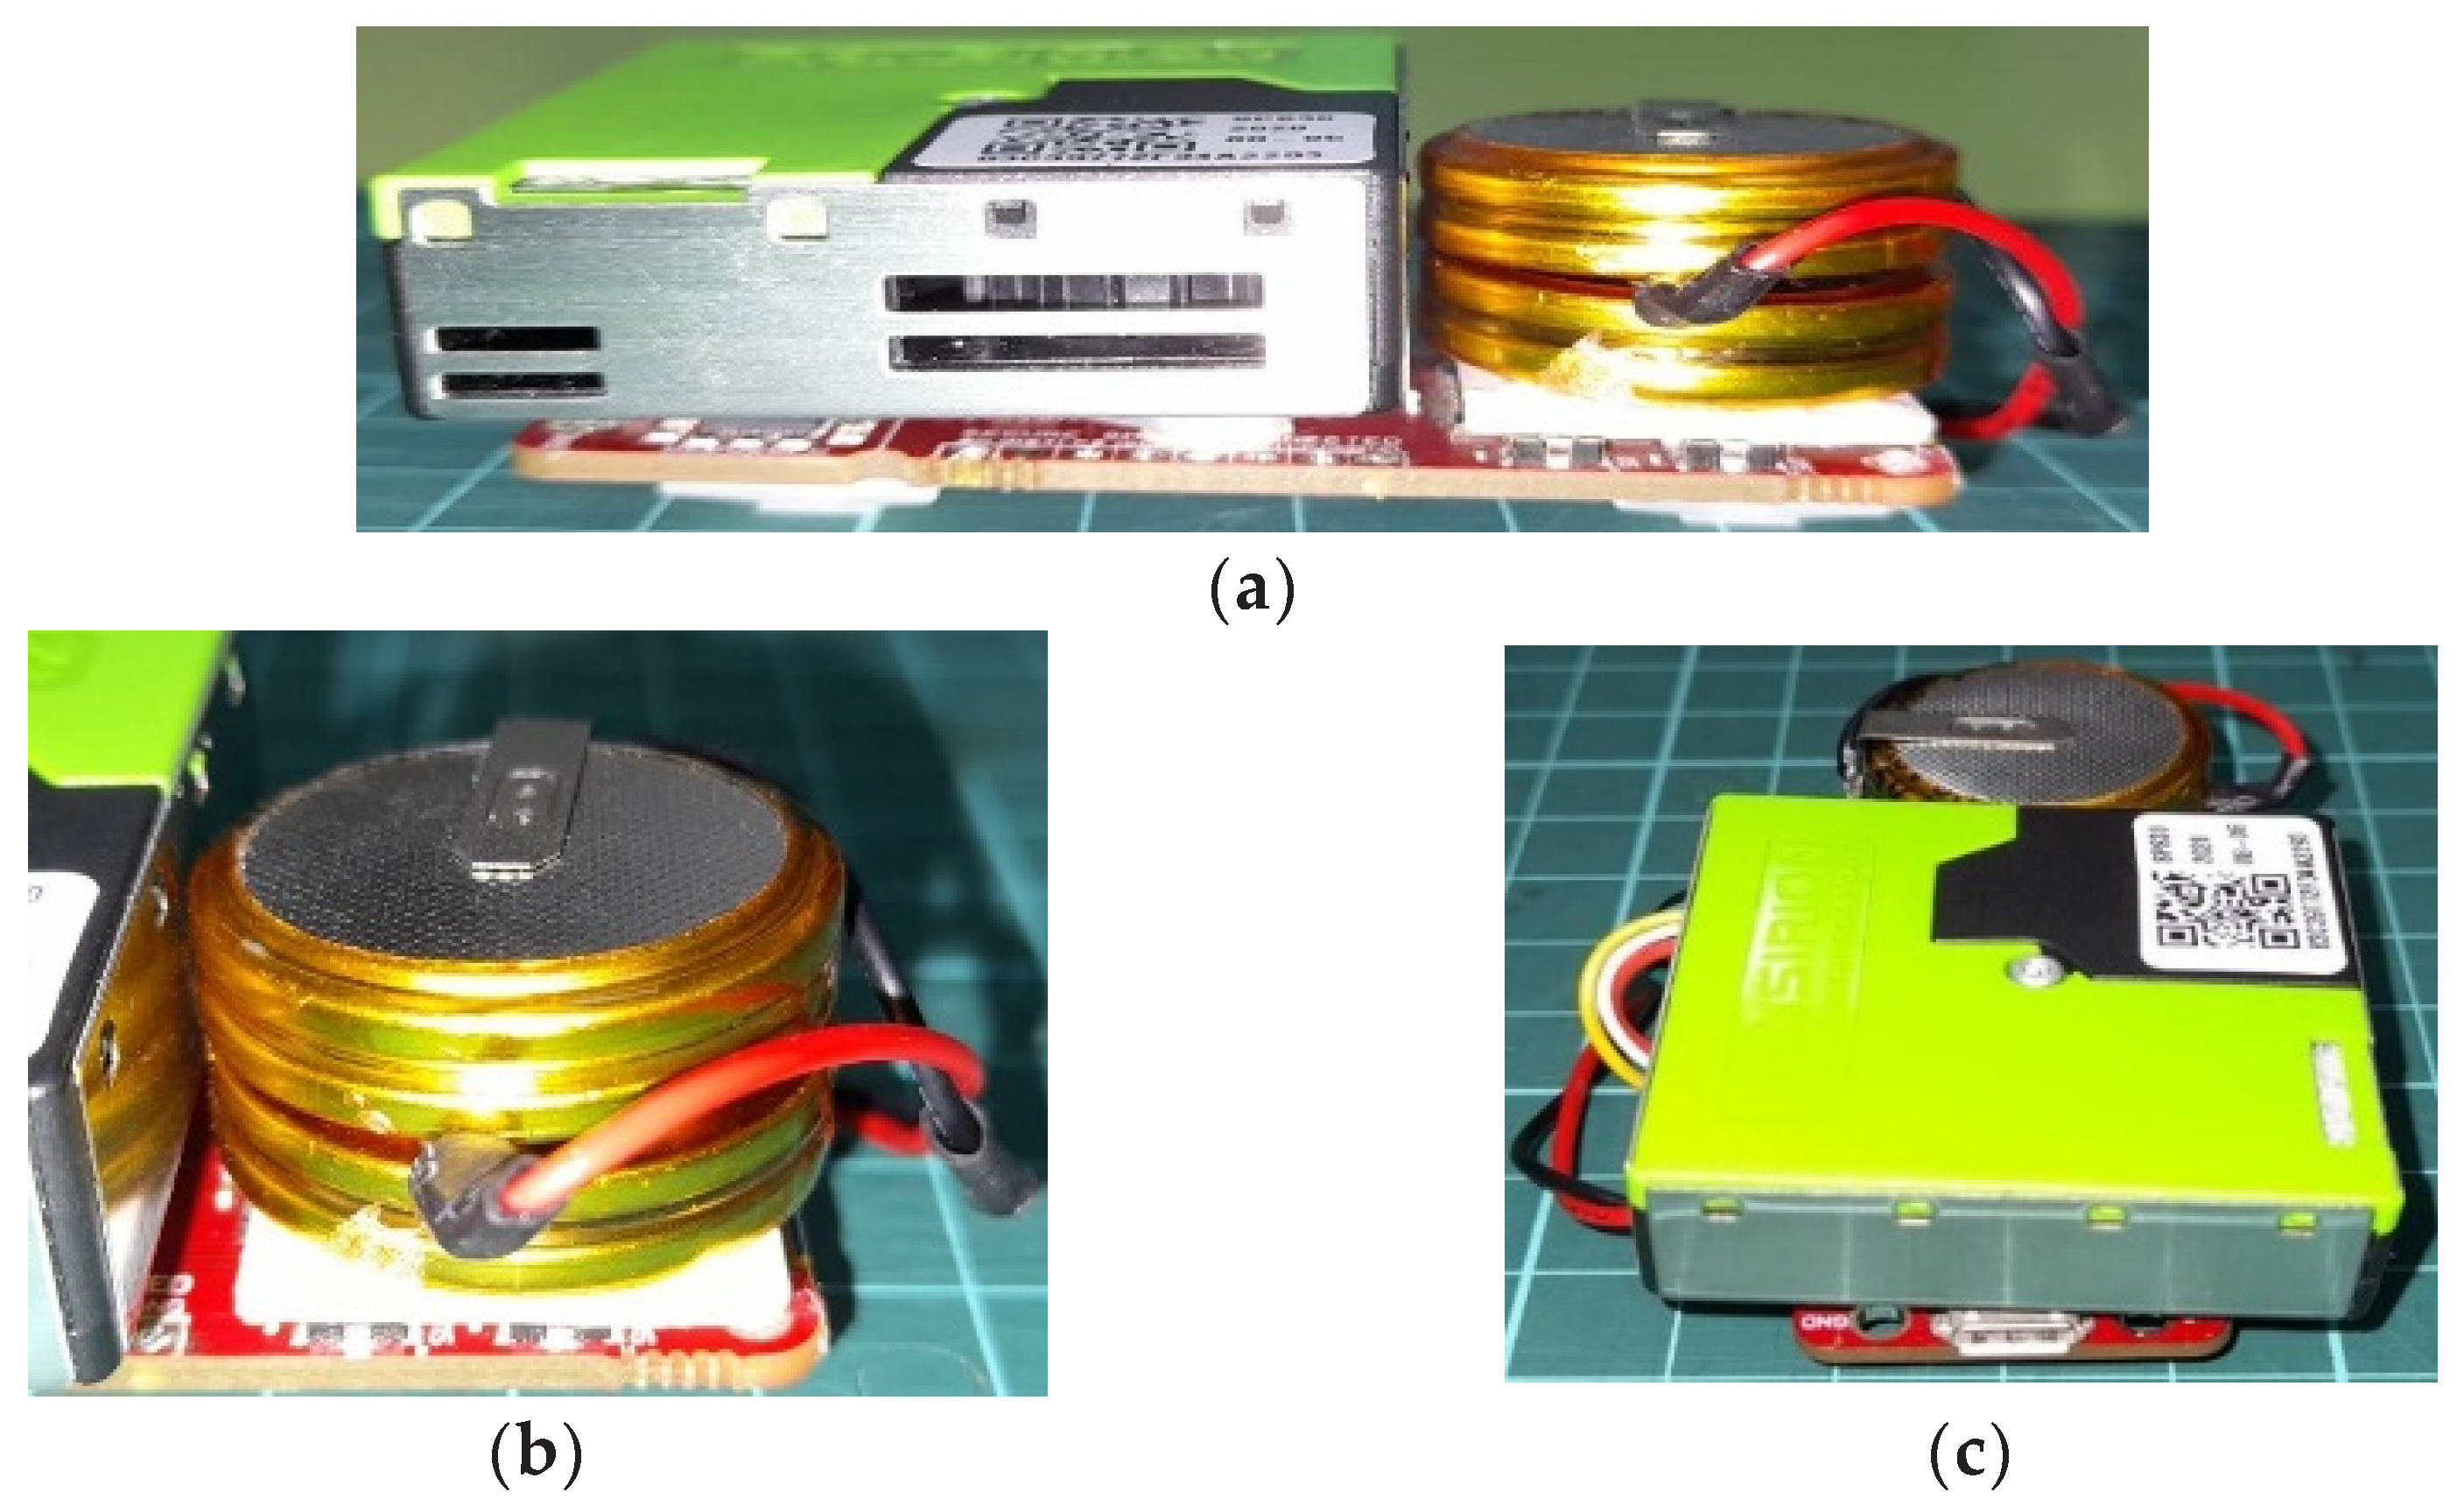
- Power storage
2.3.3. Software Development
| Algorithm 1 The Logical Flow of Smart Wireless PM Sensor Node |
| Start program sensor node activity while power is ON Initialize wireless internet connection. If Wi-Fi is connected successfully:
Retry Wireless Connection Internet. Return to repeat measuring data. Stop sensor node activity while power is OFF. |
3. Result and Discussion
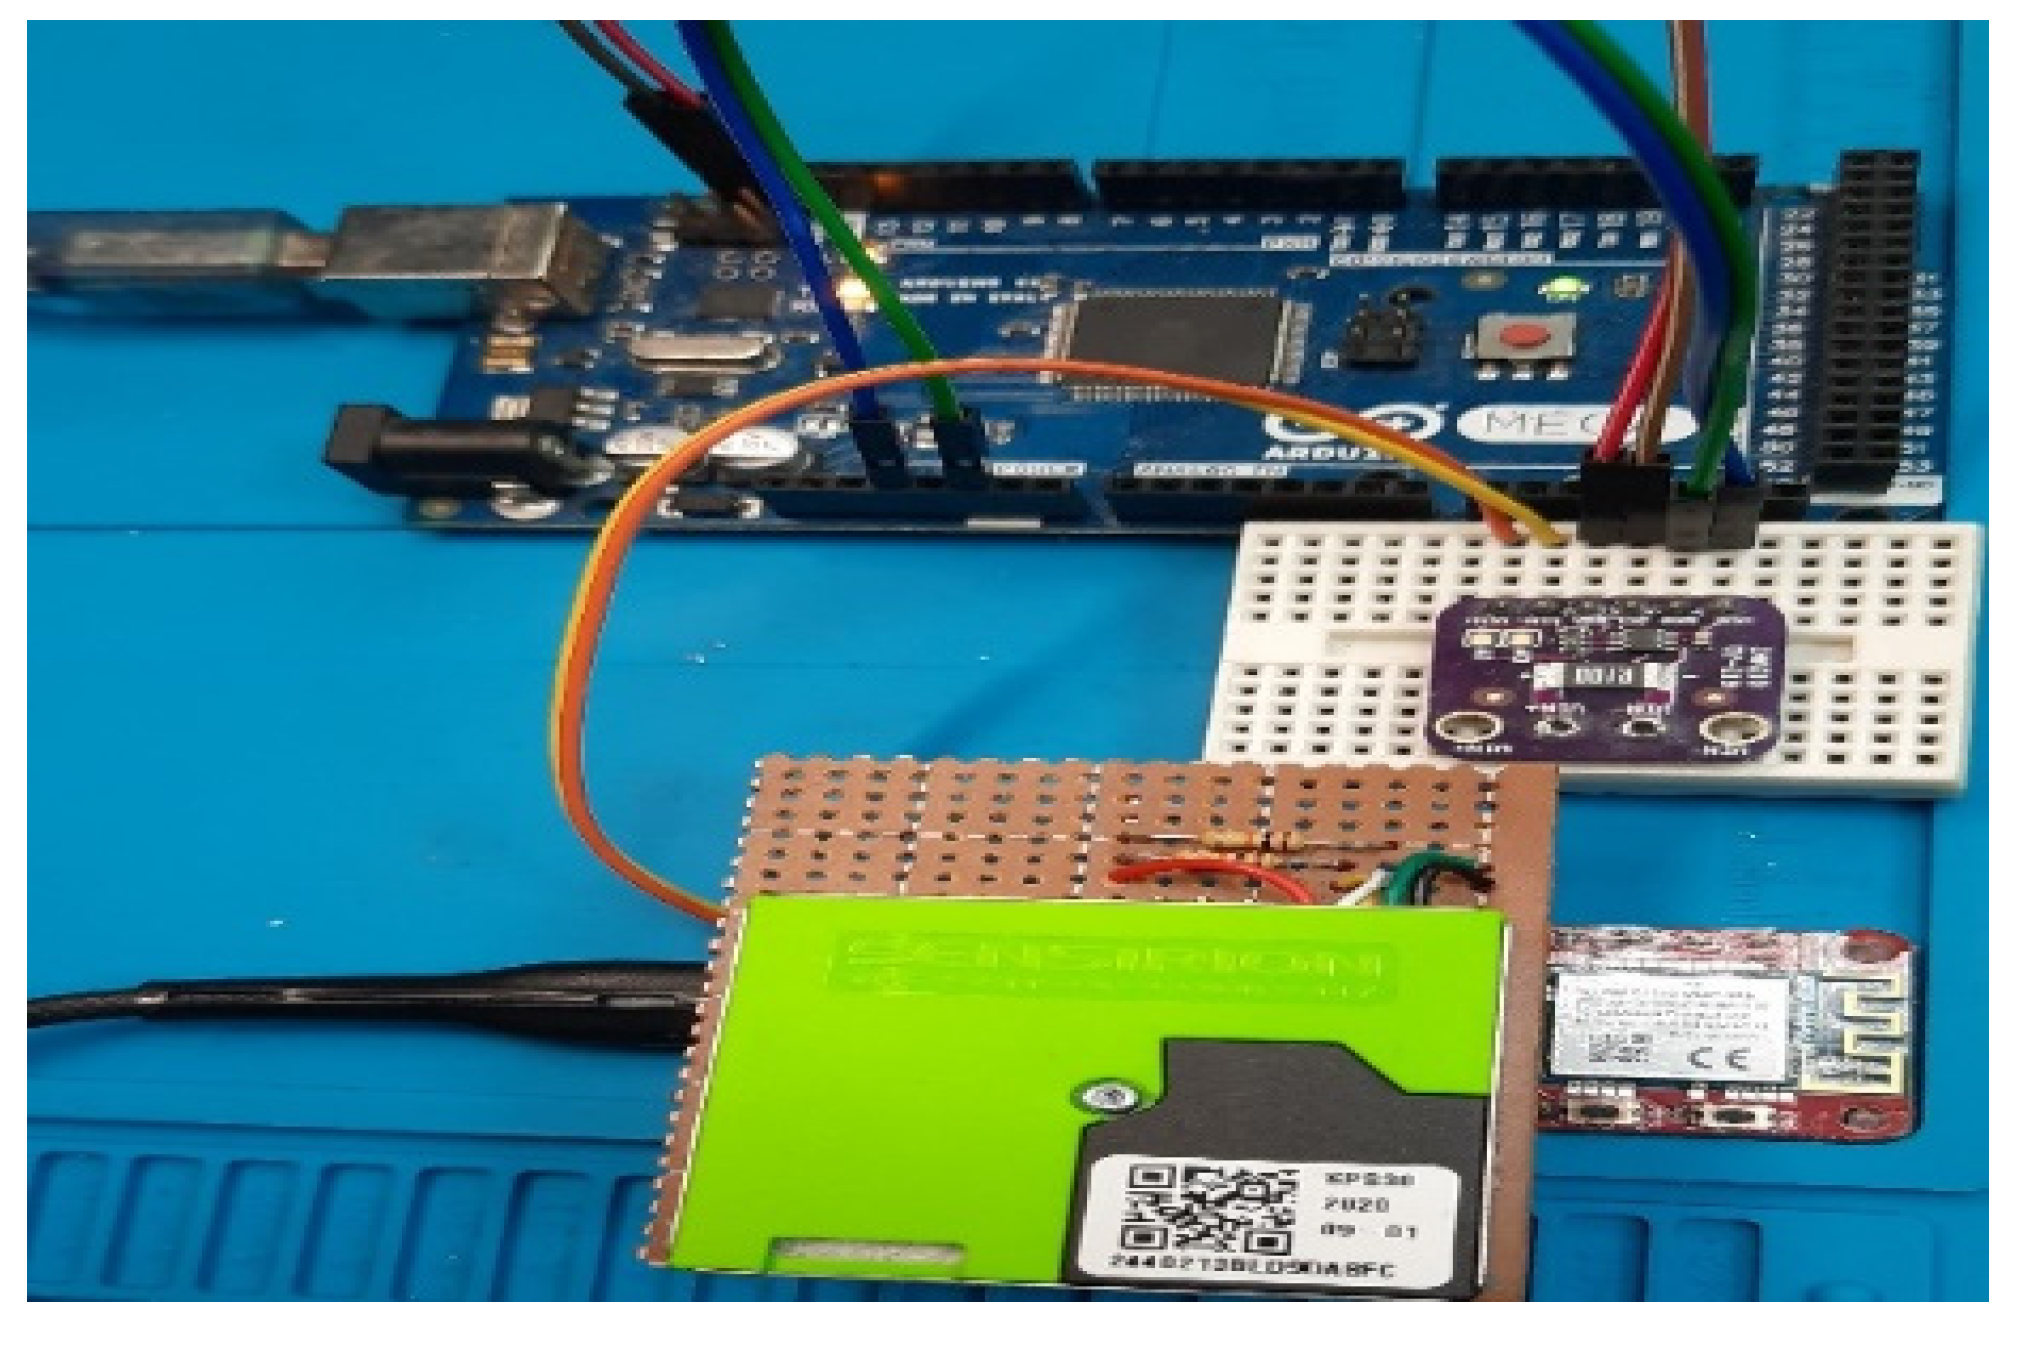
3.1. Device Implementation
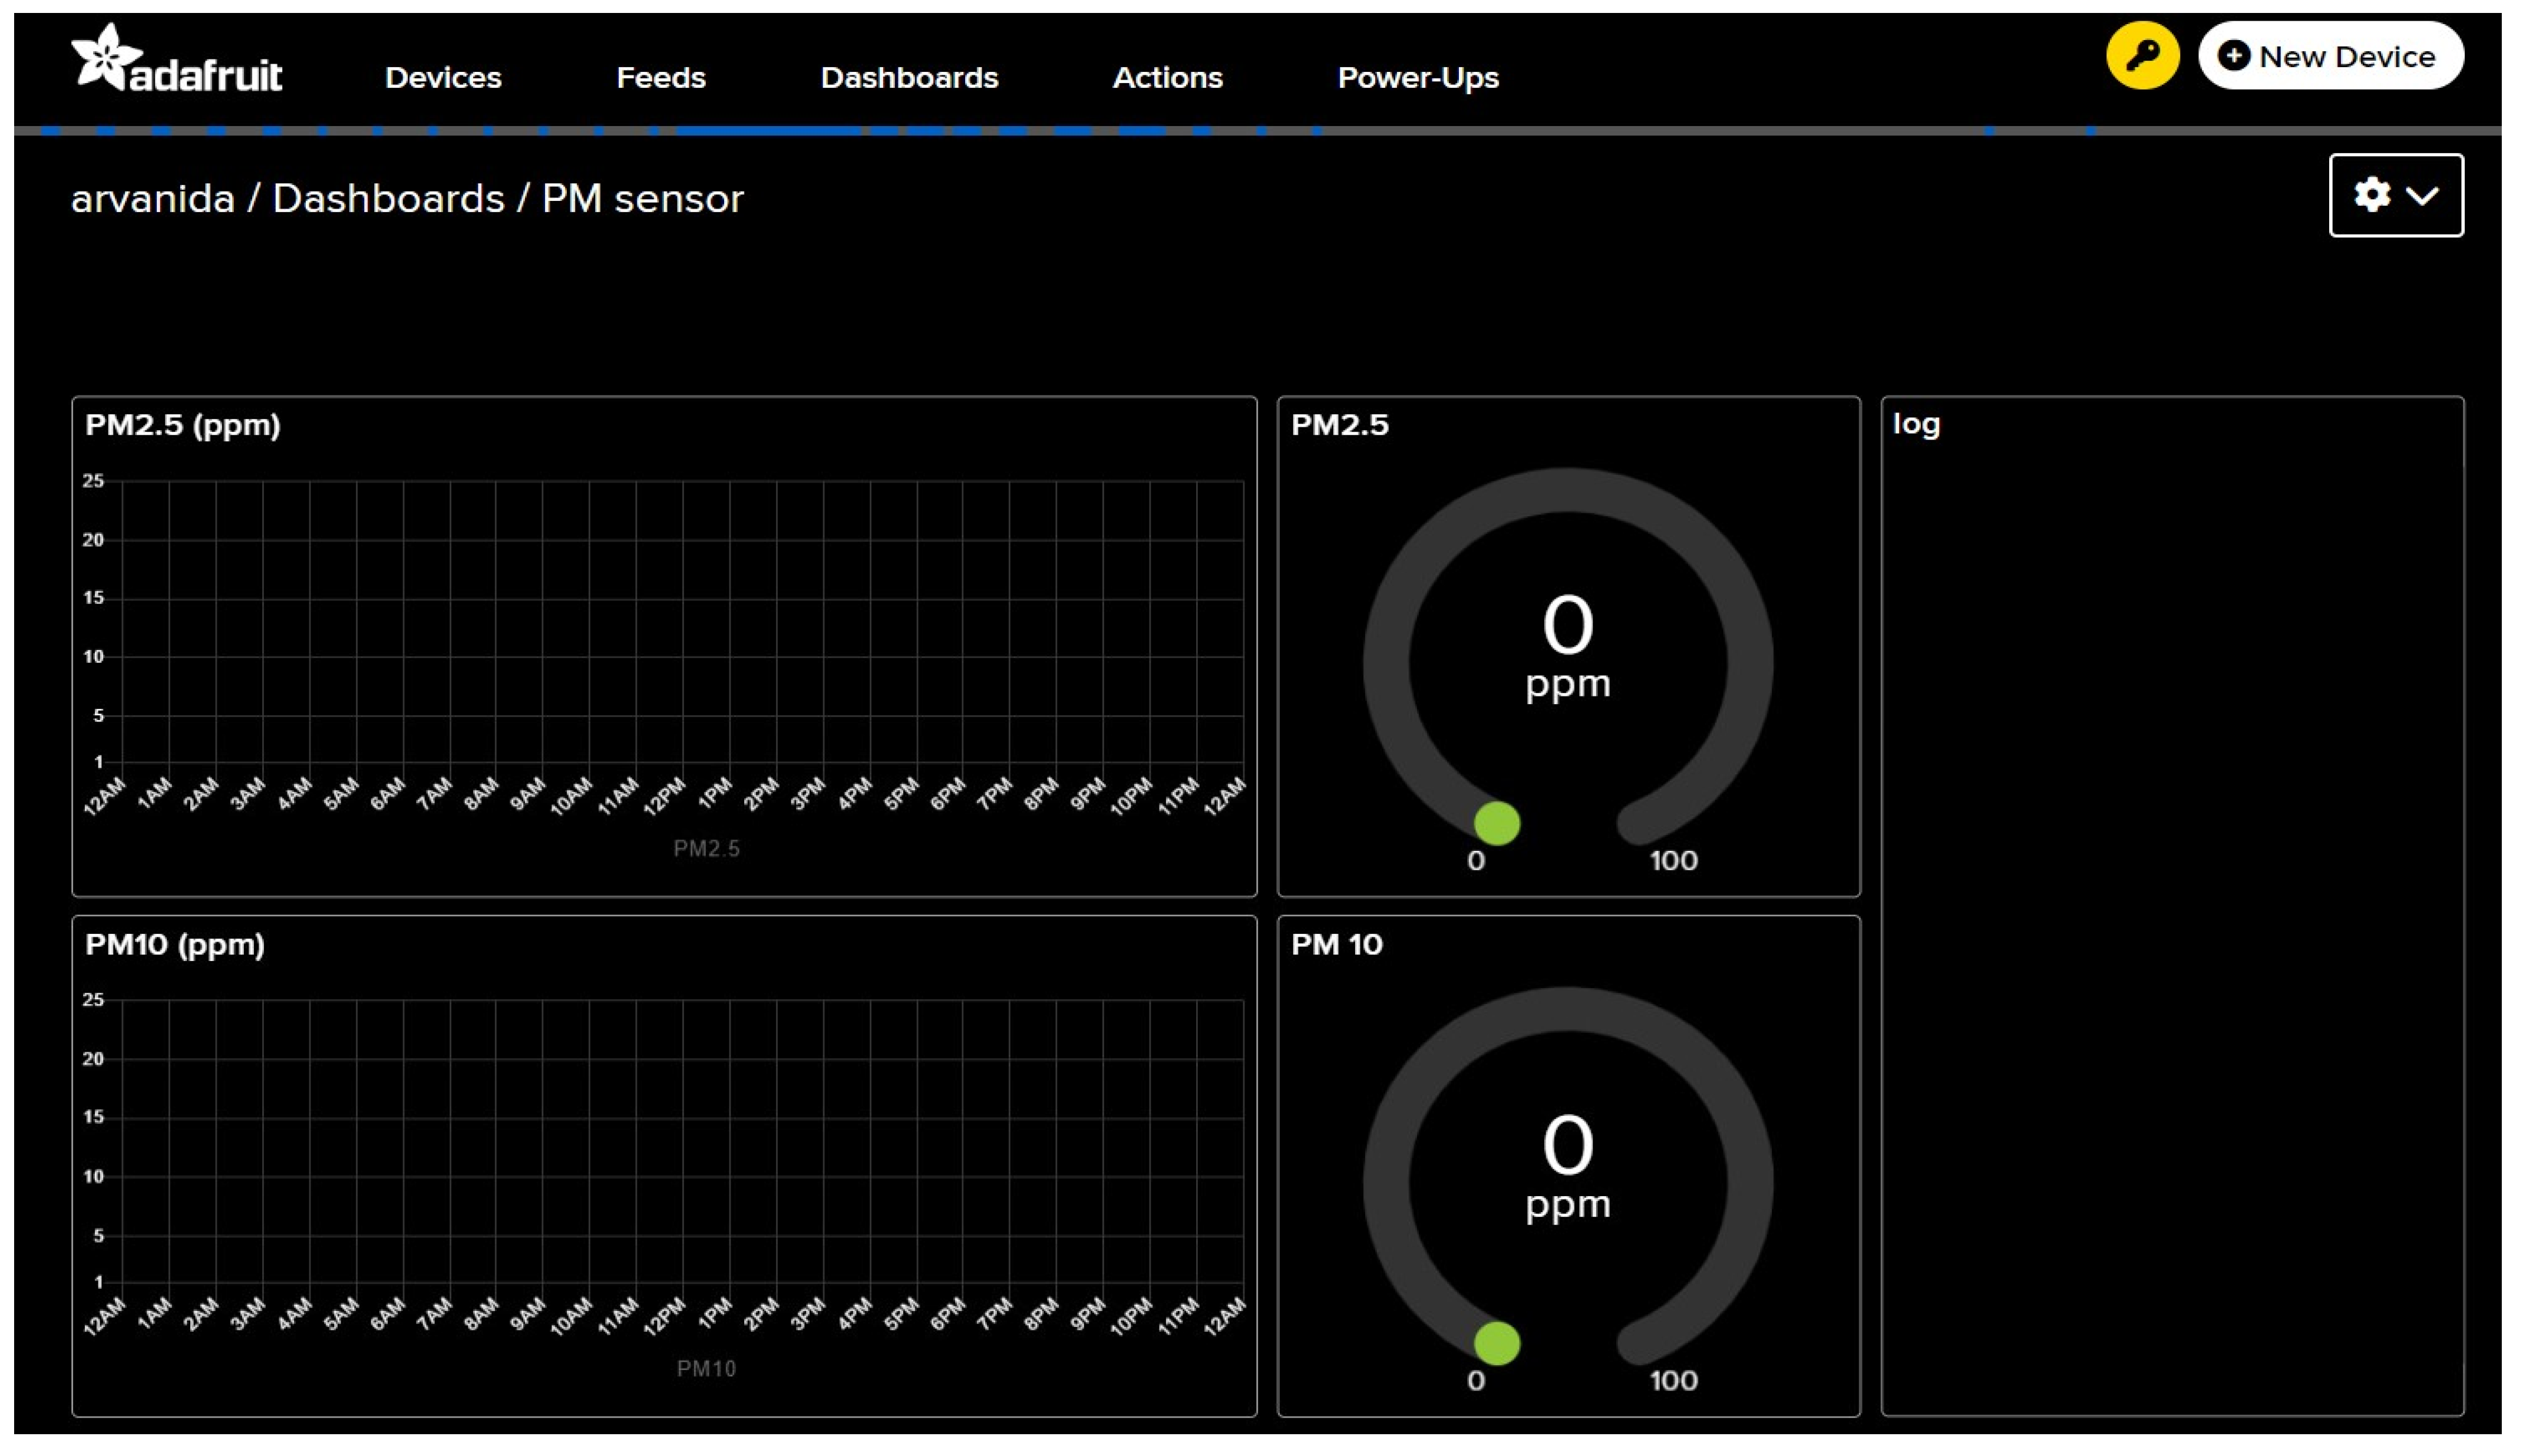
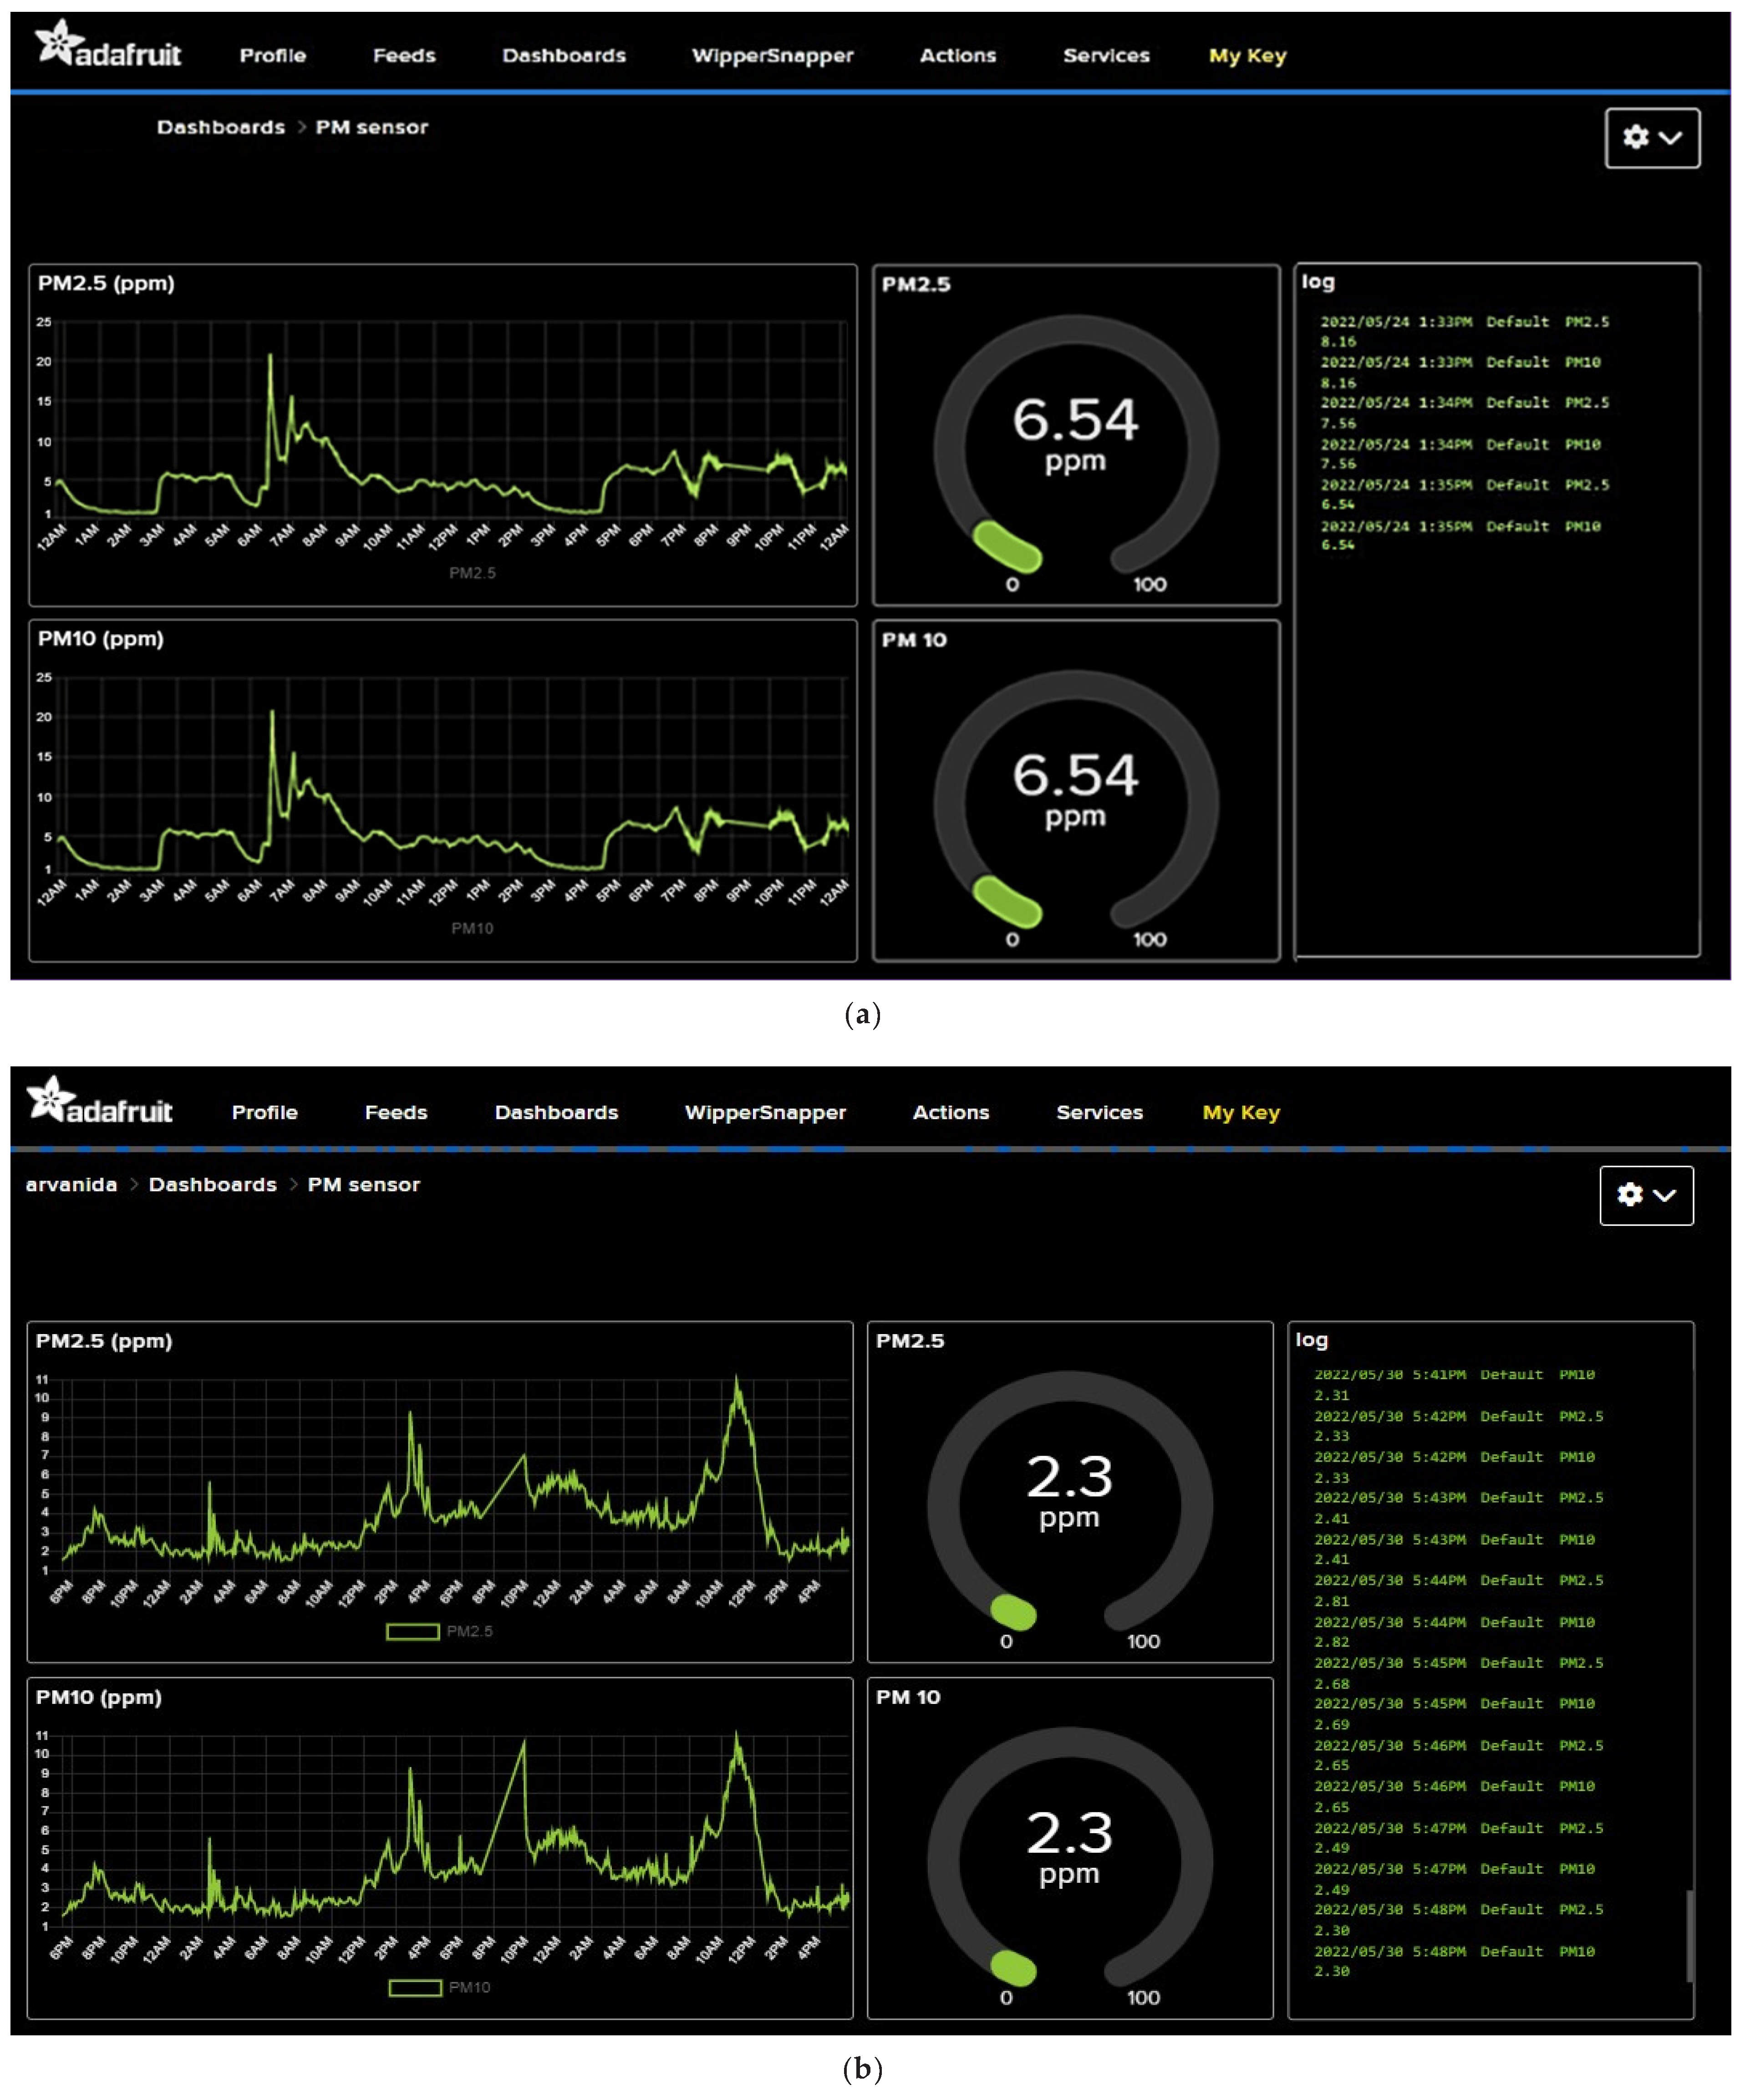
3.2. Graphical User Interface (GUI)
3.3. Functionality Testing
3.4. Validating
3.5. Power Capacity Requirement
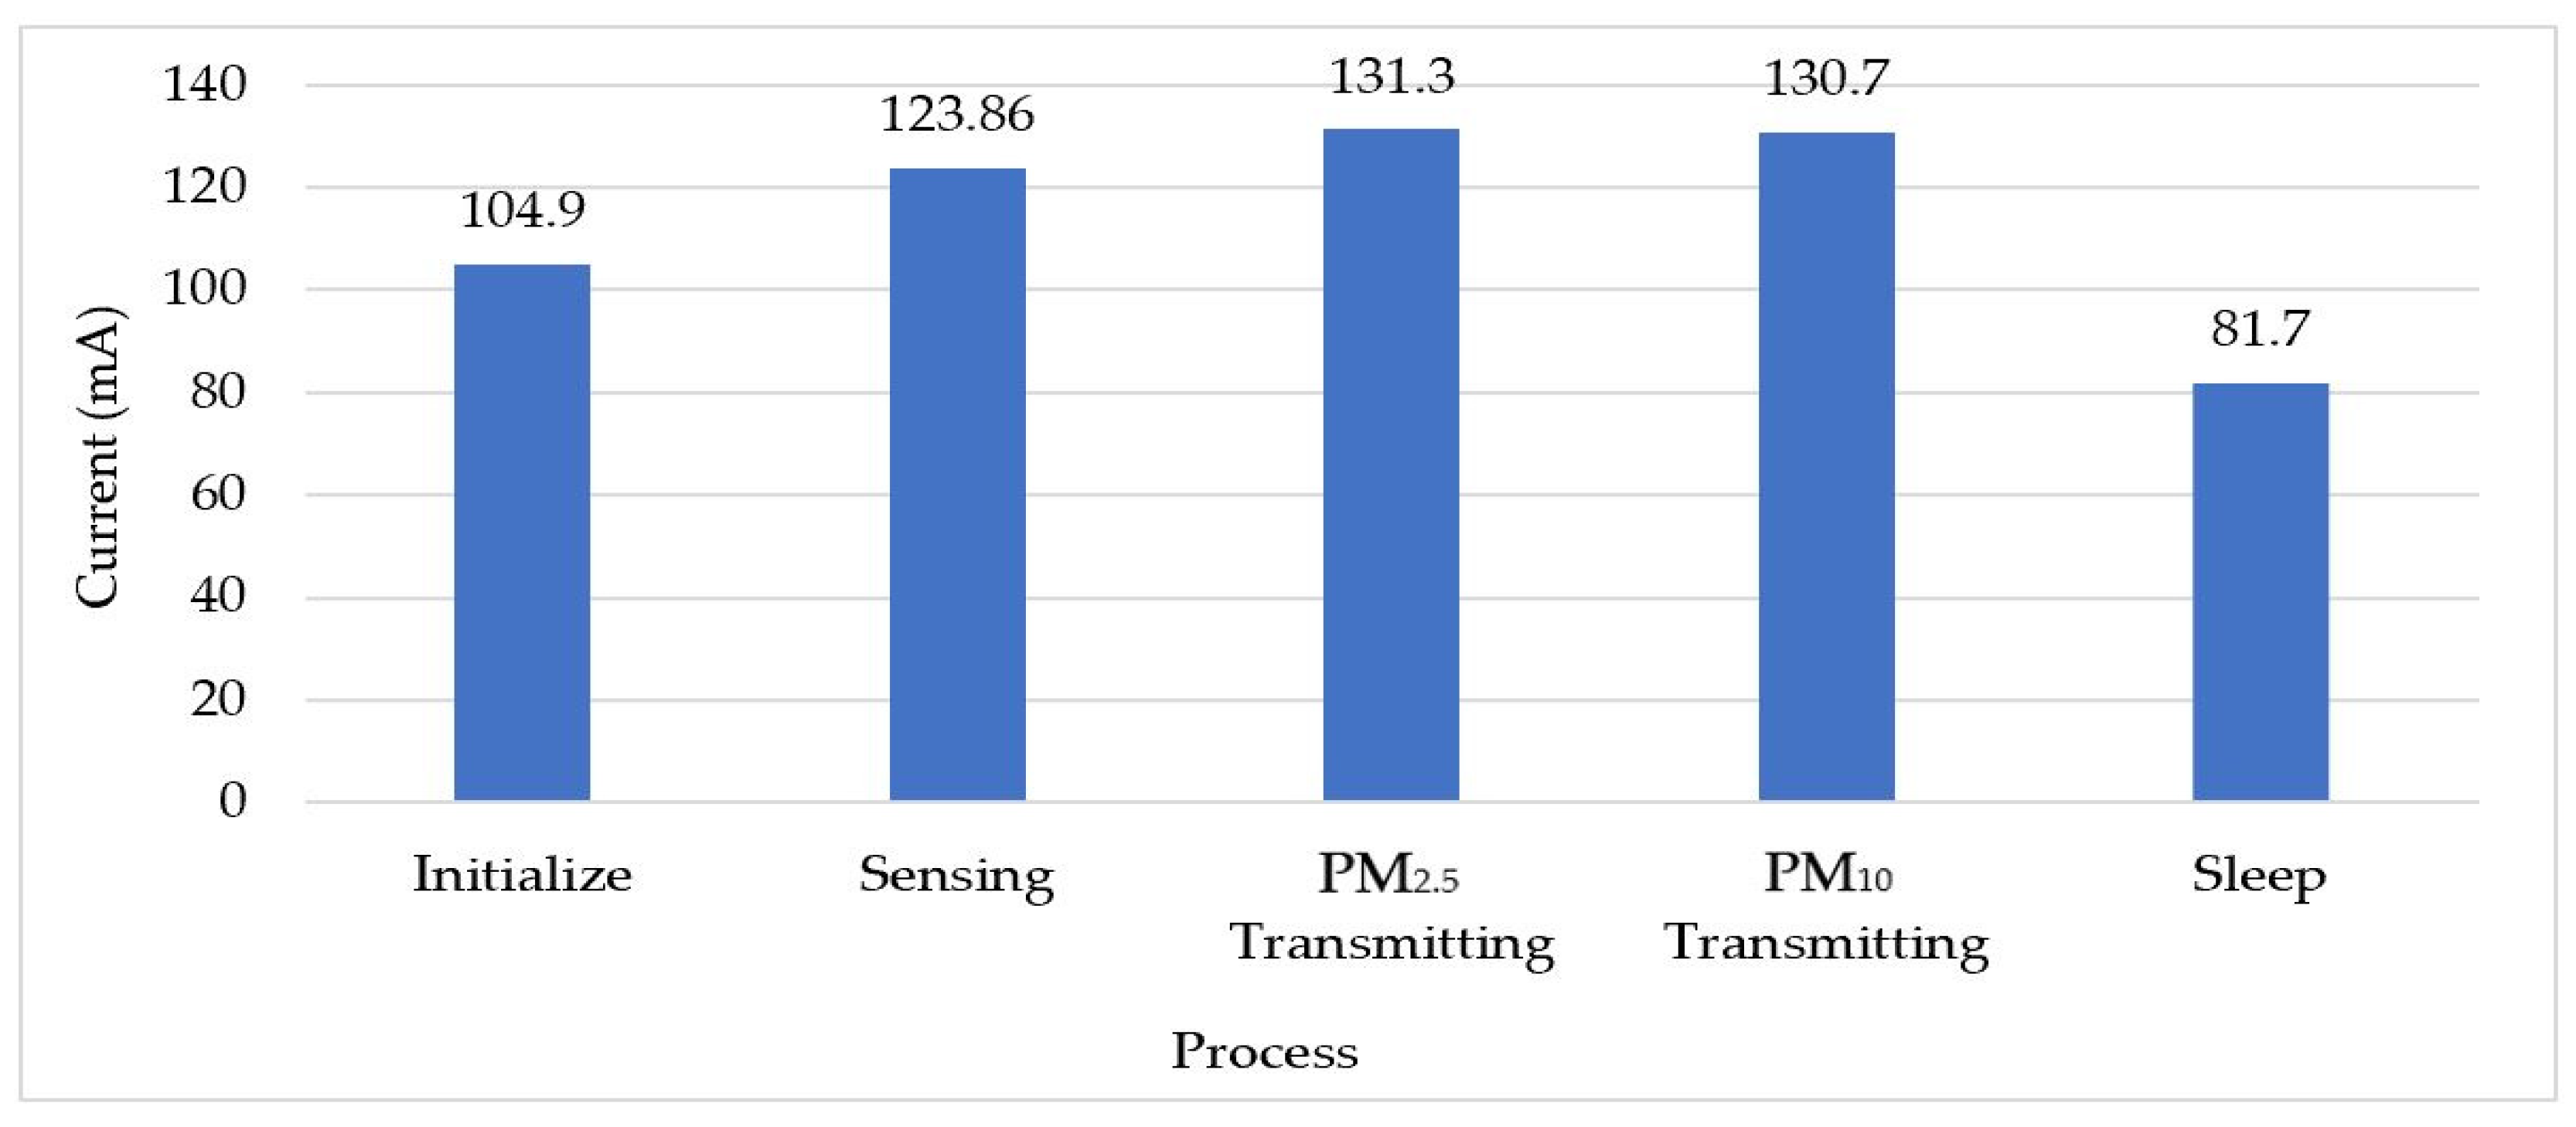
3.5.1. Current Measurement
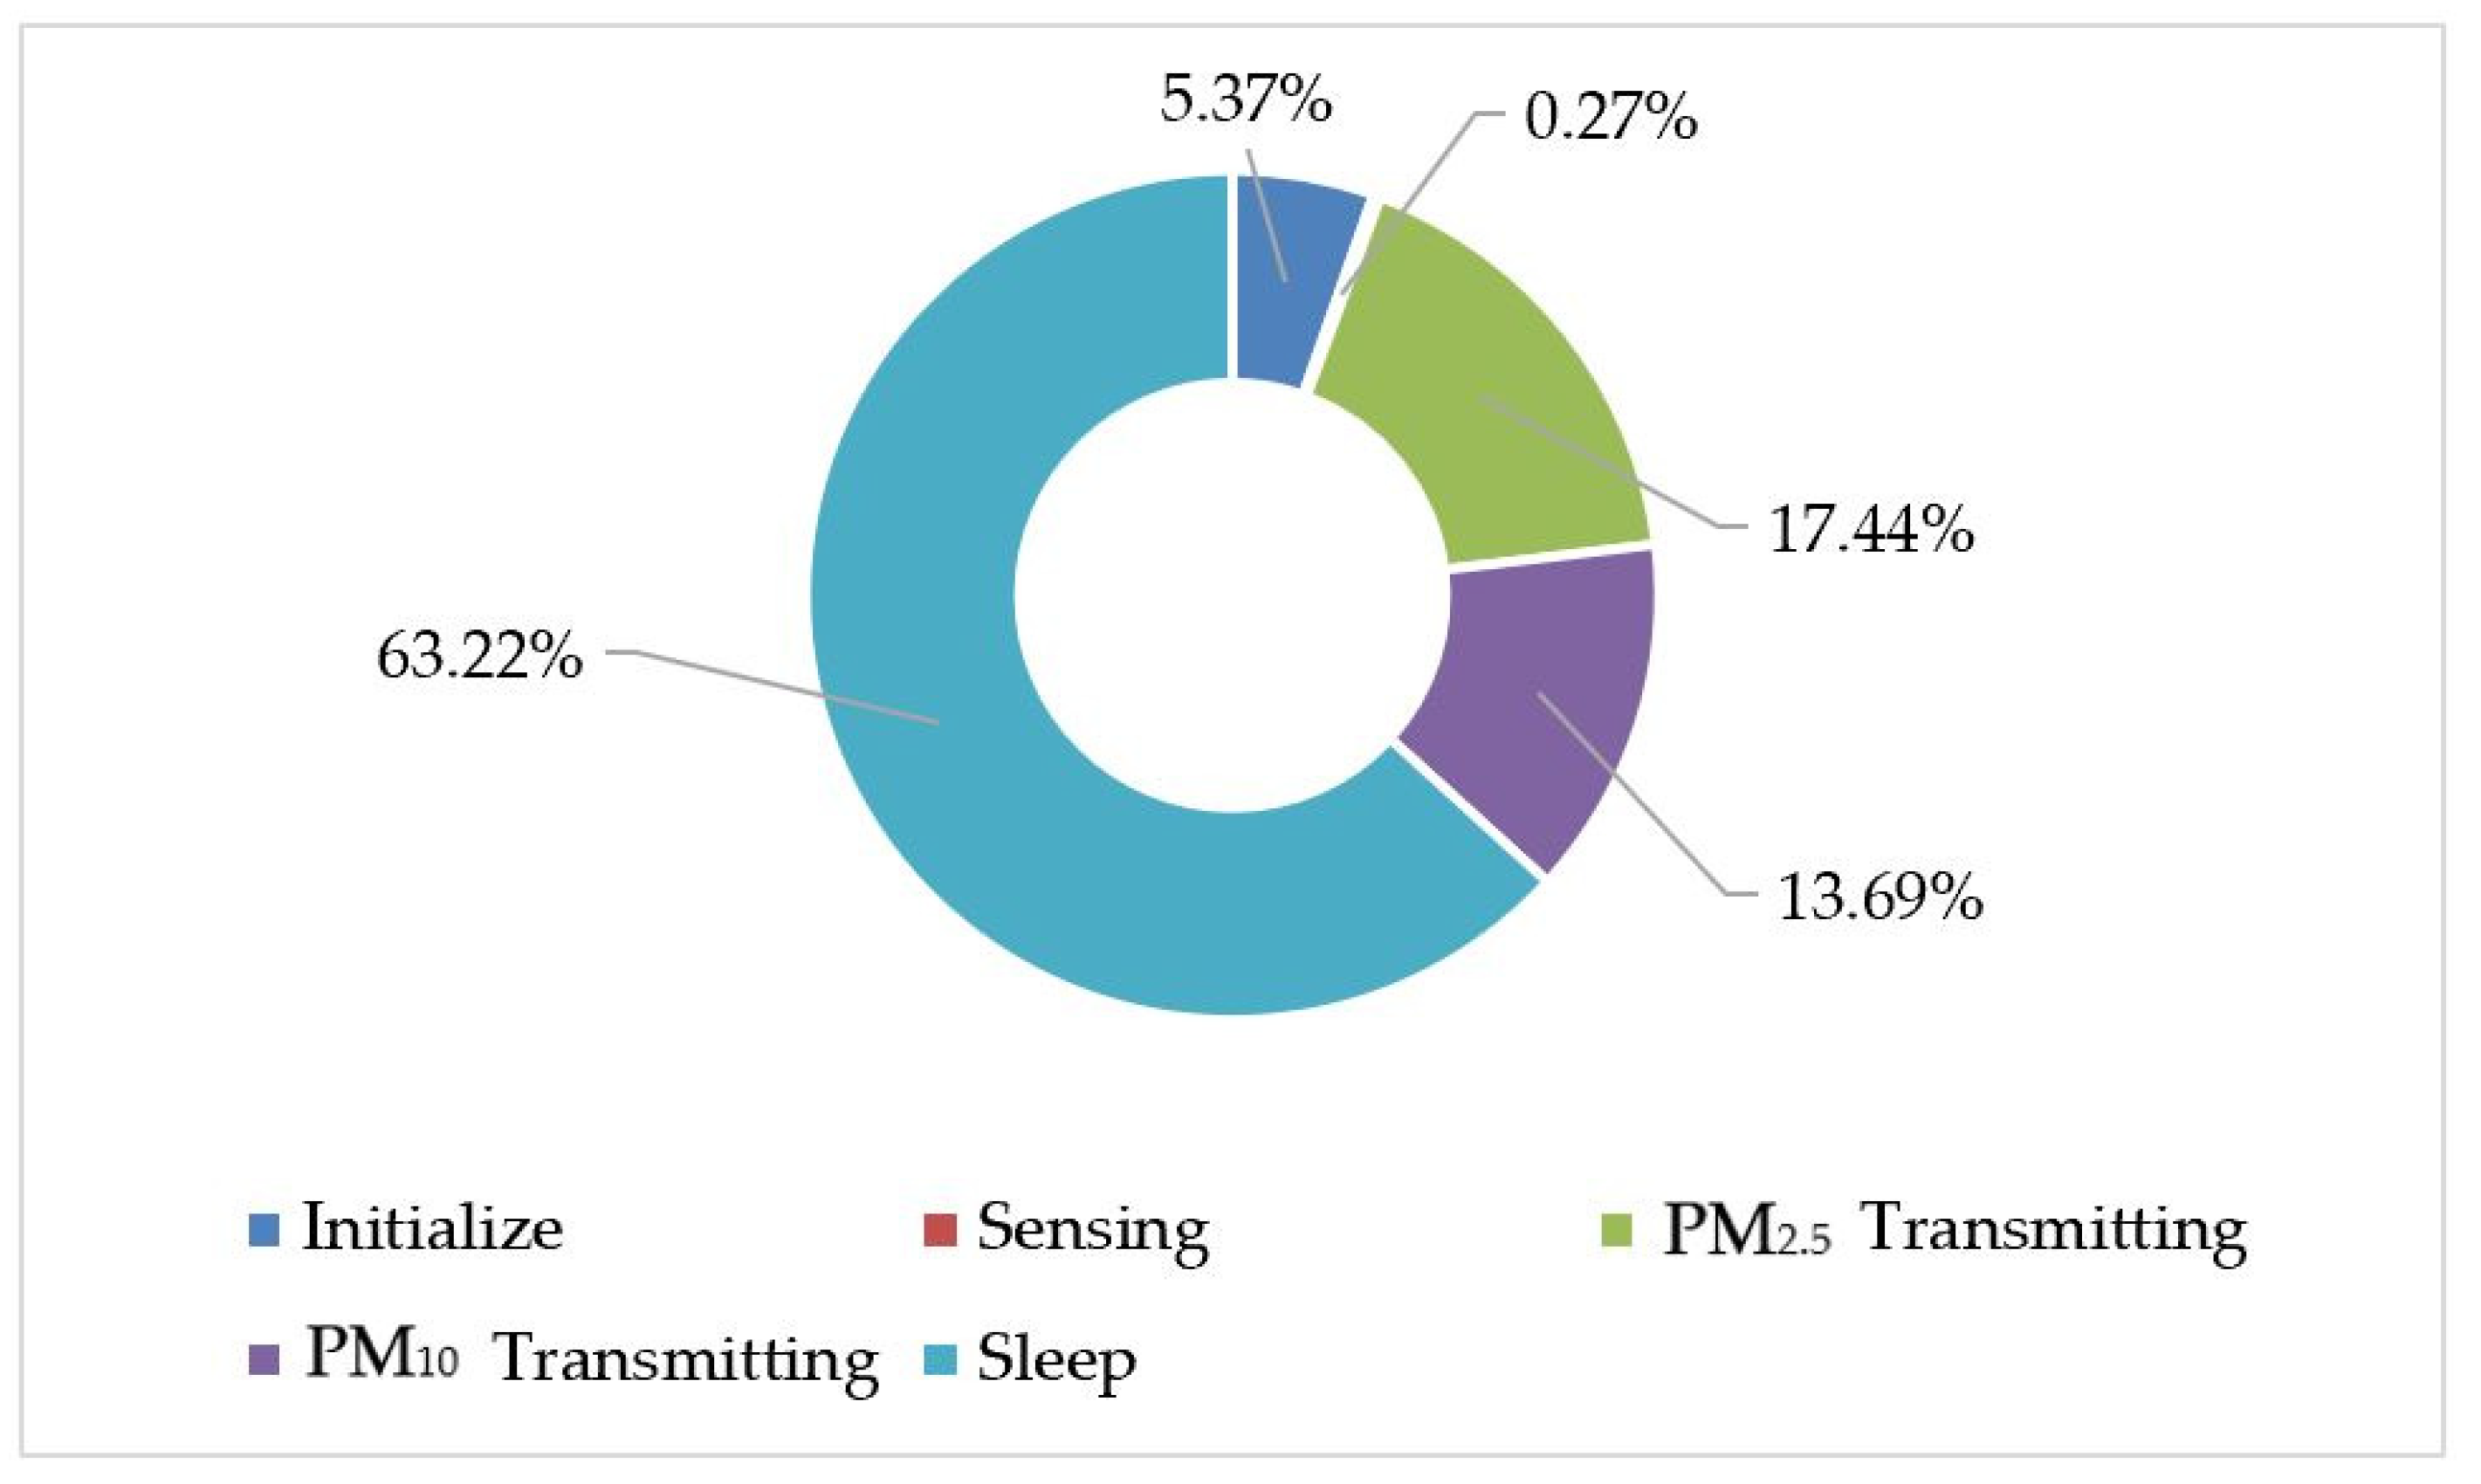
3.5.2. Time Consumption
3.5.3. The Energy Capacity
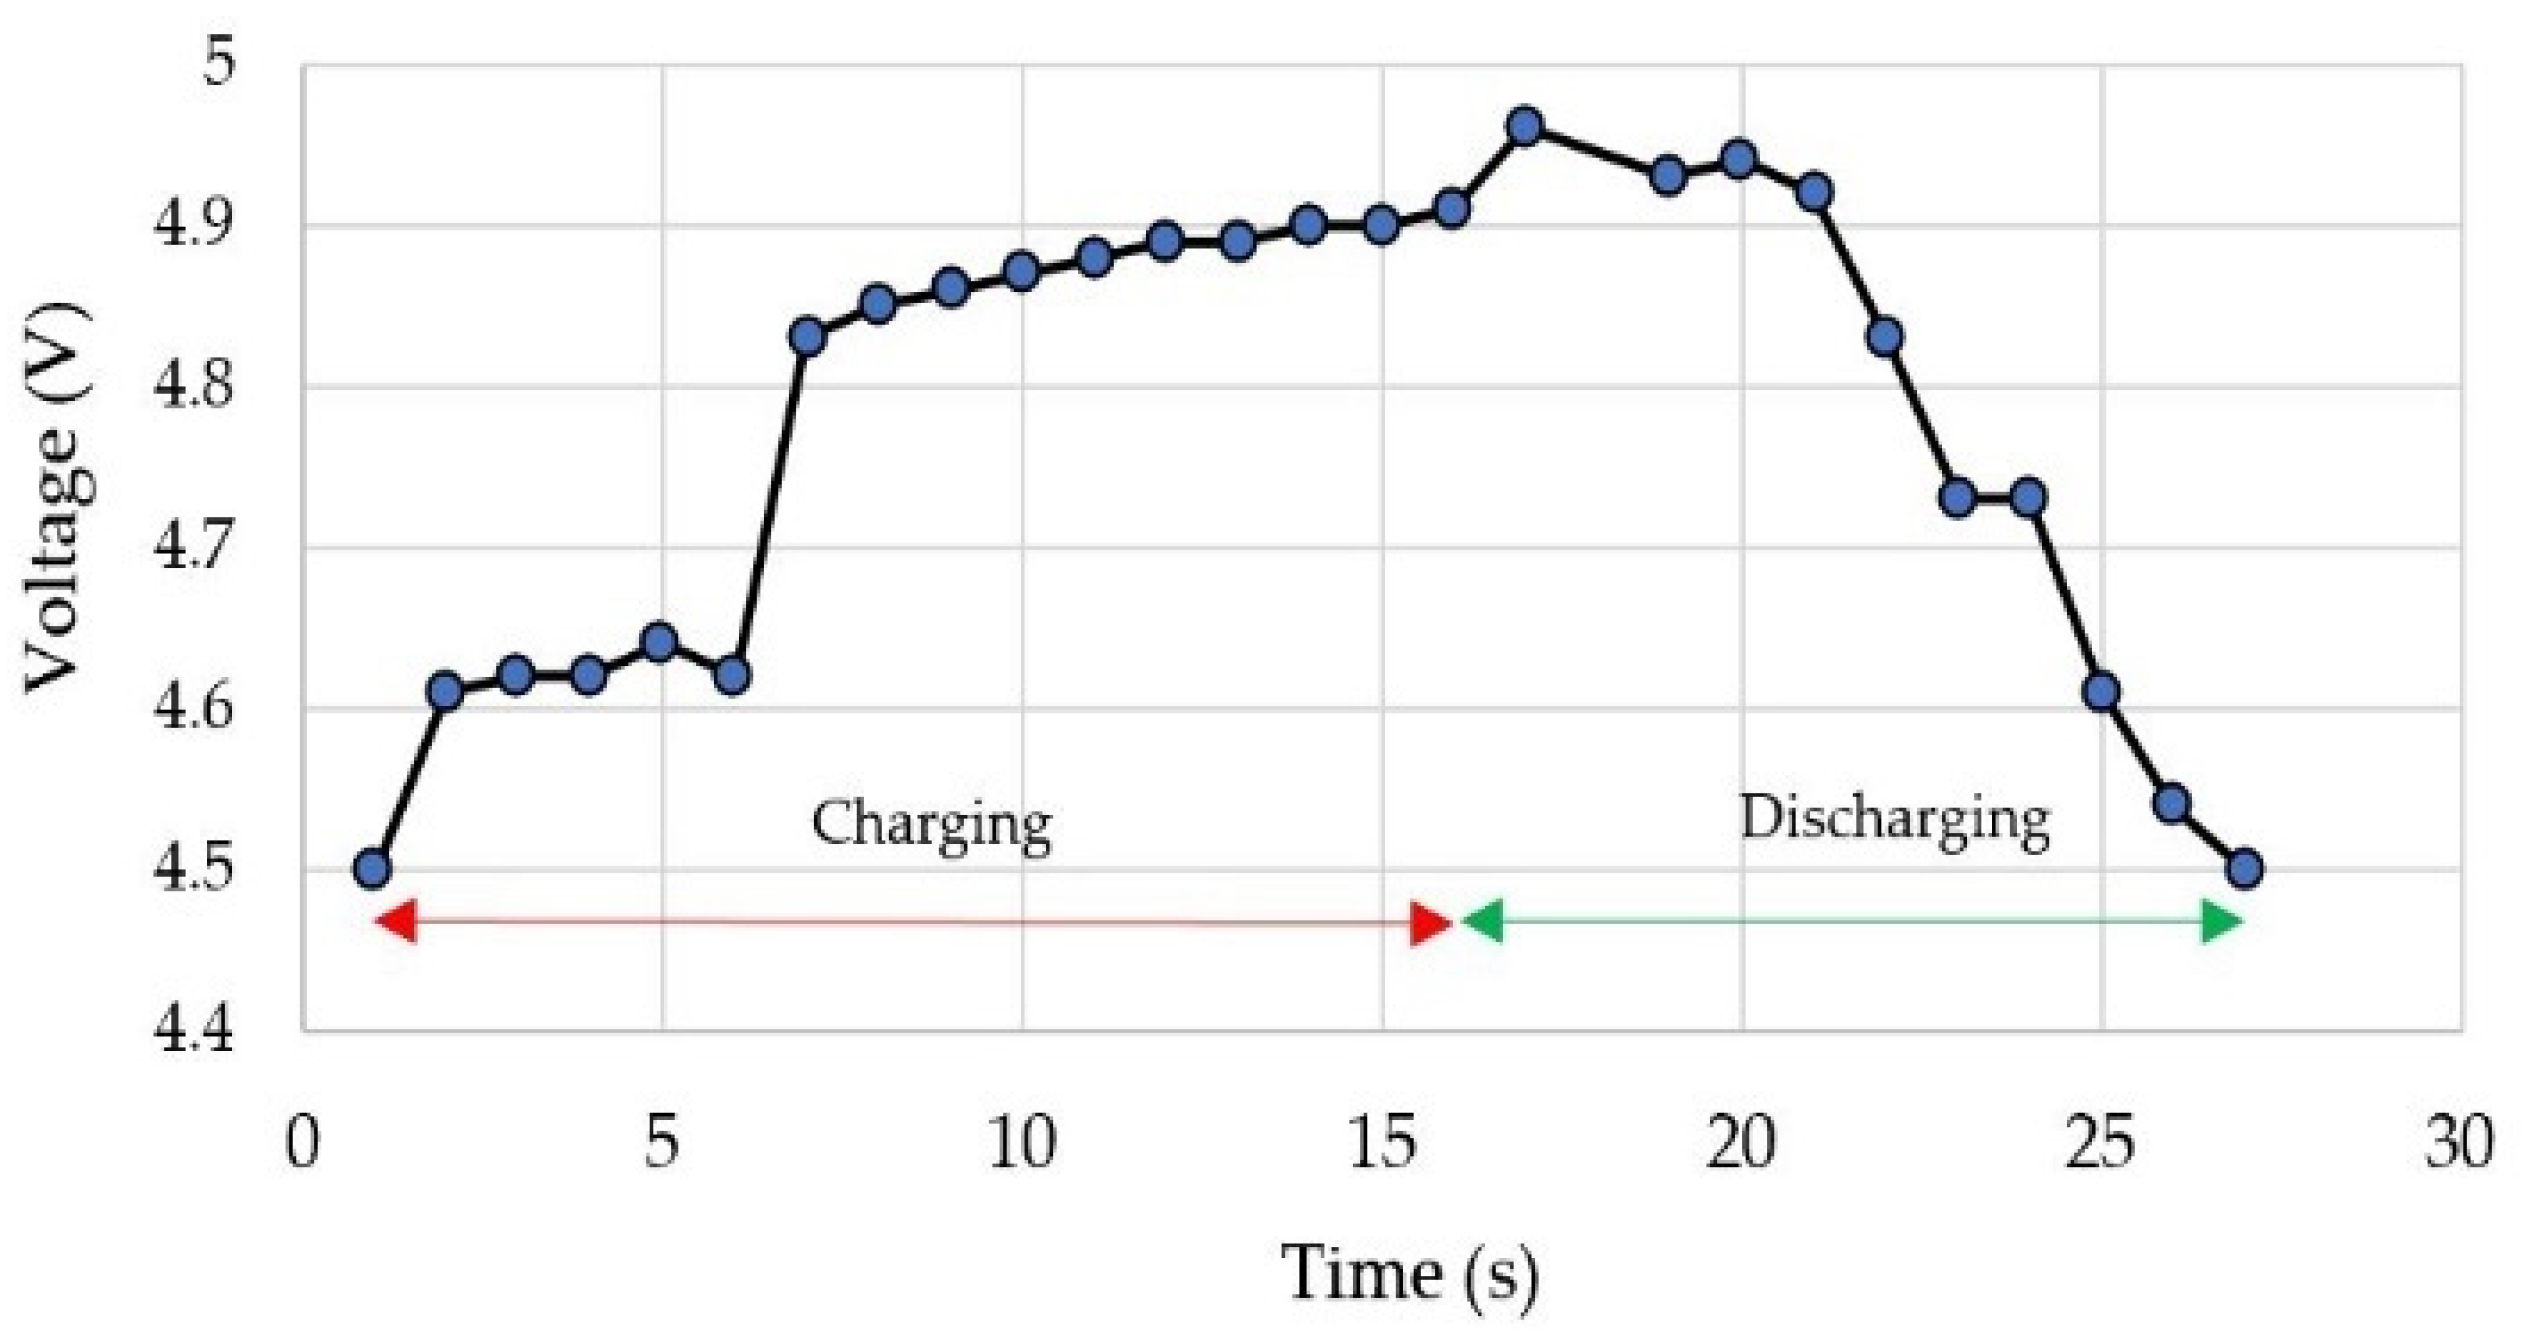
3.5.4. Power Storage Testing
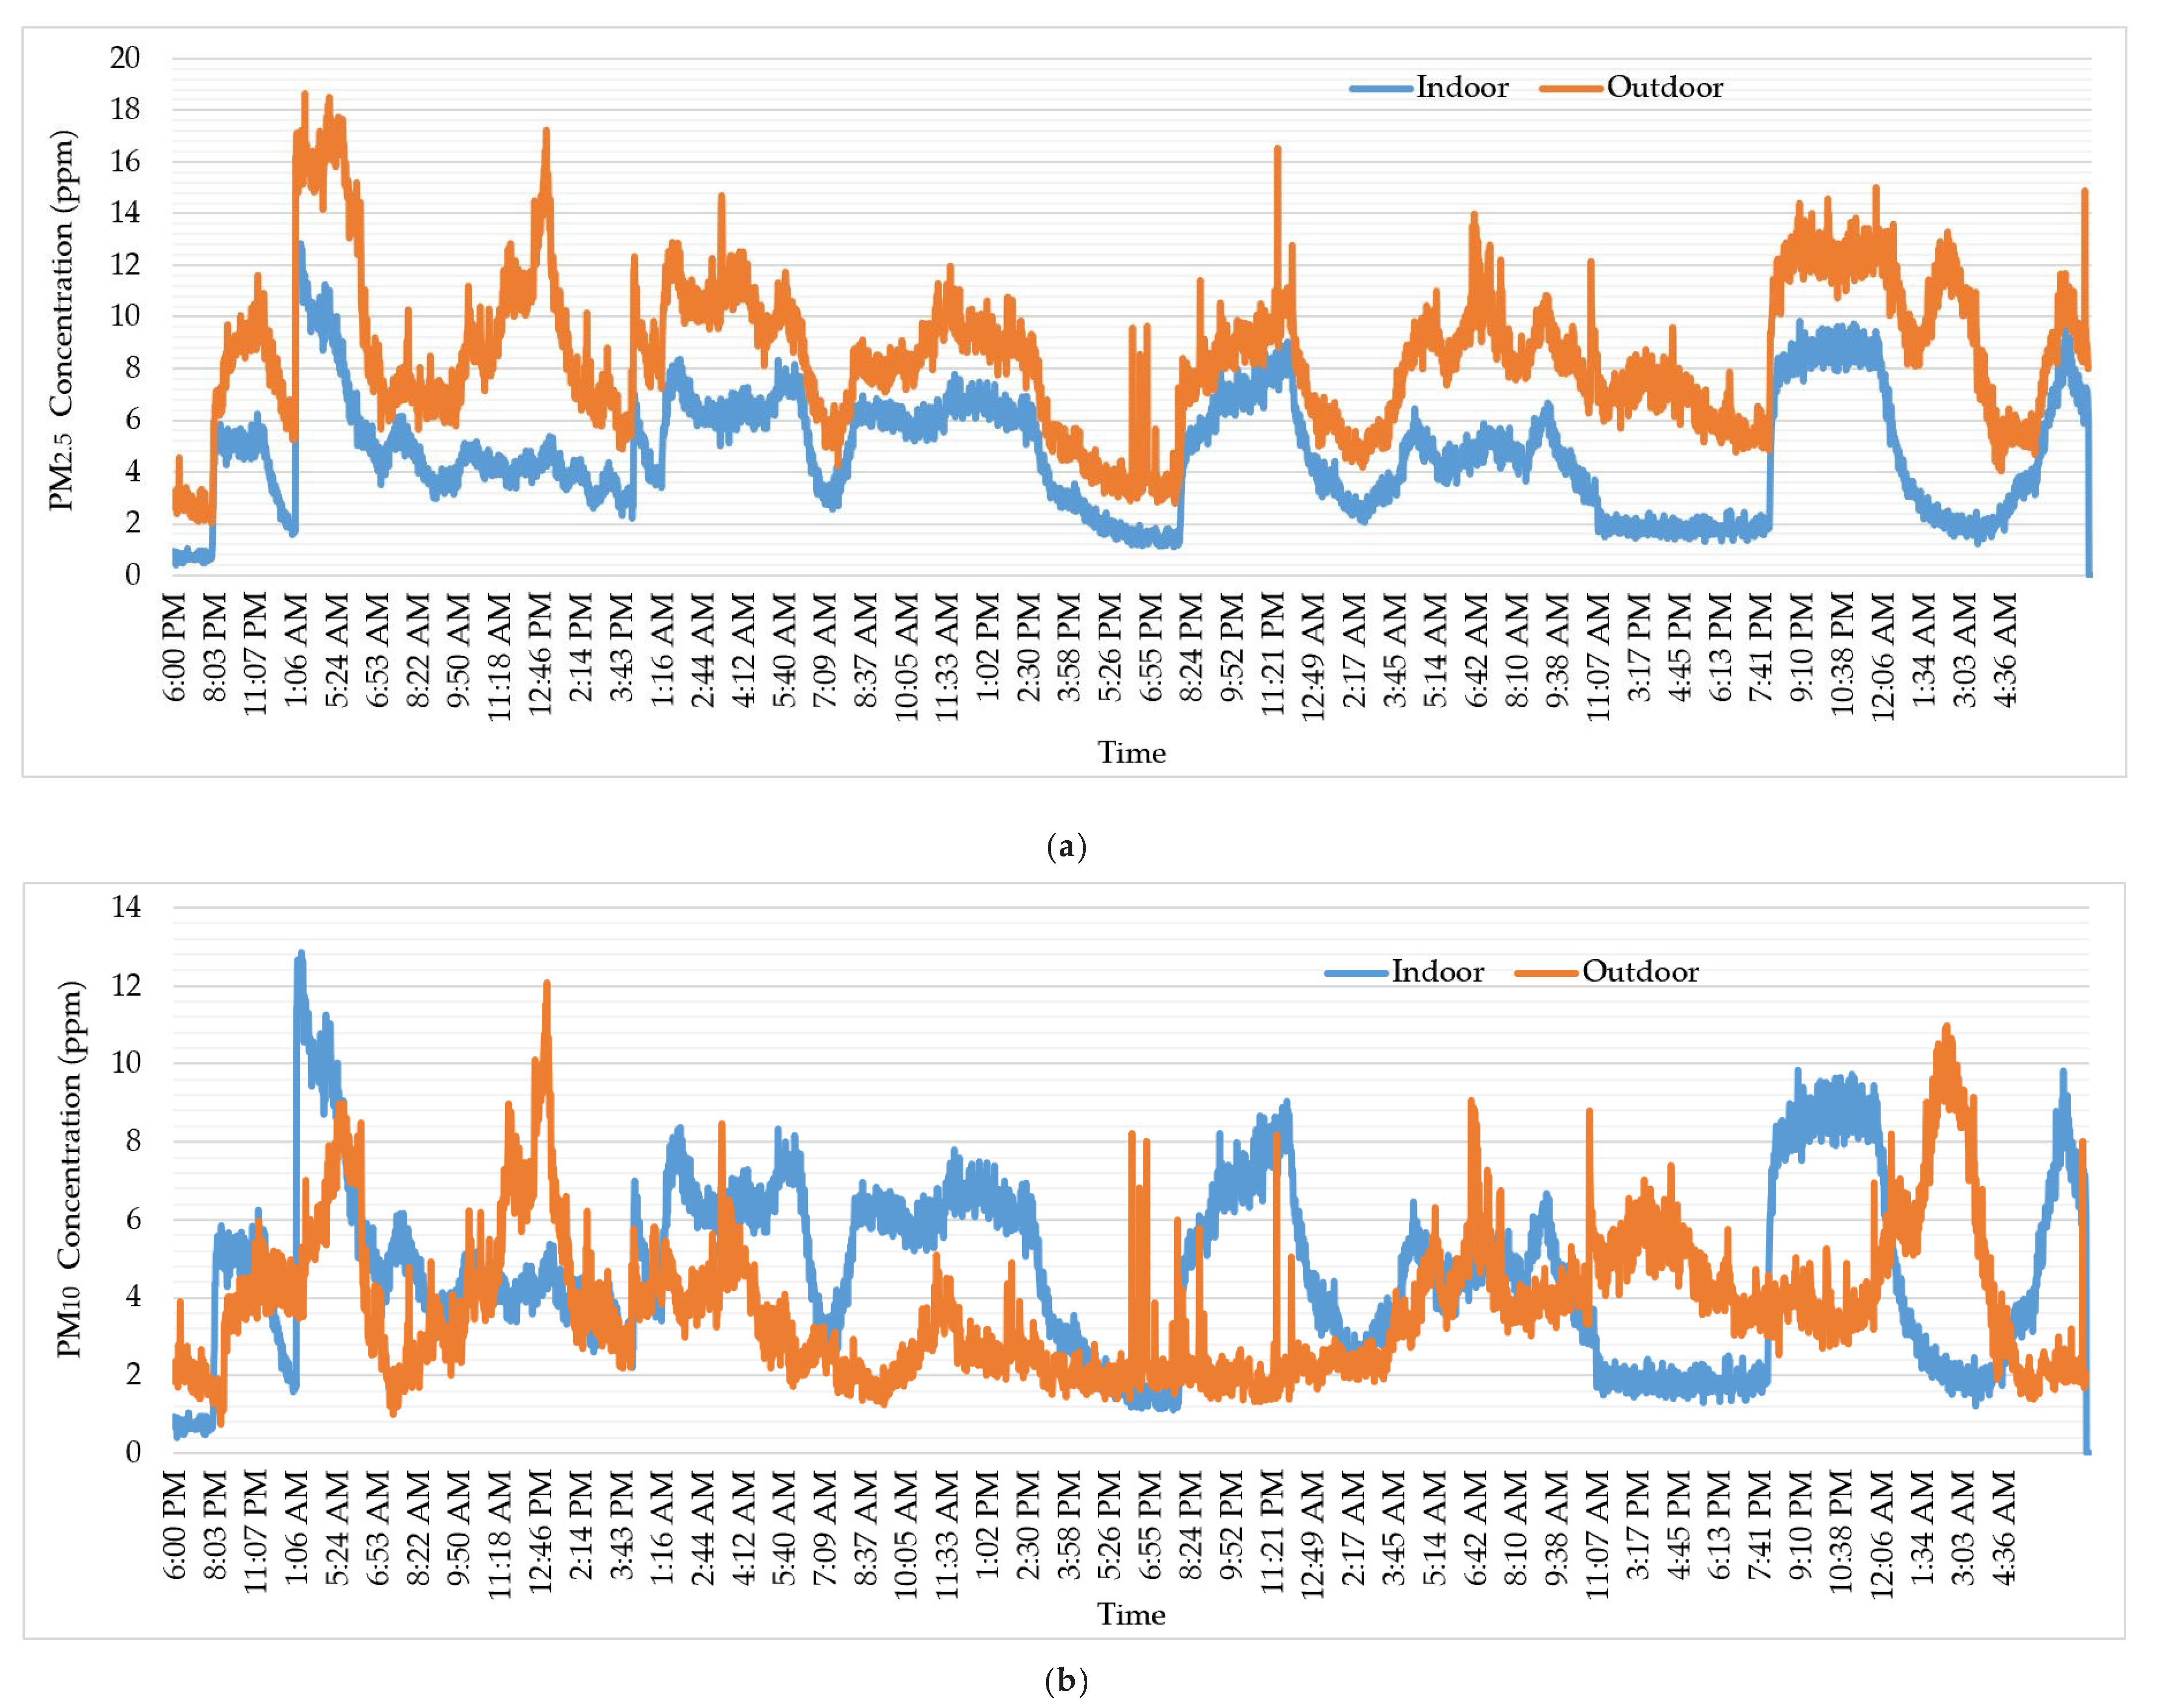
3.6. PM Concentration Measurement Experiment
3.6.1. Configuration
3.6.2. Measurement Result
4. Conclusions
Author Contributions
Funding
Institutional Review Board Statement
Informed Consent Statement
Data Availability Statement
Acknowledgments
Conflicts of Interest
References
- Anderson, J.O.; Thundiyil, J.G.; Stolbach, A. Clearing the Air: A Review of the Effects of Particulate Matter Air Pollution on Human Health. J. Med. Toxicol. 2011, 8, 166–175. [Google Scholar] [CrossRef] [Green Version]
- World Health Organization. Who Guidelines for Indoor Air Quality: Selected Pollutants; WHO: Copenhagen, Denmark, 2010; ISBN 978-92-890-0213-4. [Google Scholar]
- Jiang, X.-Q.; Mei, X.-D.; Feng, D. Air pollution and chronic airway diseases: What should people know and do? J. Thorac. Dis. 2016, 8, E31–E40. [Google Scholar] [CrossRef]
- Pope, C.A., III; Dockery, D.W. Health Effects of Fine Particulate Air Pollution: Lines that Connect. J. Air Waste Manag. Assoc. 2006, 56, 709–742. [Google Scholar] [CrossRef]
- Pope, C.A. Epidemiology of fine particulate air pollution and human health: Biologic mechanisms and who’s at risk? Environ. Health Perspect. 2000, 108, 713–723. [Google Scholar] [CrossRef]
- Brook, R.D.; Franklin, B.; Cascio, W.; Hong, Y.L.; Howard, G.; Lipsett, M.; Luepker, R.; Mittleman, M.; Samet, J.; Smith, S.C.; et al. Air pollution and cardiovascular disease—A statement for healthcare professionals from the expert panel on population and prevention science of the American Heart Association. Circulation 2004, 109, 2655–2671. [Google Scholar] [CrossRef]
- Sørensen, M.; Daneshvar, B.; Hansen, M.; Dragsted, L.O.; Hertel, O.; Knudsen, L.; Loft, S. Personal PM2.5 Exposure and Markers of Oxidative Stress in Blood. Environ. Health Perspect. 2002, 111, 161–165. [Google Scholar] [CrossRef] [Green Version]
- Brook, R.D.; Rajagopalan, S.; Pope, C.A., 3rd; Brook, J.R.; Bhatnagar, A.; Diez-Roux, A.V.; Holguin, F.; Hong, Y.; Luepker, R.V.; Mittleman, M.A.; et al. Particulate Matter Air Pollution and Cardiovascular Disease: An update to the scientific statement from the american heart association. Circulation 2010, 121, 2331–2378. [Google Scholar] [CrossRef] [Green Version]
- Klepeis, N.E.; Hughes, S.; Edwards, R.D.; Allen, T.; Johnson, M.; Chowdhury, Z.; Smith, K.R.; Boman-Davis, M.; Bellettiere, J.; Hovell, M.F. Promoting Smoke-Free Homes: A Novel Behavioral Intervention Using Real-Time Audio-Visual Feedback on Airborne Particle Levels. PLoS ONE 2013, 8, e73251. [Google Scholar] [CrossRef]
- Spengler, J.D.; Sexton, K. Indoor Air Pollution: A Public Health Perspective. Science 1983, 221, 9–17. [Google Scholar] [CrossRef]
- Zhang, J.F.; Smith, K.R. Indoor air pollution: A global health concern. Br. Med. Bull. 2003, 68, 209–225. [Google Scholar] [CrossRef]
- Zhu, Y.; Yang, L.; Meng, C.; Yuan, Q.; Yan, C.; Dong, C.; Sui, X.; Yao, L.; Yang, F.; Lu, Y.; et al. Indoor/outdoor relationships and diurnal/nocturnal variations in water-soluble ion and PAH concentrations in the atmospheric PM2.5 of a business office area in Jinan, a heavily polluted city in China. Atmos. Res. 2015, 153, 276–285. [Google Scholar] [CrossRef]
- Burnett, R.T.; Pope, C.A., III; Ezzati, M.; Olives, C.; Lim, S.S.; Mehta, S.; Shin, H.H.; Singh, G.; Hubbell, B.; Brauer, M.; et al. An Integrated Risk Function for Estimating the Global Burden of Disease Attributable to Ambient Fine Particulate Matter Exposure. Environ. Health Perspect. 2014, 122, 397–403. [Google Scholar] [CrossRef]
- Shaddick, G.; Thomas, M.; Mudu, P.; Ruggeri, G.; Gumy, S. Half the World’s Population Are Exposed to Increasing Air Pollution. NPJ Clim. Atmos. Sci. 2020, 3, 23. [Google Scholar] [CrossRef]
- Goyal, R.; Kumar, P. Indoor–outdoor concentrations of particulate matter in nine microenvironments of a mix-use commercial building in megacity Delhi. Air Qual. Atmos. Health 2013, 6, 747–757. [Google Scholar] [CrossRef] [Green Version]
- Morawska, L.; He, C.; Hitchins, J.; Gilbert, D.; Parappukkaran, S. The relationship between indoor and outdoor airborne particles in the residential environment. Atmos. Environ. 2001, 35, 3463–3473. [Google Scholar] [CrossRef] [Green Version]
- Kumar, P.; Morawska, L. Energy-Pollution Nexus for Urban Buildings. Environ. Sci. Technol. 2013, 47, 7591–7592. [Google Scholar] [CrossRef] [Green Version]
- Ogen, Y. Assessing nitrogen dioxide (NO2) levels as a contributing factor to the coronavirus (COVID-19) fatality rate. Sci. Total. Environ. 2020, 726, 138605. [Google Scholar] [CrossRef]
- Zhu, Y.; Xie, J.; Huang, F.; Cao, L. Association between short-term exposure to air pollution and COVID-19 infection: Evidence from China. Sci. Total Environ. 2020, 727, 138704. [Google Scholar] [CrossRef]
- Wu, X.; Nethery, R.C.; Sabath, M.B.; Braun, D.; Dominici, F. Exposure to Air Pollution and COVID-19 Mortality in the United States: A Nationwide Cross-Sectional Study. Epidemiology 2020. [Google Scholar]
- Chen, H.; Guo, J.; Wang, C.; Luo, F.; Yu, X.; Zhang, W.; Li, J.; Zhao, D.; Xu, D.; Gong, Q.; et al. Clinical characteristics and intrauterine vertical transmission potential of COVID-19 infection in nine pregnant women: A retrospective review of medical records. Lancet 2020, 395, 809–815. [Google Scholar] [CrossRef] [Green Version]
- Wang, D.; Hu, B.; Hu, C.; Zhu, F.; Liu, X.; Zhang, J.; Wang, B.; Xiang, H.; Cheng, Z.; Xiong, Y.; et al. Clinical Characteristics of 138 Hospitalized Patients With 2019 Novel Coronavirus—Infected Pneumonia in Wuhan, China. JAMA 2020, 323, 1061–1069. [Google Scholar] [CrossRef]
- Demanega, I.; Mujan, I.; Singer, B.C.; Anđelković, A.S.; Babich, F.; Licina, D. Performance assessment of low-cost environmental monitors and single sensors under variable indoor air quality and thermal conditions. Build. Environ. 2020, 187, 107415. [Google Scholar] [CrossRef]
- Zou, Y.; Young, M.; Chen, J.; Liu, J.; May, A.; Clark, J.D. Examining the functional range of commercially available low-cost airborne particle sensors and consequences for monitoring of indoor air quality in residences. Indoor Air 2019, 30, 213–234. [Google Scholar] [CrossRef]
- Weyers, R.; Jang-Jaccard, J.; Moses, A.; Wang, Y.; Boulic, M.; Chitty, C.; Phipps, R.; Cunningham, C. Low-Cost Indoor Air Quality (IAQ) Platform for Healthier Classrooms in New Zealand: Engineering Issues. In Proceedings of the 2017 4th Asia-Pacific World Congress on Computer Science and Engineering (APWC on CSE), Nadi, Fiji, 11–13 December 2017; pp. 208–215. [Google Scholar]
- Wang, Y.; Boulic, M.; Phipps, R.; Chitty, C.; Moses, A.; Weyers, R.; Jang-Jaccard, J.; Olivares, G.; Ponder-Sutton, A.; Cunningham, C. Integrating Open-Source Technologies to Build a School Indoor Air Quality Monitoring Box (SKOMOBO). In Proceedings of the 2017 4th Asia-Pacific World Congress on Computer Science and Engineering (APWC on CSE), Nadi, Fiji, 11–13 December 2017; pp. 216–223. [Google Scholar]
- Taylor, M.D. A Low-Cost Particle Counter and Signal Processing Method for Indoor Air Pollution; Nourbakhsh, I.R., Ed.; WIT Press: València, Spain, 2015; pp. 337–348. [Google Scholar] [CrossRef] [Green Version]
- Tiele, A.; Esfahani, S.; Covington, J. Design and Development of a Low-Cost, Portable Monitoring Device for Indoor Environment Quality. J. Sens. 2018, 2018, 1–14. [Google Scholar] [CrossRef]
- Weekly, K.; Rim, D.; Zhang, L.; Bayen, A.M.; Nazaroff, W.W.; Spanos, C.J. Low-Cost Coarse Airborne Particulate Matter Sensing for Indoor Occupancy Detection. In Proceedings of the 2013 IEEE International Conference on Automation Science and Engineering (CASE), Madison, WI, USA, 17–20 August 2013; pp. 32–37. [Google Scholar]
- Palmisani, J.; Di Gilio, A.; Viana, M.; de Gennaro, G.; Ferro, A. Indoor air quality evaluation in oncology units at two European hospitals: Low-cost sensors for TVOCs, PM2.5 and CO2 real-time monitoring. Build. Environ. 2021, 205, 108237. [Google Scholar] [CrossRef]
- Yin, H.; Zhai, X.; Ning, Y.; Li, Z.; Ma, Z.; Wang, X.; Li, A. Online monitoring of PM2.5 and CO2 in residential buildings under different ventilation modes in Xi’an city. Build. Environ. 2021, 207, 108453. [Google Scholar] [CrossRef]
- Dai, X.; Liu, J.; Li, X.; Zhao, L. Long-term monitoring of indoor CO2 and PM2.5 in Chinese homes: Concentrations and their relationships with outdoor environments. Build. Environ. 2018, 144, 238–247. [Google Scholar] [CrossRef]
- Curtius, J.; Granzin, M.; Schrod, J. Testing mobile air purifiers in a school classroom: Reducing the airborne transmission risk for SARS-CoV-2. Aerosol Sci. Technol. 2021, 55, 586–599. [Google Scholar] [CrossRef]
- Drossinos, Y.; Stilianakis, N.I. What aerosol physics tells us about airborne pathogen transmission. Aerosol Sci. Technol. 2020, 54, 639–643. [Google Scholar] [CrossRef]
- Buonanno, G.; Morawska, L.; Stabile, L. Quantitative assessment of the risk of airborne transmission of SARS-CoV-2 infection: Prospective and retrospective applications. Environ. Int. 2020, 145, 106112. [Google Scholar] [CrossRef]
- Miller, S.L.; Nazaroff, W.W.; Jimenez, J.L.; Boerstra, A.; Buonanno, G.; Dancer, S.J.; Kurnitski, J.; Marr, L.C.; Morawska, L.; Noakes, C. Transmission of SARS-CoV-2 by inhalation of respiratory aerosol in the Skagit Valley Chorale superspreading event. Indoor Air 2020, 31, 314–323. [Google Scholar] [CrossRef]
- Morawska, L.; Cao, J. Airborne transmission of SARS-CoV-2: The world should face the reality. Environ. Int. 2020, 139, 105730. [Google Scholar] [CrossRef]
- Cole, M.A.; Ozgen, C.; Strobl, E. Air Pollution Exposure and COVID-19 in Dutch Municipalities. Environ. Resour. Econ. 2020, 76, 581–610. [Google Scholar] [CrossRef]
- Setti, L.; Passarini, F.; De Gennaro, G.; Barbieri, P.; Pallavicini, A.; Ruscio, M.; Piscitelli, P.; Colao, A.; Miani, A. Searching for SARS-COV-2 on Particulate Matter: A Possible Early Indicator of COVID-19 Epidemic Recurrence. Int. J. Environ. Res. Public Health 2020, 17, 2986. [Google Scholar] [CrossRef]
- Farhangrazi, Z.S.; Sancini, G.; Hunter, A.C.; Moghimi, S.M. Airborne Particulate Matter and SARS-CoV-2 Partnership: Virus Hitchhiking, Stabilization and Immune Cell Targeting—A Hypothesis. Front. Immunol. 2020, 11, 579352. [Google Scholar] [CrossRef]
- Coronavirus Transmission Indoors Via Airborne Particles; Pure Air Control Services Inc.: Clearwater, FL, USA, 2020; Available online: https://pureaircontrols.com/coronavirus-transmission-indoors-via-airborne-particles/ (accessed on 11 June 2022).
- Cheng, Y.; Lee, S.; Gu, Z.; Ho, K.; Zhang, Y.; Huang, Y.; Chow, J.C.; Watson, J.G.; Cao, J.; Zhang, R. PM2.5 and PM10-2.5 chemical composition and source apportionment near a Hong Kong roadway. Particuology 2015, 18, 96–104. [Google Scholar] [CrossRef]
- Gopalakrishnan, P.; Saravanakumar, P.; Joshi, N.N.; Harish, B.; Jeyanthi, J. Review on indoor air quality in Indianbuildings. IOP Conf. Ser. Mater. Sci. Eng. 2021, 1145, 012037. [Google Scholar] [CrossRef]
- SPS30—PM2.5 Sensor for HVAC and Air Quality Applications SPS30. Available online: https://sensirion.com/products/catalog/SPS30/ (accessed on 13 May 2022).
- ATMEGA4808|Microchip Technology. Available online: https://www.microchip.com/en-us/product/ATMEGA4808# (accessed on 30 May 2022).
- ATmega4808/4809 Data Sheet. Available online: https://onlinedocs.microchip.com/pr/GUID-4E9DA219-611B-4772-B5D3-9ED908198864-en-US-16/index.html?GUID-0E8898B7-7398-4EBA-A96F-7E9353ECE5E4 (accessed on 30 May 2022).
- ATWINC1510-IC|Microchip Technology. Available online: https://www.microchip.com/en-us/product/ATWINC1510-IC# (accessed on 30 May 2022).
- Kuncoro, C.B.D.; Permana, A.F.; Asyikin, M.B.Z.; Adristi, C. Smart Wireless Climate Sensor Node for Indoor Comfort Quality Monitoring Application. Energies 2022, 15, 2939. [Google Scholar] [CrossRef]


| Study | Application | Parameter | Sensor Module | Communication Module | Power Consumption | Dimension |
|---|---|---|---|---|---|---|
| Demanega et al. [23], 2020 | IAQ monitoring under controlled air pollution and thermal condition | PM, CO2, TVOC, temperature, and relative humidity | Sensirion SPS30, Alphasense OPC-R1, Alphasense OPC-N3, and NovaFitness SDS018 | N/A | N/A | N/A |
| Zou et al. [24], 2020 | IAQ/chamber monitoring. | Incense, burnt, smoke, and toast particle | HPMA115S0 | N/A | N/A | N/A |
| Weyers et al. [25], 2017 | IAQ monitoring | PM | SMPS 3938 and APS 3321 | Wi-Fi | 5 V 500 mA | 100 mm × 100 mm × 100 mm |
| Wang et al. [26], 2017 | IAQ monitoring in the classroom environment | Temperature and relative humidity, CO2, PM, and motion | T9602, SenseAir K30, PMS3003, and Duinotech XC-4444 | Wi-Fi | 5 V 2.5 Watts | 100 mm × 100 mm × 100 mm |
| Taylor et al. [27], 2015 | Indoor fine particulate matter measurement | PM | DSM501 | USB, Wi-Fi | 5 V 500 mA | 114.3 mm × 88.9 mm × 93.98 mm |
| Tiele et al. [28], 2018 | IAQ monitoring | Temperature and relative humidity, TVOCs, CO2, PM2.5, PM10, CO, illuminance, and sound level. | HPMA115S0, CCS811, T6713, LLC110-102, and SHT31 | I2C, UART, SPI | 5 V 103 mA | 165 mm × 105 mm × 55 mm |
| Weekly et al. [29], 2013 | Coarse airborne particulate matter sensing | PM | PPD-20V and DSM301A | 802.15.4 transceiver (Digi XBee series) | 5 V 150 mA | 120 mm × 100 mm |
| Sensor Module | Application & Parameter | Power Consumption | Dimension | Communication Configuration | Study |
|---|---|---|---|---|---|
| Corvus IAQ monitor |
| 15 Watts, 12 VDC | 68 mm × 176 mm × 123 mm | Mesh wireless network with a frequency of 2.4 MHz | Palmisan et al. [30], 2021 |
| IKAIR |
| 6 Watts, 12 VDC | 90 mm × 90 mm × 20 mm | Wi-Fi | Yin et al. [31], 2022 Dai et al. [32], 2018 |
| Features | Value |
|---|---|
| The range of operating voltage | 1.8–5.5 V |
| The range of operating current | |
| 1.2 µA–11.4 mA |
| 1.8 µA–2.8 mA |
| 0.7 µA (typical), 16 µA (maximum) |
| 0.1 µA (typical), 15 µA (maximum) |
| Analog to Digital Converter (ADC) | |
| 1 |
| 12 |
| 10 bits |
| Interface | I2C, serial peripheral interface (SPI), UART/Universal Synchronous/Asynchronous Receiver/Transmitter (USART) |
| Package | 28- and 32-pin |
| Features | Value |
|---|---|
| Antenna | Printed antenna, a micro co-ax (u.Fl) |
| Operating frequency | 2.412–2.472 MHz |
| The range of operating voltage | 3.0–4.2 V |
| The operating current | |
| 287 mA |
| 83 mA |
| Sleep Mode | 4 uA |
| Flash memory | 4 MB |
| External clock sources Package | High-speed crystal oscillator (26 MHz) Quad-Flat No-Leads (QFN) |
| Features | Value |
|---|---|
| The lifetime of recharge cycle | >106 cycles |
| The rate of self-discharge | 30% |
| Voltage | 0 V–2.7 V |
| The energy density (Wh/m3) | low (0.8–10) |
| The power density (W/m3) | high (400–500) |
| The range of charging time | Sec–min |
| The range of discharging time | <a few min |
| The changing circuit | simple |
| Sensor Node (ppm) | Validator (ppm) | Error (ppm) | Absolute Percentage Error (%) | ||||
|---|---|---|---|---|---|---|---|
| PM2.5 | PM10 | PM2.5 | PM10 | PM2.5 | PM10 | PM2.5 | PM10 |
| 3.14 | 3.14 | 3.00 | 3.00 | −0.14 | −0.14 | 4.67 | 4.67 |
| 3.15 | 3.15 | 3.00 | 3.00 | −0.15 | −0.15 | 5.00 | 5.00 |
| 3.14 | 3.14 | 3.00 | 3.00 | −0.14 | −0.14 | 4.67 | 4.67 |
| 2.84 | 2.84 | 3.00 | 3.00 | 0.16 | 0.16 | 5.33 | 5.33 |
| 2.94 | 2.94 | 3.00 | 3.00 | 0.06 | 0.06 | 2.00 | 2.00 |
| 3.08 | 3.08 | 3.00 | 3.00 | −0.08 | −0.08 | 2.67 | 2.67 |
| Average Error | −0.05 | −0.05 | |||||
| Average Percentage Error | 4.06 | 4.06 | |||||
| Process | Description |
|---|---|
| Initializing | All variable preparation and disable low power mode |
| Sensing | Sensor node working to measure PM concentration |
| PM2.5 data transmitting | Transmit PM2.5 data to the server |
| PM10 data transmitting | Transmit PM10 data to the server |
| Sleep | Enable low-power mode |
| Process | Voltage (V) | Current (mA) | Power (mW) | Time (ms) | Energy Capacity Required (mWh) |
|---|---|---|---|---|---|
| Initializing | 4.68 | 104.9 | 490.93 | 662 | 0.0903 |
| Sensing | 4.68 | 123.86 | 579.66 | 28 | 0.0045 |
| PM2.5 transmitting | 4.68 | 131.3 | 614.48 | 1716.6 | 0.293 |
| PM10 transmitting | 4.68 | 130.7 | 611.68 | 1354 | 0.23 |
| Sleep | 4.68 | 81.7 | 382.36 | 10,000 | 1.0621 |
| Total Energy Required (one cycle) | 1.68 | ||||
Publisher’s Note: MDPI stays neutral with regard to jurisdictional claims in published maps and institutional affiliations. |
© 2022 by the authors. Licensee MDPI, Basel, Switzerland. This article is an open access article distributed under the terms and conditions of the Creative Commons Attribution (CC BY) license (https://creativecommons.org/licenses/by/4.0/).
Share and Cite
Kuncoro, C.B.D.; Adristi, C.; Asyikin, M.B.Z. Smart Wireless Particulate Matter Sensor Node for IoT-Based Strategic Monitoring Tool of Indoor COVID-19 Infection Risk via Airborne Transmission. Sustainability 2022, 14, 14433. https://doi.org/10.3390/su142114433
Kuncoro CBD, Adristi C, Asyikin MBZ. Smart Wireless Particulate Matter Sensor Node for IoT-Based Strategic Monitoring Tool of Indoor COVID-19 Infection Risk via Airborne Transmission. Sustainability. 2022; 14(21):14433. https://doi.org/10.3390/su142114433
Chicago/Turabian StyleKuncoro, C. Bambang Dwi, Cornelia Adristi, and Moch Bilal Zaenal Asyikin. 2022. "Smart Wireless Particulate Matter Sensor Node for IoT-Based Strategic Monitoring Tool of Indoor COVID-19 Infection Risk via Airborne Transmission" Sustainability 14, no. 21: 14433. https://doi.org/10.3390/su142114433