
Variation of Ground Surface Freezing/Thawing Index in China under the CMIP6 Warming Scenarios

Abstract
:1. Introduction
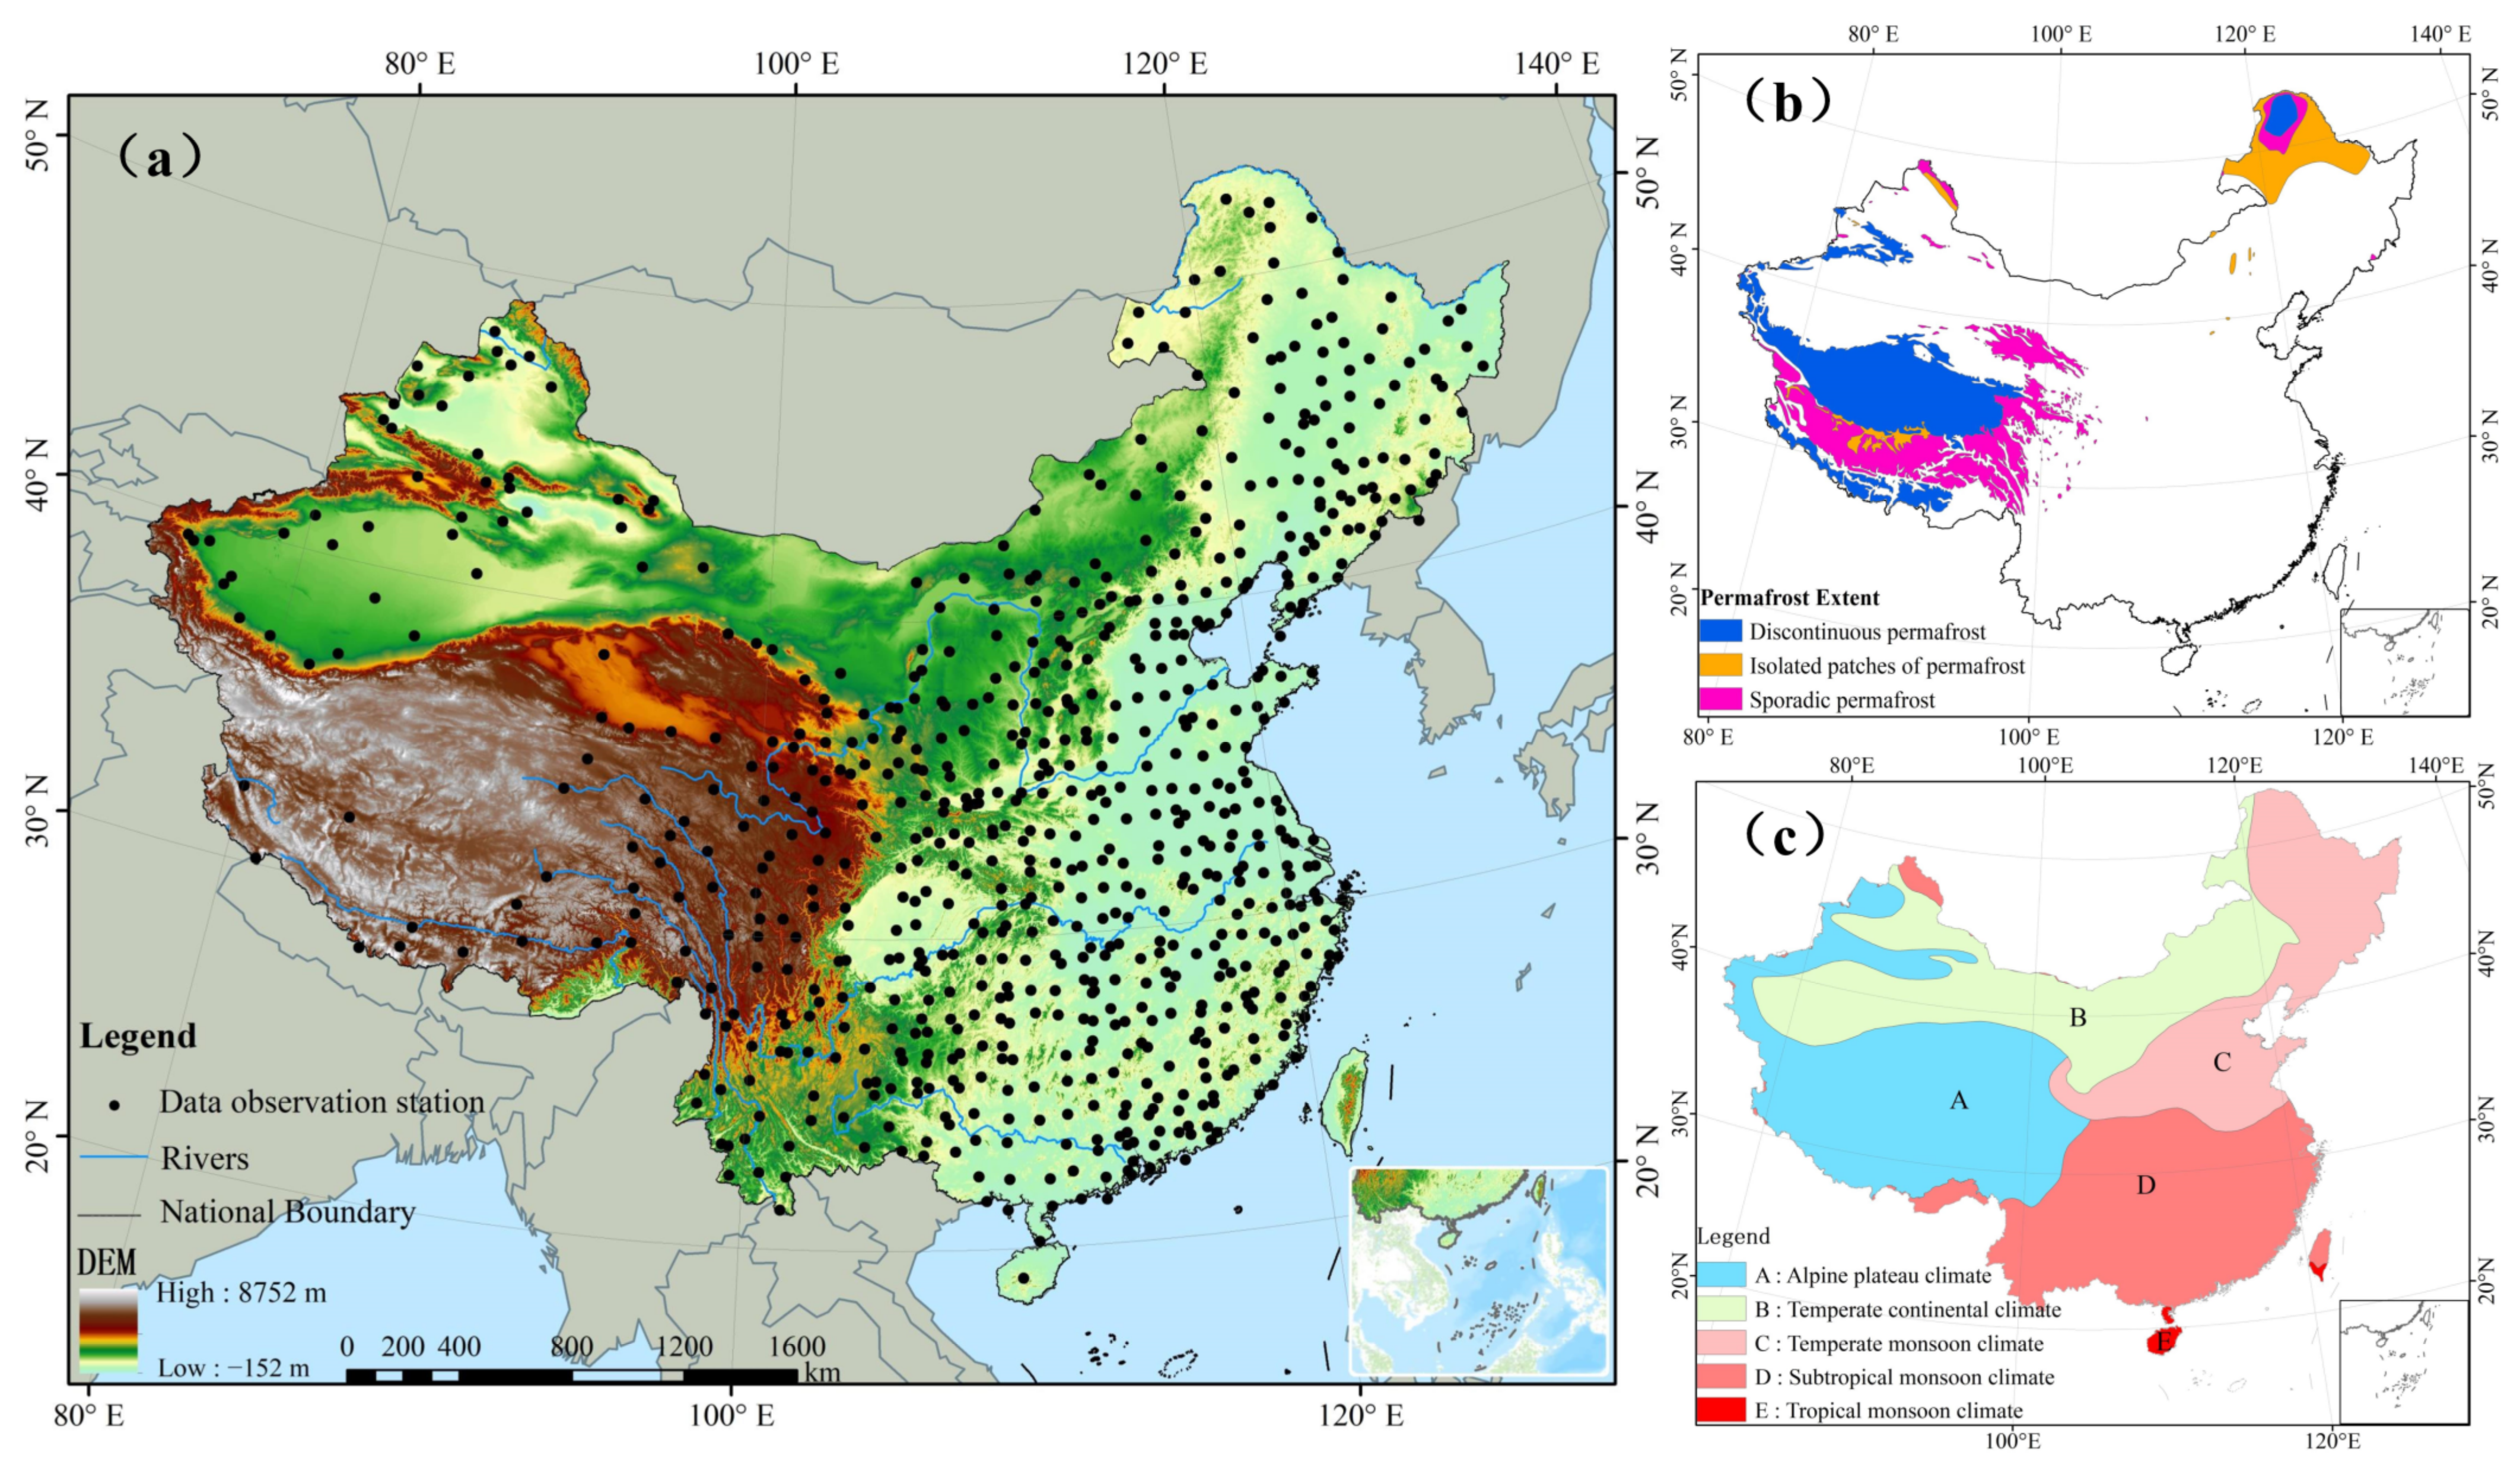
2. Data and Methods
2.1. Data
2.2. Methods
3. Results
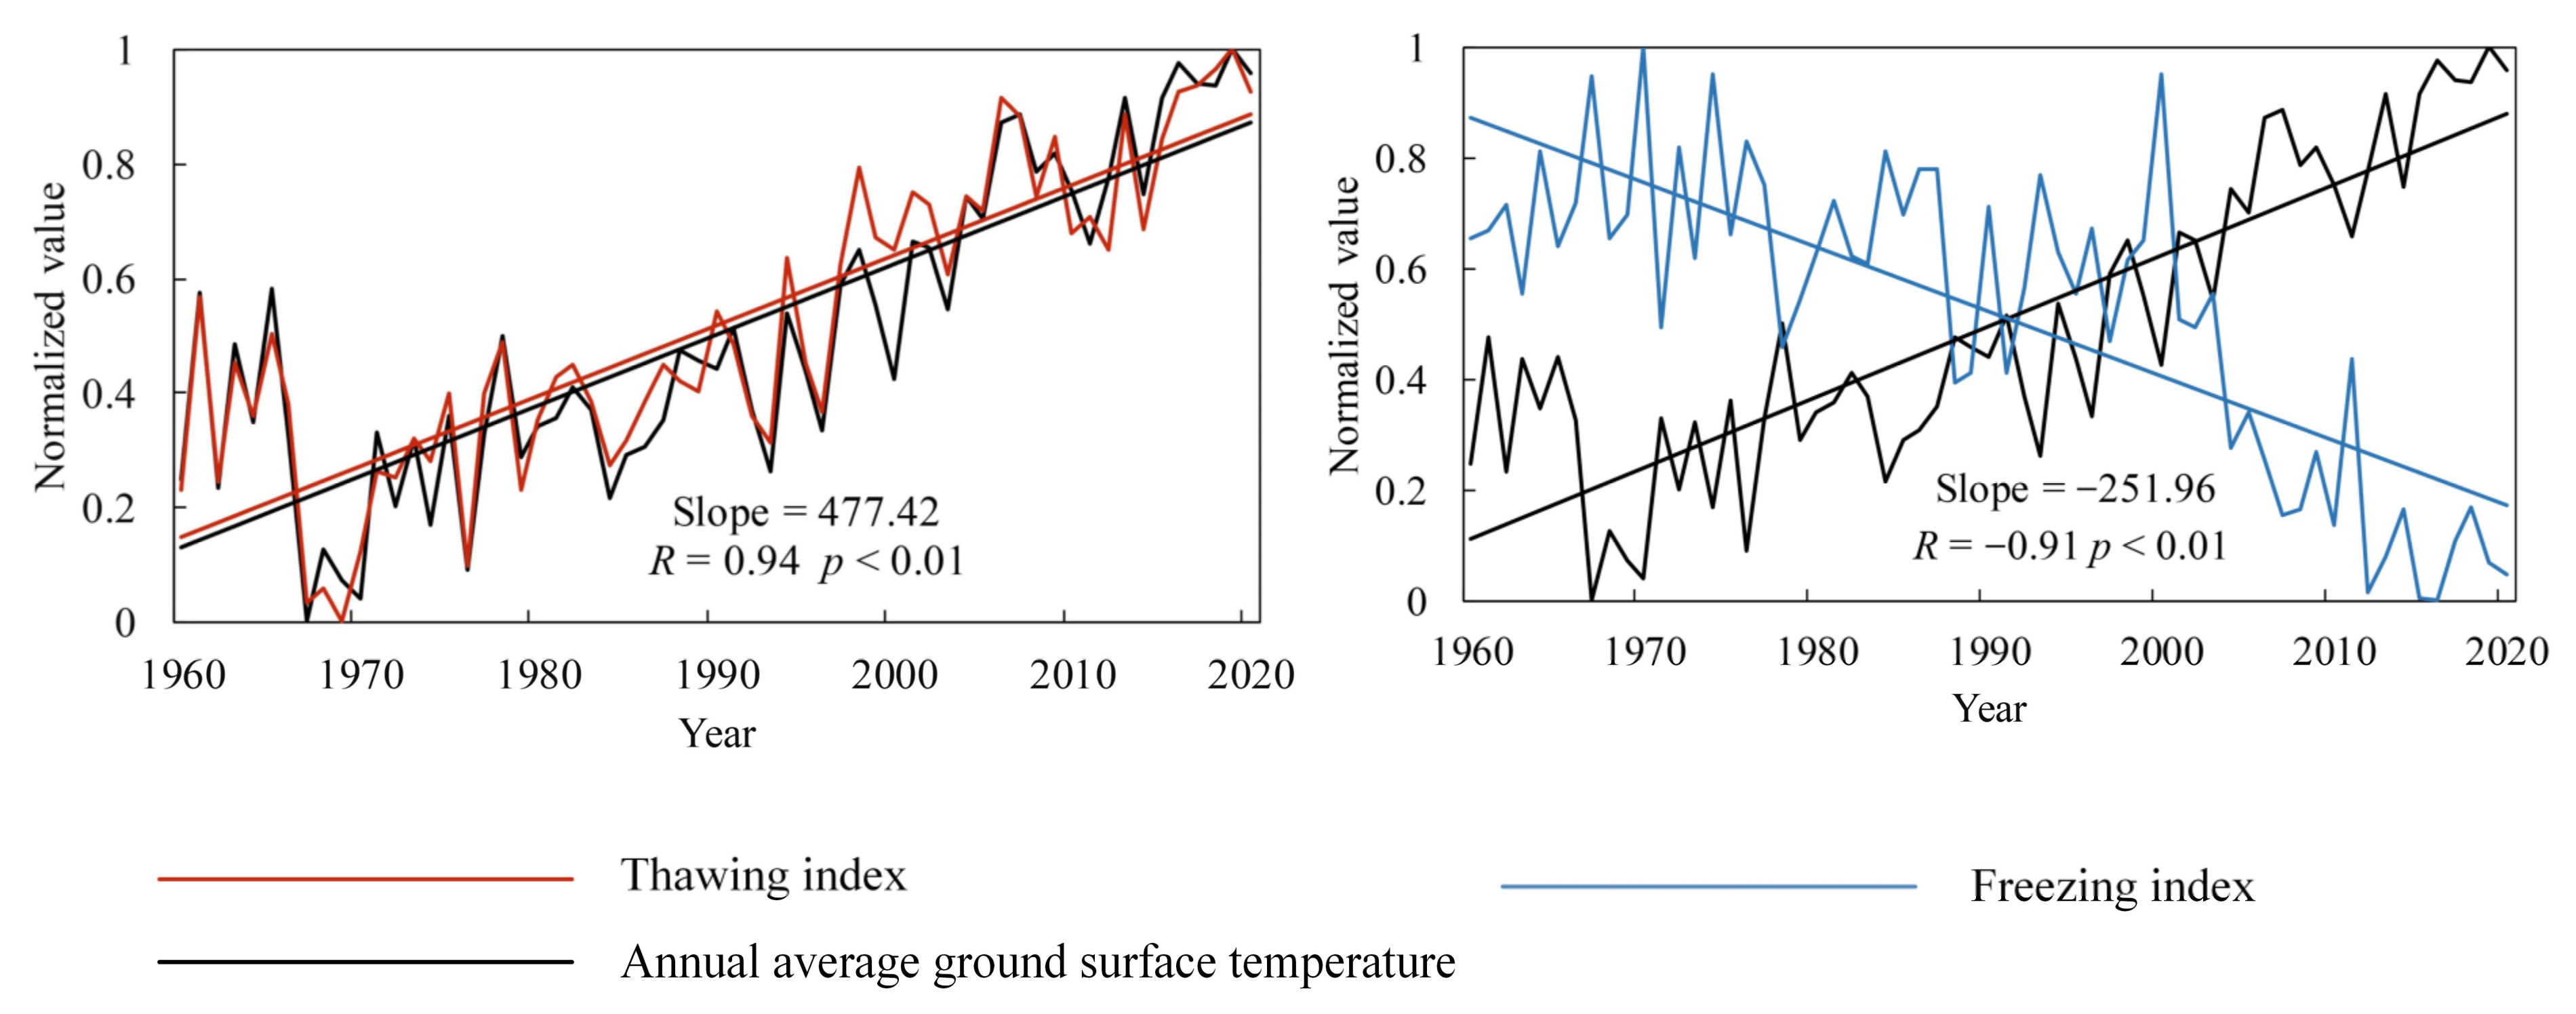
3.1. The Variation of Ground Surface Freezing/Thawing Index from 1960 to 2020
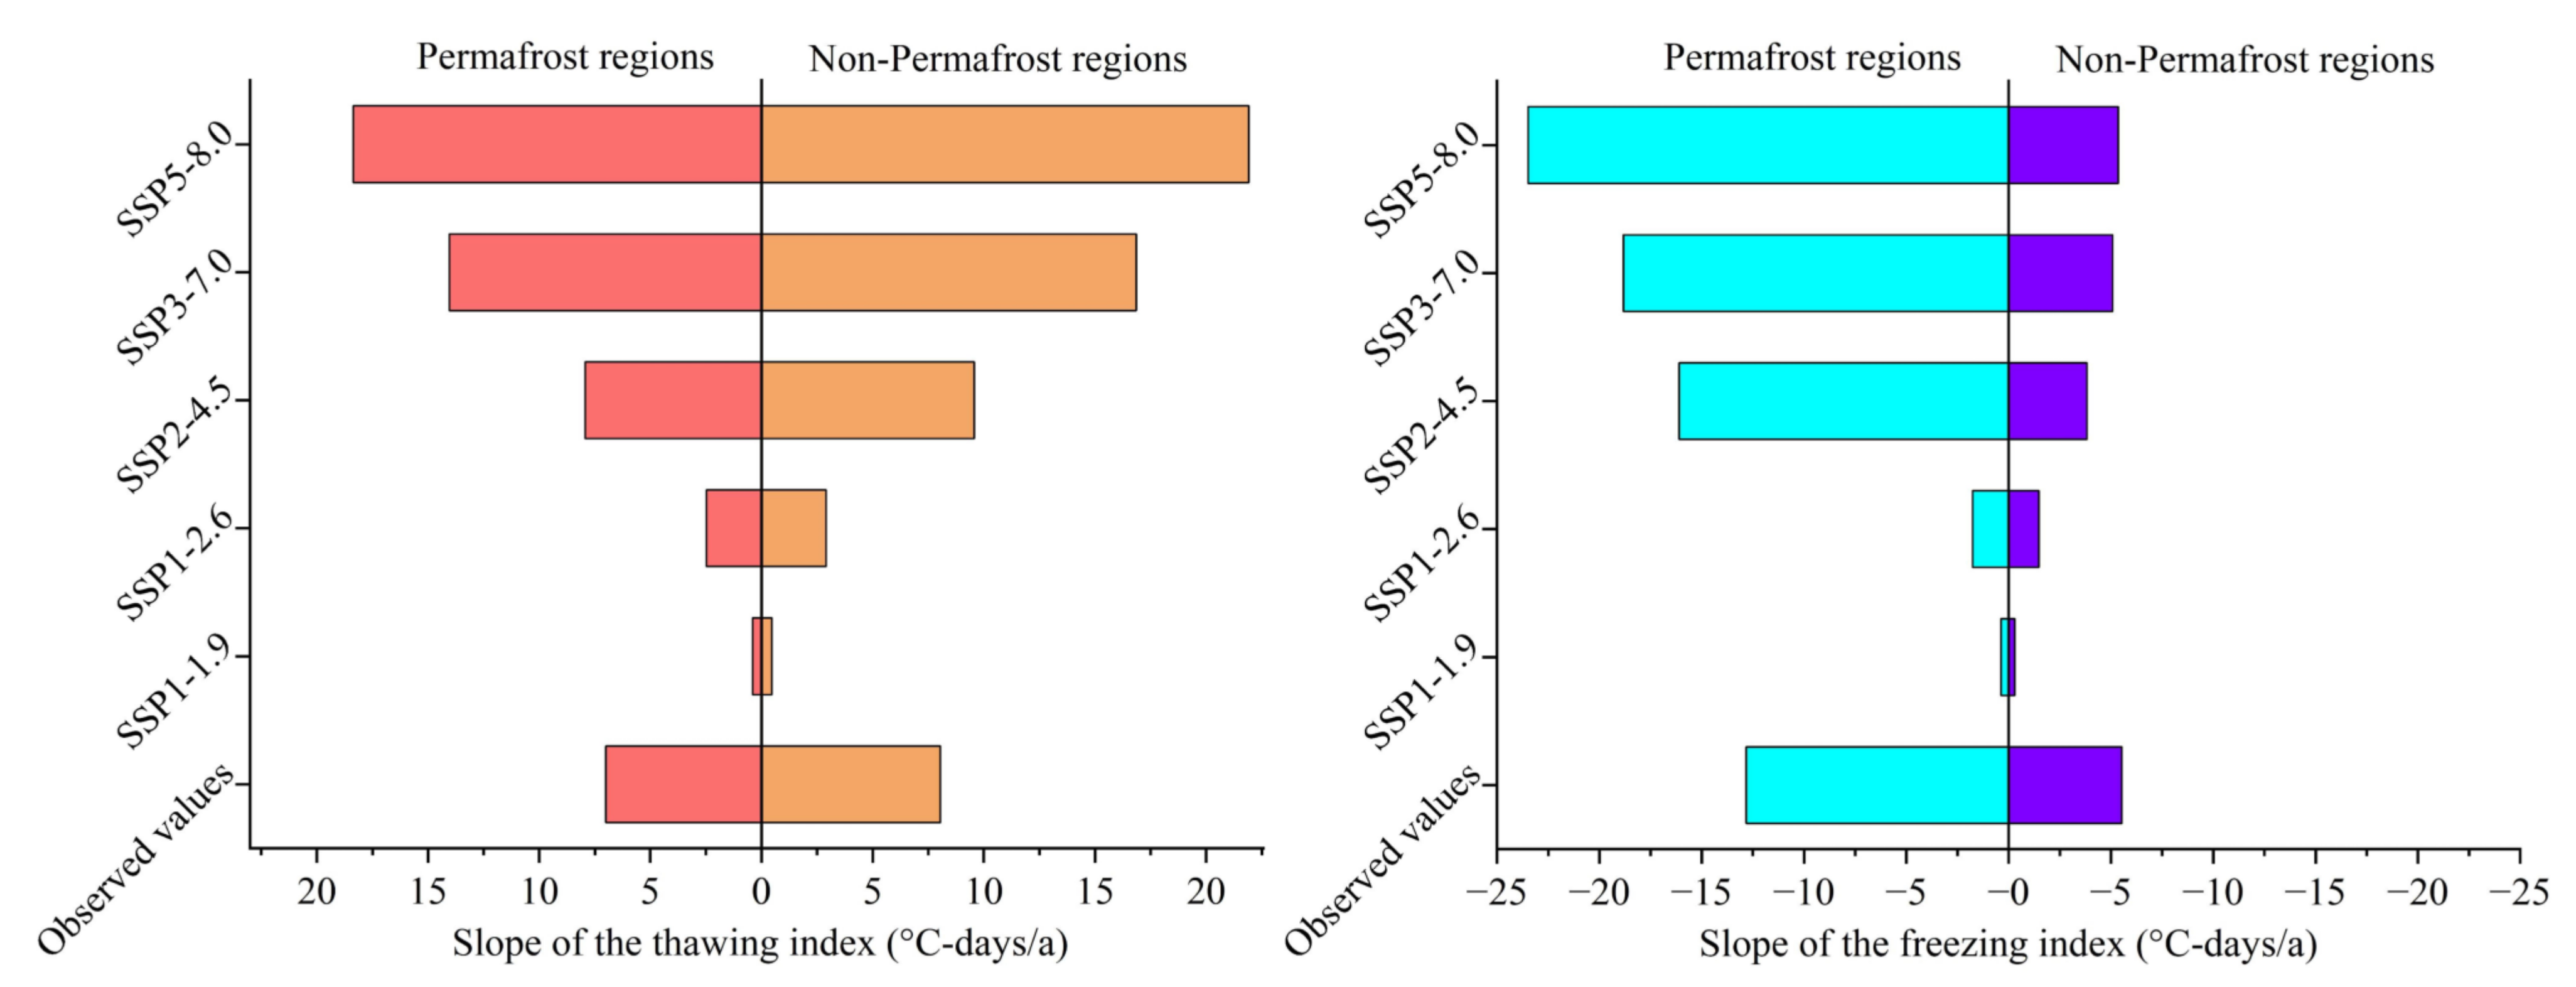
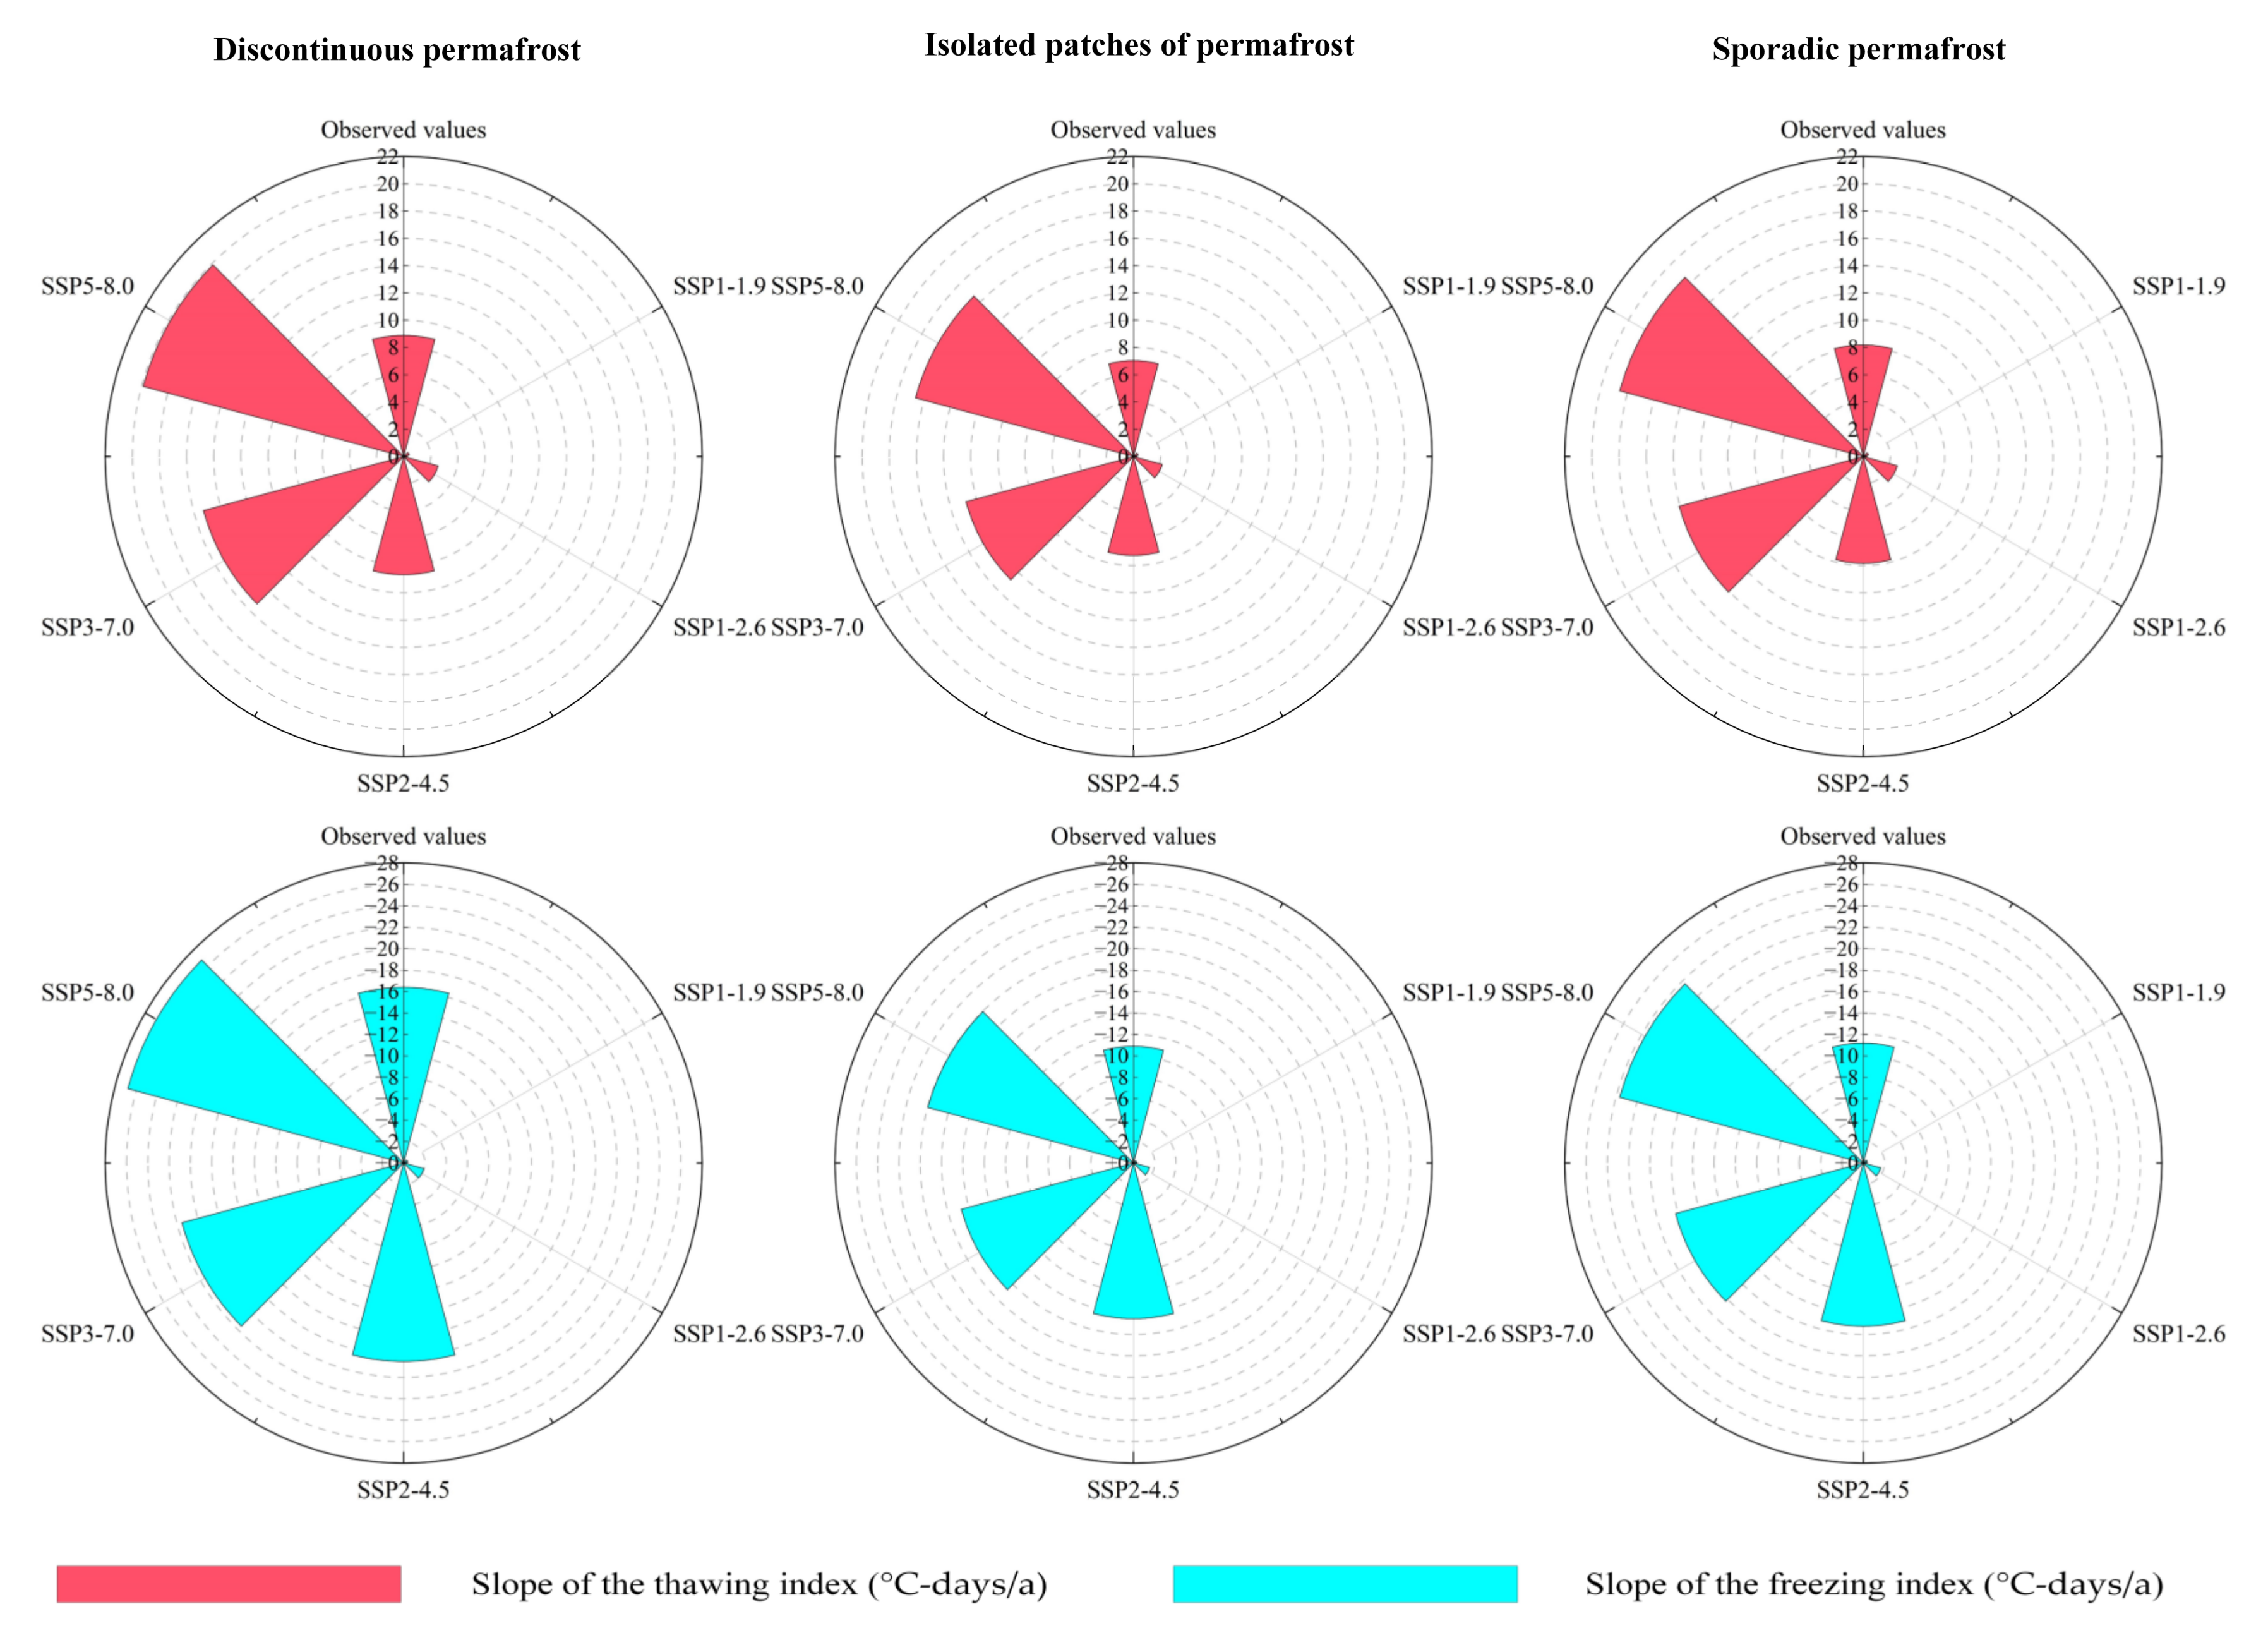
3.2. The Variation of Ground Surface Freezing/Thawing Index from 2020 to 2100
4. Discussion
4.1. Freezing and Thawing Variations Associated with Permafrost
4.2. Variations of Ground Freezing/Thawing Index in Different Climatic Zones
5. Conclusions
Author Contributions
Funding
Institutional Review Board Statement
Informed Consent Statement
Data Availability Statement
Acknowledgments
Conflicts of Interest
References
- Guo, D.; Wang, H.; Li, D. A projection of permafrost degradation on the Tibetan Plateau during the 21st century. J. Geophys. Res. Atmos. 2012, 117, D5. [Google Scholar] [CrossRef]
- Tett, S.F.; Stott, P.A.; Allen, M.R.; Ingram, W.J.; Mitchell, J.F. Causes of twentieth-century temperature change near the Earth’s surface. Nature 1999, 399, 569–572. [Google Scholar] [CrossRef]
- Gu, Y.; Lin, J.; Wang, X.L.; Zhang, X.J. Trend of annual runoff for major rivers in China under climate Change. Procedia Eng. 2012, 28, 564–568. [Google Scholar] [CrossRef]
- Kolanowska, M.; Michalska, E.; Konowalik, K. The impact of global warming on the niches and pollinator availability of sexually deceptive orchid with a single pollen vector. Sci. Total Environ. 2021, 795, 148850. [Google Scholar] [CrossRef] [PubMed]
- Wang, S.; Jin, H.; Li, S.; Zhao, L. Permafrost degradation on the Qinghai–Tibet Plateau and its environmental impacts. Permafr. Periglac. Process. 2000, 11, 43–53. [Google Scholar] [CrossRef]
- Jorgenson, M.T.; Racine, C.H.; Walters, J.C.; Osterkamp, T.E. Permafrost degradation and ecological changes associated with a warming climate in central Alaska. Clim. Change 2001, 48, 551–579. [Google Scholar] [CrossRef]
- Guglielmin, M.; Evans, C.J.; Cannone, N. Active layer thermal regime under different vegetation conditions in permafrost areas. a case study at Signy Island (Maritime Antarctica). Geoderma 2008, 144, 73–85. [Google Scholar] [CrossRef]
- Koven, C.D.; Ringeval, B.; Friedlingstein, P.; Ciais, P.; Cadule, P.; Khvorostyanov, D.; Krinner, G.; Tarnocai, C. Permafrost carbon-climate feedbacks accelerate global warming. Proc. Natl. Acad. Sci. USA 2011, 108, 14769–14774. [Google Scholar] [CrossRef] [Green Version]
- Volokhov, S.S. Effect of freezing conditions on the shear strength of soils frozen together with materials. Soil Mech. Found. Eng. 2003, 40, 233–238. [Google Scholar] [CrossRef]
- Qi, J.; Yao, X.; Yu, F.; Liu, Y. Study on thaw consolidation of permafrost under roadway embankment. Cold Reg. Sci. Technol. 2012, 81, 48–54. [Google Scholar] [CrossRef]
- Wen, Z.; Yu, Q.; Ma, W.; Dong, S.; Wang, D.; Niu, F.; Zhang, M. Experimental investigation on the effect of fiberglass reinforced plastic cover on adfreeze bond strength. Cold Reg. Sci. Technol. 2016, 131, 108–115. [Google Scholar] [CrossRef]
- Chai, M.; Mu, Y.; Zhang, J.; Ma, W.; Liu, G.; Chen, J. Characteristics of asphalt pavement damage in degrading permafrost regions: Case study of the Qinghai–Tibet highway, China. J. Cold Reg. Eng. 2018, 32, 05018003. [Google Scholar] [CrossRef]
- Cheng, G.; Zhao, L.; Li, R.; Wu, X.; Sheng, Y.; Hu, G.; Zou, D.; Jin, H.; Li, X.; Wu, Q. Characteristic, changes and impacts of permafrost on Qinghai-Tibet Plateau. Chin. Sci. Bull. 2019, 64, 2783–2795. [Google Scholar] [CrossRef]
- Shi, Y.; Niu, F.; Lin, Z.; Luo, J. Freezing/thawing index variations over the circum-Arctic from 1901 to 2015 and the permafrost extent. Sci. Total Environ. 2019, 660, 1294–1305. [Google Scholar] [CrossRef]
- Frauenfeld, O.W.; Zhang, T.; Mccreight, J.L. Northern hemisphere freezing/thawing index variations over the twentieth century. Int. J. Climatol. 2007, 27, 47–63. [Google Scholar] [CrossRef]
- Nelson, F.; Outcalt, S. A computational method for prediction and regionalization of permafrost. Arct. Alp. Res. 1987, 19, 279–288. [Google Scholar] [CrossRef]
- Zhang, T.; Frauenfeld, O.W.; Serreze, M.C.; Etringer, A.; Oelke, C.; McCreight, J.; Barry, R.G.; Gilichinsky, D.; Yang, D.; Ye, H.; et al. Spatial and temporal variability in active layer thickness over the Russian Arctic drainage basin. J. Geophys. Res. Atmos. 2005, 110, D16. [Google Scholar] [CrossRef]
- Nelson, F.E.; Shiklomanov, N.I.; Mueller, G.R.; Hinkel, K.M.; Walker, D.A.; Bockheim, J.G. Estimating active-layer thickness over a large region: Kuparuk River basin, Alaska, USA. Arct. Alp. Res. 1997, 29, 367–378. [Google Scholar] [CrossRef]
- Klene, A.E.; Nelson, F.E.; Shiklomanov, N.I. The n-factor as a tool in geocryological mapping: Seasonal thaw in the Kuparuk River Basin, Alaska. Phys. Geogr. 2001, 22, 449–466. [Google Scholar] [CrossRef]
- Peng, X.; Zhang, T.; Cao, B.; Wang, Q.; Wang, K.; Shao, W.; Guo, H. Changes in freezing-thawing index and soil freeze depth over the Heihe River Basin, western China. Arct. Antarct. Alp. Res. 2016, 48, 161–176. [Google Scholar] [CrossRef]
- Cheng, G.; Wu, T. Responses of permafrost to climate change and their environmental significance, Qinghai-Tibet Plateau. J. Geophys. Res. Earth Surf. 2007, 112, F2. [Google Scholar] [CrossRef] [Green Version]
- Wu, Q.; Zhang, T. Changes in active layer thickness over the Qinghai-Tibetan Plateau from 1995 to 2007. J. Geophys. Res. Atmos. 2010, 115. [Google Scholar] [CrossRef]
- Cao, B.; Zhang, T.J.; Peng, X.Q.; Zheng, L.; Mou, C.C.; Wang, Q.F. Analysis of the annual freeze-thaw index and its temporal and spatial changes in the Heihe River Basin. Adv. Earth Sci. 2015, 30, 357–366. (In Chinese) [Google Scholar]
- Liu, X.; Li, J. Research on the spatiotemporal changes of freeze-thaw index in Northeast China from 1960 to 2012. Heilongjiang Sci. 2018, 9, 162–164. (In Chinese) [Google Scholar]
- He, B.B.; Sheng, Y.; Huang, L.; Huang, X.B.; Zhang, X.Y. The change trend of freeze-thaw index in northern Xinjiang from 1961 to 2017. J. Glaciol. Geocryol. 2019, 41, 1107–1114. (In Chinese) [Google Scholar]
- Jiang, F.; Hu, R.; Li, Z. Variations and trends of the freezing/thawing index along the Qinghai-Xizang Railway for 1966–2004. J. Geogr. Sci. 2008, 18, 3–16. [Google Scholar] [CrossRef]
- Liao, Y.; Fan, H.; Li, Y.Y.; Cheng, G.W. Temporal and spatial changes of the freezing/thawing index of the Tibet Plateau from 1978 to 2017. Pratacult. Sci. 2021, 38, 1035–1046. (In Chinese) [Google Scholar]
- Peng, X.; Zhang, T.; Liu, Y.; Luo, J. Past and projected freezing/thawing indices in the northern hemisphere. J. Appl. Meteorol. Climatol. 2019, 58, 495–510. [Google Scholar] [CrossRef]
- Solang, T.J.; Du, J.; Tsewang, D.Z.; Phuntsok, S.D. Characteristics of annual freeze-thaw index in Qiangtang Nature Reserve under the background of climate warming. Highl. Mt. Meteorol. Res. 2021, 41, 48–55. (In Chinese) [Google Scholar]
- Jian, B.; Li, J.; Zhao, Y.; He, Y.; Wang, J.; Huang, J. Evaluation of the CMIP6 planetary albedo climatology using satellite observations. Clim. Dyn. 2020, 54, 5145–5161. [Google Scholar] [CrossRef]
- Wang, K.; Zhang, T.; Zhong, X. Changes in the timing and duration of the near-surface soil freeze/thaw status from 1956 to 2006 across China. Cryosphere 2015, 9, 1321–1331. [Google Scholar] [CrossRef] [Green Version]
- Peng, X.; Zhang, T.; Frauenfeld, O.W.; Wang, K.; Cao, B.; Zhong, X.; Su, H.; Mu, C. Response of seasonal soil freeze depth to climate change across China. Cryosphere 2017, 11, 1059–1073. [Google Scholar] [CrossRef] [Green Version]
- Wang, R.; Zhu, Q.; Ma, H. Changes in freezing/thawing index over the source region of the Yellow River from 1980 to 2014. J. For. Res. 2019, 30, 257–268. [Google Scholar] [CrossRef]
- Wu, T.; Wang, Q.; Zhao, L.; Batkhishig, O.; Watanabe, M. Observed trends in surface freezing/thawing index over the period 1987–2005 in Mongolia. Cold Reg. Sci. Technol. 2011, 69, 105–111. [Google Scholar] [CrossRef]
- Liu, W.; Xiong, H.; Liu, L.; Zhu, S.N.; Chen, X. Future climate change scenarios in the Ganjiang River Basin based on CMIP5 model and SDSM. Res. Soil Water Conserv. 2019, 2, 145–152. (In Chinese) [Google Scholar]
- Jiang, D.; Hu, D.; Tian, Z.; Lang, X. Differences between CMIP6 and CMIP5 models in simulating climate over China and the East Asian monsoon. Adv. Atmos. Sci. 2020, 37, 1102–1118. [Google Scholar] [CrossRef]
- Luo, N.; Guo, Y.; Gao, Z.; Chen, K.; Chou, J. Assessment of CMIP6 and CMIP5 model performance for extreme temperature in China. Atmos. Ocean. Sci. Lett. 2020, 13, 589–597. [Google Scholar] [CrossRef]
- Li, C.; Jiang, T.; Wang, Y.; Miao, L.J.; Li, S.Y.; Chen, Z.Y.; Lv, Y.R. Modeled prediction of future temperature in the upper Yellow River based on CMIP6 model. J. Glaciol. Geocryol. 2022, 44, 171–178. (In Chinese) [Google Scholar]
- Wu, T.; Lu, Y.; Fang, Y.; Xin, X.; Li, L.; Li, W.; Jie, W.; Zhang, J.; Liu, Y.; Zhang, L.; et al. The Beijing Climate Center climate system model (BCC-CSM): The main progress from CMIP5 to CMIP6. Geosci. Model Dev. 2019, 12, 1573–1600. [Google Scholar] [CrossRef] [Green Version]
- Zhang, H.; Zhang, M.; Jin, J.; Fei, K.; Ji, D.; Wu, C.; Zhu, J.; He, J.; Chai, Z.; Xie, J.; et al. Description and Climate Simulation Performance of CAS-ESM Version 2. J. Adv. Model. Earth Syst. 2020, 12, e2020MS002210. [Google Scholar] [CrossRef]
- Lauritzen, P.H.; Nair, R.D.; Herrington, A.R.; Callaghan, P.; Goldhaber, S.; Dennis, J.M.; Bacmeister, J.T.; Eaton, B.E.; Zarzycki, C.M.; Taylor, M.A.; et al. NCAR release of CAM-SE in CESM2. 0: A reformulation of the spectral element dynamical core in dry-mass vertical coordinates with comprehensive treatment of condensates and energy. J. Adv. Model. Earth Syst. 2018, 10, 1537–1570. [Google Scholar] [CrossRef]
- Liu, S.M.; Chen, Y.H.; Rao, J.; Cao, C.; Li, S.Y.; Ma, M.H.; Wang, Y.B. Parallel comparison of major sudden stratospheric warming events in CESM1-WACCM and CESM2-WACCM. Atmosphere 2019, 10, 679. [Google Scholar] [CrossRef] [Green Version]
- Golaz, J.C.; Caldwell, P.M.; Van Roekel, L.P.; Petersen, M.R.; Tang, Q.; Wolfe, J.D.; Abeshu, G.; Anantharaj, V.; Asay-Davis, X.S.; Bader, D.C.; et al. The DOE E3SM coupled model version 1: Overview and evaluation at standard resolution. J. Adv. Model. Earth Syst. 2019, 11, 2089–2129. [Google Scholar] [CrossRef] [Green Version]
- Yukimoto, S.; Kawai, H.; Koshiro, T.; Oshima, N.; Yoshida, K.; Urakawa, S.; Tsujino, H.; Deushi, M.; Tanaka, T.; Hosaka, M.; et al. The Meteorological Research Institute Earth System Model version 2.0, MRI-ESM2. 0: Description and basic evaluation of the physical component. J. Meteorol. Soc. Jpn. 2019, 97, 931–965. [Google Scholar] [CrossRef] [Green Version]
- Partal, T.; Kahya, E. Trend analysis in Turkish precipitation data. Hydrol. Process. Int. J. 2006, 20, 2011–2026. [Google Scholar] [CrossRef]
- Ramachandra, R.A.; Azli, M.; Pae, L.J. Identification of trends in Malaysian monthly runoff under the scaling hypothesis. Hydrolog. Sci. J. 2011, 56, 917–929. [Google Scholar] [CrossRef] [Green Version]
- Di Giuseppe, E.; Pasqui, M.; Magno, R.; Quaresima, S. A Counting Process Approach for Trend Assessment of Drought Condition. Hydrology 2019, 6, 84. [Google Scholar] [CrossRef]
- Men, B.; Liu, C.; Xia, J.; Liu, S.X.; Lin, Z.H. Application of R/S Analysis Method in the Prediction of Runoff Trend of Water Diversion Rivers in the West Route of the South-to-North Water Diversion Project. J. Glaciol. Geocryol. 2005, 4, 568–573. (In Chinese) [Google Scholar]
- Zhang, X.; Cai, H.; Yin, X. Application of Rescaled Range Analysis (R/S) to analyze water and sediment changes in Wuding River Basin. Trans. Chin. Soc. Agric. Eng. 2010, 26, 212–217. (In Chinese) [Google Scholar]
- Zhang, J.; Hu, Q.; Wang, S.; Ai, M. Variation Trend Analysis of Runoff and Sediment Time Series Based on the R/S Analysis of Simulated Loess Tilled Slopes in the Loess Plateau, China. Sustainability 2018, 10, 32. [Google Scholar] [CrossRef] [Green Version]
- Mandelbrot, B.B.; Wallis, J.R. Some Log-Run Properties of Geophysical Records. Water Resour. Res. 1969, 5, 321–340. [Google Scholar] [CrossRef] [Green Version]
- Mandelbrot, B.B.; Wallis, J.R. Robustness of the rescaled range R/S in the measurement of noncyclic long run statistical dependence. Water Resour. Res. 1969, 5, 967–988. [Google Scholar] [CrossRef]
- Li, X.; Jin, H.; Sun, L.; Wang, H.; He, R.; Huang, Y.; Chang, X. Climate warming over 1961–2019 and impacts on permafrost zonation in Northeast China. J. For. Res. 2021, 33, 767–788. [Google Scholar] [CrossRef]


| No. | Model Name | Country | Horizontal Resolution | References |
|---|---|---|---|---|
| 1 | BCC-CSM2-MR | China | 1.1° × 1.1° | Wu [39] |
| 2 | CAS-ESM2-0 | China | 1.4° × 1.4° | Zhang [40] |
| 3 | CESM2 | USA | 1.3° × 0.9° | Lauritzen [41] |
| 4 | CESM2-WACCM | USA | 1.3° × 0.9° | Liu [42] |
| 5 | E3SM-1-1 | USA | 1.0° × ∼1.0° | Golaz [43] |
| 6 | E3SM-1-1-ECA | USA | 1.0° × ∼1.0° | Golaz [43] |
| 7 | MRI-ESM2-0 | Japan | 1.1° × 1.1° | Yukimoto [44] |
| Area | Hurst | R2 | p |
|---|---|---|---|
| Thawing index | 0.95 | 0.84 | 0.00 ** |
| Freezing index | 0.93 | 0.96 | 0.00 ** |
| Thawing Index | Freezing Index | |||
|---|---|---|---|---|
| Slope | R | Slope | R | |
| A | 478.84 | 0.93 ** | −242.18 | −0.90 ** |
| B | 431.14 | 0.96 ** | −298.86 | −0.93 ** |
| C | 357.89 | 0.94 ** | −367.93 | −0.95 ** |
| D | 645.62 | 0.99 ** | −49.77 | −0.91 ** |
Publisher’s Note: MDPI stays neutral with regard to jurisdictional claims in published maps and institutional affiliations. |
© 2022 by the authors. Licensee MDPI, Basel, Switzerland. This article is an open access article distributed under the terms and conditions of the Creative Commons Attribution (CC BY) license (https://creativecommons.org/licenses/by/4.0/).
Share and Cite
Li, X.; Zhang, Z.; Melnikov, A.; Zhang, M.; Jin, D.; Zhai, J. Variation of Ground Surface Freezing/Thawing Index in China under the CMIP6 Warming Scenarios. Sustainability 2022, 14, 14458. https://doi.org/10.3390/su142114458
Li X, Zhang Z, Melnikov A, Zhang M, Jin D, Zhai J. Variation of Ground Surface Freezing/Thawing Index in China under the CMIP6 Warming Scenarios. Sustainability. 2022; 14(21):14458. https://doi.org/10.3390/su142114458
Chicago/Turabian StyleLi, Xianglong, Ze Zhang, Andrey Melnikov, Mingyi Zhang, Doudou Jin, and Jinbang Zhai. 2022. "Variation of Ground Surface Freezing/Thawing Index in China under the CMIP6 Warming Scenarios" Sustainability 14, no. 21: 14458. https://doi.org/10.3390/su142114458
APA StyleLi, X., Zhang, Z., Melnikov, A., Zhang, M., Jin, D., & Zhai, J. (2022). Variation of Ground Surface Freezing/Thawing Index in China under the CMIP6 Warming Scenarios. Sustainability, 14(21), 14458. https://doi.org/10.3390/su142114458