

Numerical Evaluation of a Novel Development Mode for Challenging Oceanic Gas Hydrates Considering Methane Leakage


 , ,
, ,
Abstract
:1. Introduction
2. Modeling
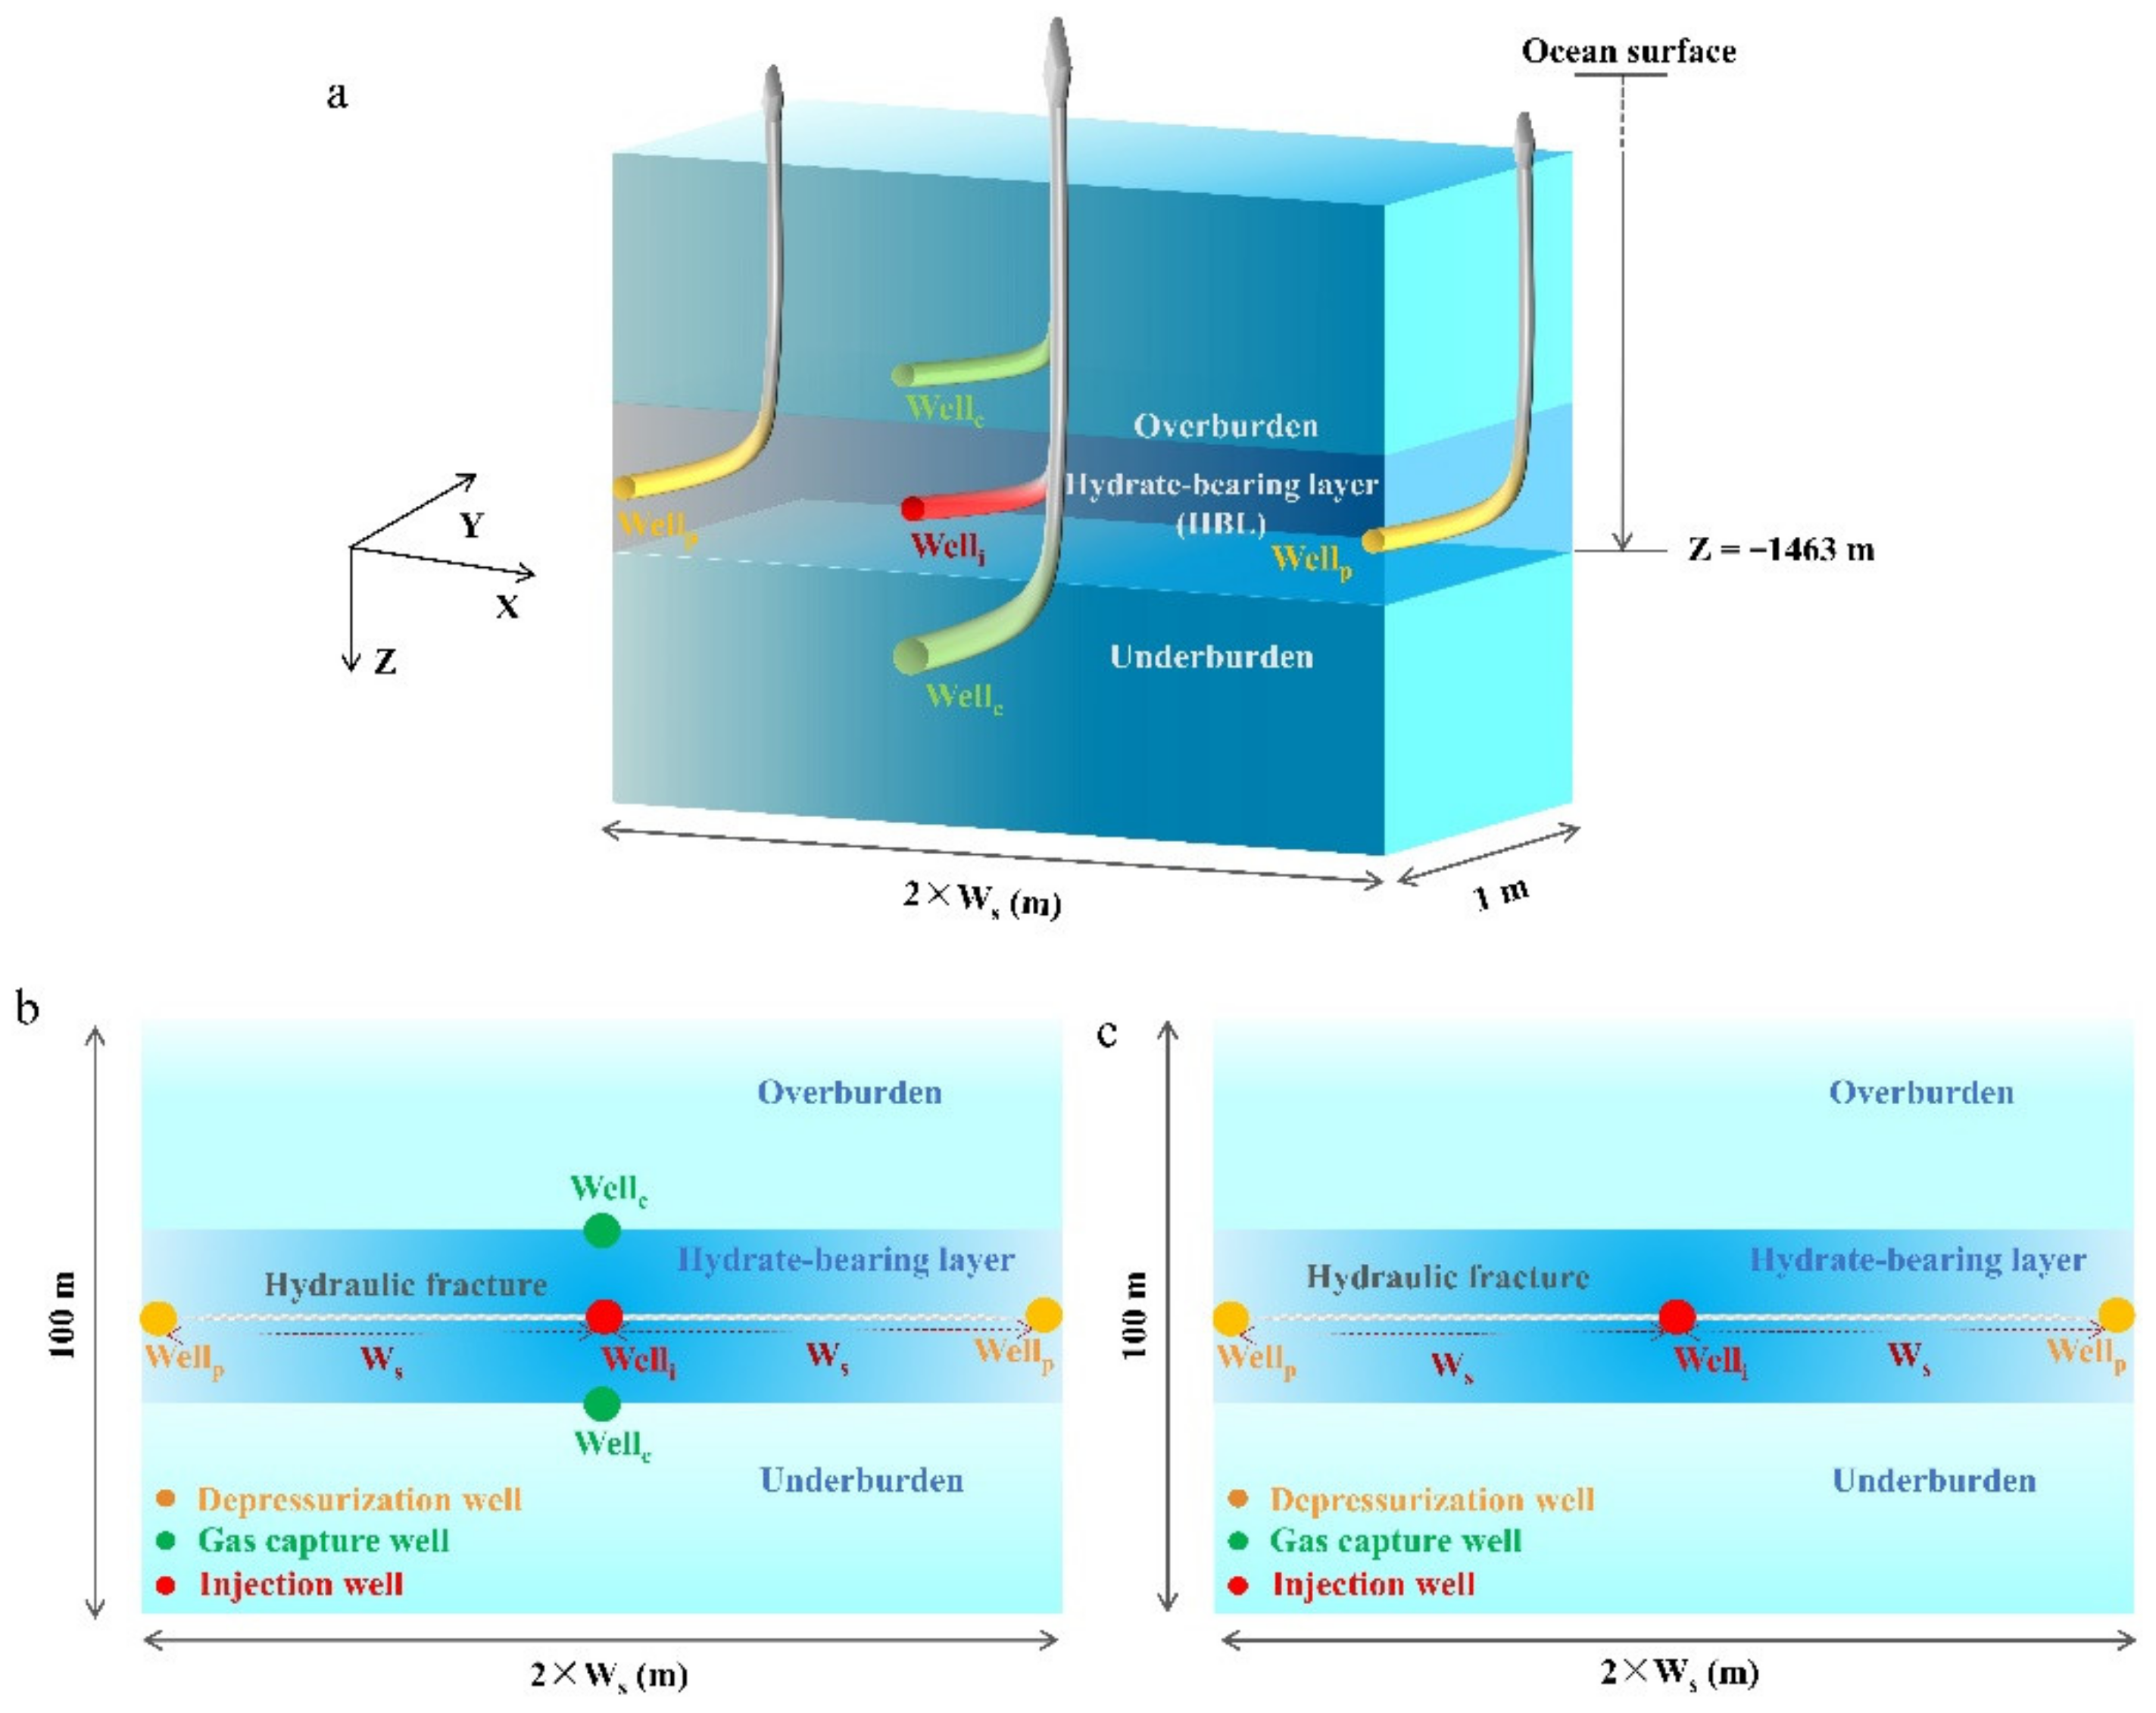
2.1. Development Plan Design
2.2. Generalization of the Fracture
2.3. Numerical Code
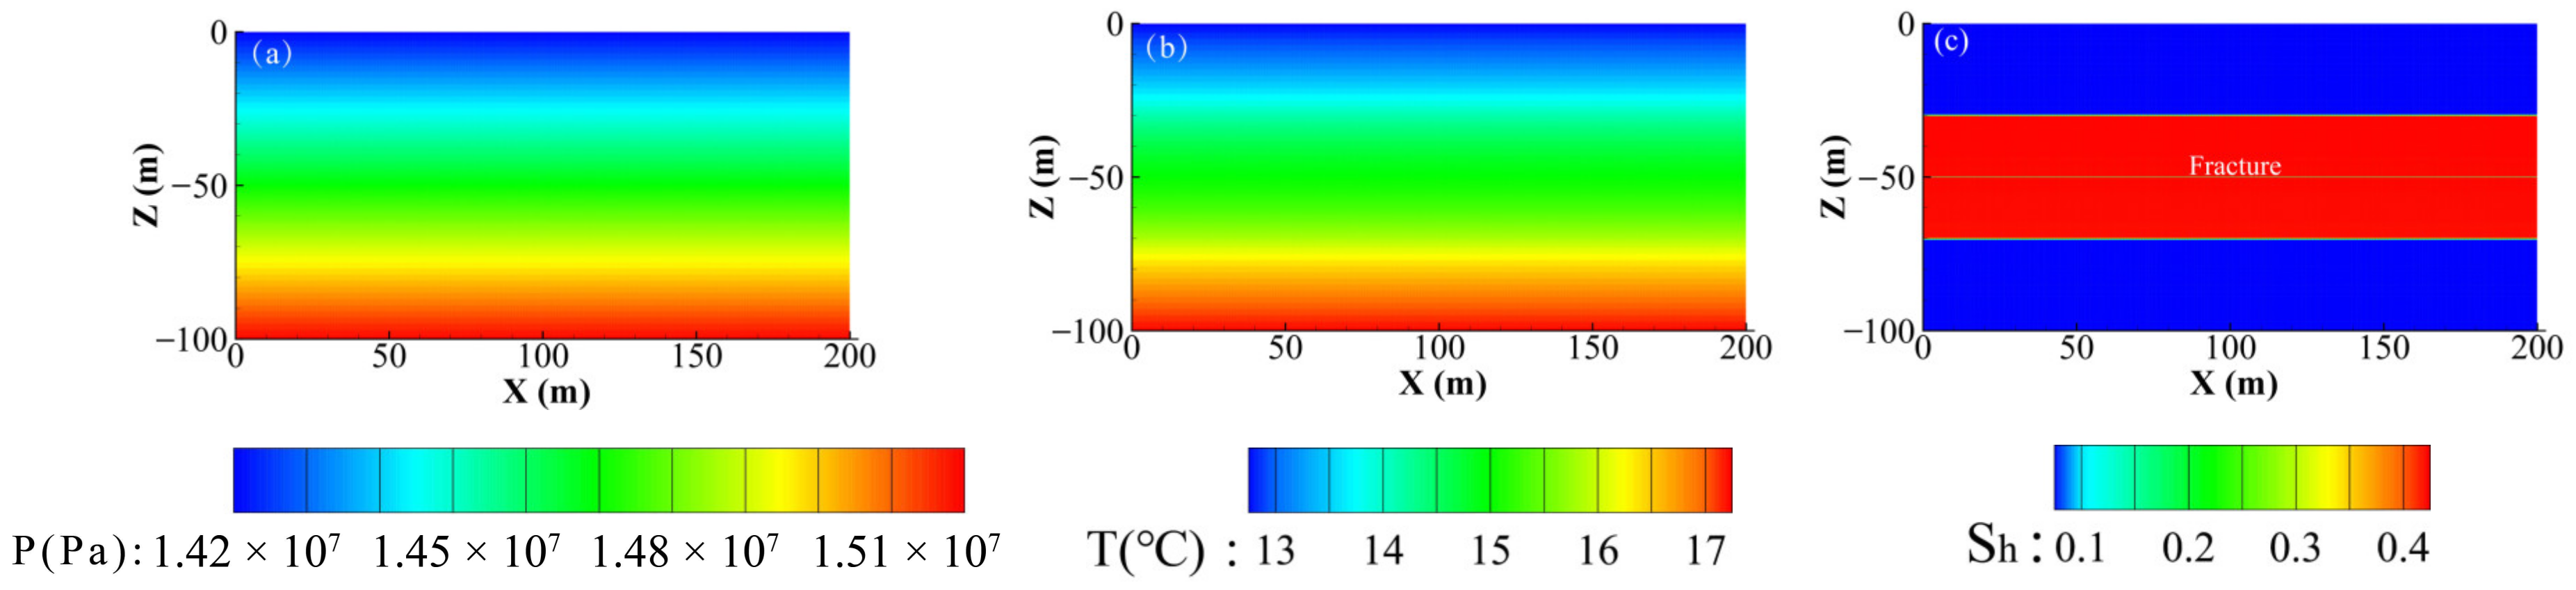
2.4. Initial Conditions and Model Parameters
2.5. Simulation Scenarios
3. Results
3.1. Comparison of Different Development Modes
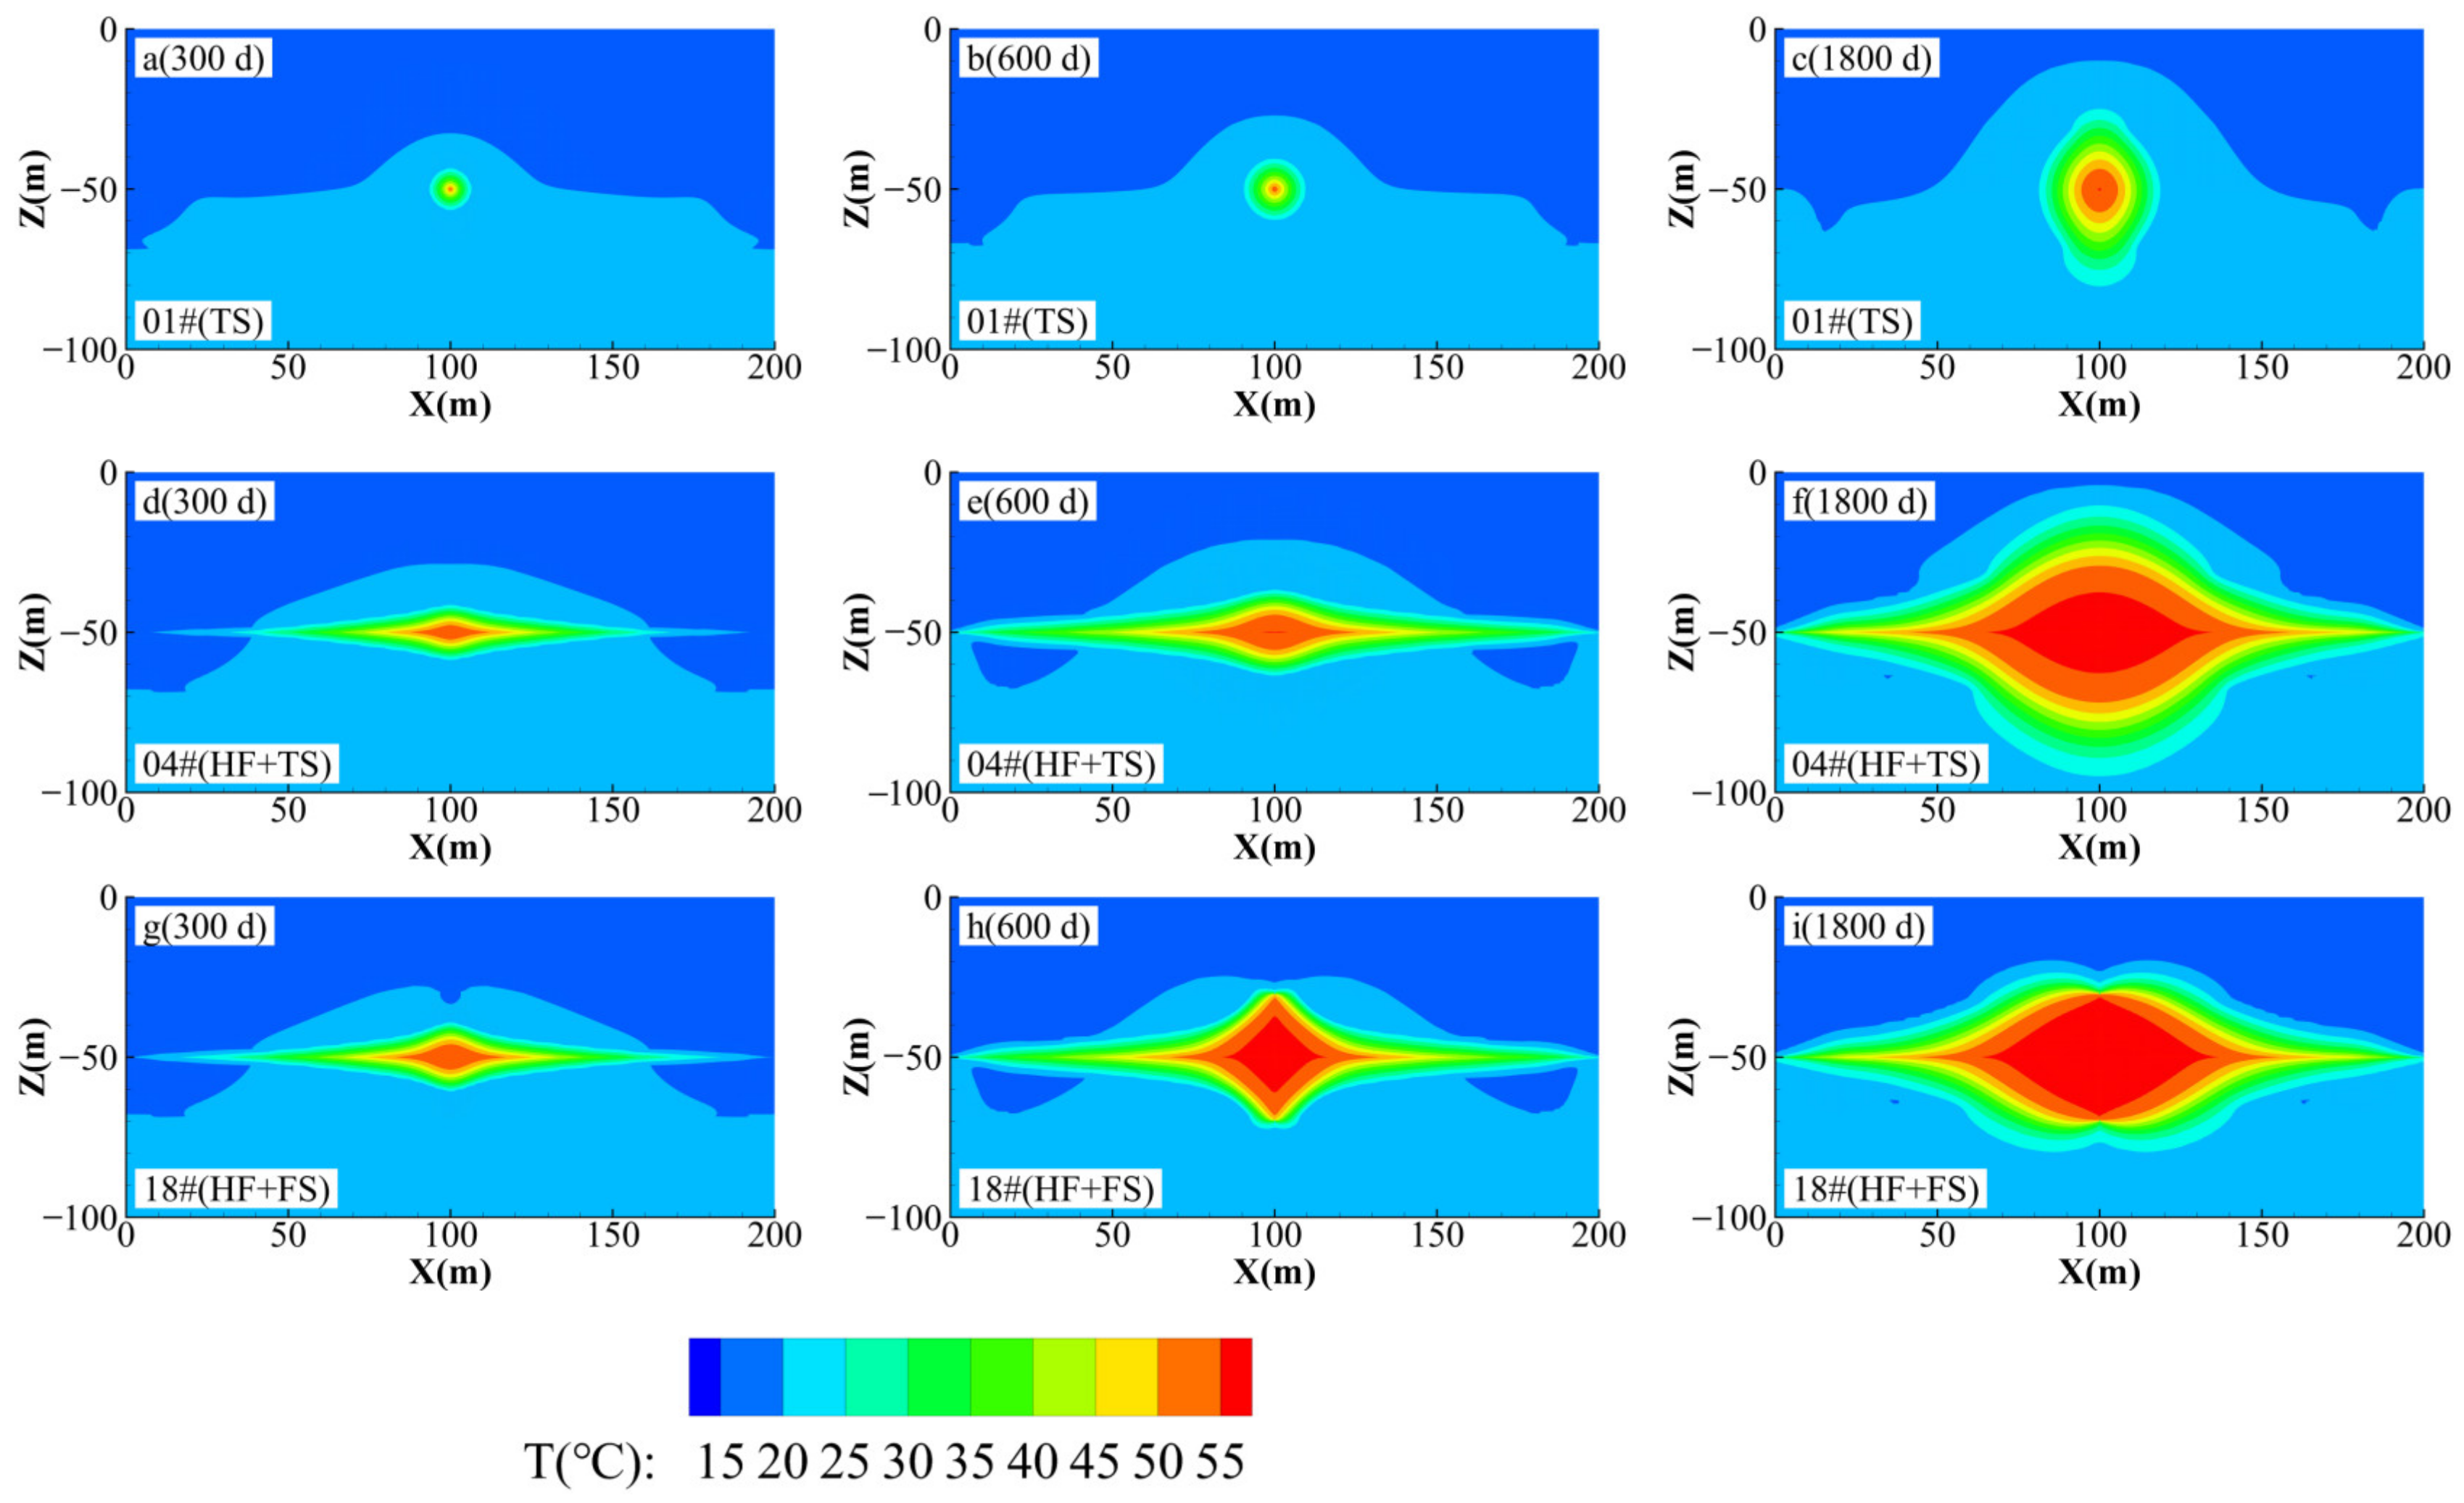
3.1.1. Spatial Evolution of the Physical Properties
- 1.
- Reservoir temperature evolution
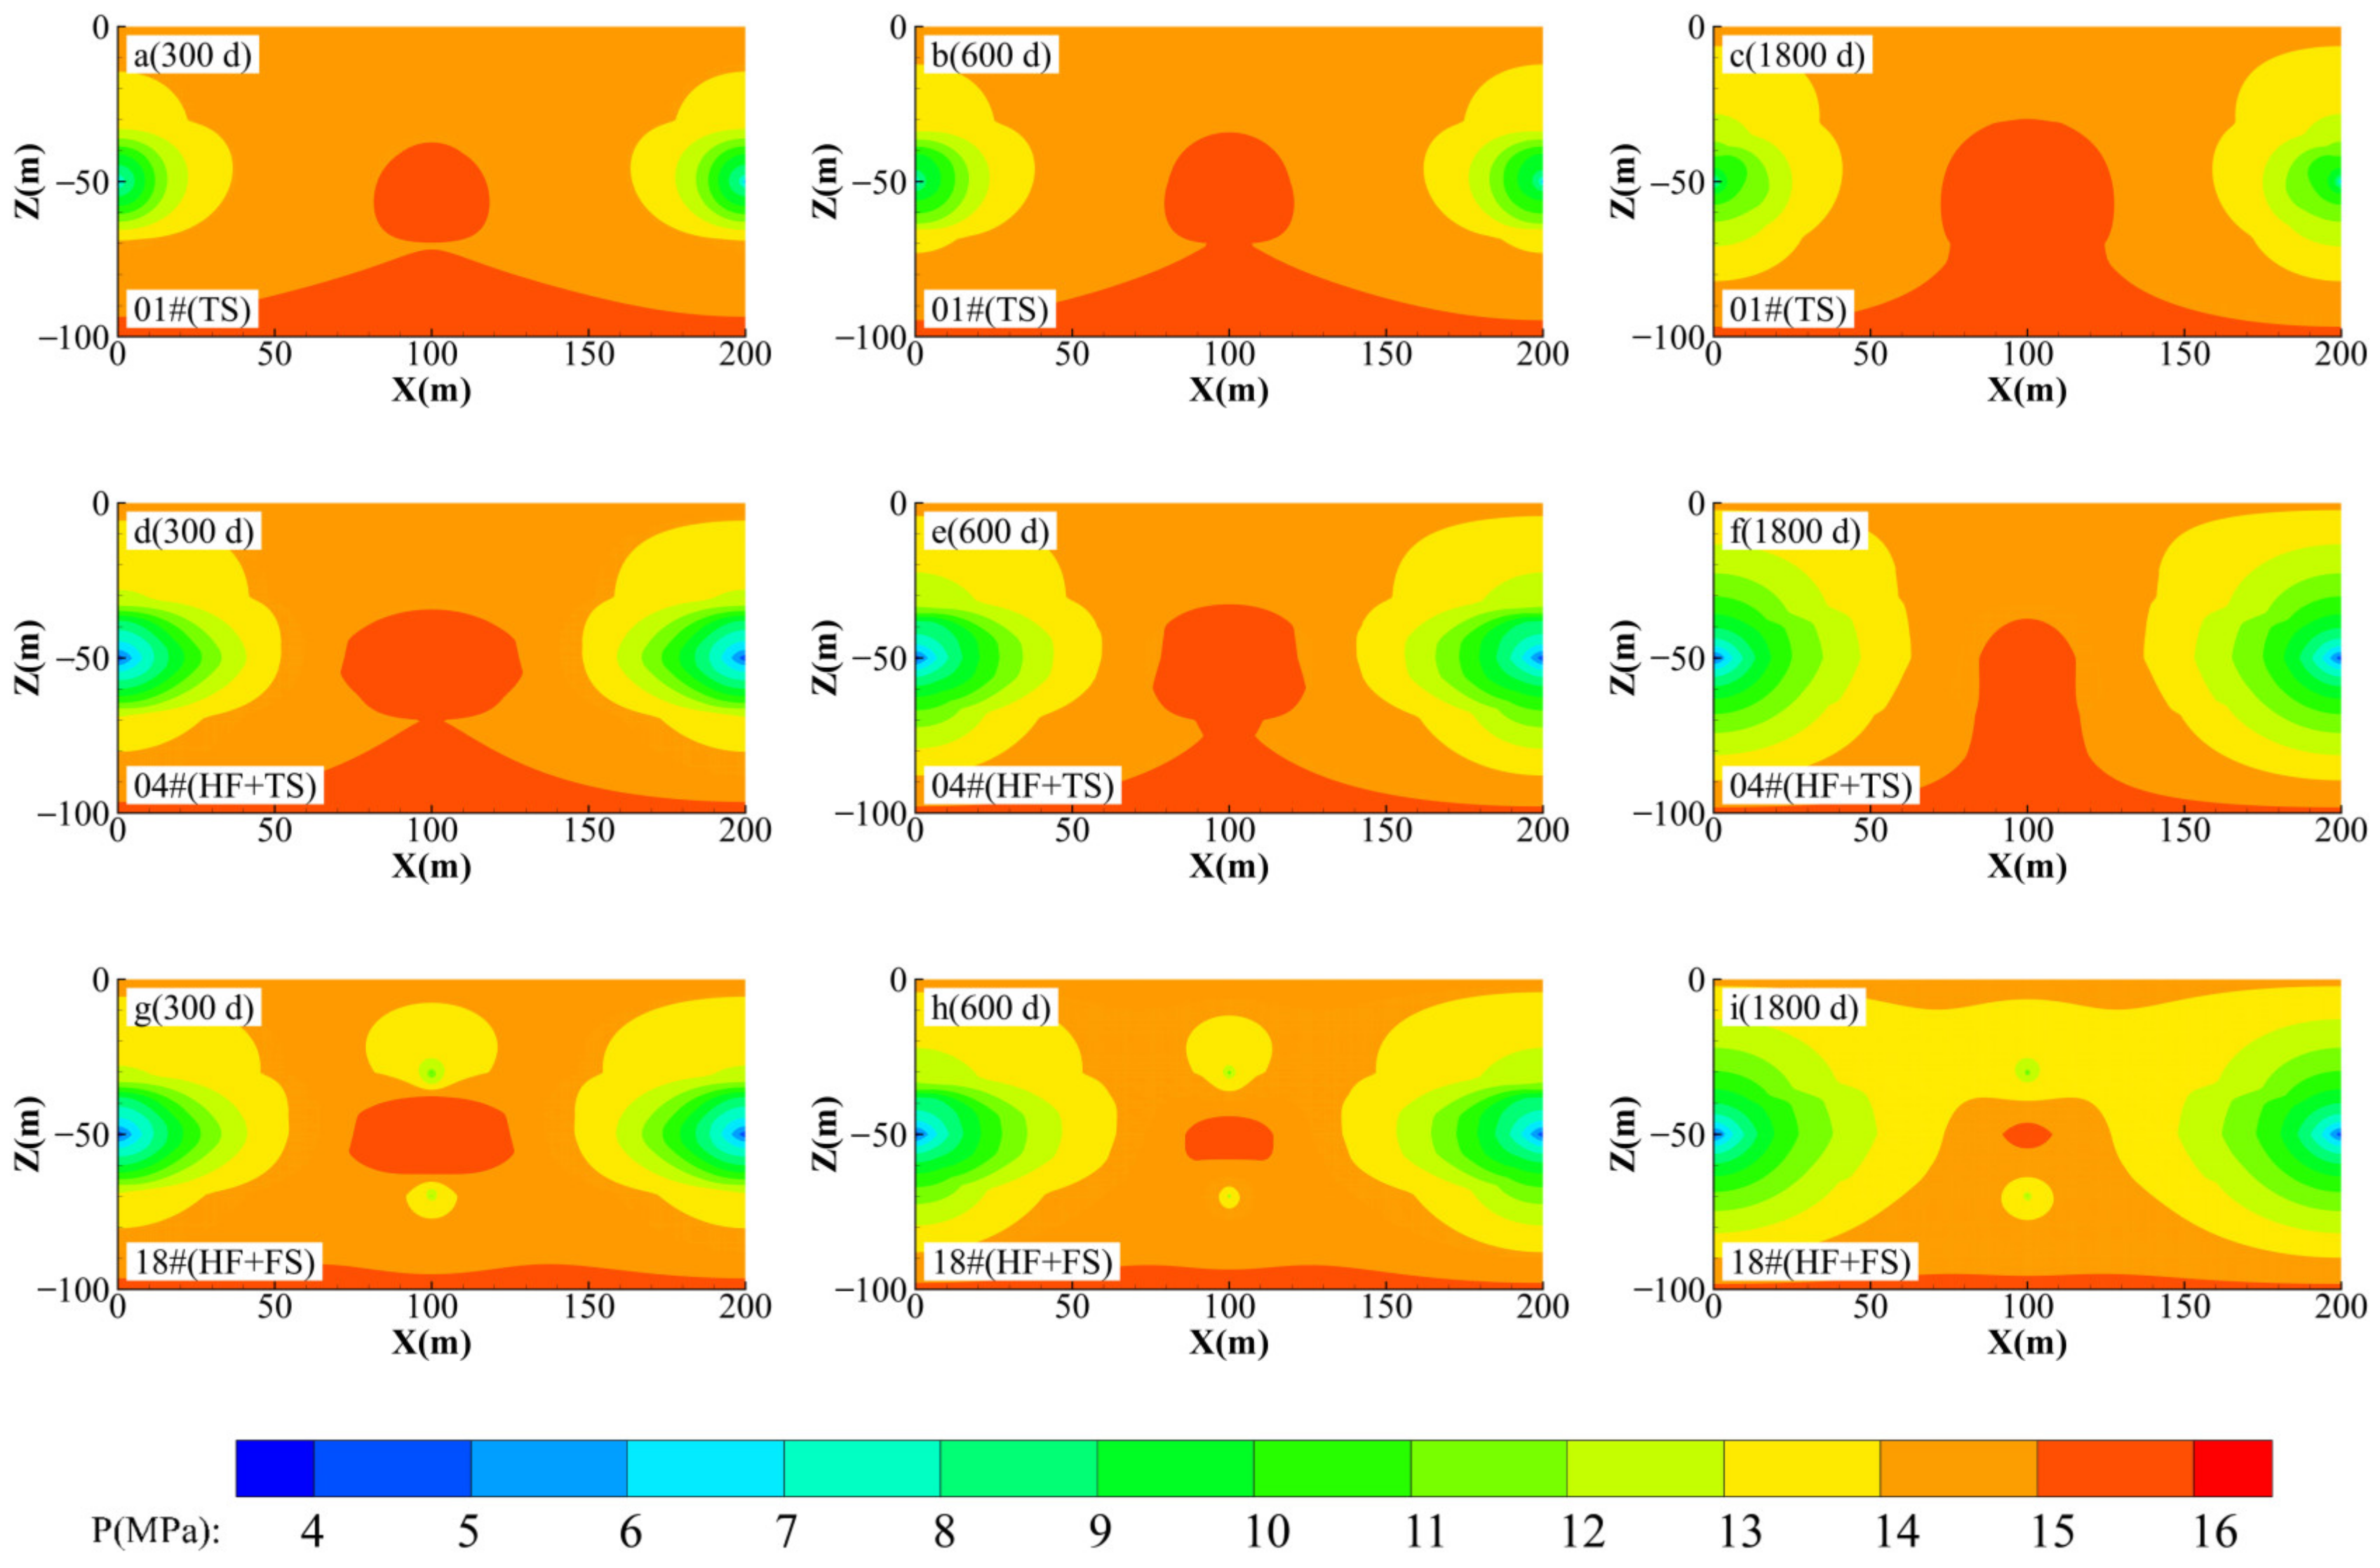
- 2.
- Reservoir pressure evolution
- 3.
- Hydrate saturation evolution
- 4.
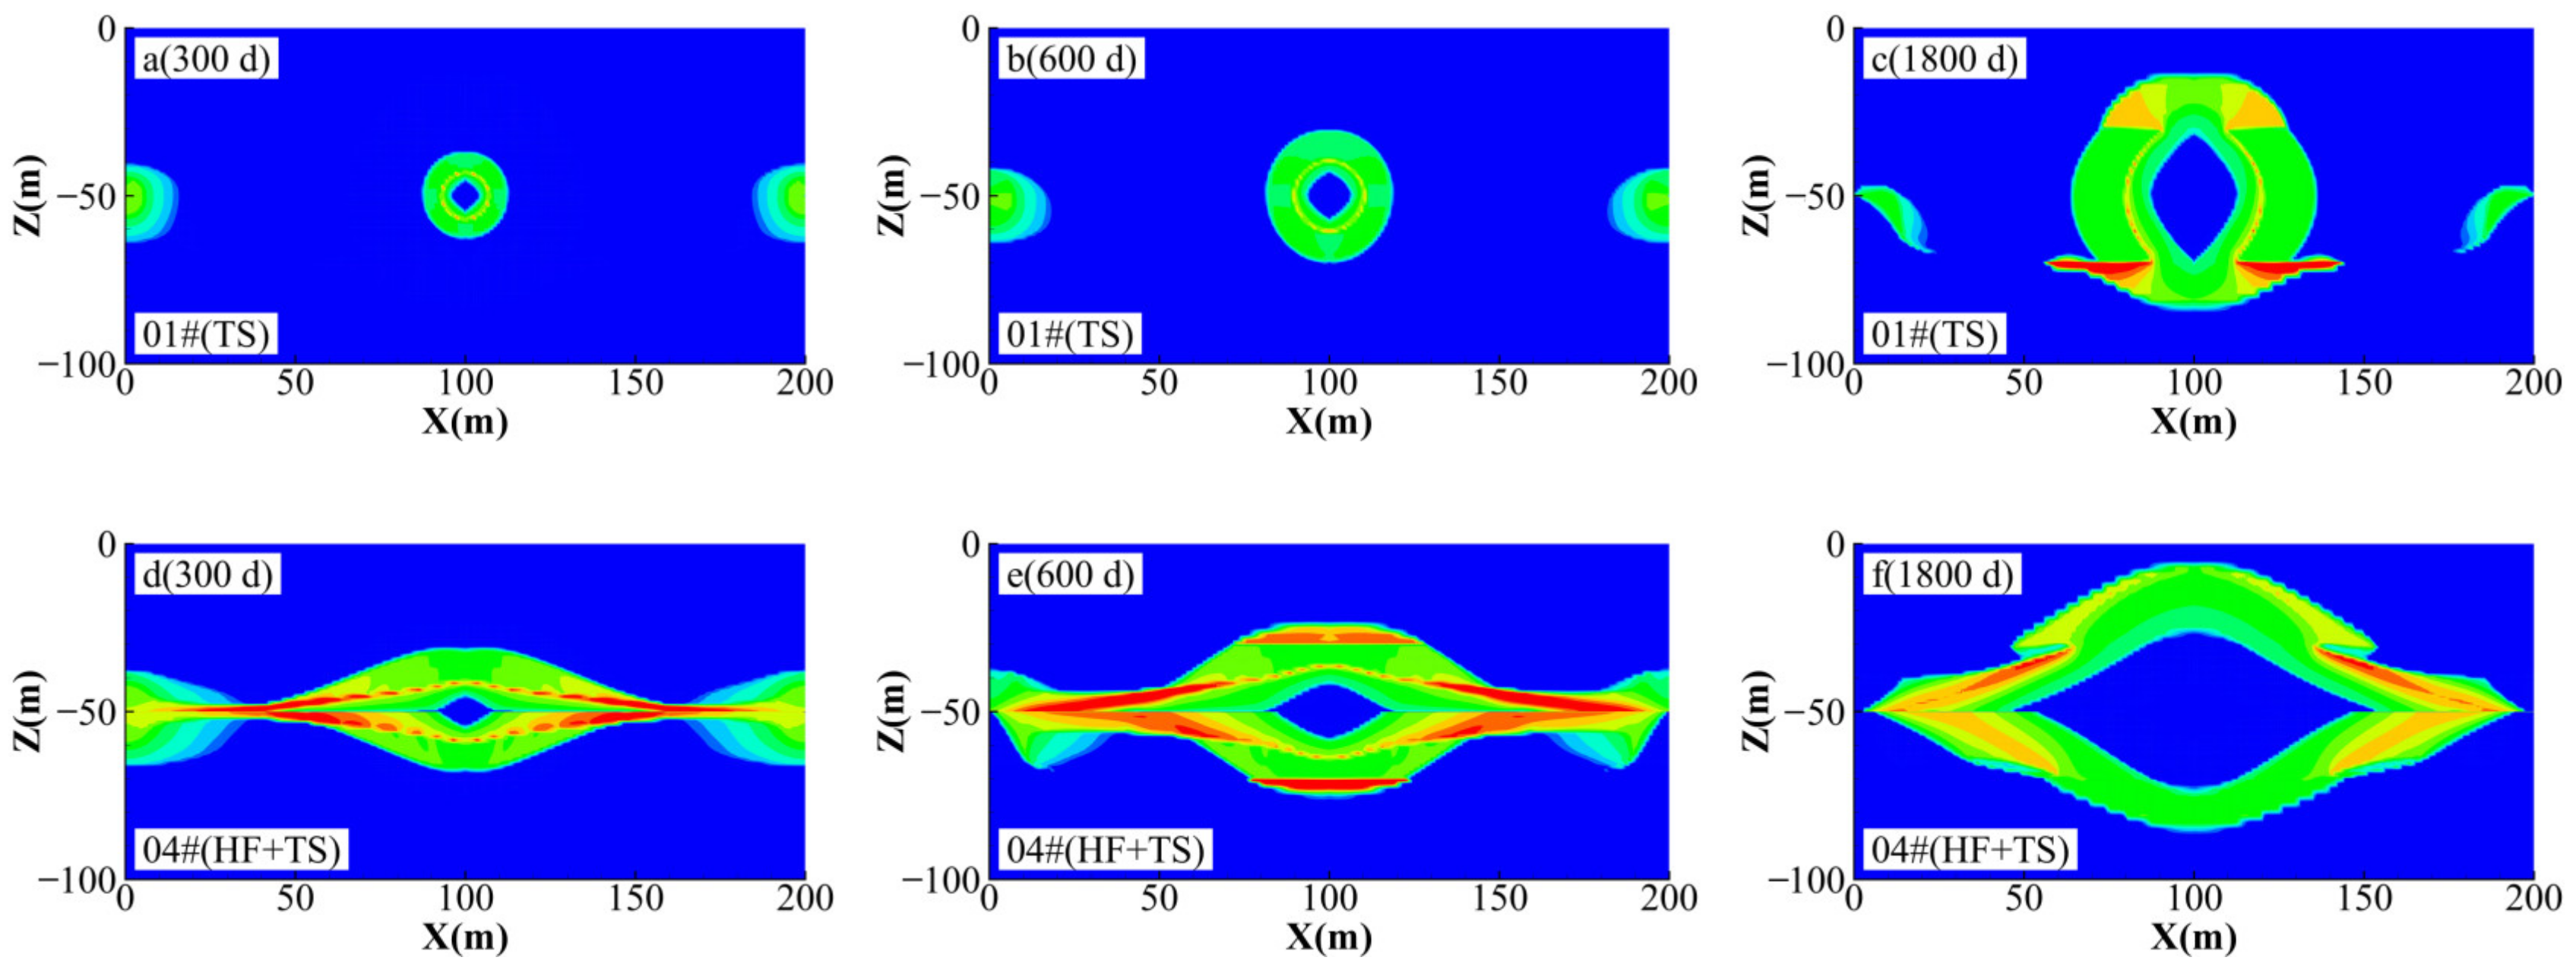
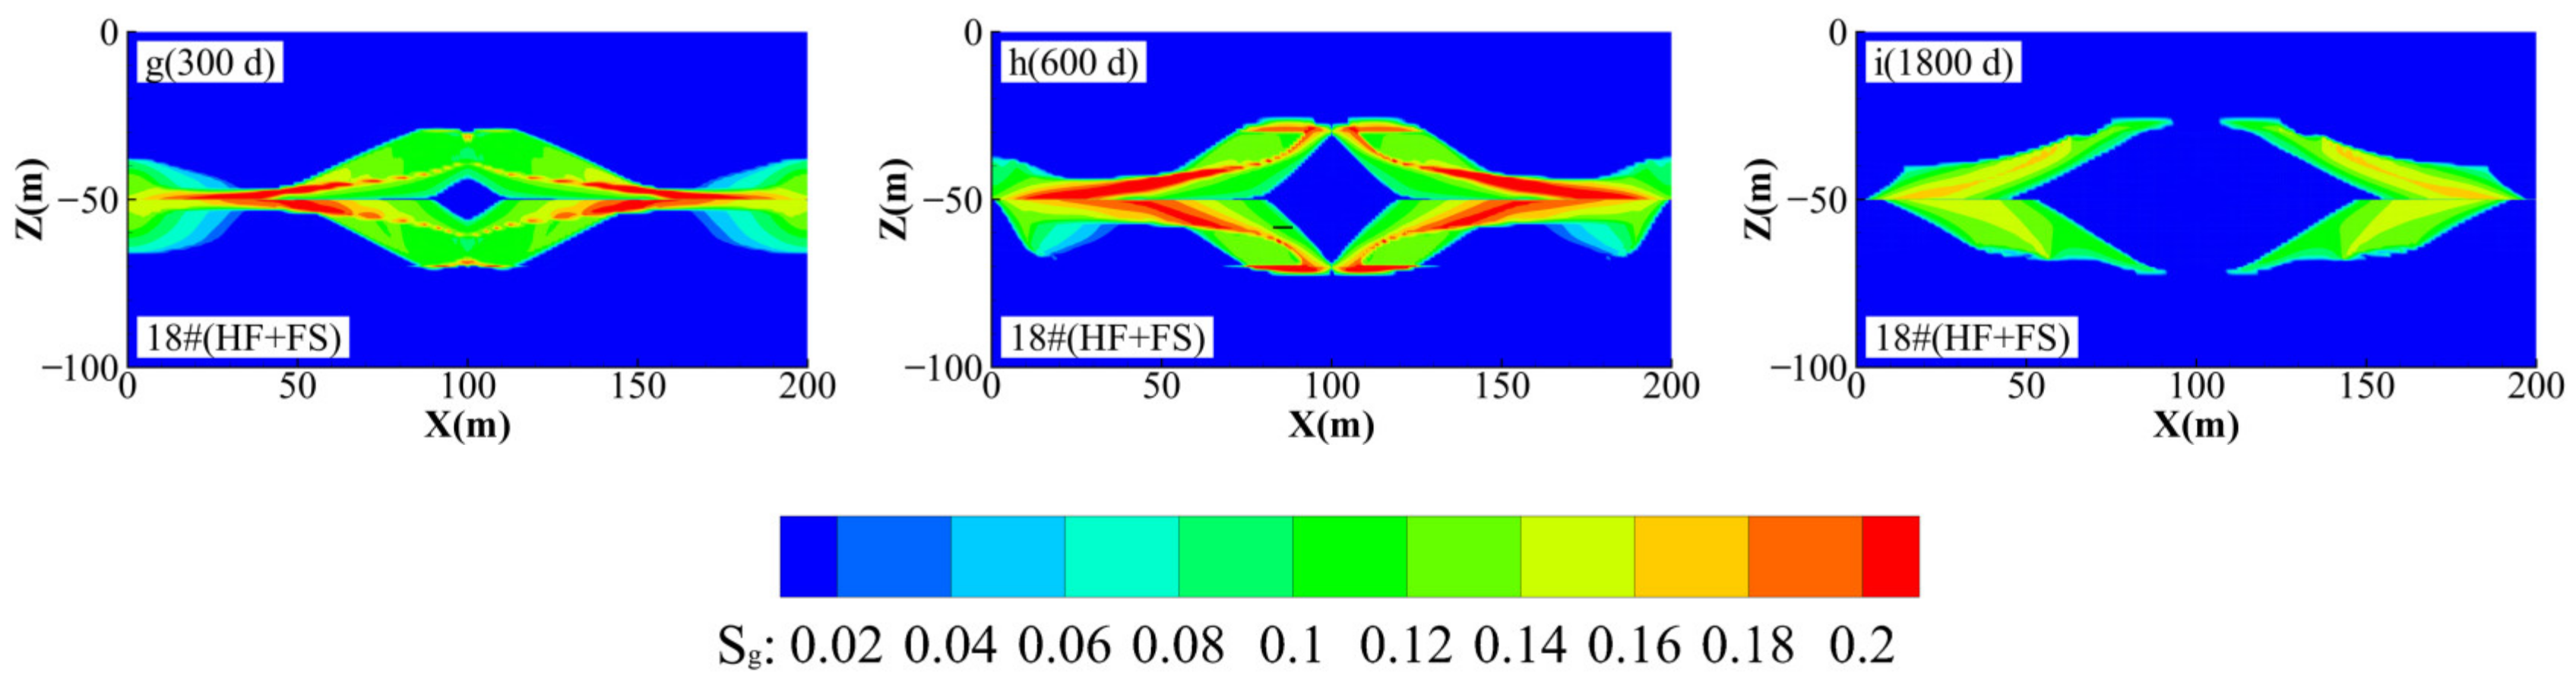
- Gas saturation evolution
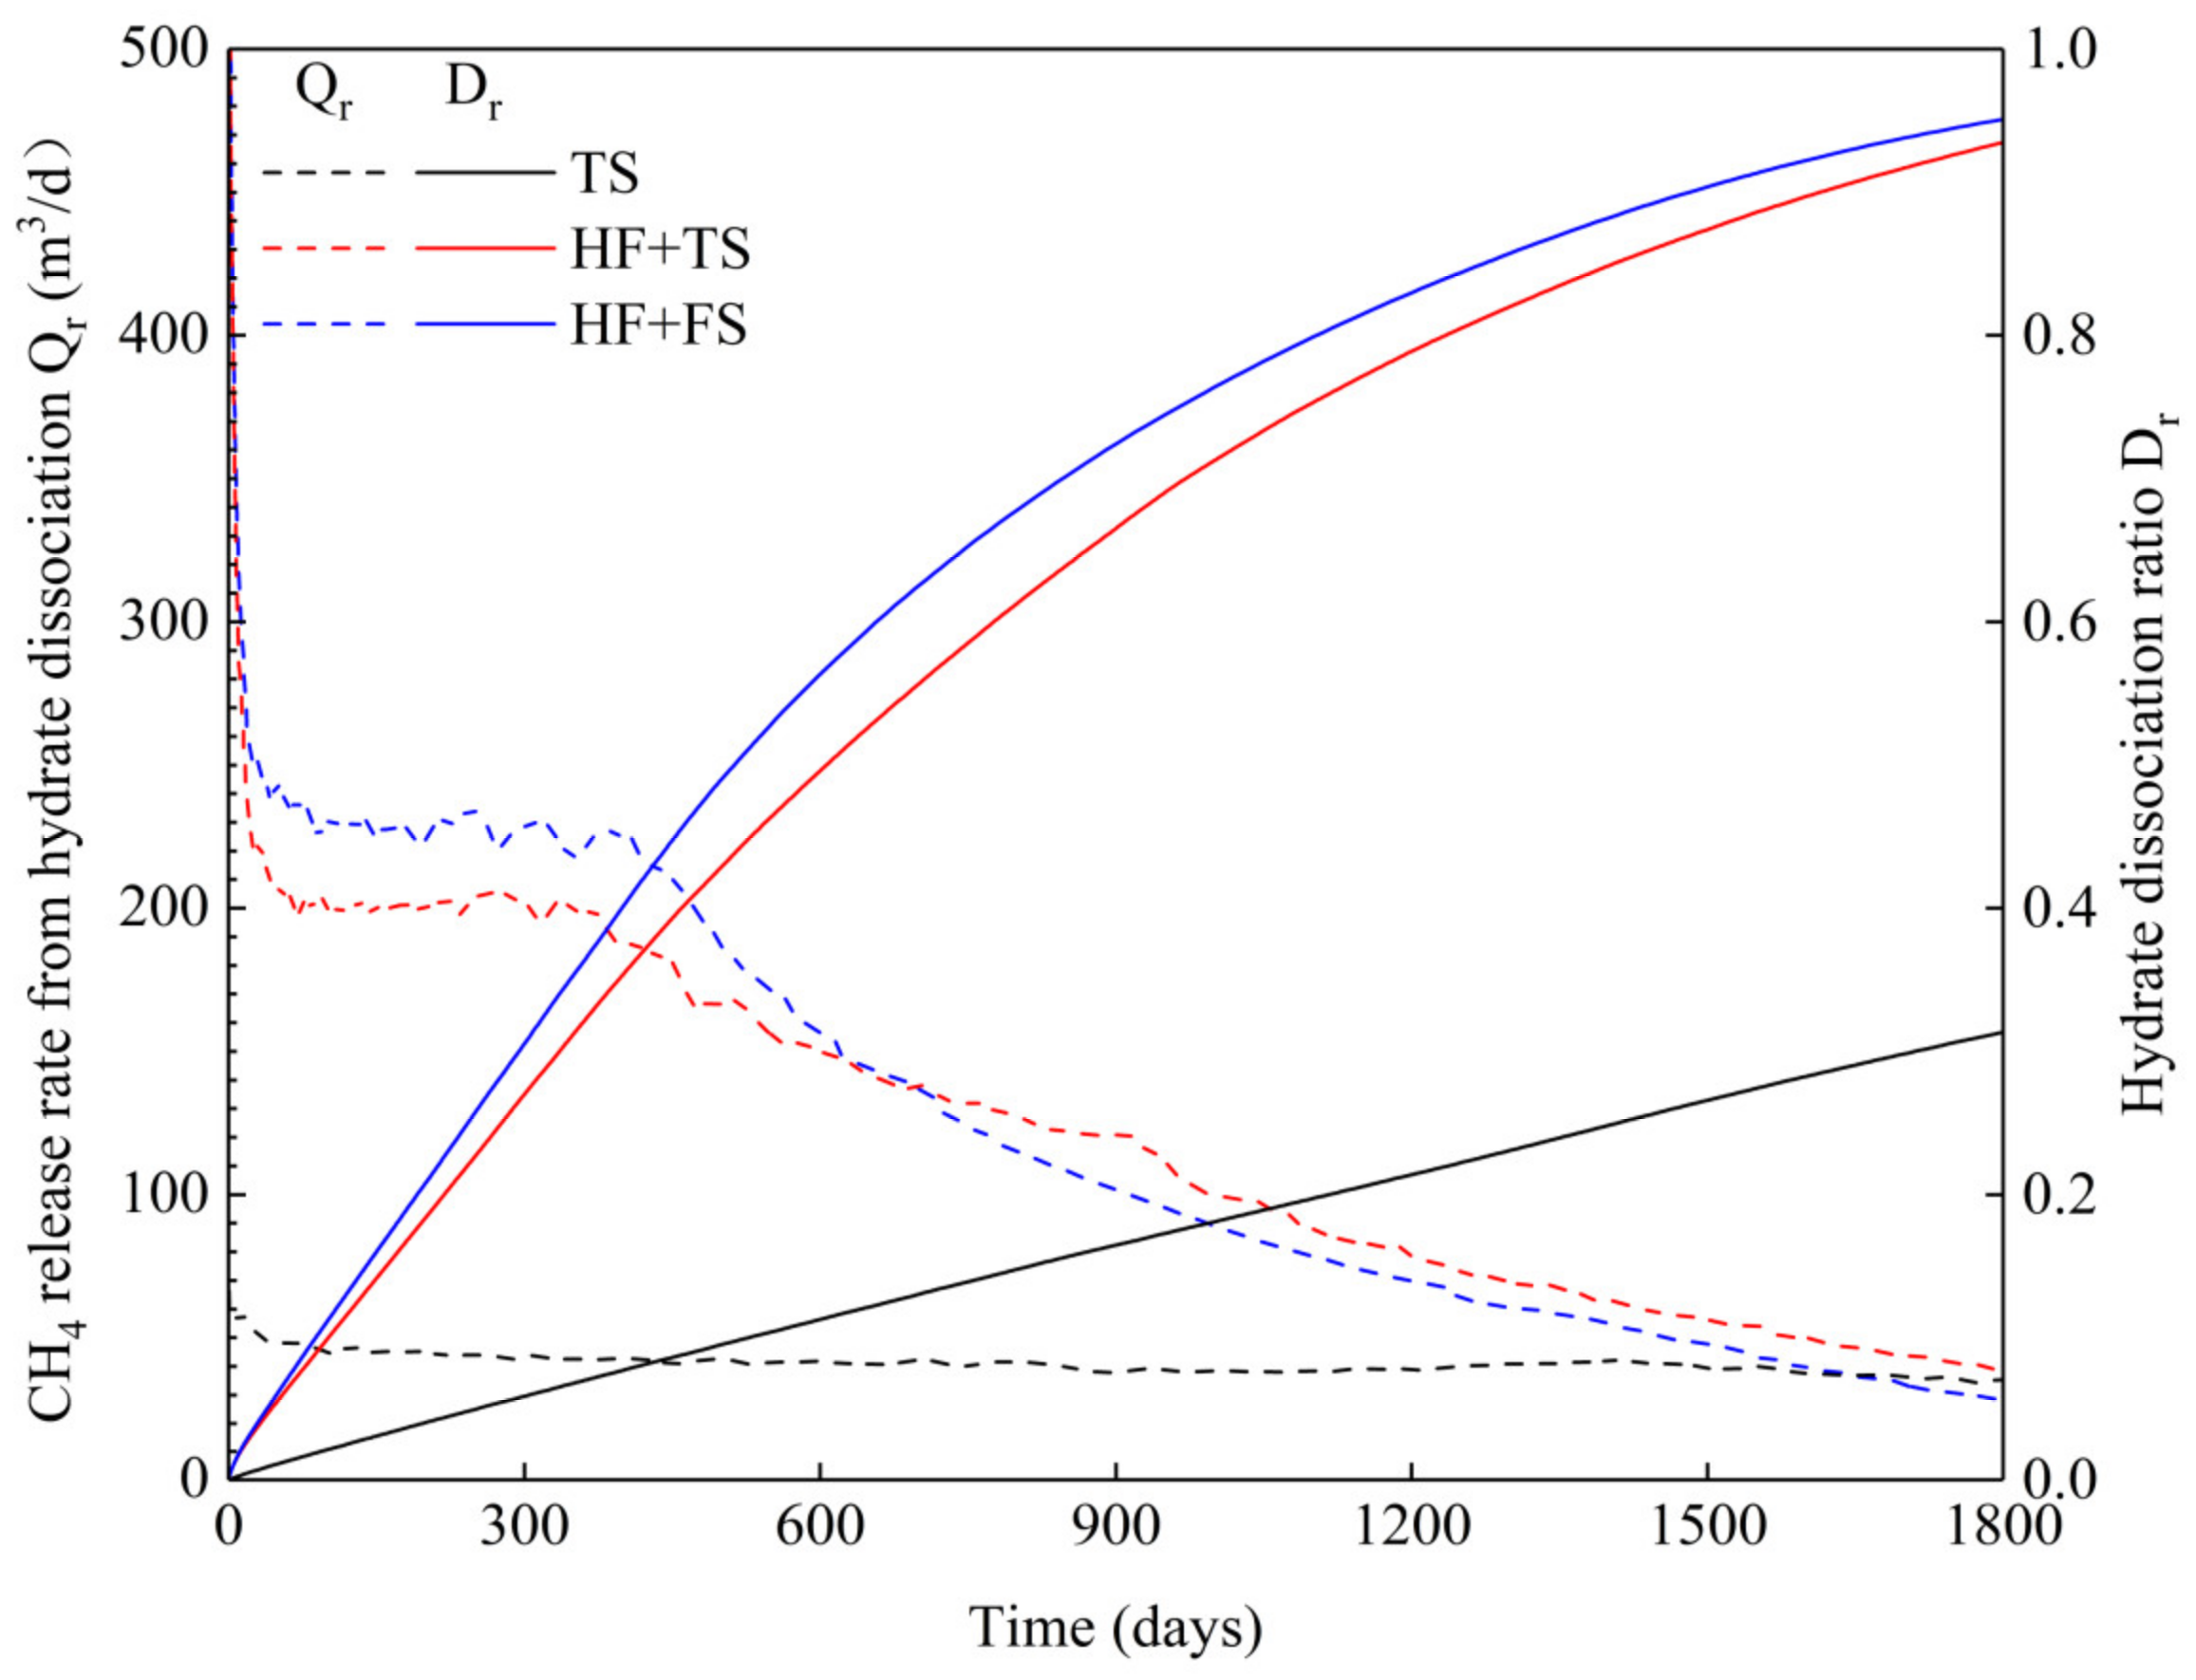
3.1.2. Hydrate Dissociation Behavior
3.1.3. Gas Production Behavior
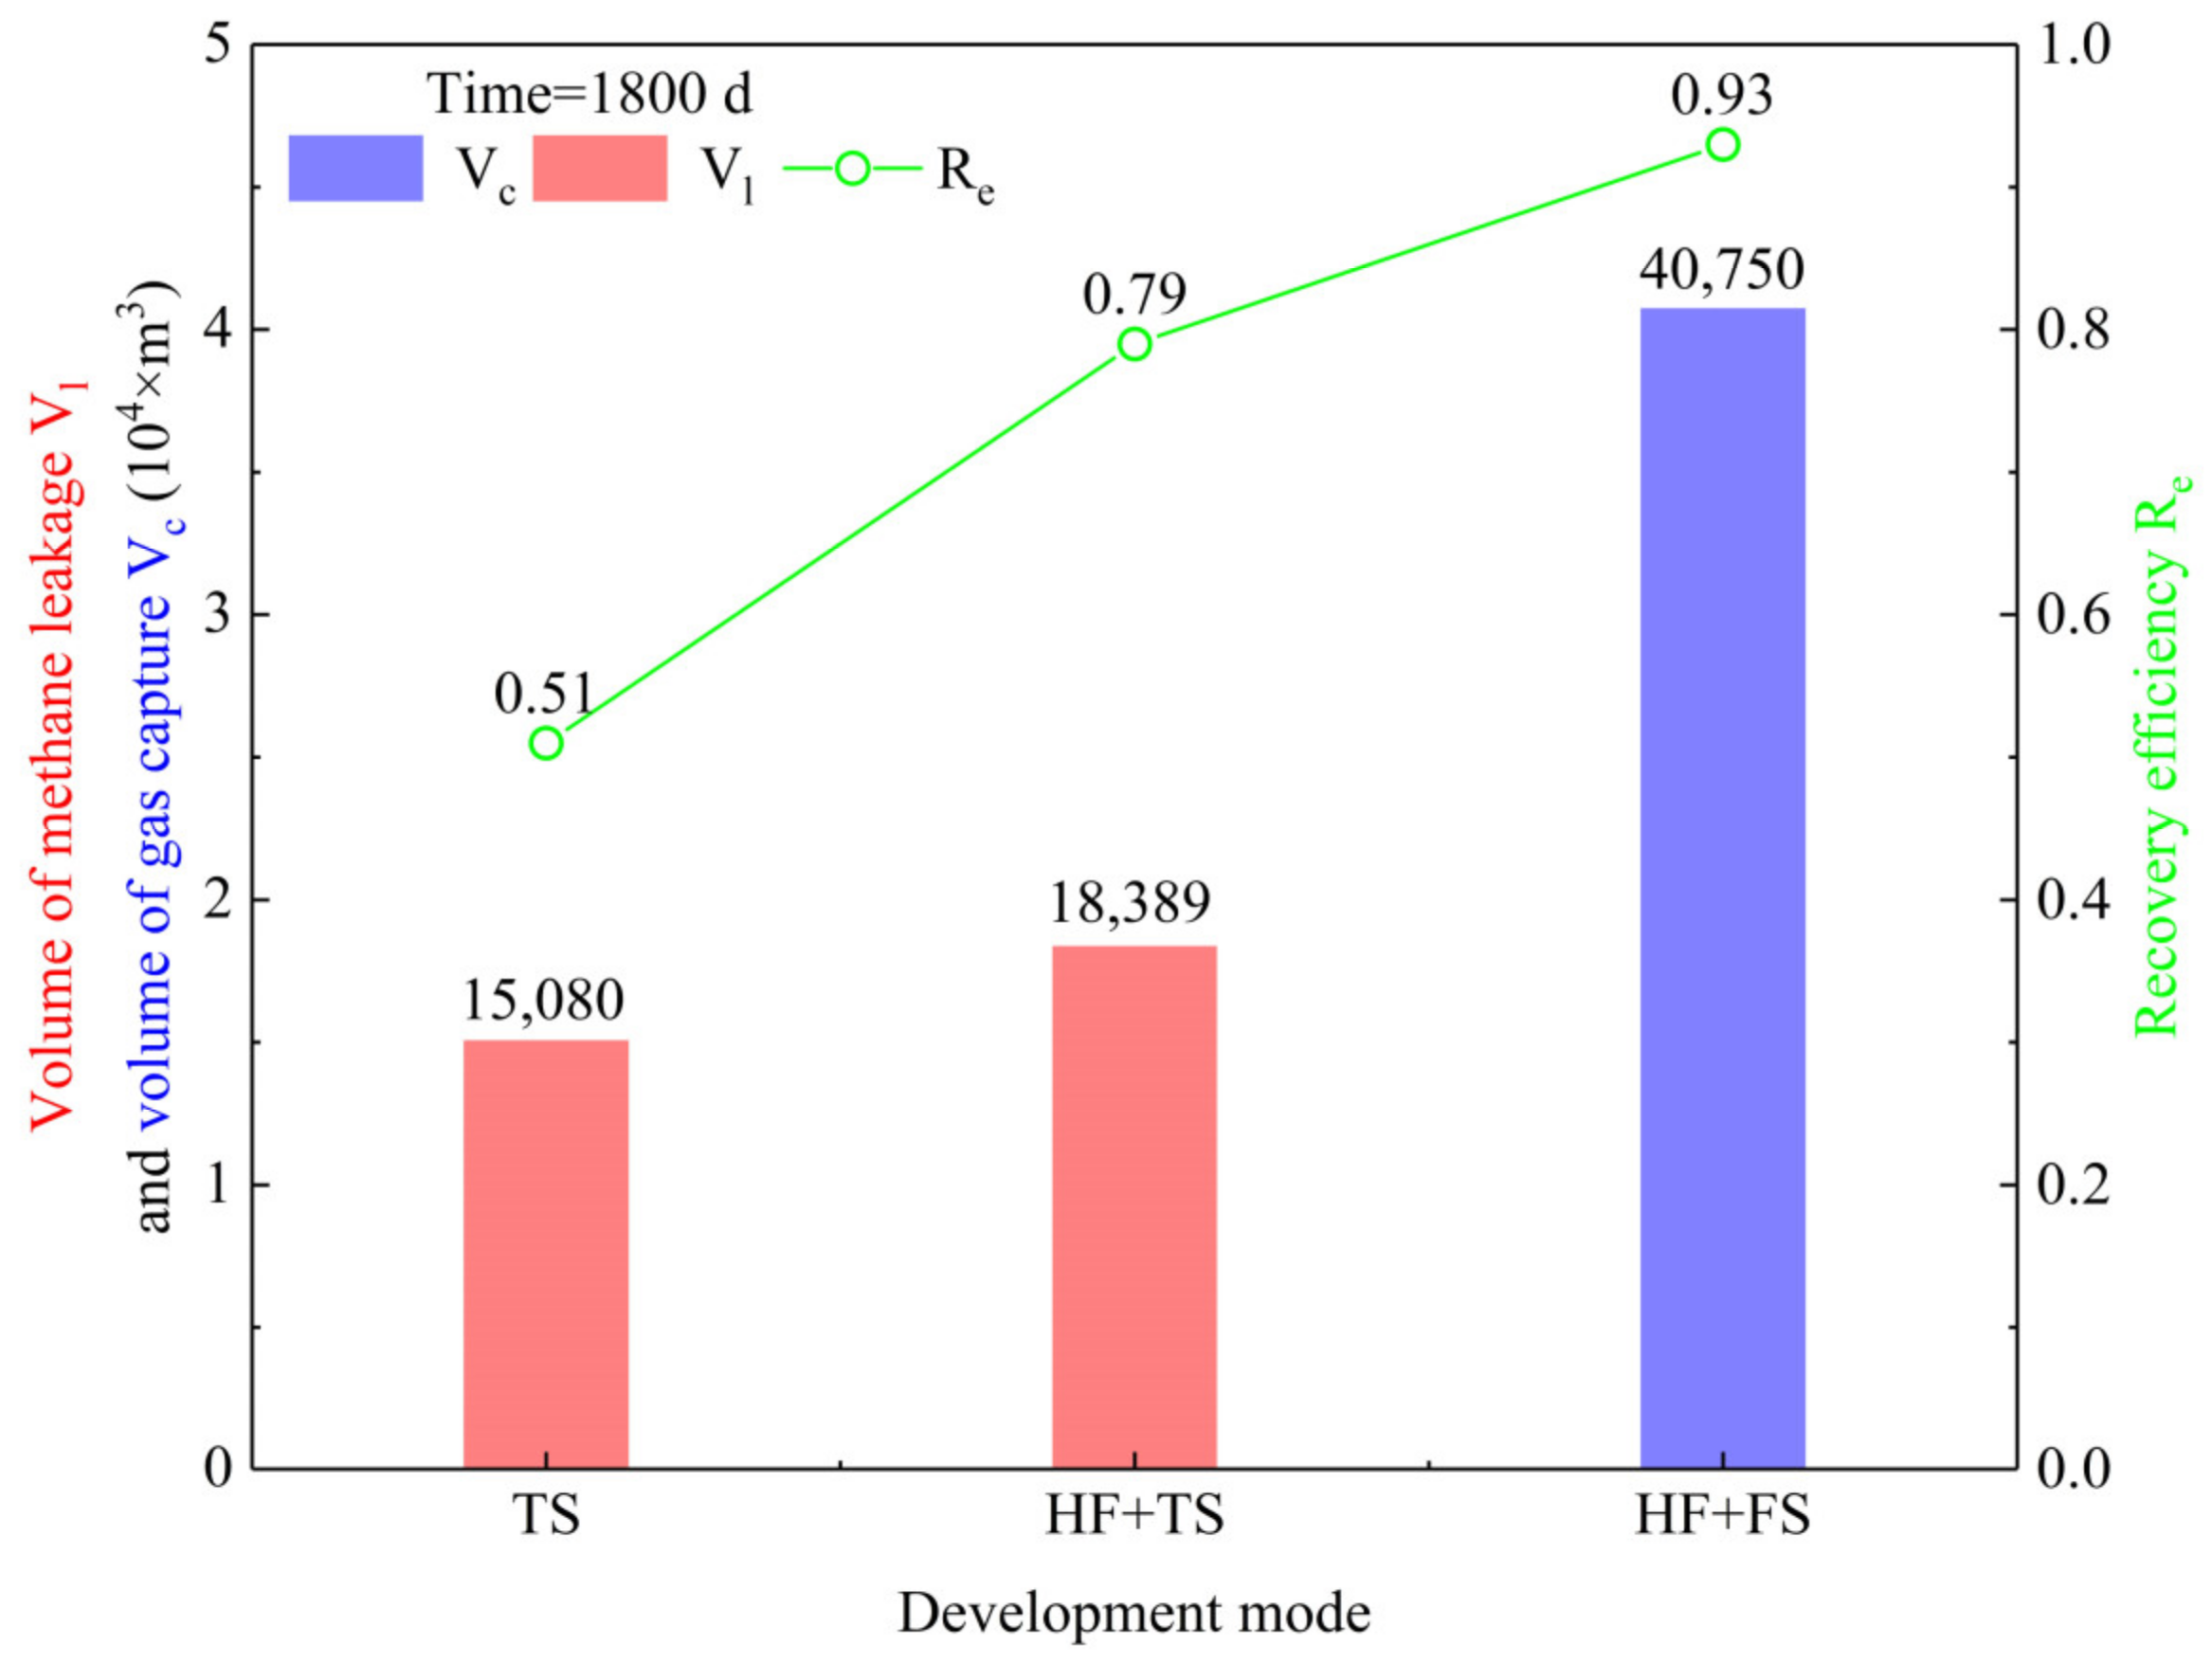
3.1.4. Methane Leakage, Gas Capture, and Recovery Efficiency
3.2. The Effect of Fracture Conductivity
3.2.1. Hydrate Dissociation Behavior
3.2.2. Gas Production Behavior
3.2.3. Methane Leakage, Gas Capture, and Recovery Efficiency
3.3. The Effect of Well Spacing
3.3.1. Hydrate Dissociation Behavior
3.3.2. Gas Production Behavior
3.3.3. Methane Leakage, Gas Capture, and Recovery Efficiency
3.4. Variance Analysis
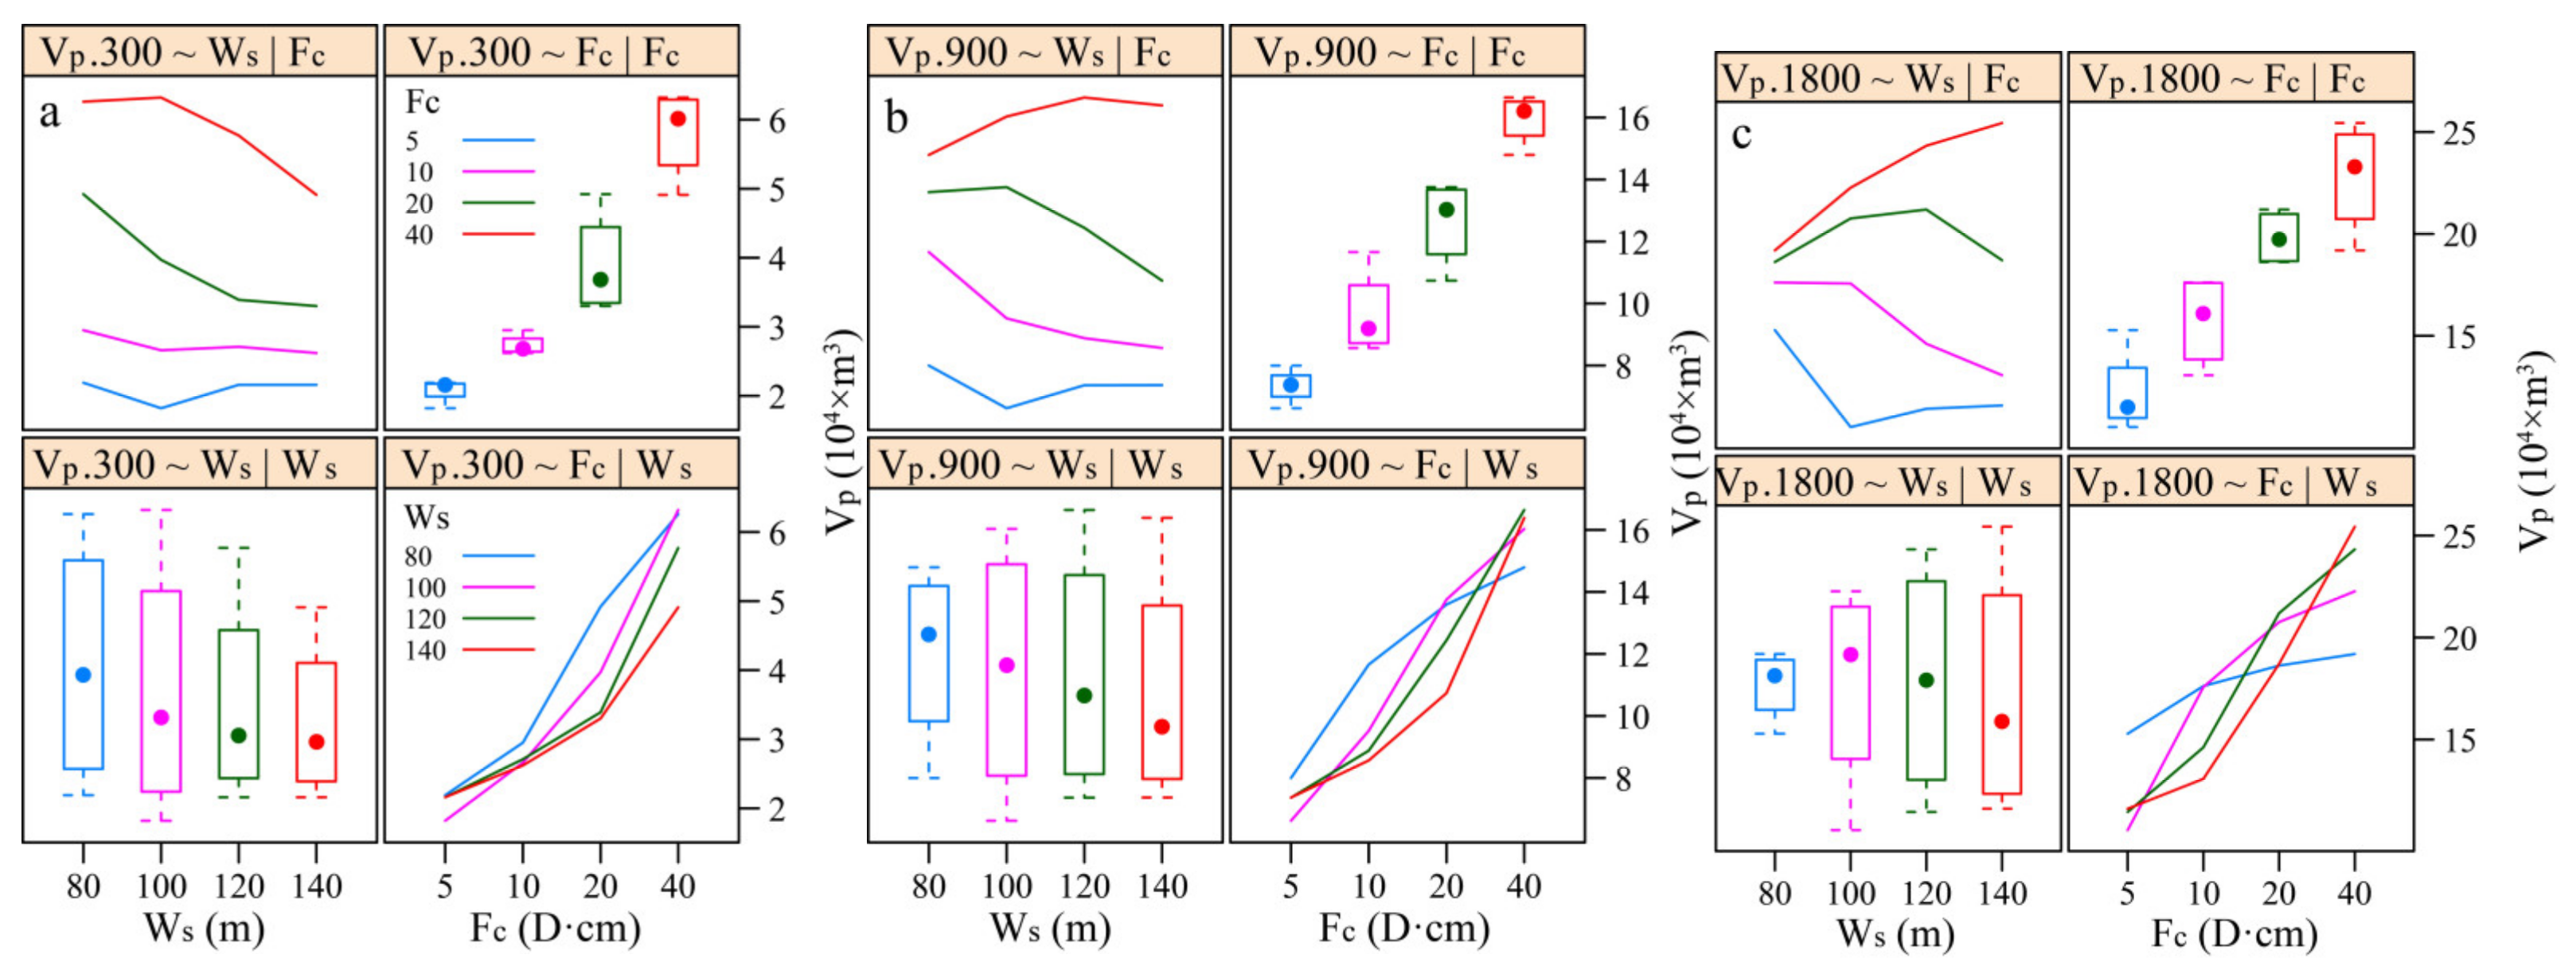
3.4.1. Gas Production
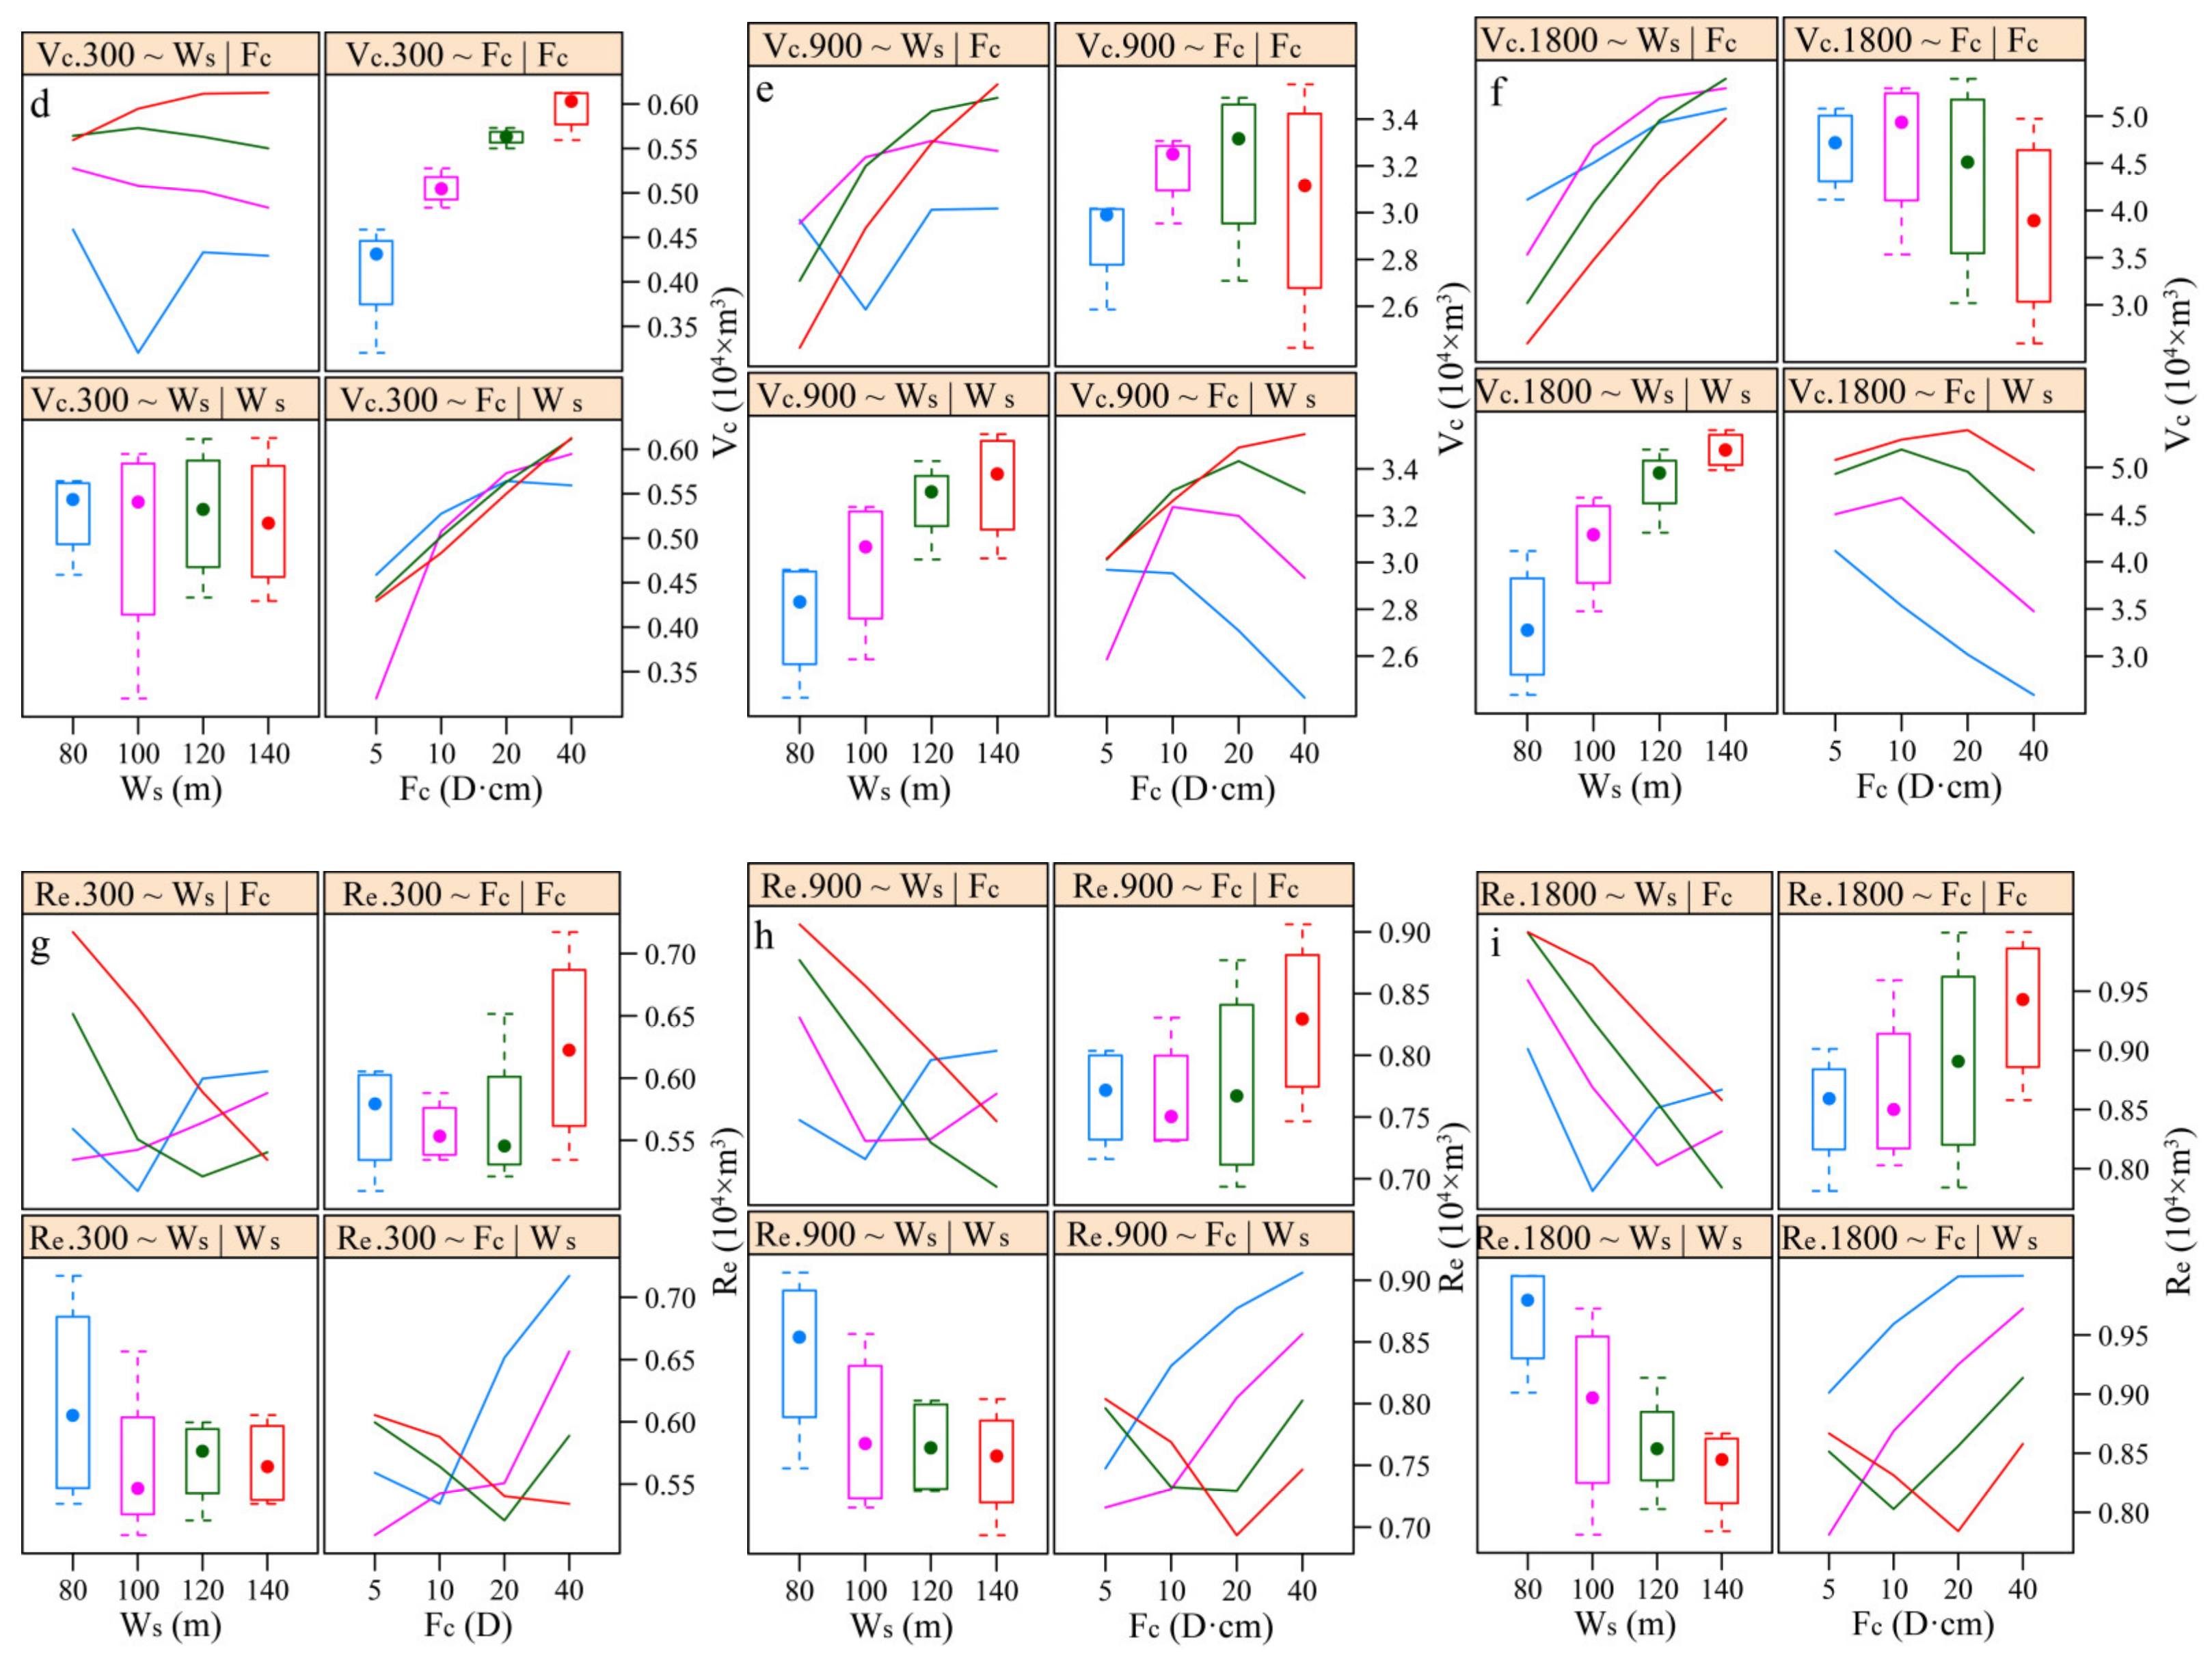
3.4.2. Gas Capture
3.4.3. Recovery Efficiency
4. Discussion
5. Conclusions
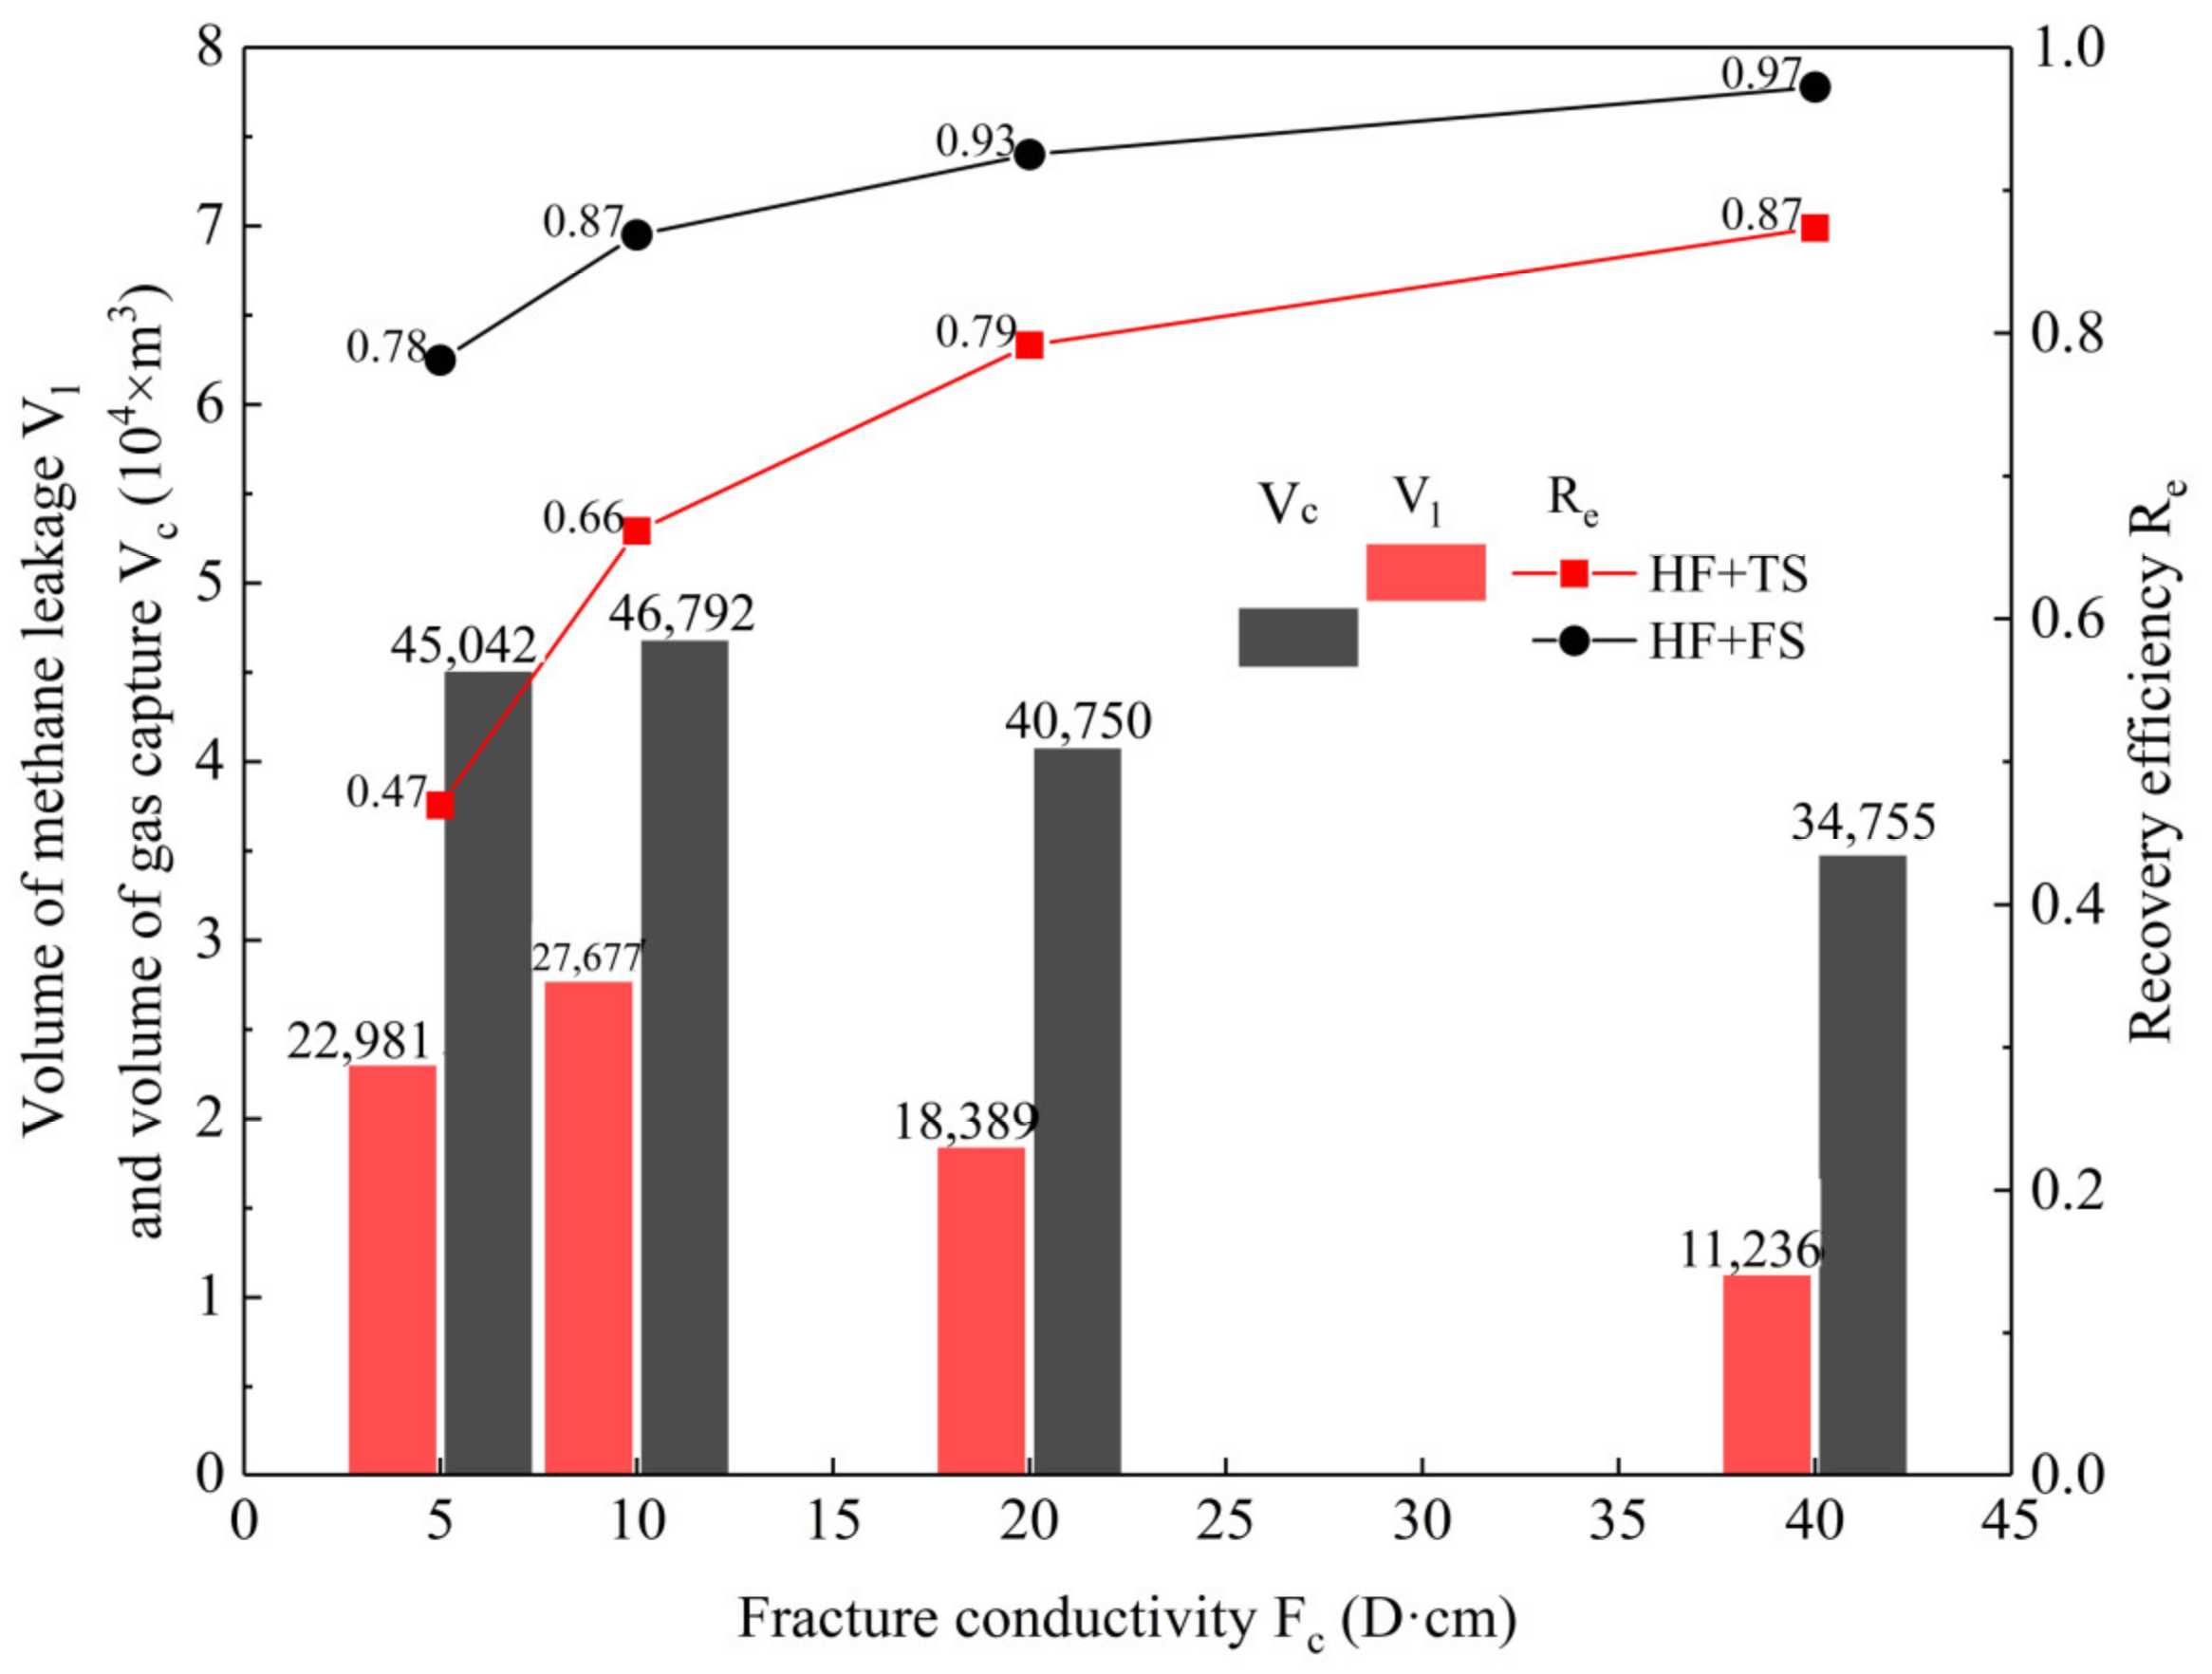
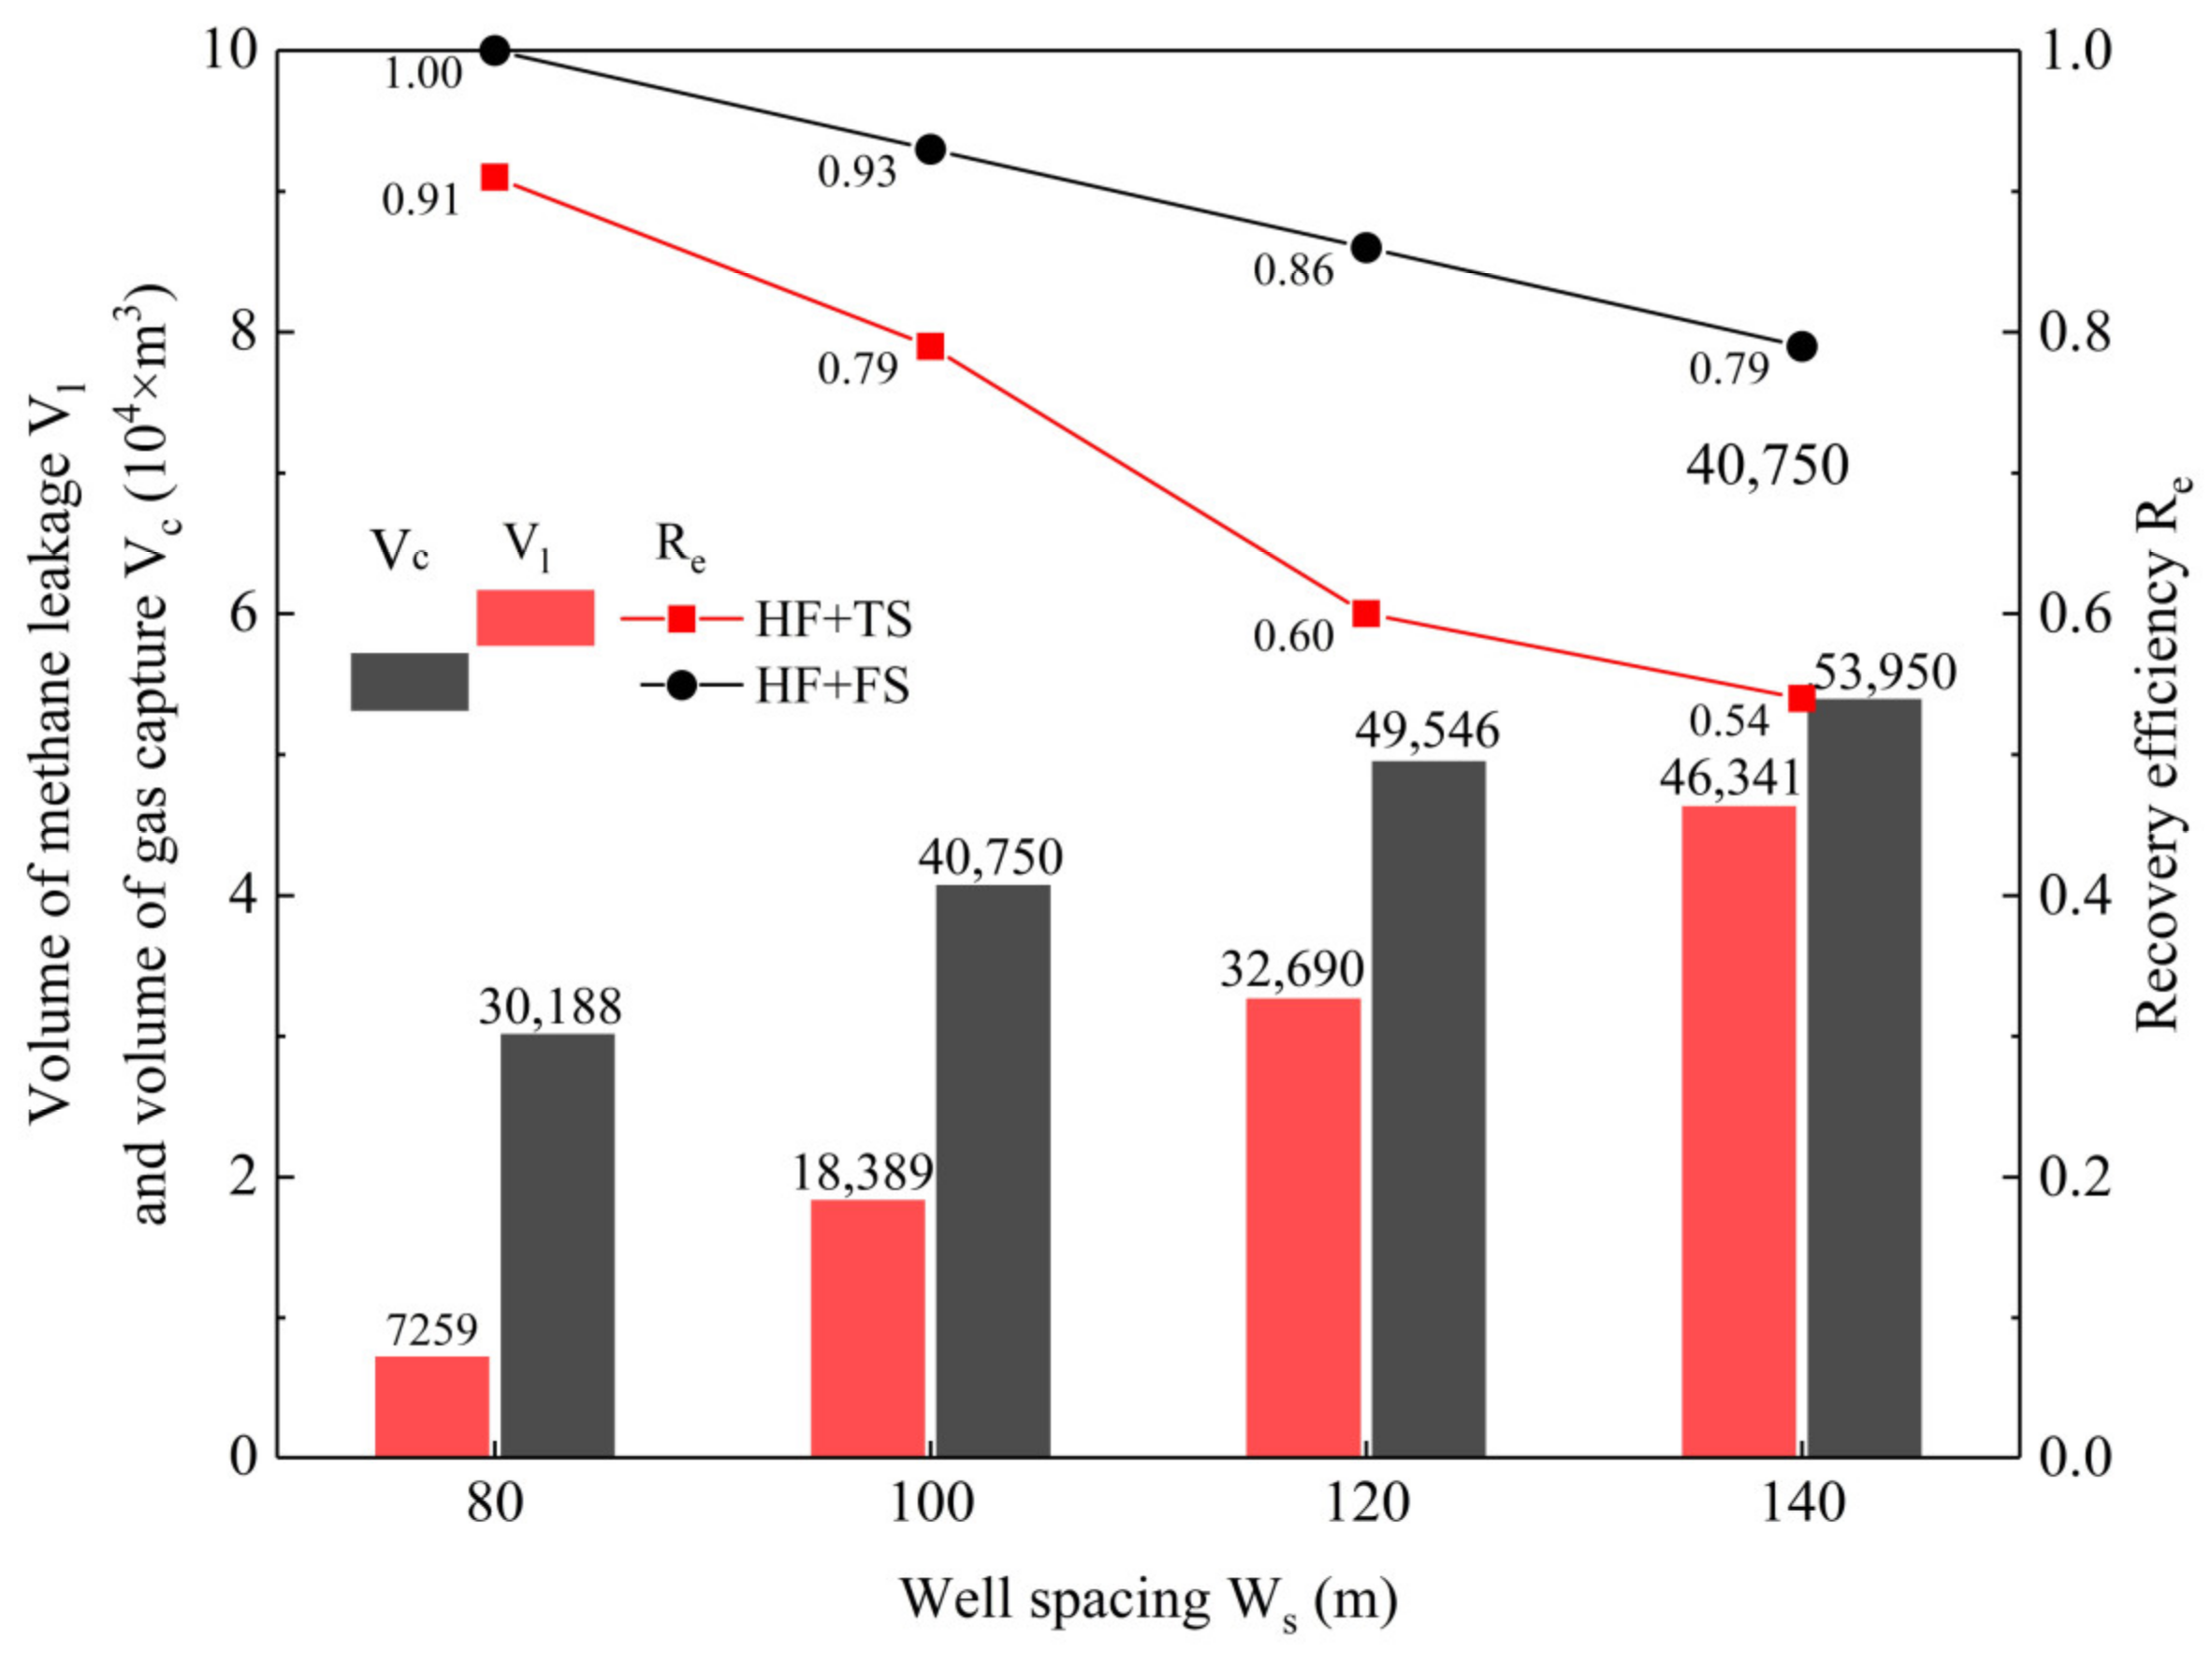
- For the three-spot well pattern, there was considerable methane leakage into the permeable boundary layers. The leakage volume increases as the well spacing increases and reaches 46,341 m3 when the well spacing is 140 m. The impact of fracture conductivity on methane leakage shows two opposite stages: when the fracture conductivity is lower than 20 D·cm, the leakage volume increases as the fracture conductivity increases; when the fracture conductivity is higher than 20 D·cm, the opposite is true. However, enhancing the fracture conductivity can not prevent methane leakage, as a leakage volume of 11,236 m3 was observed at the greatest fracture conductivity of 40 D·cm.
- The proposed five-spot well pattern combined with hydraulic fracturing could realize the safe development of CH-kb under a large well spacing. Even at the well spacing of 140 m, there is still no methane leakage. Additionally, increasing the well spacing increased the risk of methane leakage. Consequently, deploying capture wells is crucial for expanding safe well spacing.
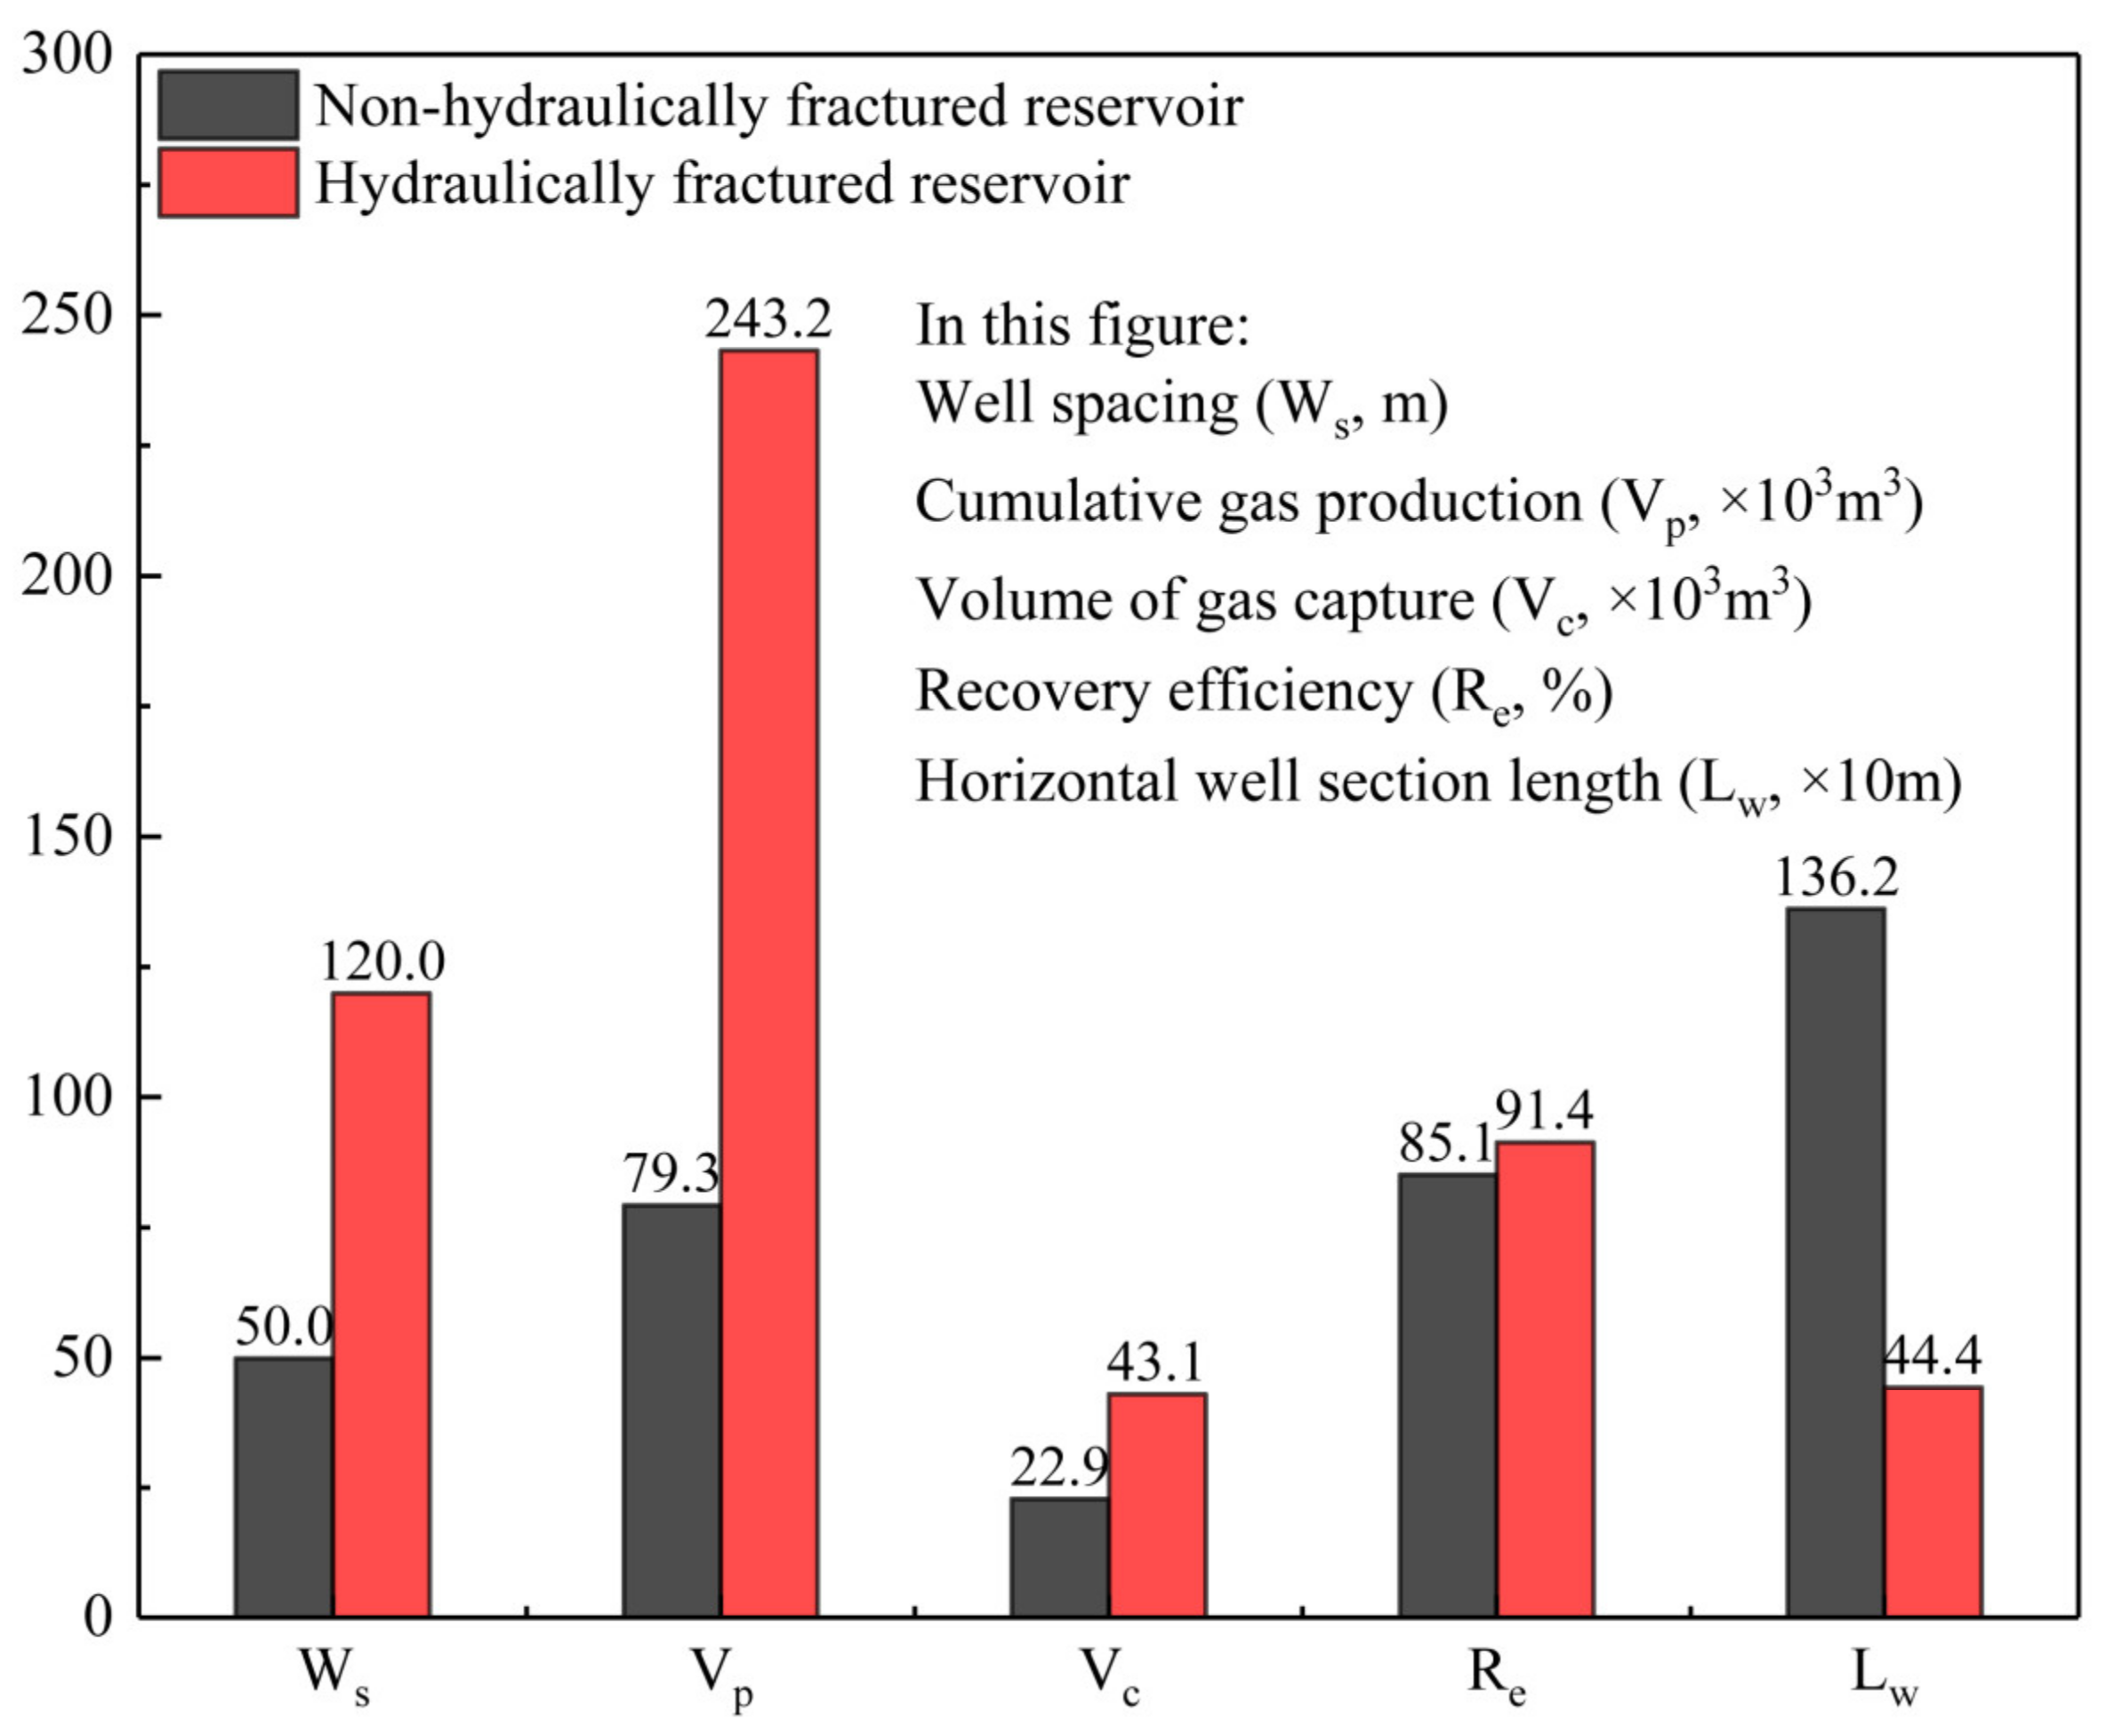
- Compared with the three-spot, the five-spot further increases the gas production and recovery and is expected to meet the commercial production threshold of hydrates. In the current simulations, the five-spot maximizes total gas production and recovery efficiency by 87 and 31%, respectively, compared to the three-spot. The average gas production rate reached 142 m3/d per unit horizontal section length, and a horizontal section length of 425 m was estimated to meet the commercial threshold.
- The development mode of hydraulic fracturing combined with the five-spot well pattern enhances the production potential of CH-kb while addressing methane leakage, which is safe and efficient for the development of low-permeable hydrate reservoirs with permeable boundary layers. In particular, a comprehensive analysis of gas production, methane capture, and gas recovery indicates that the CH-kb hydrate reservoir at the SH2 site in the Shenhu area is suitable for a well spacing of 100–120 m and fracture conductivity greater than 20 D·cm.
Author Contributions
Funding
Institutional Review Board Statement
Informed Consent Statement
Data Availability Statement
Conflicts of Interest
References
- Sloan, E.D., Jr.; Koh, C.A. Clathrate Hydrates of Natural Gases; Taylor & Francis Group: New York, NY, USA, 2008. [Google Scholar]
- Milkov, A.V. Global estimates of hydrate-bound gas in marine sediments: How much is really out there? Earth-Sci. Rev. 2004, 66, 183–197. [Google Scholar] [CrossRef]
- Klauda, J.B.; Sandler, S.I. Global Distribution of Methane Hydrate in Ocean Sediment. Energy Fuels 2005, 19, 459–470. [Google Scholar] [CrossRef]
- Kvenvolden, K.A. Methane hydrate—A major reservoir of carbon in the shallow geosphere? Chem. Geol. 1988, 71, 41–51. [Google Scholar] [CrossRef]
- Makogon, Y.F. Natural gas hydrates—A promising source of energy. J. Nat. Gas Sci. Eng. 2010, 2, 49–59. [Google Scholar] [CrossRef]
- Chong, Z.R.; Yang, S.H.B.; Babu, P.; Linga, P.; Li, X.-S. Review of natural gas hydrates as an energy resource: Prospects and challenges. Appl. Energy 2016, 162, 1633–1652. [Google Scholar] [CrossRef]
- Kayen, R.E.; Lee, H.J. Pleistocene slope instability of gas hydrate-laden sediment on the Beaufort sea margin. Mar. Geotechnol. 1991, 10, 125–141. [Google Scholar] [CrossRef]
- Liu, L.; Ryu, B.; Sun, Z.; Wu, N.; Cao, H.; Geng, W.; Zhang, X.; Jia, Y.; Xu, C.; Guo, L.; et al. Monitoring and research on environmental impacts related to marine natural gas hydrates: Review and future perspective. J. Nat. Gas Sci. Eng. 2019, 65, 82–107. [Google Scholar] [CrossRef]
- Sun, H.; Chen, B.; Yang, M. Effect of multiphase flow on natural gas hydrate production in marine sediment. J. Nat. Gas Sci. Eng. 2020, 73, 103066. [Google Scholar] [CrossRef]
- Zhu, H.; Xu, T.; Yuan, Y.; Feng, G.; Xia, Y.; Xin, X. Numerical analysis of sand production during natural gas extraction from unconsolidated hydrate-bearing sediments. J. Nat. Gas Sci. Eng. 2020, 76, 103229. [Google Scholar] [CrossRef]
- Moridis, G.J.; Reagan, M.T.; Boyle, K.L.; Zhang, K. Evaluation of the Gas Production Potential of Some Particularly Challenging Types of Oceanic Hydrate Deposits. Transp. Porous Media 2011, 90, 269–299. [Google Scholar] [CrossRef]
- Dai, S.; Santamarina, J.C. Hydrate-Bearing Clayey Sediments: Morphology, Physical Properties, Production and Engineering/Geological Implications; Report DOE-GT-0009897-1; Georgia Institute of Technology: Atlanta, GA, USA, 2017. Available online: https://www.osti.gov/servlets/purl/1417303 (accessed on 7 July 2022). [CrossRef] [Green Version]
- Boswell, R.; Collett, T.S. Current perspectives on gas hydrate resources. Energy Environ. Sci. 2011, 4, 1206–1215. [Google Scholar] [CrossRef]
- Li, X.-S.; Xu, C.-G.; Zhang, Y.; Ruan, X.-K.; Li, G.; Wang, Y. Investigation into gas production from natural gas hydrate: A review. Appl. Energy 2016, 172, 286–322. [Google Scholar] [CrossRef] [Green Version]
- Yang, M.; Gao, Y.; Zhou, H.; Chen, B.; Li, Y. Gas production from different classes of methane hydrate deposits by the depressurization method. Int. J. Energy Res. 2019, 43, 5493–5505. [Google Scholar] [CrossRef]
- Sun, J.; Ning, F.; Li, S.; Zhang, K.; Liu, T.; Zhang, L.; Jiang, G.; Wu, N. Numerical simulation of gas production from hydrate-bearing sediments in the Shenhu area by depressurising: The effect of burden permeability. J. Unconv. Oil Gas Resour. 2015, 12, 23–33. [Google Scholar] [CrossRef]
- Gao, Y.; Yang, M.; Zheng, J.-N.; Chen, B. Production characteristics of two class water-Excess methane hydrate deposits during depressurization. Fuel 2018, 232, 99–107. [Google Scholar] [CrossRef]
- Wang, B.; Fan, Z.; Zhao, J.; Lv, X.; Pang, W.; Li, Q. Influence of intrinsic permeability of reservoir rocks on gas recovery from hydrate deposits via a combined depressurization and thermal stimulation approach. Appl. Energy 2018, 229, 858–871. [Google Scholar] [CrossRef]
- Bhade, P.; Phirani, J. Gas production from layered methane hydrate reservoirs. Energy 2015, 82, 686–696. [Google Scholar] [CrossRef]
- Ahmadi, G.; Ji, C.; Smith, D.H. Production of natural gas from methane hydrate by a constant downhole pressure well. Energy Convers. Manag. 2007, 48, 2053–2068. [Google Scholar] [CrossRef]
- Wan, Q.-C.; Si, H.; Li, B.; Li, G. Heat transfer analysis of methane hydrate dissociation by depressurization and thermal stimulation. Int. J. Heat Mass Transf. 2018, 127, 206–217. [Google Scholar] [CrossRef]
- Ma, X.; Sun, Y.; Liu, B.; Guo, W.; Jia, R.; Li, B.; Li, S. Numerical study of depressurization and hot water injection for gas hydrate production in China’s first offshore test site. J. Nat. Gas Sci. Eng. 2020, 83, 103530. [Google Scholar] [CrossRef]
- Li, B.; Liang, Y.-P.; Li, X.-S.; Zhou, L. A pilot-scale study of gas production from hydrate deposits with two-spot horizontal well system. Appl. Energy 2016, 176, 12–21. [Google Scholar] [CrossRef]
- Jin, G.; Xu, T.; Xin, X.; Wei, M.; Liu, C. Numerical evaluation of the methane production from unconfined gas hydrate-bearing sediment by thermal stimulation and depressurization in Shenhu area, South China Sea. J. Nat. Gas Sci. Eng. 2016, 33, 497–508. [Google Scholar] [CrossRef]
- Methane Hydrate Resource Development Research Consortium. MH21-S R&D Consortium for Pore Filling Hydrate in Sand 2017. Available online: http://www.mh21japan.gr.jp/mh21wp/wp-content/uploads/mh21form2017_doc01.pdf (accessed on 3 May 2022).
- Chen, C.; Meng, Y.; Zhong, X.; Nie, S.; Ma, Y.; Pan, D.; Liu, K.; Li, X.; Gao, S. Research on the Influence of Injection–Production Parameters on Challenging Natural Gas Hydrate Exploitation Using Depressurization Combined with Thermal Injection Stimulated by Hydraulic Fracturing. Energy Fuels 2021, 35, 15589–15606. [Google Scholar] [CrossRef]
- Zhong, X.; Pan, D.; Zhai, L.; Zhu, Y.; Zhang, H.; Zhang, Y.; Wang, Y.; Li, X.; Chen, C. Evaluation of the gas production enhancement effect of hydraulic fracturing on combining depressurization with thermal stimulation from challenging ocean hydrate reservoirs. J. Nat. Gas Sci. Eng. 2020, 83, 103621. [Google Scholar] [CrossRef]
- Ju, X.; Liu, F.; Fu, P.; White, M.D.; Settgast, R.R.; Morris, J.P. Gas Production from Hot Water Circulation through Hydraulic Fractures in Methane Hydrate-Bearing Sediments: THC-Coupled Simulation of Production Mechanisms. Energy Fuels 2020, 34, 4448–4465. [Google Scholar] [CrossRef]
- Nie, S.; Zhong, X.; Ma, Y.; Pan, D.; Liu, K.; Wang, Y.; Li, X.; Chen, C. Numerical simulation of a new methodology to exploit challenging marine hydrate reservoirs without impermeable boundaries. J. Nat. Gas Sci. Eng. 2021, 96, 104249. [Google Scholar] [CrossRef]
- Skarke, A.; Ruppel, C.; Kodis, M.; Brothers, D.; Lobecker, E. Widespread methane leakage from the sea floor on the northern US Atlantic margin. Nat. Geosci. 2014, 7, 657–661. [Google Scholar] [CrossRef]
- Pillsbury, L.; Weber, T.C. Fate of methane gas bubbles emitted from the seafloor along the Western Atlantic Margin as observed by active sonar. J. Acoust. Soc. Am. 2015, 137, 2361. [Google Scholar] [CrossRef]
- McGinnis, D.F.; Greinert, J.; Artemov, Y.; Beaubien, S.E.; Wüest, A. Fate of rising methane bubbles in stratified waters: How much methane reaches the atmosphere? J. Geophys. Res. 2006, 111, C09007. [Google Scholar] [CrossRef]
- Daigle, H.; Bangs, N.L.; Dugan, B. Transient hydraulic fracturing and gas release in methane hydrate settings: A case study from southern Hydrate Ridge. Geochem. Geophys. Geosyst. 2011, 12, 12022–12036. [Google Scholar] [CrossRef]
- Jin, Z.-H.; Johnson, S.E.; Cook, A.E. Crack extension induced by dissociation of fracture-hosted methane gas hydrate. Geophys. Res. Lett. 2015, 42, 8522–8529. [Google Scholar] [CrossRef]
- Zhang, Y.; Zhai, W.-D. Shallow-ocean methane leakage and degassing to the atmosphere: Triggered by offshore oil-gas and methane hydrate explorations. Front. Mar. Sci. 2015, 2, 34. [Google Scholar] [CrossRef] [Green Version]
- Brown, P.; Sanders, R.; McDonagh, E.; Henson, S.; Best, A.I.; Poulton, A.J.; Mayor, D.J. Impacts and effects of ocean warming on carbon management including methane hydrates. In Explaining Ocean Warming: Causes, Scale, Effects and Consequences. Full Report; Baxter, J.M., Laffoley, D., Eds.; IUCN The World Conservation Union: Gland, Switzerland, 2016; pp. 373–388. [Google Scholar]
- Pierce, B.S.; Collett, T.S. Energy resource potential of natural gas hydrates. In Proceedings of the 5th Conference & Exposition Geophysics, Hyderabad, India, 15–17 January 2004; pp. 899–903. [Google Scholar]
- Chen, C.; Yang, L.; Jia, R.; Sun, Y.; Guo, W.; Chen, Y.; Li, X. Simulation Study on the Effect of Fracturing Technology on the Production Efficiency of Natural Gas Hydrate. Energies 2017, 10, 1241. [Google Scholar] [CrossRef] [Green Version]
- Yang, L.; Chen, C.; Jia, R.; Sun, Y.; Guo, W.; Pan, D.; Li, X.; Chen, Y. Influence of Reservoir Stimulation on Marine Gas Hydrate Conversion Efficiency in Different Accumulation Conditions. Energies 2018, 11, 339. [Google Scholar] [CrossRef] [Green Version]
- Zhong, X.; Pan, D.; Zhu, Y.; Wang, Y.; Zhai, L.; Li, X.; Tu, G.; Chen, C. Fracture network stimulation effect on hydrate development by depressurization combined with thermal stimulation using injection-production well patterns. Energy 2021, 228, 120601. [Google Scholar] [CrossRef]
- Moridis, G.; Kowalsky, M.; Pruess, K. TOUGH+ Hydrate V1.0 User’s Manual; Report LBNL-0149E; Lawrence Berkeley National Laboratory: Berkeley, CA, USA, 2008; pp. 37–41.
- Sondergeld, C.H.; Newsham, K.E.; Comisky, T.; Rice, M.C.; Rai, C.S. Petrophysical Considerations in Evaluating and Producing Shale Gas Resources. In Proceedings of the SPE Unconventional Gas Conference, Pittsburg, PA, USA, 23–25 February 2010; pp. 23–25. [Google Scholar]
- Van Genuchten, M.T. A Closed-form Equation for Predicting the Hydraulic Conductivity of Unsaturated Soils. Soil Sci. Soc. Am. J. 1980, 44, 892–898. [Google Scholar] [CrossRef] [Green Version]
- Moridis, G.J. Numerical Studies of Gas Production from Methane Hydrates. SPE J. 2003, 8, 359–370. [Google Scholar] [CrossRef]
- Yu, T.; Guan, G.; Abudula, A. Production performance and numerical investigation of the 2017 offshore methane hydrate production test in the Nankai Trough of Japan. Appl. Energy 2019, 251, 113338. [Google Scholar] [CrossRef]
- Yu, T.; Guan, G.; Abudula, A.; Wang, D. 3D investigation of the effects of multiple-well systems on methane hydrate production in a low-permeability reservoir. J. Nat. Gas Sci. Eng. 2020, 76, 103213. [Google Scholar] [CrossRef]
- Wu, N.; Zhang, H.; Yang, S.; Zhang, G.; Liang, J.; Lu, J.; Su, X.; Schultheiss, P.; Holland, M.; Zhu, Y. Gas Hydrate System of Shenhu Area, Northern South China Sea: Geochemical Results. J. Geol. Res. 2011, 2011, 370298. [Google Scholar] [CrossRef] [Green Version]
- Li, G.; Moridis, G.J.; Zhang, K.; Li, X. Evaluation of Gas Production Potential from Marine Gas Hydrate Deposits in Shenhu Area of South China Sea. Energy Fuels 2010, 24, 6018–6033. [Google Scholar] [CrossRef]
- Zhang, W.; Liang, J.; Wei, J.; Lu, J.; Su, P.; Lin, L.; Huang, W.; Guo, Y.; Deng, W.; Yang, X.; et al. Geological and geophysical features of and controls on occurrence and accumulation of gas hydrates in the first offshore gas-hydrate production test region in the Shenhu area, Northern South China Sea. Mar. Pet. Geol. 2020, 114, 104191. [Google Scholar] [CrossRef]
- MacFarland, T.W. Two-Way Analysis of Variance. Statistical Tests and Graphics Using R. Springer Briefs in Statistics; Springer: New York, NY, USA, 2012; p. 139. [Google Scholar]
- Nie, S.; Zhong, X.; Song, J.; Tu, G.; Chen, C. Experimental study on hydraulic fracturing in clayey-silty hydrate-bearing sediments and fracability evaluation based on multilayer perceptron-analytic hierarchy process. J. Nat. Gas Sci. Eng. 2022, 106, 104735. [Google Scholar] [CrossRef]
- Ma, X.; Jiang, D.; Sun, Y.; Li, S. Experimental study on hydraulic fracturing behavior of frozen clayey silt and hydrate-bearing clayey silt. Fuel 2022, 322, 124366. [Google Scholar] [CrossRef]
- Yang, L.; Shi, F.; Yang, J. Experimental Studies on Hydraulic Fracturing in Hydrate Sediment. Chem. Technol. Fuels Oils 2020, 56, 107–114. [Google Scholar] [CrossRef]
- Wang, Y.; Feng, J.-C.; Li, X.-S.; Zhang, Y.; Li, G. Analytic modeling and large-scale experimental study of mass and heat transfer during hydrate dissociation in sediment with different dissociation methods. Energy 2015, 90, 1931–1948. [Google Scholar] [CrossRef]
- Wang, S.P.; Yu, R.Z.; Bian, Y.A. Numerical Simulation Study on Diamond-Shape Inverted Nine-Spot Well Pattern. Adv. Mater. Res. 2012, 594–597, 2632–2635. [Google Scholar] [CrossRef]
- Xu, Q.; Liu, X.; Yang, Z.; Wang, J. The model and algorithm of a new numerical simulation software for low permeability reservoirs. J. Pet. Sci. Eng. 2011, 78, 239–242. [Google Scholar] [CrossRef]


| Parameters | Value |
|---|---|
| Formation thickness (Overlayer, HBL, and underlayer) | 30, 40, 30 m [26] |
| Intrinsic permeability of wells | 1 × 10⁻⁹ m2 (=1000 D) [11] |
| Intrinsic porosity of wells | 1 [11] |
| Initial water saturation (Overlayer, HBL, and underlayer) | 1, 0.56, 1 |
| Porewater salinity (Overlayer, HBL, and underlayer) | 0.03 |
| Gas composition | CH4 100% |
| Dry thermal conductivity (All deposits) | 1 W/m/K |
| Wet thermal conductivity (All deposits) | 3.10 W/m/K |
| Grain density (All deposits) | 2600 kg/m3 |
| Grain-specific heat (All deposits) | 1000 J·K/kg |
| Threshold pressure | 1 × 10⁵ Pa [27] |
| pore structure index | 0.45 |
| Index for liquid phase | 3.50 |
| Index for gas phase | 3.50 |
| Irreducible aqueous saturation | 0.30 |
| Irreducible gas saturation | 0.03 |
| Scenario Number | Development Mode | Ws (m) | Fc (D·cm) | Scenario Number | Development Mode | Ws (m) | Fc (D·cm) |
|---|---|---|---|---|---|---|---|
| 01# | TS | 100 | _ | 13# | HF + FS | 80 | 10 |
| 02# | HF + TS | 100 | 5 | 14# | HF + FS | 100 | 10 |
| 03# | HF + TS | 100 | 10 | 15# | HF + FS | 120 | 10 |
| 04# | HF + TS | 100 | 20 | 16# | HF + FS | 140 | 10 |
| 05# | HF + TS | 100 | 40 | 17# | HF + FS | 80 | 20 |
| 06# | HF + TS | 80 | 20 | 18# | HF + FS | 100 | 20 |
| 07# | HF + TS | 120 | 20 | 19# | HF + FS | 120 | 20 |
| 08# | HF + TS | 140 | 20 | 20# | HF + FS | 140 | 20 |
| 09# | HF + FS | 80 | 5 | 21# | HF + FS | 80 | 40 |
| 10# | HF + FS | 100 | 5 | 22# | HF + FS | 100 | 40 |
| 11# | HF + FS | 120 | 5 | 23# | HF + FS | 120 | 40 |
| 12# | HF + FS | 140 | 5 | 24# | HF + FS | 140 | 40 |
Publisher’s Note: MDPI stays neutral with regard to jurisdictional claims in published maps and institutional affiliations. |
© 2022 by the authors. Licensee MDPI, Basel, Switzerland. This article is an open access article distributed under the terms and conditions of the Creative Commons Attribution (CC BY) license (https://creativecommons.org/licenses/by/4.0/).
Share and Cite
Nie, S.; Chen, C.; Chen, M.; Song, J.; Wang, Y.; Ma, Y. Numerical Evaluation of a Novel Development Mode for Challenging Oceanic Gas Hydrates Considering Methane Leakage. Sustainability 2022, 14, 14460. https://doi.org/10.3390/su142114460
Nie S, Chen C, Chen M, Song J, Wang Y, Ma Y. Numerical Evaluation of a Novel Development Mode for Challenging Oceanic Gas Hydrates Considering Methane Leakage. Sustainability. 2022; 14(21):14460. https://doi.org/10.3390/su142114460
Chicago/Turabian StyleNie, Shuaishuai, Chen Chen, Min Chen, Jian Song, Yafei Wang, and Yingrui Ma. 2022. "Numerical Evaluation of a Novel Development Mode for Challenging Oceanic Gas Hydrates Considering Methane Leakage" Sustainability 14, no. 21: 14460. https://doi.org/10.3390/su142114460
APA StyleNie, S., Chen, C., Chen, M., Song, J., Wang, Y., & Ma, Y. (2022). Numerical Evaluation of a Novel Development Mode for Challenging Oceanic Gas Hydrates Considering Methane Leakage. Sustainability, 14(21), 14460. https://doi.org/10.3390/su142114460