Abstract
Inequality is a problem facing the world community, especially in developing countries, that affects urban transport and vice versa. Which possible urban transportation mode will cause the least inequality? This is a vital question. The development of Autonomous vehicles (AV) has made Shared Autonomous Vehicles (SAV) one of the future transport modes. Active and public transport are also mentioned as applicable future modes, based on the literature. This paper aims to compare inequality in active transportation, public transport and SAV as the most important alternatives to private cars in the future. In this regard, we use doughnut economic concepts as the framework for our comparison. First, the inequality concept is expanded and then literature demonstrates the future desirability of modes. We show why doughnut economics could be a beneficial alternative for comparing that resulted in the superiority of active and public transport over SAV in terms of future inequality.
1. Introduction
Sustainable development is a still growing concept approximately five decades since its introduction [1]. It shapes policy and strategies at all levels of governance from the United Nations, supranational bodies such as the European Union, countries, regions and localities. Researchers have tried to identify different dimensions of sustainable development according to their field [2]. However, despite global development, many goals set for sustainable development have not been achieved, such as equality. Inequality is still one of the most significant challenges, despite globalization and national development.
The rapid development of cities is one of the essential issues of the 21st century. The Department of Economic and Social Affairs of the United Nations predictions show the importance of this problem. According to the latest forecasts, by 2030, the proportion of urban dwellers in the world’s total population will reach 60%. This ratio will reach more than 68% in 2050. In 2018, the urban population ratios in Africa and Asia were 40% and 50%, respectively, which will reach 59% and 66% in the middle of the current century [3]. Thus, the growth of urbanization is more overriding in developing countries. Immigration and birth rates are two principal factors in increasing the population of cities. In these countries, cities provide much better opportunities for living [4]. So urban birth rate and internal migration rate (from rural to urban) in developing countries are significantly higher than in developed countries [5,6]. Urbanization growth is considered a factor in economic growth, poverty reduction and human development [3], but developing countries face various problems in their urban development process. The rapid growth of the urban population in developing countries has led to a significant part of the urban population not benefiting from basic living facilities. For example, slums formed in different patterns in African and Asian cities threaten human health [7,8].
Small cities have more equality than large ones [9], so inequality and poverty are notable concerns for big or developing cities. The inequality and the gap between urban and rural living standards increase the rate of rural–urban migration in developing countries [10]. This inequality creates other problems such as increasing crime rates and decreasing happiness [11]. However, the poverty threshold in urban areas omits some living requirements [12] and some people even live below this threshold in developing countries [13]. Therefore, providing appropriate solutions to eradicate the gap between different areas is vital for future city planning. Inequity in urban environments is another worrying factor in the future of cities. While inequality refers to the unequal distribution of appropriate opportunities for citizens, inequity refers to the non-distribution of proper facilities for each group. For example, the lack of accessibility to transportation systems for different groups causes inequity [14,15,16,17].
Urban population growth increases the population density and transportation demands. Due to problems such as pollution [18], effects on health standards [19] and infrastructure development costs such as parking space [20], using the private car is inapplicable. In contrast, the dominant approach is developing public and active transportation [21,22]. In recent years, using shared autonomous vehicles (SAVs) has been considered a new solution and has been studied widely [23].
Inequality in societies displays a cycle [24]. Its existence in each sector causes its creation in others. Fighting against inequality is Goal 10 of the Sustainable Development Goals (SDG 10) by the UN as a part of the 2030 Agenda for Sustainable Development [25]. Inequality in transportation is no exception to this rule and reproduces inequality in the economy, education and health among economic, gender and racial/ethnic groups [26]. Transport inequalities are inextricably linked to the problem of transport exclusion or transport poverty, which is at the heart of social exclusion [16,17,27]. Therefore, reducing transportation inequality/inequity is required to achieve sustainable societies. Moreover, the implementation of this demand meets the idea of transport justice, as proposed by Martens [28], which in turn can be interpreted as an axis of spatial justice [29].
Thus, one of the article’s goals is to compare inequality between active, public and shared autonomous transportation modes. (Due to their characteristics, these modes are among the most likely options for future urban transportation development.)
While researchers have studied inequality aspects of transportation modes, there is no appropriate inequality comparison between Active, Public and SAV modes of transportation. Perhaps the reason is that shared Autonomous Vehicles (especially in developing countries) have not yet evolved sufficiently to calculate their effects on aspects of inequality. In addition, most Autonomous Vehicles research investigates their effects on traffic parameters and pollution. Therefore, considering the existing boundaries, there is a need for a framework that can compare these transportation modes’ inequality.
Doughnut Economy is a new economic theory that considers environmental constraints and societal needs [30,31]. This theoretical framework is significantly close to our need for an inequality comparison in the above-mentioned modes, because future urban transportation, in addition to the environmental, pollution and energy management constraints, should consider sustainability criteria such as inequality. On the other hand, the Doughnut Economy has been considered in urban planning, which is closely related to urban transportation planning [32,33,34].
Therefore, we use this theory as a practical method to compare these transportation modes’ inequality. It is worth mentioning that the theory of Doughnut economics is used in various studies due to its high applicability [35,36,37].
According to these points, this study aims to address three questions. First, what are inequality/inequity and their consequences (especially in transportation)? Second, what urban transportation modes will be appropriate in the future and why? Third, how can we compare these modes regarding the inequality effect? We will answer these questions through a discussion based on the literature and by employing the doughnut economy concept. Our discussion focuses on transport inequalities and their consequences considered from the perspective of developing countries, as those where these problems are much more relevant yet rarely addressed in the literature, which mainly focuses on developed countries [15].
In the following, first, we briefly demonstrate definitions of inequality and some of their consequences. Then we review features of notable future urban transportation modes. Finally, we use the doughnut economic concept to make a comparison between them from the perspective of inequality.
2. Inequality, Definitions and Consequences
Researchers study inequality in various fields such as the economy [38], education [39], health [40] and globalization [41,42] to name a few. There is no common definition and furthermore the concept is highly contested since it refers to the moral ethics of equity and social justice or the normative idea of “deservingness”, and therefore, as any social construct, is highly context depended [43]. Being aware of this, we do not intend to discuss social justice or ethical background, embracing the concept of inequality (and how to combat it) as part of a sustainable development agenda.
We should start by noting that not all differences are inequalities. There is an agreement that only those which are perceived or regarded as unjust in a given time and society should be referred to as inequality. It is important to understand the differences in definitions, concepts and their operationalization for understanding inequality. For example, income inequality, as its name implies, refers to the unequal distribution of income, while social inequality represents a wider range of inequality that indicates the existence of unequal opportunities and possibilities for different social positions (such as class, race, gender, etc.) in a society [44]. Therefore, notwithstanding the income and social inequality relationship, the effective factors in each domain should be considered [45].
Similarly, income inequality does not necessarily mean poverty, because inequality refers to the inadequate or unjust distribution of resources, whereas poverty indicates the shortage of the resources needed to live. Thus, although inequality can lead to poverty, we can imagine a society with high-income inequality and low poverty rates, or vice versa [46]. Further “income inequality” refers to the differences in the receipt of income for working or use of capital over time, but “wealth inequality” is defined as the unequal control or ownership of economic resources at a given time by individuals [47]. Equity is another concept in this regard. While equality refers to providing the same services to all groups, equity means providing services to different groups based on their needs. Given the broadness of inequality issues, there are different definitions of inequality. Table 1 shows some of these.

Table 1.
Inequality Definitions.
Attention to indices and standards related to inequality has grown in recent decades, but references to social inequality have an older history. Alexis de Tocqueville, a French sociologist known for his writings on democratic governance, advocates equality, “to spread a moderate amount of happiness over all men, instead of heaping a large sum upon a few by allowing only a small minority to approach perfection”. The minorities mentioned by De Tocqueville were people who benefited from inherited privileges in aristocratic societies of the past [53]. Marx is another sociologist who has presented his ideas on inequality in societies and ways to eliminate it. Marx saw inequality as the result of capitalism [54]. Corrado Gini propounded the “Gini index” concept in 1912 [55]. The Gini index, now one of the most well-known indicators of income inequality, is a number on a scale of zero to one. A higher Gini index implies higher inequality. In 1920, Hugh Dalton introduced the “transfer principle” concept. He proposed resources transfer from the rich to the poor as a means of increasing welfare in society [56].
Income inequality increased at a dramatic rate around the world from 1820 until the beginning of World War I. The reason for this can be considered as the industrial revolution and its impact on the income of developed countries. This increase continued at a lower rate after World War I until the 1950s [57]. Subsequently, the rise in skilled workers led to a sharp increase in wage inequality in the United States in the 1970s [58]. Two historical events made inequality more significant in the new century. The first was the global financial crisis in 2008 and the second was the COVID-19 pandemic. These two events affected the global economy over a short period and increased income and wealth inequality. Before the global economic crisis in 2008, statistics showed that income inequality was rising, both in free economies such as the United States and in economies in transition government such as Eastern European countries [59,60,61]. After this crisis, the level of inequality increased in different countries [62].
In the long term, income inequality leads to wealth inequality. In 2019, before the onset of the COVID-19 crisis, the wealth of the world’s 26 richest people was equal to the wealth of 3.8 billion people on Earth [63]. After the Corona pandemic, the level of inequality rose. Now, the wealth of 1% of the richest people is more than double the wealth of 6.9 billion people on Earth. It took five years after the economic crisis of 2008 for the world’s billionaires to recover their level of wealth before the crisis, limited to nine months in the Corona crisis. The number of billionaires in the world is up to 2000. At the same time, the world’s poor population grew to 200–500 million. These need more than ten years to return to pre-pandemic life [64]. There are several reasons for the growing trend of income inequality in the world. Technological development and reduction in the need for workers and globalization are among these reasons [58,65].
The emergence and spread of movements such as “Me Too” in gender equality and “Black Lives Matter” in racial equality shows that other dimensions of social inequality in the modern world may be as deep and as important as income inequality. Racial discrimination, which is one of the causes of inequality, still exists despite the change in its appearance [66]. Spatial and residential segregation patterns and socioeconomic discrimination according to race or income are present in cities around the world [67]. On the other hand, gender-related inequalities statistics show that women spend 2.6 more time doing unpaid work or housework than men [68].
The differences in the dimensions and nature of inequality across countries indicate that economics does not just determine inequality; politics and policies shape it simultaneously. However, inequality in societies is of the essence and one of the sustainable development goals is to eliminate severe inequalities [69]. However, as seen, it can be said that achieving some of these goals has failed.
Without considering this issue, development will lead to the emergence of different social classes with high levels of inequality, which is observable throughout history [70]. On the other hand, inequalities can increase social tensions and investment risks that ultimately delay the development process for years and decades, especially in developing countries [38]. Moreover, as Piketty points out [71], any society in which inequalities exist creates an ideology that justifies it and at the same time makes it difficult to change things for the better. This may explain persistence of inequalities.
The issue of inequality is broad. However, in this study, we will emphasize three types of inequality: economic inequality, gender inequality and racial/ethnic inequality. Figure 1 shows that these inequalities can affect different social groups separately or simultaneously. The red, blue and yellow circles in Figure 1 indicate economic status, gender and ethnicity or race, respectively. Each person in these circles can be anywhere between the most powerful and the weakest sections of society. For example, the red circle represents the range from the richest and most high-income people to the lowest levels of income and wealth. The yellow circle includes a range from ethnic/racial dominant groups, Ethnic minorities (the same race as the dominant group) and Ethnic and racial minorities. It should be noted that ethnic and racial differences are often further accentuated by religious differences. Finally, the blue circle covers a range from men (as the dominant gender) to women [72] and to minorities like the LGBTQ+ community [73]. People at the junctions of these circles suffer the most inequality. On the other hand, rich white men, in most countries, would be considered the most privileged social group.
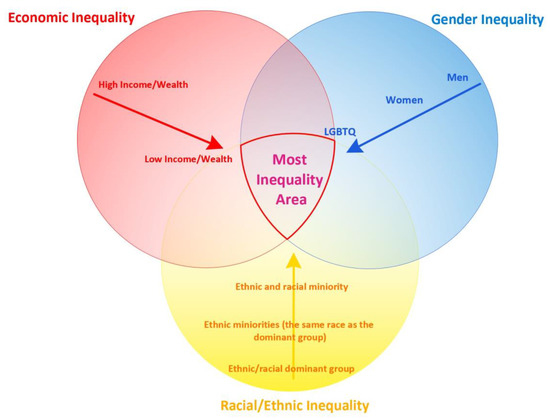
Figure 1.
Overlap between the different types of inequality discussed in the article.
Finally, to conclude these reflections, it is still worth noting that the previously mentioned dimensions of inequality are often compounded by spatial inequalities. Apart from the obvious inequalities between countries or regions, they also occur at the local and intra-city scale. Moreover, they accentuate and reinforce the above-mentioned inequalities, which become an important element of socio-spatial segregation mechanisms, particularly acute in large cities of developing countries [74].
Different types of inequality have unfortunate consequences, which we will briefly address in this section. As observed in the previous sections, researchers define and examine inequality from different perspectives. Similarly, we can see the consequences of inequality in various areas such as health, education and crime rates. As we know, inequality is a cycle. For example, children born into low-income families have fewer health and education opportunities, so these children probably will have an inappropriate income situation as adults [61].
Many studies have examined the impact of different types of inequality on people’s health. One study examines the relationship between inequality and infant life expectancy up to 5 years of age [75]. Another shows that social inequality and poverty affect emotional, behavioral and mental health, especially in children [76]. A group of studies has examined the relationship between diseases such as AIDS and economic or gender inequality [77,78]. Another study has proved a direct link between income inequality and the consequences of heart failure. Inequality can also affect people’s mental health. Numerous studies have confirmed that increasing inequality increases the likelihood of depression [79]. Living in unequal societies also leads to distrust and stress in individuals [80]. Recent studies have examined the relationship between economic and racial inequality and COVID-19 [81]. We briefly mentioned inequality consequences, but these studies are sufficient to know that action against inequality is critical to achieve a sustainable society.
To examine inequality in transportation, one must consider the differences in the definitions of equality and equity. The definition of equality in transportation means providing safe, secure and convenient transportation for all. Horizontal equity (treats everybody equally) and vertical equity (development regarding social groups and disadvantaged needs) are two forms of equity in transportation [82]. So the meaning of equality is closer to that of horizontal equity in transportation.
As with the concept of inequality, transport inequalities are also defined in different ways and cover a range of issues [26]. They refer to unequal transport accessibility [83], which in consequence effects unequal distribution of travel between social groups, as well as variations in travel behavior between different groups [84].
According to these definitions, in this study we seek to investigate further the relationship between transportation modes and the above-mentioned types of inequalities. Figure 2 shows the effects of inequality/inequity in transportation on other aspects of inequality. Transportation Inequality/inequity could lead to income, wealth, health and education inequality. It is a continuous circuit. Each inequality has interactions with other types of inequalities marked with double-headed arrows.
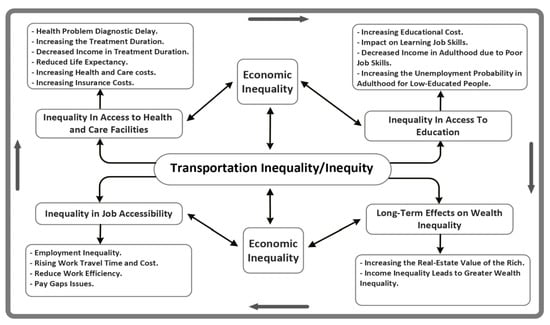
Figure 2.
How Transportation Inequality Reinforces Inequality in Other areas.
3. Recommended Urban Transportation Modes for the Upcoming Future
The future of urban mobility is shaped and fueled by three technology driven trends: electrification of vehicles, autonomous and connected vehicles and Mobility-as-a-Service [85]. Urban mobility in the future may be realized by different modes of transport. The urban transport system will certainly, in most parts of the world, consist of private cars (individual motorization), collective public transport (bus, tram, trolleybus, metro, light rail), various forms of active transport (cycling and walking), as well as innovative forms of transport based on autonomous vehicles. The latter can be used as individual transport, but also form part of public transport systems. We may expect that all modes will be to a greater extent than at present electrified (including e-bikes, e-scooters) and interconnected in one seamless, demand-driven mobility system realized as Mobility-as-a-Service [86]. Individual motorization is a generally undesirable form of urban transport because of its negative impact on the environment, its low energy efficiency, its land-use requirements (parking spaces, roads) and its responsibility for urban traffic problems (congestion). Moreover, using private vehicles affects human health via air and noise pollution, accidents, greenhouse gases, etc. It contradicts the idea of sustainable mobility and sustainable development [87]. Therefore, from the perspective of sustainable transport, it is desirable to develop the other three types of transport and reduce or eliminate private cars. In the following section, we will discuss these three types more deeply as a background for their comparison in relation to inequality.
3.1. Active Transport
Active transportation consists of all human-powered forms of travel but often refers to walking and cycling. Hence, using equipment such as skates can be considered as active transportation [88], but is not very common. Active transportation is recommended for sustainable development for various reasons such as reducing air pollution, energy/resource efficiency optimization, improving public health and increasing citizens’ physical activities [89,90,91].
One of the best incentives to use active transportation is increasing physical activity and its outcomes on public health. More than 30% of adults in the world do not have enough physical activity. This rate is even higher in developed countries [92]. Nowadays, citizens face various health problems because of reducing physical activity on the one hand and increasing pollution in cities (most often due to the use of private cars) on the other. Active transportation not only raises physical activity in travel, but also improves this at other times [93,94]. Investigating the relationship between the use of active transportation and individuals’ physical health characteristics is one of our research interests. It is clear that active transportation improves the physical health of people [95,96,97], especially obvious in comparison with the use of private vehicles [98]. For example, cycling and walking reduce the risk of cardiovascular disease by 11% [99].
The positive effects of active transport on human health are not limited to the physical dimension. Since physical activity can reduce the symptoms of depression and anxiety [100,101], the effect of active transport on people’s mental health is clear, because using active transport brings the physical activity of individuals closer to the required level [102]. Various studies have tried to identify the relationship between active transportation and mental well-being. For example, using active transport for school travel by children is effective in their psychological well-being [103]. Users of active transport are happier compared to other modes of transportation [104]. Another study showed that higher rates of active transport were associated with higher rates of well-being in girls [105]. A study that examines the relationship between mental well-being and transportation modes reinforces the increased satisfaction of active mode users. This greater satisfaction is observed in both leisure and work trips [106,107]. Active transportation compared to private vehicles imposes less stress [108,109] and is more environmentally friendly, reduces urban pollution and helps the health economy [110,111]. These benefits have led to various policies to expand active transport [90,112].
However, remarkable dangers threaten active transport users such as air pollution, the sun’s rays and the possibility of accidents. Even with these risks, using active transport has more benefits than not using it [113]. Increasing the share of active transport is a way of overcoming these problems. The rate of accidents per cyclist is inversely related to the cycling rate in a city or country [114]. Therefore, planning to increase the share of active transport [115], reducing the speed of motorized transportation [116] and safer design of the urban environment [117] are among the factors that can alleviate these risks.
3.2. Public Transport
Public transport commonly refers to bus or rail-based services. Buses, subways, LRT and various combinations of these are examples of public transport. The introduction of the “Transit-oriented development” concept by Calthorpe made public transport a solution for sustainable development [118]. Public transportation is an element in designing sustainable cities because of benefits such as reduced emissions and consumption of land (environment), improved access (social), increased economic efficiency and contributions to economic activity (economy) [119].
Researchers have tried to identify users’ expectations of accessibility and quality of service [120,121]. Previous studies indicated accessibility, quality of service and safety as factors affecting the use of public transport [122,123]. Travel time, travel winding, service availability, service reliability and cost are factors affecting customer public transport service evaluation. Any factor could contain sub-factors that affect the customer experience and should be studied to improve transit services [124,125]. However, it is hard to separate factors influencing customer quality evaluation. Therefore, some researchers have proposed step-by-step methods to detect these factors [125,126].
Using the private car and public transport are inversely related [127]. Modeling and evaluating the influence of various factors on public transport use is another research topic [128]. Analysis, modeling and estimation of passenger demand are other significant parts of the research [129,130]. Increasing physical activity, reducing air pollution, the risk of accidents and stress and improving the sense of well-being are the advantages of public transportation regarding public health [128,131]. Citizens use active transport to access public transport stations. Therefore public transport is associated with physical activity [132,133,134]. The use of public transportation is inversely related to the risk of childhood obesity, overweight and diabetes [135,136]. Using public transport can also decrease body mass index [137,138]. Increasing the sense of well-being by creating a sense of belonging to society and reducing loneliness, especially among the elderly, is another result of using public transport [139,140]. Public transport lessens the share of private vehicles and accidents [141]. Increasing the share of public transport can also help reduce pollution in the urban environment [142]. Implementation of new technologies and concepts such as self-driving cars or zero-emission vehicles in public transport could enhance these positive results and sustainability [143].
3.3. Self-Driving Cars and Shared Autonomous Vehicles
Autonomous vehicles are one of the future’s urban transportation modes. This technology makes transportation more stable, safer and cheaper [144,145,146]. Developments in areas such as radar and sensors [147,148,149], artificial intelligence [150], deep learning [151] and IoT [152] in recent years have led to the possibility of autonomous vehicle technology in public use. The mass production of a cheap fully autonomous vehicle could be a revolution like the manufacture of the Ford Model T in the car industry. The first made cars available for the public and the second will perform this function for self-driving cars. This can promise a world with fewer vehicles [146,153,154,155], in which cars travel less distance and cause less pollution [155,156].
A systematic review showed that safety, financial and service attributes are the most influential factors in AV acceptance [157]. Some studies emphasize the ability of autonomous vehicles to increase safety [158]; though others believe that this technology limits the number of accidents, it will not reduce their severity [159]. Since this technology has not yet reached adequate development, driver awareness and intervention when needed are recommended [160,161]. Another study identified that interest in new technology, generalized anxiety, the intensity of a person’s disability and prior knowledge of AVs are some of the factors that affect attitudes towards AVs among people with disabilities [162]. Researchers mention autonomous vehicle’s potential for groups such as the elderly [163] and the disabled [164].
Shared modes have advantages such as cost and car use reduction [165]. There is a direct relationship between car-sharing services and reducing car ownership [166,167,168,169,170]. Autonomous vehicle technology facilitates utilizing shared modes, so the employment of shared autonomous vehicles can enhance these benefits [171].
Car-sharing (sharing the vehicle) [172,173], ride-sharing (sharing the route) [174] and hybrid systems are among the topics in shared autonomous vehicle studies [23]. Researchers apply agent-based modeling to simulate the effects of using autonomous vehicles on the urban environment [175,176]. Agent-based modeling shows that replacing all cars, buses and taxis with a shared fleet in Lisbon significantly decreased pollution and distance travelled distance. Besides, only 4.2% of available vehicles are sufficient to meet demand [177]. Using shared autonomous vehicles reduces the parking demand in urban environments by 90% [178]. From a sustainability point of view, attractions such as reducing pollution, energy management, reducing the need for infrastructure such as parking, increasing the efficiency of the urban transportation network and the ability to be used in integrated transportation systems have made this issue more and more critical.
4. Comparing Inequality in Transport by Doughnut Economy Concept
We have introduced the concepts of inequality and reviewed future urban transportation modes. Still, some questions remain. How can we compare inequality in possible future transportation modes? What is the best solution that could consider aspects of this comparison? Is there any concept that helps us to make a decision? We recommend the Doughnut economics concept to solve this problem.
The concept of Doughnut economics as one of the new ideas in sustainable development was introduced in 2017 by Kate Raworth [30]. Raworth points out that conventional economic models do not respond to the needs and requirements of human life in the 21st century. She then tries to explain her economic theory according to the resources available on our planet and the needs and requirements of life for all human beings. She considers the prosperity of human beings to precede the level of economic prosperity where they live. Therefore, we need to change the way we look at economics and how it works. Figure 3 present the doughnut economy idea.
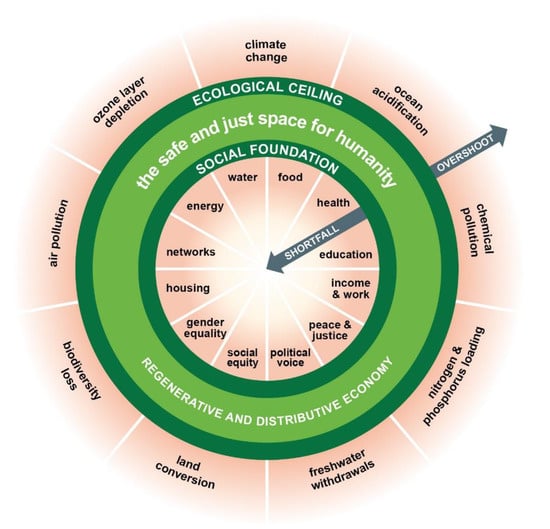
Figure 3.
The Doughnut Economics Concept Model [30].
Applying the idea of doughnut economy to future urban transportation development planning may face difficulties. For example, part of urban transportation planning is related to long-term plans that cannot be changed or modified in a short period. In addition, the connection of urban transportation with other urban planning topics, such as land use planning, energy management and air pollution control, is undeniable. Therefore, merging urban transportation planning with the doughnut economics concept needs coordination with other urban planning topics.
On the other hand, the fundamental feature of the doughnut economic framework (which can reduce these costs) is its multidimensionality. As seen in Figure 3, this concept simultaneously considers human needs and environmental limitations. Therefore, it will not be difficult to make changes in urban transportation planning because the Doughnut economy can simultaneously include urban management, land use, energy and other urban planning topics.
Finally, applying the doughnut economy concept in urban transportation may increase the costs of urban transportation planning due to the novelty of this method and the requirement to redesign programs. Supplying sustainable transportation infrastructure needs for urban transportation systems, such as developing new pathways for active transportation, can also increase the budget needed for urban transportation. Nevertheless, this method could lower the costs of pollution, emission, energy management and urban transportation maintenance costs. This decrease is much more significant than the cost of applying doughnut economics in transportation.
Therefore, it is understandable why, despite this concept’s novelty, its use in urban management has been investigated in various studies. Several case studies have studied the relationship between urban management and Doughnut Economics. The Doughnut Economics Action Lab (DEAL) platform was launched in 2020 to support the translating of the Doughnut Economics concept into place-based action. DEAL produced the Creating City Portraits report with three flagship cities, Amsterdam, Portland and Philadelphia. Amsterdam was the most relevant case for implementing a Doughnut economics plan [179,180,181,182]. The objective of BrusselsDonut (which applies the Doughnut theory to the Brussels-Capital Region) is defined as “to have a framework for reflection adapted to the actual situation in Brussels to together, hatch, guide and reach coherent decisions conducive to the ecological and inclusive transition towards a sustainable society.” [183]. Cornwall Council is the first English local authority to adopt Doughnut Economics as a tool to promote sustainable development. The framework now underpins The Cornwall Plan, committing key stakeholders to improve sustainability outcomes by 2050 [184]. Another study explores how doughnut thinking can be applied to local urban development and define the Doughnut Urbanism assessment framework to evaluate Suikerzijde Noord’s urban development plan in Groningen, the Netherlands [33]. Regen Melbourne and Regenerate Barbados are other projects that attempt to make more sustainable cities through the Doughnut concept worldwide [182].
We can use the Doughnut economic concept with changes in our comparison. A study has employed the ‘doughnut economy’ and ‘sustainable consumption corridor’ concepts to define a ‘safe and just space for urban mobility’. This corridor is bounded from above and below by Ecological Ceiling (EC) and Social Floor (SF), respectively. The first is “Maximum consumption standards acceptable before the environmental impact of this consumption threatens the ability for others to live safe and good lives”. The second is the “Minimum consumption level that individuals now and in the future requirements to satisfy their needs adequately”. Some authors point out the weakness of sustainable urban mobility indicator studies in examining sustainability of mobility systems. They have derived a mobility sustainable consumption corridor that cites different sectors using various concepts and associated indicators [185].
To create a Doughnut model for comparing inequality in urban transport modes, we refer to Figure 4. We show the issues and constraints. Urban transport planning should note equalities in the interior ring. Economic equality come from wealth and income equality. Gender and racial/ethnic equality are subsets of social equality.
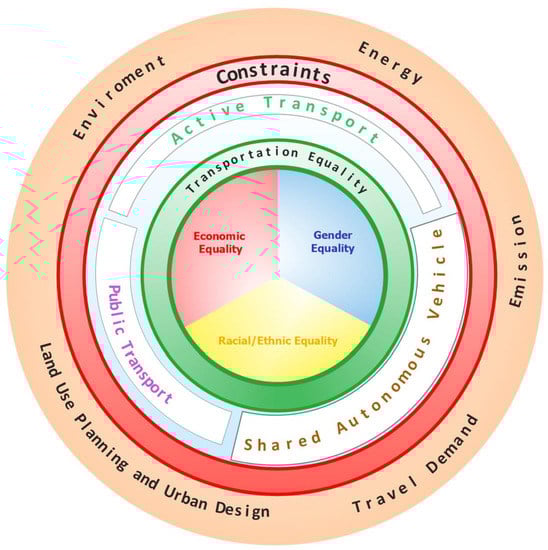
Figure 4.
Urban Transport Equality Comparison Doughnut.
Our constraints in achieving optimal conditions include environment and emissions, energy efficiency, land use planning, urban design, travel demand, etc. An appropriate transport mode for the future must consider these exterior limitations. The constraints from environmental issues in our doughnut can have subsets, such as air pollution in the urban area. Urban transport emissions lead to air pollution. Energy efficiency implies all the requirements for distributing and using energy in urban transport future modes. Urban transport should also have the ability to respond to travel demand. In the end, land use planning and urban design affect urban transport planning. These constraints could affect planning in the short, medium and long term. For example, land use planning could change our plans for providing accessibility to public transport, and vice versa. Of course, all the mentioned constraints have complex relations. Thus, one change in each of them starts a continuum change in others. To compare future transport modes, we need to notice both rings. Being in the doughnut not only means all people (regardless of wealth, income, gender and race) have equal access to transportation services, but also that the transportation modes do not rebuild economic, gender and racial inequalities. At the same time, we must pay attention to our constraints.
We focus on comparing the mentioned modes of transportation in terms of inequality, so the interior boundary is vital. As we saw, inequality and inequity in transportation are not limited to this field. The accumulation of resources by a particular group causes inequality in society. That creates a continuous sequence of inequality in other aspects of social life, such as transportation, education, health, etc. Owning and using private cars has the most potent relation with inequality and inequity in transportation. Car ownership is one of the indicators associated with inequality and inequity [186,187]. Wealth and income have a direct relationship with the level of private car ownership that affects transportation mode choice [188]. Research showed that the average time spent using private cars for travel is directly related to the wealth index of individuals, while this relation is inverse for public transport and walking [189]. Less car ownership is related to more use of active transportation. Car use compared to walking increases with rising income levels [190]. So it is clear that private vehicles are not a desirable option, especially if the sustainable development goals are at the stake.
Active transport is one of the solutions proposed to reduce inequality and inequity in transportation. Since it requires fewer facilities, using active transport is more affordable than other transportation modes. Walking is the only mode available to all social groups, regardless of gender, race, age and income. However, neighborhood development affects safe and appropriate walking for routine trips. If neighborhoods are well designed, walking helps reduce inequality [191]. Cycling is another type of active transport that requires more facilities than walking. In gender inequality, studies show that men cycle more than women [192,193,194,195]. They mention the fear of sexual harassment and stress experienced in public environments [192,196] and women’s sensitivity to increasing cycling distance [197] as reasons. Research shows that ethnic and colored minorities do less cycling [192,196,198,199]. Youths do more cycling than older people. Culture impacts women and the elderly in cycling [200]. The use of electric bicycles has offered to increase cycling among older adults [201]. Finally, although purchasing a bicycle for non-professionals is considerably cheaper than a personal car [202], there is a direct relationship between the rate of cycling and income [200].
Non-dominant social groups are mainly users of public transportation. Therefore, inequality studies focus more on accessibility in this mode for all people. A study shows that low-income neighborhoods and neighborhoods with disproportionately high populations of African Americans are associated with poor accessibility [203]. Public transport is their regular mode of job access. The results of a study in Chicago indicate that there are job-access inequities across both space and race. It notices more job-access inequities for blacks than for Hispanics [204].
In developing countries with low car-dependency rates, public transit is essential in providing access for disadvantaged groups to jobs, education and health care [205]. There are undeniable witnesses to inequality/inequity in public transport in developing countries, remarkably in big cities. A study in Brazil indicates public transport services inequity for lower-income households in the four most significant metropolitan areas [206]. The findings in China, the biggest developing country in the world, show noticeable and unequal differences in the level of transit service. Eighty percent of the population benefit from only 36.7% of the public transit supply in Guangzhou [207].
As with active transport in public places, harassment and insecurity are the factors that impact women’s travel behavior and increase gender inequality in public transport [208]. Scholars in Nepal show that women (more usual for the young) experience sexual harassment and sexual assault on public transport [209]. There is a similar situation in Bangladesh [210]. One study even claimed that public transportation is where women must face the most extraordinary levels of violence in all public spaces [211]. Another study shows that Trans women, the trans-feminine and the visibly gender-nonconforming have a higher incidence of violence overall. Trans riders of color and disabled individuals are helpless against harassment from others [212].
The study of inequality in shared autonomous vehicles is much more complex than in the previous modes. The most compelling reason is the lack of field data because this mode is not common and affordable currently. For example, most research assessing AVs’ health equity impact is speculative and not based on data-driven analysis [213]. To study inequality in SAVs, we first examine car-sharing services and autonomous vehicles.
A review of several studies in Germany noticed that users of car-sharing services were more commonly male, younger, higher-income and belonged to smaller households [214]. Another study in Austria found highly educated men commonly used more car-sharing services [215]. Constructing a model showed that the principal users of these services in the United States are young and with higher income and education [216]. The study showed a high percentage of white users of these systems [217]. Different studies have found that men use these services more than women [218,219].
AV technology has not yet evolved and accurate statistics on its users are not available. Based on a Travel Demand Model, high-occupancy AV and enhanced transit scenarios supply equity benefits [220]. The analysis shows that some autonomous vehicles’ benefits may begin to be seen in the 2020s or 2030s. Nevertheless, impacts such as reduced traffic and parking spaces [221], increased accessibilities for low-income people [222], increased safety, energy conservation and pollution reduction will be significant from the 2040s to 2050s [223]. One study shows that a considerable fraction of its online panel of 834 US-based participants is not yet ready to use a AV and is disinclined to share a ride in an AV taxi [224].
A study indicates SAVs’ ability to improve equity in accessibility and socio-economic well-being. However, it does not consider people’s willingness to share AVs with others [222]. People’s willingness to share their AV as SAV plays a vital role in its ability to achieve sustainability goals such as equality. It was shown that people are more inclined to share AVs versus traditional cars but also preferred to own an AV instead of sharing it [225]. Low-income groups are more inclined to buy AVs, but they are reluctant to share them with others. Women are also less inclined to use this technology. Youth and men are the majority who embrace this technology [224]. Even among people who are receptive to new technologies, the inclination to own these types of vehicles will be greater than using them in the form of shared services [224]. Between autonomous vehicles, autonomous taxis, shared autonomous taxis and autonomous buses, there is the least inclination to use SATs [226]. The results of a study in China, based on the data collected using a stated choice experiment, show that people prefer to keep their current car or buy an AV rather than use shared cars. Their concerns about SAVs included operational costs, hourly rates, vehicle availability and access time [225]. As seen, the willingness to use such services depends on many factors [227,228,229]. Concerns about income, race and gender inequalities in existing shared transportation services make it impossible to look optimistically at these issues in the future [230].
There is evidence that 61% of Swiss respondents favored pooled autonomous vehicles over private ones, but this study assumes AVs’ dominance globally [231]. However, this is an unrealistic and impossible assumption for upcoming years, especially in some developing countries that neither have the money nor the technology currently to achieve this threshold. On the other hand, considering electric cars, the initial cost of using such services is high for people in developing countries. Indeed, such prices make sharing services an option for decreasing the costs of SAV services [230]. The minimum price of Tesla cars, the leader in electric AVs mass production, is almost 50,000 dollars (which could increase due to inflation). Of course, some solutions include adding automotive technology to existing cars, but even this cost is enormous for the people of many developing countries. Developing countries’ high share of non-electric vehicles also puts other sustainability goals at risk. Increased VKT in shared car systems [173,232] could increase air pollution and fossil energy use. This indirectly reduces the likelihood that low-income groups will use the technology of shared vehicles, even with different subsidies. At this price, even if there is a fleet of SAVs, it will not be desirable for many groups in society to pay the subscription fee for such a service in the prototypes. In addition, since existing racial inequalities have led to income inequality, we will see less use of this technology among racial minorities. As with women’s less common acceptance of AV’s [227], the development of related technologies is men-dominated [233]. Hence women will also be indirectly affected by this inequality.
Another point in comparing the above-mentioned transportation modes according to the doughnut is that it is undeniably affected by the development level of countries. Developing countries in Asia and Africa will have a considerable share of urban population growth over the next thirty years. The planning of these countries for the achievement of high economic growth makes it more likely that they will ignore environmental requirements. So, while it is excellent for cities like Amsterdam to achieve sustainable development through concepts such as the doughnut economy, the metropolises of developing countries need to use these concepts. The rapid growth of the urban population in these countries can have consequences such as increasing inequality in various fields. Advanced technologies will first be made available to wealthy sections of society, which will deepen transport inequality. Furthermore, income inequality will impact land-use planning and urban design. Gender inequalities are common in developing countries. For example, the share of women in urban travel is much lower than men in Pakistan [234].
Thus, despite all the potential benefits, Shared Autonomous vehicles are not a viable alternative to equality and equity in transportation for developing countries, at least until this technology becomes affordable and omnipresent and widely used by citizens. Even then, one study considering three types of Avs’ cost indicates that a substantial share of AVs may remain in private possession (because of low variable costs). People will be more inclined to accept the high fixed costs of private vehicles due to the various benefits of their AV. This is entirely inverse to assumed imagined projections of AV users [146]. It does not overlook the notable advantages of using such services, but considers the importance of promoting active and public transport in the future. Undoubtedly, SAVs be a significant part of transportation, but until they become an applicable technology for the general and gain public trust, they cannot be the best nominee for increasing equality in transportation Figure 5 briefly shows the pros (in blue) and cons (in red) of future transportation modes in terms of inequality.
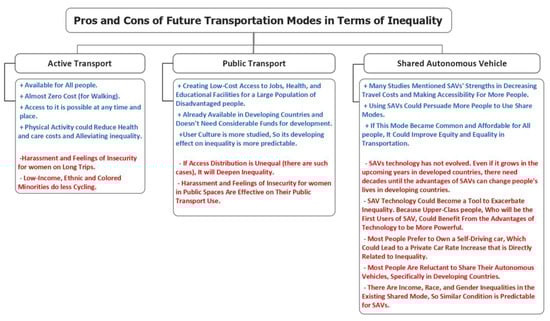
Figure 5.
Future Transportation modes—comparison in terms of inequality.
It can be concluded that improving active transport conditions provides the best case for being inside the doughnut. Anyone can use active transport. Nevertheless, as observed in various studies, designing appropriate means of accessibility, securing user space and improving security can help create greater equality in this area. On the other hand, it contains the most positive environmental features because of the least amount of pollution. Therefore, using this mode implies a proper distance from the outer borders of the doughnut (Figure 4). Public transportation creates more pollution than active transportation, but with the advancement of technology and increasing usage of this mode, this will improve. It also requires a suitable culture and proper urban design. SAVs, if properly introduced, will satisfy some of the future demands for urban transportation, but factors such as people’s reluctance to share cars, the high price of this technology and its lack of ubiquity among low-income groups, income-gender discrimination among car factories and reduced physical activity if people use SAVs, raise serious doubts about its use as the dominant mode of transportation in future cities. This is especially true in developing countries.
5. Discussion and Recommendations
We have introduced some inequality concepts. We then reviewed the transportation modes that will make up urban transport in the future. One essential research goal was to compare the inequality aspects in these future transportation modes. Despite examining this inequality, previous studies do not make an inequality comparison. Awareness of the differences between the inequality aspects of these transportation modes allows us to better plan in order to lessen the inequality of urban transportation. This will reduce urban inequality and, as a result, increase the sustainability of urban communities in the future. The similarity of the concepts emphasized in Doughnut Economics to our comparison was an adequate reason for its use. Based on the doughnut concept, our comparison showed that active transport is the most equal mode. Public transportation can be a reliable option if there are plans to improve the design of urban public spaces in terms of comfort and safety for citizens and an appropriate mix with active transportation. Autonomous public transport can be applicable. Nevertheless, according to the literature, despite the efforts made in policy-making and planning, inequality in different modes of transportation (even the most equal) is undeniable and SAVs can deepen this inequality especially for developing countries. Maybe this is the most reasonable quotation in conclusion: “Autonomous cars can lead to sustainability and cities can reach that destination if behind the wheel is not simply an artificial intelligence, but a strong democratic political system [235]”. It follows that AVs and SAVs can only be sustainable and promote equality if they are promoted in democratic reigns that care about social justice and the well-being of all people (regardless of wealth, gender, or race). Until then, it is more profitable for developing countries to focus on more equitable and sustainable modes such as active and public transport. It does not mean they have to give up this technology because, in that case, they will not benefit from its numerous advantages. Instead, it means trying to find appropriate scheduling for utilizing this technology in a way that does not increase societal inequality.
Sometimes, paying attention to the maximization of economic efficiency in the short term causes mistaken predictions of the adverse effects of development on the environment (especially in developing societies). The doughnut economics concept makes it possible to examine issues simultaneously from the perspective of social and environmental constraints and economic imperatives such as profitability and cost efficiency. Therefore, it could be a good option when planning for more sustainable cities. We use this concept for Future Transportation modes comparison in terms of inequality. Based on our study, we recommend the following suggestions for future research and planning:
- Increasing inequality is a human concern in the 21st century. The growth of autonomous vehicle technology will have far-reaching consequences on urban transportation. However, its impact on urban inequality has not been studied as much as technological topics. The reason is the absence of collaboration of social science and technology researchers. Therefore, an important suggestion is to increase the association between sociologists and transportation engineers to examine these effects in future studies. This is more important in developing countries.
- We focus on comparing future urban transportation modes’ inequality in this study. Predicting and solving the inequality problem must be examined more comprehensively in other studies using empirical data by constructing and testing different scenarios and their impact.
- As we noted earlier, one of the important technology trend in transportation is MaaS (Mobility as a Service), which would combine different transportation modes in one mobility system. There is a need to asses its impact on transport justice and inequalities in order to provide adequate policy recommendations as seen not only from a technological or efficiency perspective. This section may be divided by subheadings. It should provide a concise and precise description of the experimental results, their interpretation and the experimental conclusions that can be drawn.
Author Contributions
Writing—original draft, A.A.M., H.M. and R.G.; Writing—review & editing, A.A.M., H.M. and R.G. All authors have read and agreed to the published version of the manuscript.
Funding
The authors received no financial support for the research, authorship and/or publication of this article.
Institutional Review Board Statement
Not applicable.
Informed Consent Statement
Not applicable.
Data Availability Statement
The datasets generated during and/or analyzed during the current study are available from the corresponding author on reasonable request.
Conflicts of Interest
The authors declare no conflict of interest.
References
- Paul, B.D. A history of the concept of sustainable development: Literature review. Ann. Univ. Oradea Econ. Sci. Ser. 2008, 17, 576–580. [Google Scholar]
- Mensah, J. Sustainable development: Meaning, history, principles, pillars, and implications for human action: Literature review. Cogent Soc. Sci. 2019, 5, 1653531. [Google Scholar] [CrossRef]
- Nations, U. World Urbanization Prospects 2018; Department of Economic and Social Affairs: New York, NY, USA, 2019. [Google Scholar]
- Lagakos, D. Urban-rural gaps in the developing world: Does internal migration offer opportunities? J. Econ. Perspect. 2020, 34, 174–192. [Google Scholar] [CrossRef]
- Rees, P.; Bell, M.; Kupiszewski, M.; Kupiszewska, D.; Ueffing, P.; Bernard, A.; Charles-Edwards, E.; Stillwell, J. The impact of internal migration on population redistribution: An international comparison. Popul. Space Place 2017, 23, e2036. [Google Scholar] [CrossRef]
- Farrell, K. The rapid urban growth triad: A new conceptual framework for examining the urban transition in developing countries. Sustainability 2017, 9, 1407. [Google Scholar] [CrossRef]
- Kuffer, M.; Orina, F.; Sliuzas, R.; Taubenböck, H. Spatial patterns of slums: Comparing African and Asian cities. In Proceedings of the 2017 Joint Urban Remote Sensing Event (JURSE), Dubai, United Arab Emirates, 6–8 March 2017; pp. 1–4. [Google Scholar]
- Wamukoya, M.; Kadengye, D.T.; Iddi, S.; Chikozho, C. The Nairobi Urban Health and Demographic Surveillance of slum dwellers, 2002–2019: Value, processes, and challenges. Glob. Epidemiol. 2020, 2, 100024. [Google Scholar] [CrossRef]
- Behrens, K.; Robert-Nicoud, F. Survival of the fittest in cities: Urbanisation and inequality. Econ. J. 2014, 124, 1371–1400. [Google Scholar] [CrossRef]
- Young, A. Inequality, the urban-rural gap, and migration. Q. J. Econ. 2013, 128, 1727–1785. [Google Scholar] [CrossRef]
- Glaeser, E.L.; Resseger, M.; Tobio, K. Inequality in cities. J. Reg. Sci. 2009, 49, 617–646. [Google Scholar] [CrossRef]
- Satterthwaite, D. The Under-Estimation of Urban Poverty in Low and Middle-Income Nations; Iied: Heworth, UK, 2004; Volume 14. [Google Scholar]
- Martine, G. The New Global Frontier: Urbanization, Poverty and Environment in the 21st Century; Earthscan: London, UK, 2012. [Google Scholar]
- Bocarejo, S.J.P.; Oviedo, H.D.R. Transport accessibility and social inequities: A tool for identification of mobility needs and evaluation of transport investments. J. Transp. Geogr. 2012, 24, 142–154. [Google Scholar] [CrossRef]
- Lucas, K.; Mattioli, G.; Verlinghieri, E.; Guzman, A. Transport poverty and its adverse social consequences. In Proceedings of the Institution of Civil Engineers-Transport; Thomas Telford Ltd.: London, UK, 2016; pp. 353–365. [Google Scholar]
- Lucas, K. A new evolution for transport-related social exclusion research? J. Transp. Geogr. 2019, 81, 102529. [Google Scholar] [CrossRef]
- Preston, J.; Rajé, F. Accessibility, mobility and transport-related social exclusion. J. Transp. Geogr. 2007, 15, 151–160. [Google Scholar] [CrossRef]
- Pérez, N.; Pey, J.; Cusack, M.; Reche, C.; Querol, X.; Alastuey, A.; Viana, M. Variability of particle number, black carbon, and PM10, PM2. 5, and PM1 levels and speciation: Influence of road traffic emissions on urban air quality. Aerosol Sci. Technol. 2010, 44, 487–499. [Google Scholar] [CrossRef]
- Nieuwenhuijsen, M.J.; Khreis, H. Car free cities: Pathway to healthy urban living. Environ. Int. 2016, 94, 251–262. [Google Scholar] [CrossRef]
- Parmar, J.; Das, P.; Dave, S.M. Study on demand and characteristics of parking system in urban areas: A review. J. Traffic Transp. Eng. 2020, 7, 111–124. [Google Scholar] [CrossRef]
- Van Lierop, D.; Badami, M.G.; El-Geneidy, A.M. What influences satisfaction and loyalty in public transport? A review of the literature. Transp. Rev. 2018, 38, 52–72. [Google Scholar] [CrossRef]
- Rabl, A.; De Nazelle, A. Benefits of shift from car to active transport. Transp. Policy 2012, 19, 121–131. [Google Scholar] [CrossRef]
- Narayanan, S.; Chaniotakis, E.; Antoniou, C. Shared autonomous vehicle services: A comprehensive review. Transp. Res. Part C Emerg. Technol. 2020, 111, 255–293. [Google Scholar] [CrossRef]
- Schwalbe, M.; Holden, D.; Schrock, D.; Godwin, S.; Thompson, S.; Wolkomir, M. Generic processes in the reproduction of inequality: An interactionist analysis. Soc. Forces 2000, 79, 419–452. [Google Scholar] [CrossRef]
- UN General Assembly. Transforming Our World: The 2030 Agenda for Sustainable Development (A/RES/70/1); UN General Assembly: New York, NY, USA, 2015.
- Banister, D. Inequality in Transport; Alexandrine Press: Marcham, UK, 2018. [Google Scholar]
- Cass, N.; Shove, E.; Urry, J. Social exclusion, mobility and access. Sociol. Rev. 2005, 53, 539–555. [Google Scholar] [CrossRef]
- Martens, K. Transport Justice: Designing Fair Transportation Systems; Routledge: London, UK, 2016. [Google Scholar]
- Soja, E.W. Seeking Spatial Justicei; University of Minnesota Press: Minneapolis, MN, USA, 2013; p. 280. [Google Scholar]
- Raworth, K. Doughnut Economics: Seven Ways to Think like a 21st-Century Economist; Chelsea Green Publishing: White River Junction, VT, USA, 2017. [Google Scholar]
- Wahlund, M.; Hansen, T. Exploring alternative economic pathways: A comparison of foundational economy and Doughnut economics. Sustain. Sci. Pract. Policy 2022, 18, 171–186. [Google Scholar] [CrossRef]
- Dahl, V.; Moreno-Navarro, J.J. Doughnut Computing in City Planning for Achieving Human and Planetary Rights. In Proceedings of the International Work-Conference on the Interplay Between Natural and Artificial Computation, Tenerife, Spain, 31 May–3 June 2022; pp. 562–572. [Google Scholar]
- Hassan, T. Doughnut Urbanism—An Assessment Framework for Urban Development through a Doughnut Economy Perspective Using the ‘Suikerzijde Noord’ as Case. Master’s Thesis, University of Groningen, Groningen, The Netherlands, 2022. [Google Scholar]
- Chapman, E.; Rogers, L.; Kay, A. Toward just and sustainable cities: Identifying key areas for urban, peri-urban and rural sustainability collaborative initiatives. Int. J. Environ. Impacts 2021, 4, 36–48. [Google Scholar] [CrossRef]
- Derkenbaeva, E.; Vega, S.H.; Hofstede, G.J.; Van Leeuwen, E. Positive energy districts: Mainstreaming energy transition in urban areas. Renew. Sustain. Energy Rev. 2022, 153, 111782. [Google Scholar] [CrossRef]
- Silverthorne, K. Why would the healthcare industry need a doughnut? Med. Writ. 2021, 30, 76–82. [Google Scholar]
- Hartman, S.; Heslinga, J.H. The Doughnut Destination: Applying Kate Raworth’s Doughnut Economy perspective to rethink tourism destination management. J. Tour. Futur. 2022. ahead-of-print. [Google Scholar] [CrossRef]
- Thorbecke, E.; Charumilind, C. Economic inequality and its socioeconomic impact. World Dev. 2002, 30, 1477–1495. [Google Scholar] [CrossRef]
- Tchamyou, V.S. Education, lifelong learning, inequality and financial access: Evidence from African countries. Contemp. Soc. Sci. 2020, 15, 7–25. [Google Scholar] [CrossRef]
- Ryff, C.D. Eudaimonic well-being, inequality, and health: Recent findings and future directions. Int. Rev. Econ. 2017, 64, 159–178. [Google Scholar] [CrossRef]
- Hurrell, A.; Woods, N. Globalisation and inequality. Millennium 1995, 24, 447–470. [Google Scholar] [CrossRef]
- Williamson, J.G. Globalization and inequality, past and present. World Bank Res. Obs. 1997, 12, 117–135. [Google Scholar] [CrossRef]
- Koh, S.Y. Inequality. Int. Encycl. Hum. Geogr. 2020, 7, 269–277. [Google Scholar] [CrossRef]
- Sen, A. Inequality Reexamined; Harvard University Press: Cambridge, CA, USA, 1995. [Google Scholar]
- Kenworthy, L. Inequality and sociology. Am. Behav. Sci. 2007, 50, 584–602. [Google Scholar] [CrossRef]
- Adam Cobb, J. How firms shape income inequality: Stakeholder power, executive decision making, and the structuring of employment relationships. Acad. Manag. Rev. 2016, 41, 324–348. [Google Scholar] [CrossRef]
- Beal, B.D.; Astakhova, M. Management and income inequality: A review and conceptual framework. J. Bus. Ethics 2017, 142, 1–23. [Google Scholar] [CrossRef]
- Onaran, Y. Workers as owners: An empirical comparison of intra-firm inequalities at employee-owned and conventional companies. Hum. Relat. 1992, 45, 1213–1235. [Google Scholar] [CrossRef]
- Bapuji, H. Individuals, interactions and institutions: How economic inequality affects organizations. Hum. Relat. 2015, 68, 1059–1083. [Google Scholar] [CrossRef]
- Bapuji, H.; Mishra, S. Inequality and organizations. In The Routledge Companion to Philosophy in Organization Studies; Routledge: London, UK, 2015; pp. 471–480. [Google Scholar]
- Mair, J.; Wolf, M.; Seelos, C. Scaffolding: A process of transforming patterns of inequality in small-scale societies. Acad. Manag. J. 2016, 59, 2021–2044. [Google Scholar] [CrossRef]
- Haack, P.; Sieweke, J. The legitimacy of inequality: Integrating the perspectives of system justification and social judgment. J. Manag. Stud. 2018, 55, 486–516. [Google Scholar] [CrossRef]
- Bendix, R. Inequality and social structure: A comparison of Marx and Weber. Am. Sociol. Rev. 1974, 39, 149–161. [Google Scholar] [CrossRef]
- Peet, R. Inequality and poverty: A Marxist-geographic theory. Ann. Assoc. Am. Geogr. 1975, 65, 564–571. [Google Scholar] [CrossRef]
- Gini, C. Variabilità e Mutabilità; Reprinted in Memorie di Metodologica Statistica; Pizetti, E., Ed.; Libreria Eredi Virgilio Veschi: Rome, Italy, 1912. [Google Scholar]
- Dalton, H. The measurement of the inequality of incomes. Econ. J. 1920, 30, 348–361. [Google Scholar] [CrossRef]
- Bourguignon, F.; Morrisson, C. Inequality among world citizens: 1820–1992. Am. Econ. Rev. 2002, 92, 727–744. [Google Scholar] [CrossRef]
- Acemoglu, D. Technical change, inequality, and the labor market. J. Econ. Lit. 2002, 40, 7–72. [Google Scholar] [CrossRef]
- Autor, D.H.; Katz, L.F.; Kearney, M.S. Trends in US wage inequality: Revising the revisionists. Rev. Econ. Stat. 2008, 90, 300–323. [Google Scholar] [CrossRef]
- Mitra, P.; Yemtsov, R. Increasing Inequality in Transition Economies: Is There More to Come? World Bank: Washington, DC, USA, 2006. [Google Scholar]
- Neckerman, K.M.; Torche, F. Inequality: Causes and consequences. Annu. Rev. Sociol. 2007, 33, 335–357. [Google Scholar] [CrossRef]
- Atkinson, A.B.; Morelli, S.; Economic Crises and Inequality. UNDP-HDRO Occasional Papers 2011. Available online: https://ssrn.com/abstract=2351471 (accessed on 2 February 2022).
- Lawson, M.; Chan, M.-K.; Rhodes, F.; Butt, A.P.; Marriott, A.; Ehmke, E.; Jacobs, D.; Seghers, J.; Atienza, J.; Gowland, R. Public Good or Private Wealth? OxfamGB, Oxford, UK, 2019. Available online: https://oxfamilibrary.openrepository.com/bitstream/handle/10546/620599/bp-public-good-or-private-wealth-210119-en.pdf (accessed on 12 November 2021).
- Berkhout, E.; Galasso, N.; Lawson, M.; Rivero Morales, P.A.; Taneja, A.; Vázquez Pimentel, D.A. The Inequality Virus: Bringing Together a World Torn Apart by Coronavirus Through a Fair, Just and Sustainable Economy. OxfamGB, Oxford, UK, 2021. Available online: https://oxfamilibrary.openrepository.com/bitstream/handle/10546/621149/bp-the-inequality-virus-summ-250121-en.pdf (accessed on 12 November 2021).
- Dreher, A.; Gaston, N. Has globalization increased inequality? Rev. Int. Econ. 2008, 16, 516–536. [Google Scholar] [CrossRef]
- Massey, D.S.; Rothwell, J.; Domina, T. The changing bases of segregation in the United States. Ann. Am. Acad. Political Soc. Sci. 2009, 626, 74–90. [Google Scholar] [CrossRef]
- van Ham, M.; Tammaru, T.; Ubarevičienė, R.; Janssen, H. Urban Socio-Economic Segregation and Income Inequality: A Global Perspective; Springer Nature: Berlin/Heidelberg, Germany, 2021. [Google Scholar]
- Heymann, J.; Levy, J.K.; Bose, B.; Ríos-Salas, V.; Mekonen, Y.; Swaminathan, H.; Omidakhsh, N.; Gadoth, A.; Huh, K.; Greene, M.E. Improving health with programmatic, legal, and policy approaches to reduce gender inequality and change restrictive gender norms. Lancet 2019, 393, 2522–2534. [Google Scholar] [CrossRef]
- Doyle, M.W.; Stiglitz, J.E. Eliminating extreme inequality: A sustainable development goal, 2015–2030. Ethics Int. Aff. 2014, 28, 5–13. [Google Scholar] [CrossRef]
- De Haan, J.; Sturm, J.-E. Finance and income inequality: A review and new evidence. Eur. J. Political Econ. 2017, 50, 171–195. [Google Scholar] [CrossRef]
- Piketty, T. Capital and Ideology; Harvard University Press: Cambridge, MA, USA; London, UK, 2021; p. 1104. [Google Scholar]
- Fisher, B.; Naidoo, R. The geography of gender inequality. PLoS ONE 2016, 11, e0145778. [Google Scholar] [CrossRef] [PubMed]
- Cech, E.A.; Waidzunas, T. Systemic inequalities for LGBTQ professionals in STEM. Sci. Adv. 2021, 7, eabe0933. [Google Scholar] [CrossRef] [PubMed]
- Van Ham, M.; Marcińczak, S.; Tammaru, T.; Musterd, S. A multi-factor approach to understanding socio-economic segregation in European capital cities. In Socio-Economic Segregation in European Capital Cities: East Meets West; Taylor & Francis: Abingdon, UK, 2015. [Google Scholar]
- Rodgers, G.B. Income and inequality as determinants of mortality: An international cross-section analysis. Popul. Stud. 1979, 33, 343–351. [Google Scholar] [CrossRef]
- Murali, V.; Oyebode, F. Poverty, social inequality and mental health. Adv. Psychiatr. Treat. 2004, 10, 216–224. [Google Scholar] [CrossRef]
- Wabiri, N.; Taffa, N. Socio-economic inequality and HIV in South Africa. BMC Public Health 2013, 13, 1037. [Google Scholar] [CrossRef]
- Sia, D.; Tchouaket, É.N.; Hajizadeh, M.; Karemere, H.; Onadja, Y.; Nandi, A. The effect of gender inequality on HIV incidence in Sub-Saharan Africa. Public Health 2020, 182, 56–63. [Google Scholar] [CrossRef]
- Patel, V.; Burns, J.K.; Dhingra, M.; Tarver, L.; Kohrt, B.A.; Lund, C. Income inequality and depression: A systematic review and meta-analysis of the association and a scoping review of mechanisms. World Psychiatry 2018, 17, 76–89. [Google Scholar] [CrossRef] [PubMed]
- Buttrick, N.R.; Oishi, S. The psychological consequences of income inequality. Soc. Personal. Psychol. Compass 2017, 11, e12304. [Google Scholar] [CrossRef]
- Abedi, V.; Olulana, O.; Avula, V.; Chaudhary, D.; Khan, A.; Shahjouei, S.; Li, J.; Zand, R. Racial, economic, and health inequality and COVID-19 infection in the United States. J. Racial Ethn. Health Disparities 2021, 8, 732–742. [Google Scholar] [CrossRef]
- Litman, T. Evaluating Transportation Equity; Victoria Transport Policy Institute: Victoria, BC, Canada, 2017. [Google Scholar]
- Farrington, J.H. The new narrative of accessibility: Its potential contribution to discourses in (transport) geography. J. Transp. Geogr. 2007, 15, 319–330. [Google Scholar] [CrossRef]
- Nordbakke, S.; Schwanen, T. Well-being and mobility: A theoretical framework and literature review focusing on older people. Mobilities 2014, 9, 104–129. [Google Scholar] [CrossRef]
- Simpson, C.; Kemp, E.; Ataii, E.; Zhang, Y.; Mobility 2030: Transforming the mobility landscape. KPMG Int. 2019. Available online: https://assets.kpmg/content/dam/kpmg/xx/pdf/2019/02/mobility-2030-transforming-the-mobility-landscape.pdf (accessed on 11 February 2022).
- Hensher, D.A.; Mulley, C.; Ho, C.; Wong, Y.; Smith, G.; Nelson, J.D. Understanding Mobility as a Service (MaaS): Past, Present and Future; Elsevier: Amsterdam, The Netherlands, 2020. [Google Scholar]
- Holden, E.; Banister, D.; Gössling, S.; Gilpin, G.; Linnerud, K. Grand Narratives for sustainable mobility: A conceptual review. Energy Res. Soc. Sci. 2020, 65, 101454. [Google Scholar] [CrossRef]
- Fang, K.; Handy, S. Skateboarding for transportation: Exploring the factors behind an unconventional mode choice among university skateboard commuters. Transportation 2019, 46, 263–283. [Google Scholar] [CrossRef]
- Woodcock, J.; Banister, D.; Edwards, P.; Prentice, A.M.; Roberts, I. Energy and transport. Lancet 2007, 370, 1078–1088. [Google Scholar] [CrossRef]
- Glazener, A.; Khreis, H. Transforming our cities: Best practices towards clean air and active transportation. Curr. Environ. Health Rep. 2019, 6, 22–37. [Google Scholar] [CrossRef] [PubMed]
- Milner, J.; Davies, M.; Wilkinson, P. Urban energy, carbon management (low carbon cities) and co-benefits for human health. Curr. Opin. Environ. Sustain. 2012, 4, 398–404. [Google Scholar] [CrossRef]
- Hallal, P.C.; Andersen, L.B.; Bull, F.C.; Guthold, R.; Haskell, W.; Ekelund, U.; Group, L.P.A.S.W. Global physical activity levels: Surveillance progress, pitfalls, and prospects. Lancet 2012, 380, 247–257. [Google Scholar] [CrossRef]
- Sahlqvist, S.; Song, Y.; Ogilvie, D. Is active travel associated with greater physical activity? The contribution of commuting and non-commuting active travel to total physical activity in adults. Prev. Med. 2012, 55, 206–211. [Google Scholar] [CrossRef]
- Sahlqvist, S.; Goodman, A.; Cooper, A.R.; Ogilvie, D. Change in active travel and changes in recreational and total physical activity in adults: Longitudinal findings from the iConnect study. Int. J. Behav. Nutr. Phys. Act. 2013, 10, 28. [Google Scholar] [CrossRef]
- De Nazelle, A.; Nieuwenhuijsen, M.J.; Antó, J.M.; Brauer, M.; Briggs, D.; Braun-Fahrlander, C.; Cavill, N.; Cooper, A.R.; Desqueyroux, H.; Fruin, S. Improving health through policies that promote active travel: A review of evidence to support integrated health impact assessment. Environ. Int. 2011, 37, 766–777. [Google Scholar] [CrossRef]
- Sallis, J.F.; Frank, L.D.; Saelens, B.E.; Kraft, M.K. Active transportation and physical activity: Opportunities for collaboration on transportation and public health research. Transp. Res. Part A: Policy Pract. 2004, 38, 249–268. [Google Scholar] [CrossRef]
- Mueller, N.; Rojas-Rueda, D.; Cole-Hunter, T.; De Nazelle, A.; Dons, E.; Gerike, R.; Goetschi, T.; Panis, L.I.; Kahlmeier, S.; Nieuwenhuijsen, M. Health impact assessment of active transportation: A systematic review. Prev. Med. 2015, 76, 103–114. [Google Scholar] [CrossRef] [PubMed]
- Rojas-Rueda, D.; De Nazelle, A.; Tainio, M.; Nieuwenhuijsen, M.J. The health risks and benefits of cycling in urban environments compared with car use: Health impact assessment study. BMJ 2011, 343, d4521. [Google Scholar] [CrossRef] [PubMed]
- Hamer, M.; Chida, Y. Active commuting and cardiovascular risk: A meta-analytic review. Prev. Med. 2008, 46, 9–13. [Google Scholar] [CrossRef] [PubMed]
- Stavrakakis, N.; de Jonge, P.; Ormel, J.; Oldehinkel, A.J. Bidirectional prospective associations between physical activity and depressive symptoms. The TRAILS Study. J. Adolesc. Health 2012, 50, 503–508. [Google Scholar] [CrossRef]
- Da Silva, M.A.; Singh-Manoux, A.; Brunner, E.J.; Kaffashian, S.; Shipley, M.J.; Kivimäki, M.; Nabi, H. Bidirectional association between physical activity and symptoms of anxiety and depression: The Whitehall II study. Eur. J. Epidemiol. 2012, 27, 537–546. [Google Scholar] [CrossRef]
- Buehler, R.; Pucher, J.; Merom, D.; Bauman, A. Active travel in Germany and the US: Contributions of daily walking and cycling to physical activity. Am. J. Prev. Med. 2011, 41, 241–250. [Google Scholar] [CrossRef]
- Stark, J.; Meschik, M.; Singleton, P.A.; Schützhofer, B. Active school travel, attitudes and psychological well-being of children. Transp. Res. Part F Traffic Psychol. Behav. 2018, 56, 453–465. [Google Scholar] [CrossRef]
- Smith, O. Commute well-being differences by mode: Evidence from Portland, Oregon, USA. J. Transp. Health 2017, 4, 246–254. [Google Scholar] [CrossRef]
- Frömel, K.; Groffik, D.; Mitáš, J.; Dygrýn, J.; Valach, P.; Šafář, M. Active travel of Czech and Polish adolescents in relation to their well-being: Support for physical activity and health. Int. J. Environ. Res. Public Health 2020, 17, 2001. [Google Scholar] [CrossRef]
- Anable, J.; Gatersleben, B. All work and no play? The role of instrumental and affective factors in work and leisure journeys by different travel modes. Transp. Res. Part A Policy Pract. 2005, 39, 163–181. [Google Scholar] [CrossRef]
- Gatersleben, B.; Uzzell, D. Affective appraisals of the daily commute: Comparing perceptions of drivers, cyclists, walkers, and users of public transport. Environ. Behav. 2007, 39, 416–431. [Google Scholar] [CrossRef]
- LaJeunesse, S.; Rodríguez, D.A. Mindfulness, time affluence, and journey-based affect: Exploring relationships. Transp. Res. Part F Traffic Psychol. Behav. 2012, 15, 196–205. [Google Scholar] [CrossRef]
- Legrain, A.; Eluru, N.; El-Geneidy, A.M. Am stressed, must travel: The relationship between mode choice and commuting stress. Transp. Res. Part F Traffic Psychol. Behav. 2015, 34, 141–151. [Google Scholar] [CrossRef]
- Pérez, K.; Olabarria, M.; Rojas-Rueda, D.; Santamariña-Rubio, E.; Borrell, C.; Nieuwenhuijsen, M. The health and economic benefits of active transport policies in Barcelona. J. Transp. Health 2017, 4, 316–324. [Google Scholar] [CrossRef]
- Mizdrak, A.; Blakely, T.; Cleghorn, C.L.; Cobiac, L.J. Potential of active transport to improve health, reduce healthcare costs, and reduce greenhouse gas emissions: A modelling study. PLoS ONE 2019, 14, e0219316. [Google Scholar] [CrossRef]
- Winters, M.; Buehler, R.; Götschi, T. Policies to promote active travel: Evidence from reviews of the literature. Curr. Environ. Health Rep. 2017, 4, 278–285. [Google Scholar] [CrossRef]
- De Hartog, J.J.; Boogaard, H.; Nijland, H.; Hoek, G. Do the health benefits of cycling outweigh the risks? Environ. Health Perspect. 2010, 118, 1109–1116. [Google Scholar] [CrossRef]
- Pucher, J.; Buehler, R. Cycling towards a more sustainable transport future. Transp. Rev. 2017, 37, 689–694. [Google Scholar] [CrossRef]
- Aldred, R.; Goodman, A.; Gulliver, J.; Woodcock, J. Cycling injury risk in London: A case-control study exploring the impact of cycle volumes, motor vehicle volumes, and road characteristics including speed limits. Accid. Anal. Prev. 2018, 117, 75–84. [Google Scholar] [CrossRef]
- Kaplan, S.; Vavatsoulas, K.; Prato, C.G. Aggravating and mitigating factors associated with cyclist injury severity in Denmark. J. Saf. Res. 2014, 50, 75–82. [Google Scholar] [CrossRef] [PubMed]
- Mueller, N.; Rojas-Rueda, D.; Khreis, H.; Cirach, M.; Andrés, D.; Ballester, J.; Bartoll, X.; Daher, C.; Deluca, A.; Echave, C. Changing the urban design of cities for health: The superblock model. Environ. Int. 2020, 134, 105132. [Google Scholar] [CrossRef] [PubMed]
- Calthorpe, P. The Next American Metropolis: Ecology, Community, and the American Dream; Princeton Architectural Press: New York, NY, USA, 1993. [Google Scholar]
- Miller, P.; de Barros, A.G.; Kattan, L.; Wirasinghe, S. Public transportation and sustainability: A review. KSCE J. Civ. Eng. 2016, 20, 1076–1083. [Google Scholar] [CrossRef]
- Saif, M.A.; Zefreh, M.M.; Torok, A. Public transport accessibility: A literature review. Period. Polytech. Transp. Eng. 2019, 47, 36–43. [Google Scholar] [CrossRef]
- Ojo, T.K. Quality of public transport service: An integrative review and research agenda. Transp. Lett. 2019, 11, 104–116. [Google Scholar] [CrossRef]
- Friman, M.; Lättman, K.; Olsson, L.E. Public transport quality, safety, and perceived accessibility. Sustainability 2020, 12, 3563. [Google Scholar] [CrossRef]
- Thompson, K.; Schofield, P. An investigation of the relationship between public transport performance and destination satisfaction. J. Transp. Geogr. 2007, 15, 136–144. [Google Scholar] [CrossRef]
- Nocera, S. Un approccio operativo per la valutazione della qualità nei servizi di trasporto pubblico/An Operational Approach for Quality Evaluation in Public Transport Services. Ing. Ferrov. 2010, 65, 363–383. [Google Scholar]
- Kirchhoff, P. Städtische Verkehrsplanung: Konzepte, Verfahren, Maßnahmen (German Edition), 2002nd ed.; Vieweg+Teubner Verlag: Werkstoffe, Germany, 2002. [Google Scholar]
- Nocera, S. The key role of quality assessment in public transport policy. Traffic Eng. Control 2011, 52, 394–398. [Google Scholar]
- Ewing, R.; Hamidi, S. Longitudinal analysis of transit’s land use multiplier in Portland (OR). J. Am. Plan. Assoc. 2014, 80, 123–137. [Google Scholar] [CrossRef][Green Version]
- Weisbrod, G.; Stein, N. Public transport evaluation. In The Routledge Handbook of Public Transport; Routledge: London, UK, 2021; pp. 138–153. [Google Scholar]
- Gentile, G.; Nökel, K. Modelling Public Transport Passenger Flows in the Era of Intelligent Transport Systems; Springer Tracts on Transportation and Traffic; Springer International Publishing: Cham, Switzerland, 2016; Volume 10. [Google Scholar]
- Briand, A.-S.; Côme, E.; Trépanier, M.; Oukhellou, L. Analyzing year-to-year changes in public transport passenger behaviour using smart card data. Transp. Res. Part C Emerg. Technol. 2017, 79, 274–289. [Google Scholar] [CrossRef]
- Litman, T. Evaluating Public Transportation Health Benefits; Victoria Transport Policy Institute: Victoria, BC, Canada, 2012. [Google Scholar]
- van Soest, D.; Tight, M.R.; Rogers, C.D. Exploring the distances people walk to access public transport. Transp. Rev. 2020, 40, 160–182. [Google Scholar] [CrossRef]
- Voss, C.; Sims-Gould, J.; Ashe, M.C.; McKay, H.A.; Pugh, C.; Winters, M. Public transit use and physical activity in community-dwelling older adults: Combining GPS and accelerometry to assess transportation-related physical activity. J. Transp. Health 2016, 3, 191–199. [Google Scholar] [CrossRef]
- Besser, L.M.; Dannenberg, A.L. Walking to public transit: Steps to help meet physical activity recommendations. Am. J. Prev. Med. 2005, 29, 273–280. [Google Scholar] [CrossRef] [PubMed]
- Tajalli, M.; Hajbabaie, A. On the relationships between commuting mode choice and public health. J. Transp. Health 2017, 4, 267–277. [Google Scholar] [CrossRef]
- Xu, F.; Jin, L.; Qin, Z.; Chen, X.; Xu, Z.; He, J.; Wang, Z.; Ji, W.; Ren, F.; Du, Q. Access to public transport and childhood obesity: A systematic review. Obes. Rev. 2021, 22, e12987. [Google Scholar] [CrossRef]
- MacDonald, J.M.; Stokes, R.J.; Cohen, D.A.; Kofner, A.; Ridgeway, G.K. The effect of light rail transit on body mass index and physical activity. Am. J. Prev. Med. 2010, 39, 105–112. [Google Scholar] [CrossRef]
- Flint, E.; Webb, E.; Cummins, S. Change in commute mode and body-mass index: Prospective, longitudinal evidence from UK Biobank. Lancet Public Health 2016, 1, e46–e55. [Google Scholar] [CrossRef]
- Jones, A.; Goodman, A.; Roberts, H.; Steinbach, R.; Green, J. Entitlement to concessionary public transport and wellbeing: A qualitative study of young people and older citizens in London, UK. Soc. Sci. Med. 2013, 91, 202–209. [Google Scholar] [CrossRef]
- Reinhard, E.; Courtin, E.; Van Lenthe, F.J.; Avendano, M. Public transport policy, social engagement and mental health in older age: A quasi-experimental evaluation of free bus passes in England. J. Epidemiol. Community Health 2018, 72, 361–368. [Google Scholar] [CrossRef]
- Cafiso, S.; Di Graziano, A.; Pappalardo, G. Road safety issues for bus transport management. Accid. Anal. Prev. 2013, 60, 324–333. [Google Scholar] [CrossRef] [PubMed]
- Carroll, P.; Caulfield, B.; Ahern, A. Measuring the potential emission reductions from a shift towards public transport. Transp. Res. Part D Transp. Environ. 2019, 73, 338–351. [Google Scholar] [CrossRef]
- Pietrzak, K.; Pietrzak, O. Environmental effects of electromobility in a sustainable urban public transport. Sustainability 2020, 12, 1052. [Google Scholar] [CrossRef]
- Burns, L.D. A vision of our transport future. Nature 2013, 497, 181–182. [Google Scholar] [CrossRef] [PubMed]
- Litman, T. Autonomous Vehicle Implementation Predictions; Victoria Transport Policy Institute Victoria: Victoria, BC, Canada, 2017. [Google Scholar]
- Bösch, P.M.; Becker, F.; Becker, H.; Axhausen, K.W. Cost-based analysis of autonomous mobility services. Transp. Policy 2018, 64, 76–91. [Google Scholar] [CrossRef]
- Campbell, S.; O’Mahony, N.; Krpalcova, L.; Riordan, D.; Walsh, J.; Murphy, A.; Ryan, C. Sensor technology in autonomous vehicles: A review. In Proceedings of the 2018 29th Irish Signals and Systems Conference (ISSC), Belfast, UK, 21–22 June 2018; pp. 1–4. [Google Scholar]
- Bilik, I.; Longman, O.; Villeval, S.; Tabrikian, J. The rise of radar for autonomous vehicles: Signal processing solutions and future research directions. IEEE Signal Process. Mag. 2019, 36, 20–31. [Google Scholar] [CrossRef]
- Kocić, J.; Jovičić, N.; Drndarević, V. Sensors and sensor fusion in autonomous vehicles. In Proceedings of the 2018 26th Telecommunications Forum (TELFOR), Belgrade, Serbia, 20–21 November 2018; pp. 420–425. [Google Scholar]
- Ma, Y.; Wang, Z.; Yang, H.; Yang, L. Artificial intelligence applications in the development of autonomous vehicles: A survey. IEEE/CAA J. Autom. Sin. 2020, 7, 315–329. [Google Scholar] [CrossRef]
- Kuutti, S.; Bowden, R.; Jin, Y.; Barber, P.; Fallah, S. A survey of deep learning applications to autonomous vehicle control. IEEE Trans. Intell. Transp. Syst. 2020, 22, 712–733. [Google Scholar] [CrossRef]
- Kong, L.; Khan, M.K.; Wu, F.; Chen, G.; Zeng, P. Millimeter-wave wireless communications for IoT-cloud supported autonomous vehicles: Overview, design, and challenges. IEEE Commun. Mag. 2017, 55, 62–68. [Google Scholar] [CrossRef]
- Zachariah, J.; Gao, J.; Kornhauser, A.; Mufti, T. Uncongested mobility for all: A proposal for an area wide autonomous taxi system in New Jersey. In Proceedings of the Transportation Research Board 93rd Annual Meeting, Washington, DC, USA, 12–16 January 2014. [Google Scholar]
- Fagnant, D.J.; Kockelman, K.M.; Bansal, P. Operations of shared autonomous vehicle fleet for Austin, Texas, market. Transp. Res. Rec. 2015, 2563, 98–106. [Google Scholar] [CrossRef]
- Boesch, P.M.; Ciari, F.; Axhausen, K.W. Autonomous vehicle fleet sizes required to serve different levels of demand. Transp. Res. Rec. 2016, 2542, 111–119. [Google Scholar] [CrossRef]
- Shaheen, S.; Cohen, A. Shared ride services in North America: Definitions, impacts, and the future of pooling. Transp. Rev. 2019, 39, 427–442. [Google Scholar] [CrossRef]
- Jing, P.; Xu, G.; Chen, Y.; Shi, Y.; Zhan, F. The determinants behind the acceptance of autonomous vehicles: A systematic review. Sustainability 2020, 12, 1719. [Google Scholar] [CrossRef]
- Ye, L.; Yamamoto, T. Evaluating the impact of connected and autonomous vehicles on traffic safety. Phys. A Stat. Mech. Its Appl. 2019, 526, 121009. [Google Scholar] [CrossRef]
- Rezaei, A.; Caulfield, B. Safety of autonomous vehicles: What are the insights from experienced industry professionals? Transp. Res. Part F Traffic Psychol. Behav. 2021, 81, 472–489. [Google Scholar] [CrossRef]
- Endsley, M.R. Situation awareness in future autonomous vehicles: Beware of the unexpected. In Proceedings of the Congress of the International Ergonomics Association, Florence, Italy, 26–30 August 2018; pp. 303–309. [Google Scholar]
- Nunes, A.; Reimer, B.; Coughlin, J.F. People must retain control of autonomous vehicles. Nature 2018, 556, 169–171. [Google Scholar] [CrossRef]
- Bennett, R.; Vijaygopal, R.; Kottasz, R. Attitudes towards autonomous vehicles among people with physical disabilities. Transp. Res. Part A Policy Pract. 2019, 127, 1–17. [Google Scholar] [CrossRef]
- Holley-Moore, G.; Creighton, H. The Future of Transport in an Ageing Society; Age UK London: London, UK, 2015. [Google Scholar]
- Hwang, J.; Li, W.; Stough, L.; Lee, C.; Turnbull, K. A focus group study on the potential of autonomous vehicles as a viable transportation option: Perspectives from people with disabilities and public transit agencies. Transp. Res. Part F Traffic Psychol. Behav. 2020, 70, 260–274. [Google Scholar] [CrossRef]
- Fagnant, D.J.; Kockelman, K. Preparing a nation for autonomous vehicles: Opportunities, barriers and policy recommendations. Transp. Res. Part A Policy Pract. 2015, 77, 167–181. [Google Scholar] [CrossRef]
- Le Vine, S.; Polak, J. The impact of free-floating carsharing on car ownership: Early-stage findings from London. Transp. Policy 2019, 75, 119–127. [Google Scholar] [CrossRef]
- Loose, W. The state of European car-sharing. Proj. Momo Final Rep. D 2010, 2, 1–119. [Google Scholar]
- Becker, H.; Ciari, F.; Axhausen, K.W. Measuring the car ownership impact of free-floating car-sharing–A case study in Basel, Switzerland. Transp. Res. Part D Transp. Environ. 2018, 65, 51–62. [Google Scholar] [CrossRef]
- Stasko, T.H.; Buck, A.B.; Gao, H.O. Carsharing in a university setting: Impacts on vehicle ownership, parking demand, and mobility in Ithaca, NY. Transp. Policy 2013, 30, 262–268. [Google Scholar] [CrossRef]
- Shaheen, S.; Cohen, A.; Chan, N.; Bansal, A. Sharing strategies: Carsharing, shared micromobility (bikesharing and scooter sharing), transportation network companies, microtransit, and other innovative mobility modes. In Transportation, Land Use, and Environmental Planning; Elsevier: Amsterdam, The Netherlands, 2020; pp. 237–262. [Google Scholar]
- Zhang, W.; Guhathakurta, S.; Fang, J.; Zhang, G. The performance and benefits of a shared autonomous vehicles based dynamic ridesharing system: An agent-based simulation approach. In Proceedings of the Transportation Research Board 94th Annual Meeting, Washington, DC, USA, 11–15 January 2015; p. 2919. [Google Scholar]
- Alam, M.J.; Habib, M.A. Investigation of the impacts of shared autonomous vehicle operation in Halifax, Canada using a dynamic traffic microsimulation model. Procedia Comput. Sci. 2018, 130, 496–503. [Google Scholar] [CrossRef]
- Zhao, Y.; Kockelman, K.M. Anticipating the regional impacts of connected and automated vehicle travel in Austin, Texas. J. Urban Plan. Dev. 2018, 144, 04018032. [Google Scholar] [CrossRef]
- Alazzawi, S.; Hummel, M.; Kordt, P.; Sickenberger, T.; Wieseotte, C.; Wohak, O. Simulating the impact of shared, autonomous vehicles on urban mobility-a case study of Milan. EPiC Ser. Eng. 2018, 2, 94–110. [Google Scholar]
- Fagnant, D.J.; Kockelman, K.M. The travel and environmental implications of shared autonomous vehicles, using agent-based model scenarios. Transp. Res. Part C Emerg. Technol. 2014, 40, 1–13. [Google Scholar] [CrossRef]
- Jing, P.; Hu, H.; Zhan, F.; Chen, Y.; Shi, Y. Agent-based simulation of autonomous vehicles: A systematic literature review. IEEE Access 2020, 8, 79089–79103. [Google Scholar] [CrossRef]
- Martinez, L.M.; Viegas, J.M. Assessing the impacts of deploying a shared self-driving urban mobility system: An agent-based model applied to the city of Lisbon, Portugal. Int. J. Transp. Sci. Technol. 2017, 6, 13–27. [Google Scholar] [CrossRef]
- Zhang, W.; Guhathakurta, S.; Fang, J.; Zhang, G. Exploring the impact of shared autonomous vehicles on urban parking demand: An agent-based simulation approach. Sustain. Cities Soc. 2015, 19, 34–45. [Google Scholar] [CrossRef]
- Fanning, A.; Krestyaninova, O.; Raworth, K.; Dwyer, J.; Hagerman Miller, N.; Eriksson, F. Creating City Portraits: A methodological Guide from the Thriving Cities Initiative. Rep. Prep. Doughnut Econ. Action Lab Biomimicry 2020, 3, C40. [Google Scholar]
- McManus, M. Place-Based Climate Action, Community Wealth Building & Doughnut Economics a Rapid Review. 2022. Available online: https://pcancities.org.uk/sites/default/files/RapidReview%20FINAL_0.pdf). (accessed on 9 September 2022).
- Moretti, M. Can Doughnut Economics Fill Amsterdam’s Dietary Needs?: A Critical Examination of the City’s New Circular and Climate Strategy; European University Institute: Fiesole, Italy, 2022. [Google Scholar]
- Fanning, A.; Raworth, K.; Krestyaninova, O.; Eriksson, F. Doughnut Unrolled: Data Portrait of Place. 2022. Available online: https://eprints.whiterose.ac.uk/186065/1/Doughnut%20Unrolled%20-%20Data%20Portrait%20of%20Place_v2.pdf (accessed on 10 August 2022).
- Dissaux, T.; Lestré, T.D.; Malchair, L.; Nalpas, D.; Nevens, L.; Roman, P.; Thiry, G.; Infante, L.F.V. BrusselsDonut-Summary of the Results; Brussels, Belgium, 2021. [Google Scholar]
- Turner, R.; Blundell, A.; Collins, C.; Exeter, O.; Wills, J. Sustainable DEVELOPMENT in Cornwall: Local Perspectives on Challenges and Opportunities. 2021. Available online: https://www.exeter.ac.uk/esi/research/projects/impact-towardsasustainablecornwall (accessed on 10 August 2022).
- Dillman, K.J.; Czepkiewicz, M.; Heinonen, J.; Davíðsdóttir, B. A safe and just space for urban mobility: A framework for sector-based sustainable consumption corridor development. Glob. Sustain. 2021, 4, e28. [Google Scholar] [CrossRef]
- Pucher, J.; Renne, J.L. Socioeconomics of Urban Travel: Evidence from the 2001 NHTS. Transp. Q. 2003, 57, 49–77. [Google Scholar]
- Cornut, B.; Madre, J.-L. A longitudinal perspective on car ownership and use in relation with income inequalities in the Paris metropolitan area. Transp. Rev. 2017, 37, 227–244. [Google Scholar] [CrossRef]
- Dargay, J.; Gately, D. Income’s effect on car and vehicle ownership, worldwide: 1960–2015. Transp. Res. Part A Policy Pract. 1999, 33, 101–138. [Google Scholar] [CrossRef]
- Gemici, K.; Koutsoupias, E.; Monnot, B.; Papadimitriou, C.; Piliouras, G. Wealth inequality and the price of anarchy. arXiv 2018, arXiv:1802.09269. [Google Scholar]
- Mackett, R.L. The health implications of inequalities in travel. J. Transp. Health 2014, 1, 202–209. [Google Scholar] [CrossRef]
- Weng, M.; Ding, N.; Li, J.; Jin, X.; Xiao, H.; He, Z.; Su, S. The 15-minute walkable neighborhoods: Measurement, social inequalities and implications for building healthy communities in urban China. J. Transp. Health 2019, 13, 259–273. [Google Scholar] [CrossRef]
- Steinbach, R.; Green, J.; Datta, J.; Edwards, P. Cycling and the city: A case study of how gendered, ethnic and class identities can shape healthy transport choices. Soc. Sci. Med. 2011, 72, 1123–1130. [Google Scholar] [CrossRef]
- Harms, L.; Bertolini, L.; Te Brömmelstroet, M. Spatial and social variations in cycling patterns in a mature cycling country exploring differences and trends. J. Transp. Health 2014, 1, 232–242. [Google Scholar] [CrossRef]
- Garrard, J.; Rose, G.; Lo, S.K. Promoting transportation cycling for women: The role of bicycle infrastructure. Prev. Med. 2008, 46, 55–59. [Google Scholar] [CrossRef]
- Akar, G.; Fischer, N.; Namgung, M. Bicycling choice and gender case study: The Ohio State University. Int. J. Sustain. Transp. 2013, 7, 347–365. [Google Scholar] [CrossRef]
- Tompkins, K.J. “Are We Building Biking Solidarity”: Gendered, Racial, and Spatial Barriers to Bicycling in Portland, Oregon; Portland State University: Portland, OR, USA, 2017. [Google Scholar]
- Heinen, E.; Maat, K.; Van Wee, B. The effect of work-related factors on the bicycle commute mode choice in the Netherlands. Transportation 2013, 40, 23–43. [Google Scholar] [CrossRef]
- Goodman, A.; Aldred, R. Inequalities in utility and leisure cycling in England, and variation by local cycling prevalence. Transp. Res. Part F Traffic Psychol. Behav. 2018, 56, 381–391. [Google Scholar] [CrossRef]
- Nehme, E.K.; Pérez, A.; Ranjit, N.; Amick, B.C.; Kohl, H.W. Sociodemographic factors, population density, and bicycling for transportation in the United States. J. Phys. Act. Health 2016, 13, 36–43. [Google Scholar] [CrossRef]
- Aldred, R.; Woodcock, J.; Goodman, A. Does more cycling mean more diversity in cycling? Transp. Rev. 2016, 36, 28–44. [Google Scholar] [CrossRef]
- Van Cauwenberg, J.; de Geus, B.; Deforche, B. Cycling for transport among older adults: Health benefits, prevalence, determinants, injuries and the potential of E-bikes. In Geographies of Transport and Ageing; Springer: Berlin/Heidelberg, Germany, 2018; pp. 133–151. [Google Scholar]
- White, M. How Much Does a Bike Cost? Available online: https://bicycleuniverse.com/how-much-does-a-bike-cost/ (accessed on 20 April 2022).
- Grengs, J. Does public transit counteract the segregation of carless households? Measuring spatial patterns of accessibility. Transp. Res. Rec. 2001, 1753, 3–10. [Google Scholar] [CrossRef]
- Liu, D.; Kwan, M.-P.; Kan, Z. Assessing job-access inequity for transit-based workers across space and race with the Palma ratio. Urban Res. Pract. 2021, 1–27. [Google Scholar] [CrossRef]
- Zhao, P.; Zhang, Y. The effects of metro fare increase on transport equity: New evidence from Beijing. Transp. Policy 2019, 74, 73–83. [Google Scholar] [CrossRef]
- Boisjoly, G.; Serra, B.; Oliveira, G.; El-Geneidy, A. Inequity in transit: Evaluating public transport distribution through accessibility measurements in São Paulo, Rio de Janeiro, Curitiba and Recife, Brazil. J. Transp. Geography. 2020, 82, 1–11. [Google Scholar] [CrossRef]
- Cao, X.; Chen, H.; Liang, F.; Wang, W. Measurement and spatial differentiation characteristics of transit equity: A case study of Guangzhou, China. Sustainability 2018, 10, 1069. [Google Scholar] [CrossRef]
- Hsu, H.-P. How does fear of sexual harassment on transit affect women’s use of transit? Women’s Issues Transp. 2010, 46, 85–94. [Google Scholar]
- Neupane, G.; Chesney-Lind, M. Violence against women on public transport in Nepal: Sexual harassment and the spatial expression of male privilege. Int. J. Comp. Appl. Crim. Justice 2014, 38, 23–38. [Google Scholar] [CrossRef]
- King, J.; King, M.; Edwards, N.; Carroll, J.-A.; Watling, H.; Anam, M.; Bull, M.; Oviedo-Trespalacios, O. Exploring women’s experiences of gender-based violence and other threats to safety on public transport in Bangladesh. Int. J. Crime Justice Soc. Democr. 2021, 10, 158–173. [Google Scholar] [CrossRef]
- Dunckel-Graglia, A. Women-only transportation: How “pink” public transportation changes public perception of women’s mobility. J. Public Transp. 2013, 16, 5. [Google Scholar] [CrossRef]
- Lubitow, A.; Carathers, J.; Kelly, M.; Abelson, M. Transmobilities: Mobility, harassment, and violence experienced by transgender and gender nonconforming public transit riders in Portland, Oregon. Gend. Place Cult. 2017, 24, 1398–1418. [Google Scholar] [CrossRef]
- Emory, K.; Douma, F.; Cao, J. Autonomous vehicle policies with equity implications: Patterns and gaps. Transp. Res. Interdiscip. Perspect. 2022, 13, 100521. [Google Scholar] [CrossRef]
- Wittwer, R.; Hubrich, S. Free-floating carsharing experiences in German metropolitan areas. Transp. Res. Procedia 2018, 33, 323–330. [Google Scholar] [CrossRef]
- Becker, H.; Ciari, F.; Axhausen, K.W. Comparing car-sharing schemes in Switzerland: User groups and usage patterns. Transp. Res. Part A Policy Pract. 2017, 97, 17–29. [Google Scholar] [CrossRef]
- Dias, F.F.; Lavieri, P.S.; Garikapati, V.M.; Astroza, S.; Pendyala, R.M.; Bhat, C.R. A behavioral choice model of the use of car-sharing and ride-sourcing services. Transportation 2017, 44, 1307–1323. [Google Scholar] [CrossRef]
- Burkhardt, J.E.; Millard-Ball, A. Who is attracted to carsharing? Transp. Res. Rec. 2006, 1986, 98–105. [Google Scholar] [CrossRef]
- Kawgan-Kagan, I.; Popp, M. Sustainability and gender: A mixed-method analysis of urban women’s mode choice with particular consideration of e-carsharing. Transp. Res. Procedia 2018, 31, 146–159. [Google Scholar] [CrossRef]
- Kawgan-Kagan, I. Early adopters of carsharing with and without BEVs with respect to gender preferences. Eur. Transp. Res. Rev. 2015, 7, 33. [Google Scholar] [CrossRef]
- Cohn, J.; Ezike, R.; Martin, J.; Donkor, K.; Ridgway, M.; Balding, M. Examining the equity impacts of autonomous vehicles: A travel demand model approach. Transp. Res. Rec. 2019, 2673, 23–35. [Google Scholar] [CrossRef]
- Xia, B.; Wu, J.; Wang, J.; Fang, Y.; Shen, H.; Shen, J. Sustainable renewal methods of urban public parking spaces under the scenario of shared autonomous vehicles (SAV): A review and a proposal. Sustainability 2021, 13, 3629. [Google Scholar] [CrossRef]
- Eppenberger, N.; Richter, M.A. The opportunity of shared autonomous vehicles to improve spatial equity in accessibility and socio-economic developments in European urban areas. Eur. Transp. Res. Rev. 2021, 13, 32. [Google Scholar] [CrossRef]
- Litman, T. Autonomous vehicle implementation predictions: Implications for transport plannin; Victoria Transport Policy Institute: Victora, BC, Canada, 2020. [Google Scholar]
- Wang, S.; Jiang, Z.; Noland, R.B.; Mondschein, A.S. Attitudes towards privately-owned and shared autonomous vehicles. Transp. Res. Part F Traffic Psychol. Behav. 2020, 72, 297–306. [Google Scholar] [CrossRef]
- Tian, Z.; Feng, T.; Timmermans, H.J.; Yao, B. Using autonomous vehicles or shared cars? Results of a stated choice experiment. Transp. Res. Part C: Emerg. Technol. 2021, 128, 103117. [Google Scholar] [CrossRef]
- Clayton, W.; Paddeu, D.; Parkhurst, G.; Parkin, J. Autonomous vehicles: Who will use them, and will they share? Transp. Plan. Technol. 2020, 43, 343–364. [Google Scholar] [CrossRef]
- Spurlock, C.A.; Sears, J.; Wong-Parodi, G.; Walker, V.; Jin, L.; Taylor, M.; Duvall, A.; Gopal, A.; Todd, A. Describing the users: Understanding adoption of and interest in shared, electrified, and automated transportation in the San Francisco Bay Area. Transp. Res. Part D Transp. Environ. 2019, 71, 283–301. [Google Scholar] [CrossRef]
- Webb, J.; Wilson, C.; Kularatne, T. Will people accept shared autonomous electric vehicles? A survey before and after receipt of the costs and benefits. Econ. Anal. Policy 2019, 61, 118–135. [Google Scholar] [CrossRef]
- Menon, N.; Barbour, N.; Zhang, Y.; Pinjari, A.R.; Mannering, F. Shared autonomous vehicles and their potential impacts on household vehicle ownership: An exploratory empirical assessment. Int. J. Sustain. Transp. 2019, 13, 111–122. [Google Scholar] [CrossRef]
- Golbabaei, F.; Yigitcanlar, T.; Bunker, J. The role of shared autonomous vehicle systems in delivering smart urban mobility: A systematic review of the literature. Int. J. Sustain. Transp. 2021, 15, 731–748. [Google Scholar] [CrossRef]
- Stoiber, T.; Schubert, I.; Hoerler, R.; Burger, P. Will consumers prefer shared and pooled-use autonomous vehicles? A stated choice experiment with Swiss households. Transp. Res. Part D Transp. Environ. 2019, 71, 265–282. [Google Scholar] [CrossRef]
- Moreno, A.T.; Michalski, A.; Llorca, C.; Moeckel, R. Shared autonomous vehicles effect on vehicle-km traveled and average trip duration. J. Adv. Transp. 2018, 2018, 8969353. [Google Scholar] [CrossRef]
- Pflugfelder, E.H. Autonomous vehicles and gender: A commentary. Transfers 2018, 8, 104–111. [Google Scholar] [CrossRef]
- Adeel, M.; Yeh, A.G.; Zhang, F. Gender inequality in mobility and mode choice in Pakistan. Transportation 2017, 44, 1519–1534. [Google Scholar] [CrossRef]
- Cugurullo, F.; Acheampong, R.A.; Gueriau, M.; Dusparic, I. The transition to autonomous cars, the redesign of cities and the future of urban sustainability. Urban Geogr. 2021, 42, 833–859. [Google Scholar] [CrossRef]


Publisher’s Note: MDPI stays neutral with regard to jurisdictional claims in published maps and institutional affiliations. |
© 2022 by the authors. Licensee MDPI, Basel, Switzerland. This article is an open access article distributed under the terms and conditions of the Creative Commons Attribution (CC BY) license (https://creativecommons.org/licenses/by/4.0/).