1. Introduction
A tsunami is created by gigantic waves caused by a disturbance or seismic activities, such as earthquakes, volcanic eruptions, landslides, or rock falls. Most recent tsunamis around the world have been the result of earthquakes. Tsunamis can lead to massive destruction and fatalities. The destruction of life and property they cause is huge, thus the need for early detection systems.
Table 1 shows an account of recent tsunamis and early warning systems used in some underdeveloped countries. The comparison is merely to highlight the reason/primary cause of the tsunami and the distance of the affected area from the tsunami’s source, in addition to other related important issues.
In this technological era, it is possible to detect tsunamis and generate timely tsunami updates. This tsunami management process can be facilitated by different techniques, such as event-based sensor networks which are well-known for their strong link to disaster management techniques. This IoT-based data collection technique backed by state-of-the-art analysis can provide insights that can effectively reduce the potential damage and loss of lives caused by natural disasters, such as volcanic eruptions, earthquakes, tornados, and tsunamis [
1]. IoT data sensing is an advanced technology that enables taking measurements remotely from sensors distributed amongst areas of interest by incorporating new technologies, such as machine learning, the Internet of Things, and big data analytics [
2]. Other techniques mainly depend on satellites to collect and analyze data from remote sensors to give enough warning to mitigate the effect of a tsunami [
3].
Though early detection systems have been made possible with technological advancements, such as sensor networks and machine learning, the data presented in
Table 1 emphasizes the need for more research and state-of-the-art development of an early tsunami warning and detection system, especially for low-income countries. This is because the current advanced systems are either very expensive or require advanced management for both developed and undeveloped countries. For instance, an earthquake of 7.5 triggered by an underwater landslide caused a tsunami on 28 September 2018 in Indonesia; 22 buoys connected to the seafloor had not been functioning for 6 years due to a lack of funding [
4]. On the other hand, New Zealand has a DART sensor system of 12 sensors, which is further connected to other global partners for the real transmission of data [
5]. Although using satellites is one of the commonly used technologies for tsunami detection, it can take up to five minutes to issue an early warning after tsunami detection [
6].
A tsunami warning system is broadly divided into two stages: upstream and downstream. The former is the detection of the earthquake and the prediction of a tsunami, and the latter stage is the warning and evacuation of people [
2]. A tsunami system does require both technical and socio-economic factors for development [
7]. Therefore, the economic capacity of any country and/or region is an important factor when designing and building a tsunami system considering all the requirements and countermeasures [
8]. This calls for a potential need for collaboration and contribution among researchers and hardware industries for innovation in the warning and detection model of Tsunami and scalable devices since the devices are often imported from developed countries, which renders the projects extremely expensive. We suggest that low-income countries design and manufacture low-cost hardware based on new technologies such as fuzzy logic, machine learning, and artificial intelligence.
We present an economical, optimized integrated system of wireless sensor network and fuzzy logic to detect tsunamis and generate singles for a quick alert. Our alert and no-alert system also takes advantage of partial aggregation and no aggregation for less delay and low energy consumption.
The major contributions of this paper include:
- (1)
Presenting a comprehensive survey of existing tsunami systems and identifying the reasons for the lack of proper deployment of these systems in underdeveloped countries.
- (2)
The paper presents a fuzzy logic approach that utilizes the effect of tsunamis on sea turtles and the angle of their deviation or navigation direction, in addition to real-time inputs, such as water level and earthquakes from a tsunami database.
- (3)
A cost-effective and optimized concept of fuzzy logic and a WSN-based model for tsunami resiliency is proposed. The proposed concept offers a network of interlinked pressure and electromagnetic sensors, and the fuzzy logic system has the potential to facilitate the real-time processing of data streams to reveal new information, patterns, and insights for effective tsunami management.
Figure 1 illustrates the overall workflow of the concept of the proposed model.
- (4)
The system is evaluated regarding cost, delay, and energy consumption. The results demonstrate the comparison of different parameters and the efficiency of the system.
The remainder of this paper is organized as follows.
Section 2 describes the related research work in detail.
Section 3 thoroughly describes the proposed model and its main functions, i.e., data collection for the fuzzy logic system to detect a tsunami, energy saving through partial data aggregation mode, and the early warning of a tsunami through the no aggregation mode.
Section 4 presents the results and discussion along with the graphs of delay and energy for both modes of aggregation, i.e., no aggregation and partial aggregation, co-efficient tables, and comparisons of delay and energy during a tsunami and No Tsunami state. Finally,
Section 5 presents the conclusions of this research.
2. Related Work
Various studies have been carried out on finding gaps and proposing different models for tsunami early warning and detection. Recent research [
9] has proposed a detection system for Japan using the sensing system of radar. This model is based on the radar bands threshold value (q-factor). As the water propagates from the deep ocean towards the coastal area due to the earthquake, the band value changes abruptly due to increased velocity. There exists a relationship between the earthquake and the values of the band. So, a threshold value of the band because of an earthquake before a tsunami is proposed as a q-factor value. The velocity declines after this threshold value, indicating the tsunami’s arrival.
A network of sensors is an efficient and cost-effective enhancement to tsunami early warning systems for the coastal area near an earthquake. As such, a regional network can be designed using the global positioning system (GPS) for rapid and accurate tsunami warning and tracking with a proper analysis system and real-time data [
10].
A study in [
6] used a particle swarm optimization algorithm and a 2D nonlinear equation to place the sensor to reduce the detection time. The authors found an inverse relation between tsunami detection time and the number of sensor nodes. However, increasing cost is also important when considering the number of nodes. Tsunamis start with less unnoticeable magnitude, but their wavelengths are longer than normal seawater. Another noticeable thing is that in-depth ocean tsunamis propagate faster with less energy loss. So the tsunami’s strength is inversely proportional to the wavelength [
11].
When it comes to efficient tsunami detection, one of the most expensive and well-organized systems is DART (deep ocean tsunami assessment and reporting). The installation cost of DART is USD 0.5 M, and the yearly maintenance cost is USD 300,000. Ocean DART is a buoy technology and was first developed by the Pacific Marine Environmental Laboratory in the United States. DART buoys have seafloor pressure and moored surface buoys, which help detect tsunamis and real-time communication.
DART has four generations. The first generation consisted of separate pressure buoys and surface buoys with one-way communication. The second generation allowed two-way communications with real-time data capture. In the third generation of DART, both buoy parts were integrated into one. In the fourth generation, advanced pressure sensors are used. A tsunami is measured close to the earthquake and surface, or moored buoys are connected to the tsunami warning center and send high-resolution data, which is further transferred to other stations via satellite [
12]. Japan is another example of the world’s largest and most expensive tsunami system. In Japan’s observation system, the cost of one buoy is USD 3 million [
13]. As discussed in the previous section, these costly systems are not appropriate for developing countries, such as Haiti and low-income countries such as Pakistan, Indonesia, etc., that require aid for developing low-cost and efficient tsunami detection/ warning systems.
Tsunamis occur infrequently, and this might be a reason why little attention has been given to the mitigation of this hazard in developing countries, such as Pakistan. We argue that the coastlines need to be monitored with proper planning for tsunamis in the provinces of Baluchistan and Sindh, which are adjacent to the Arabian Sea. Strong awareness programs are required for the communities to be informed about evacuation plans in case any such hazard occurs in the future [
14]. Currently, the tsunami monitoring system of the Pakistan meteorological department (PMD) has 20 stations consisting of 120 broadband sensors connected to the satellite communication system [
15].
Indonesia, comparatively, is more prone to tsunamis due to active volcanoes. The early warning system for tsunamis in Indonesia consists of tsunami seabed detectors. Research on the advancement in Indonesia’s warning system began in December 2021. The authors in [
16] developed a new system consisting of underwater seismic sensors joined with an ocean unit installed on the seabed and connected to the data center by fiber optic cable. The data center provides power to the sensors. Solar panels are installed to provide energy to the power plant. However, tsunami effects and deaths are still reported even though the system is updated.
In another detection and warning system, the authors in [
17] proposed using low-cost autonomous underwater vehicles that use acoustic signals. Maintenance of the system is also possible. To conserve energy, the vehicles will only be active for listening to tsunami signals. This will require the batteries to recharge after several weeks for less disturbance of the underwater biodiversity. The downside is that the estimated cost of one buoy is USD 1000, which is still expensive when implementing such a model requires more than one buoy.
Different wild and domestic animals can be used for monitoring different kinds of natural hazards and are also useful in early warning of biological attacks. A native animal can be used to monitor the infected area. For example, canaries are sensitive to poisonous gases and react differently, so they are placed in mines to detect harmful gases and help the miners evacuate on time. Similarly, oysters can help detect pollution. They can bioaccumulate chemicals and this high concentration can be helpful in the detection of pollution [
18]. The surveillance using such animals can be both active and passive, where active surveillance is used for control strategies and passive for elimination.
Recent research shows that tsunami warning systems can be classified based on computation or mathematic calculations. Nature-based systems use ecology, such as unexpected behavior and response of animals or plants to the changes in water due to seismic effects [
19]. The authors used datasets of different marine animals and the ensemble clustering technique to categorize this strange behavior. The best result was obtained from turtle datasets [
15].
In our work, datasets were collected from different attributes of turtles [
20]. We used fuzzy-based logic to connect a monitoring system with sensors to predict tsunamis. The attributes are the count of turtles and the angle of deviation or navigation direction. The outcomes of these were classified into three different classes for tsunami warning systems, i.e., (1) alert, (2) pre-alert, and (3) no alert.
Observation of the seafloor in the northwest Pacific has shown that a tsunami creates two phases of magnetic fields. The first one is weak, followed by a strong one due to the coupling with seawater particles [
21]. Electromagnetic fields impact aquatic species, such as turtles, and any abnormality affects the marine animal’s direction. Strong exposure to electromagnetic fields not only decreases the count of turtles but also affects their prey tracking capabilities [
22].
In the next section, we propose our model using the fuzzy logic technique with inputs of the different attributes of turtles, the magnitude of the earthquake and water level, and the magnetic field connected to the sensor networks for early detection. Our proposed model can also maximize the lifetime of sensors and decrease the delay for early warning as shown in
Figure 1.
3. The Proposed Model
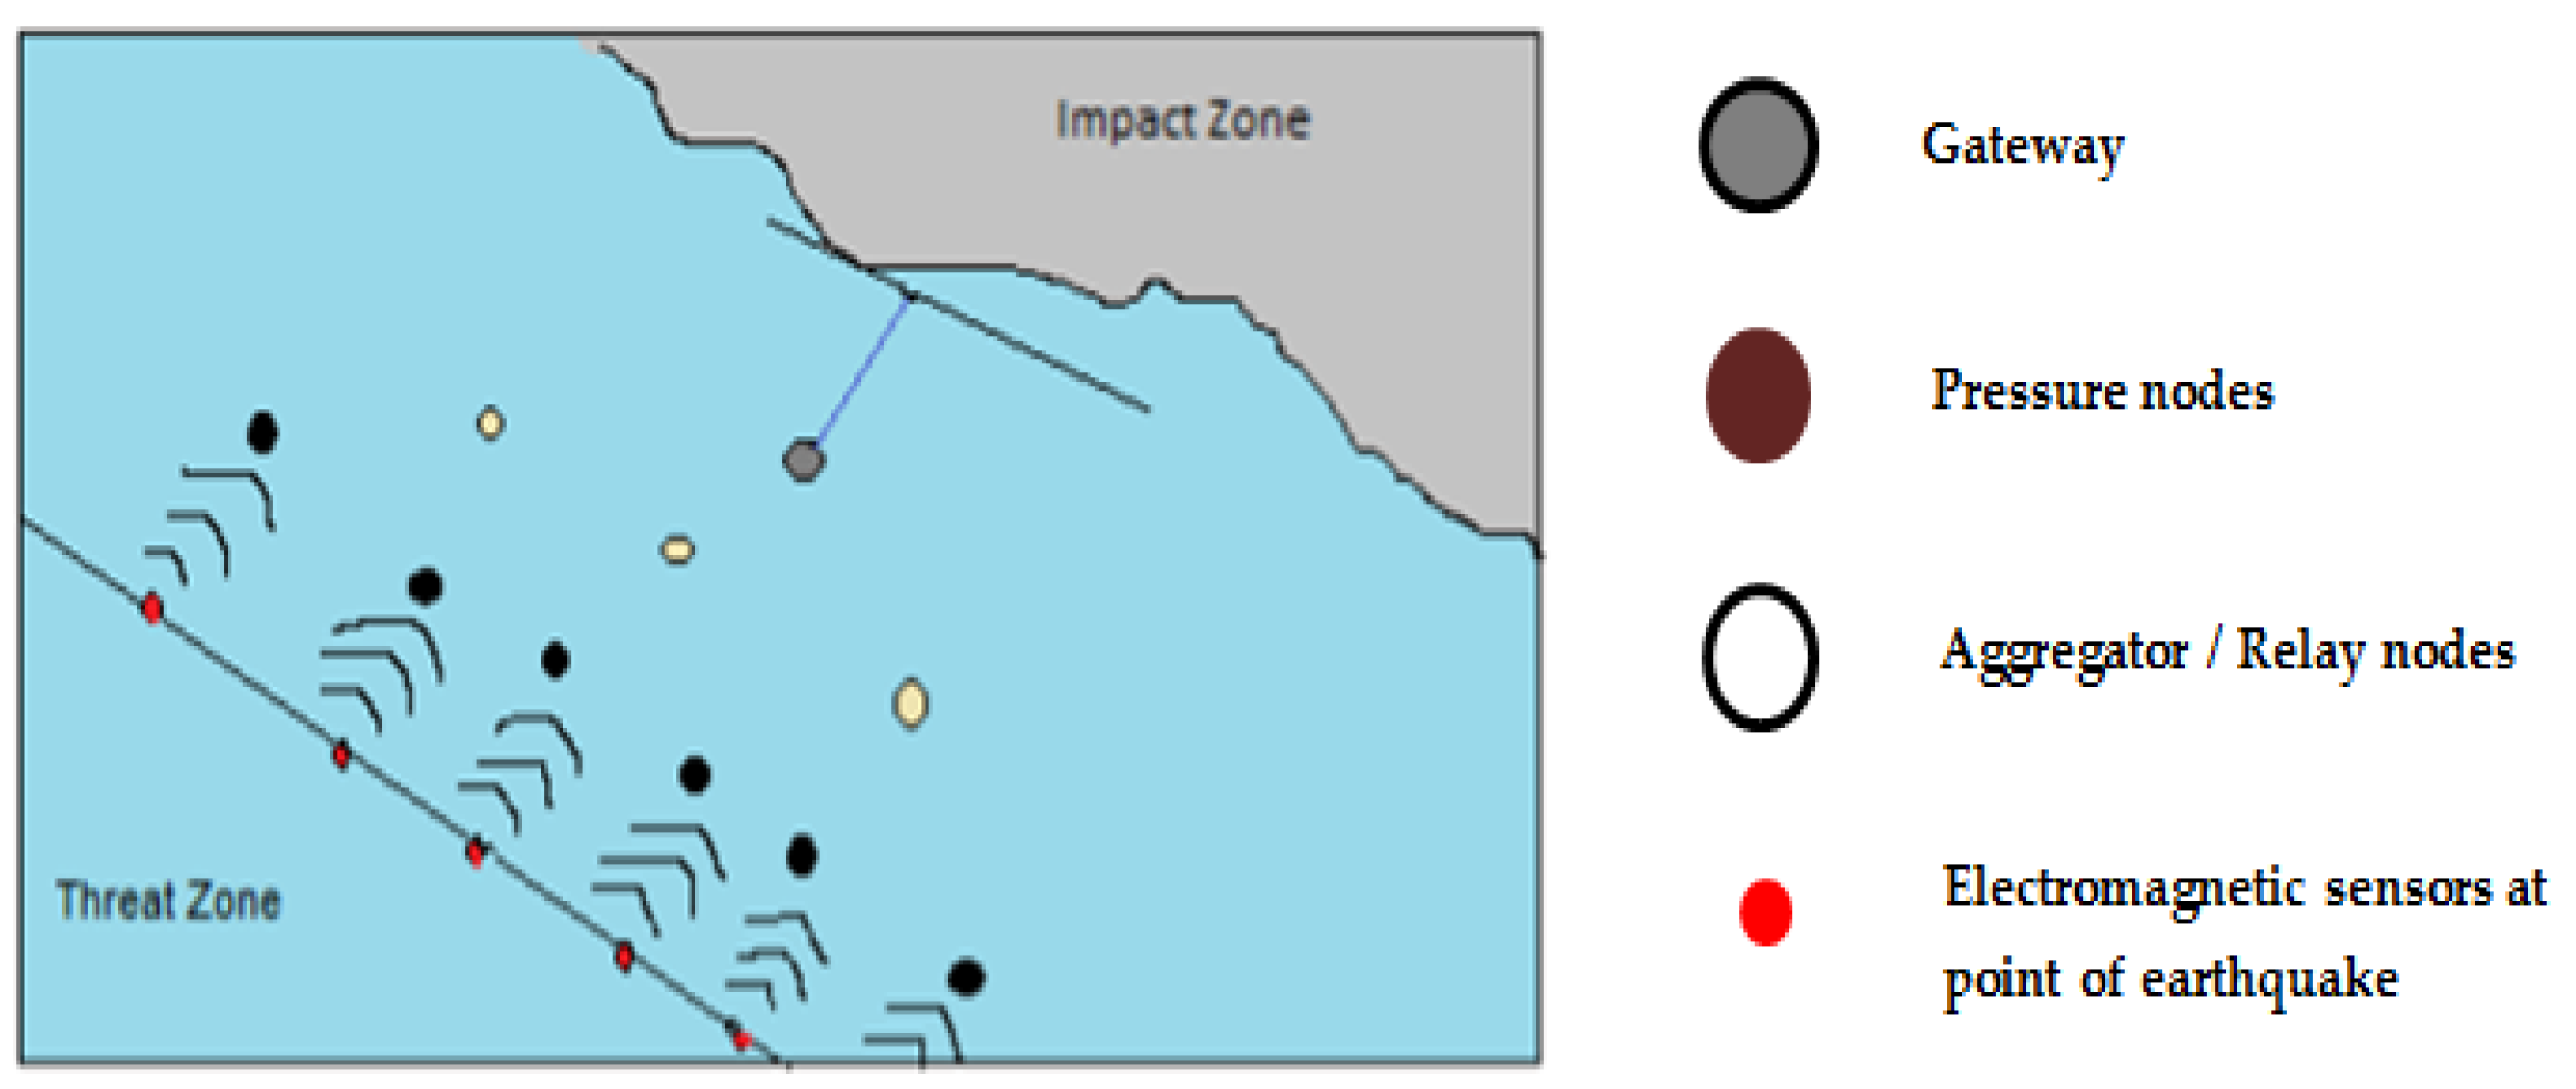
We define the complexity of our proposed system in terms of types and connecting media. The proposed early warning system is designed using electromagnetic sensors, pressure sensors, relay/aggregated sensors, and a gateway connected to the coastal area using fiber optics cable as illustrated in
Figure 1. We used these sensors because they are easy to buy and maintain and can be purchased locally. The model used fiber optic cable for connectivity which is the fastest for data transmission and is easily available. The hardware and software specifications for the proposed model are given in
Table 2.
Sensor nodes are linked in a tree-based structure and a query-driven-based approach is used for data collection. In this approach, data are generated on the occurrence of an event. In our proposed model, the electromagnetic sensors are used at the point of the earthquake, and data are further hopped from these nodes towards gateway node using pressure sensors and aggregator sensors [
23].
The proposed system takes advantage of “no aggregation” and “partial aggregation” concepts. The model is divided into three parts: data collection for the fuzzy logic system to detect a tsunami or No Tsunami state, energy saving through partial data aggregation mode, and the early warning of tsunami through no aggregation.
3.1. Data Collections for Fuzzy Logic System to Detect Tsunami or No Tsunami State
The electromagnetic and pressure sensors are installed on the seabed. The distance between pressure sensors and the coastal area is 15 km. The reason for choosing this distance is based on the fact observed from previous incidents that showed that the minimum earthquake distance was 15–17 km [
24]. The model is based on measuring the effects of electromagnetic fields generated by tsunamis on the behavior of aquatic species, such as turtles. The electromagnetic sensors detect the changes in the electromagnetic field and the effect on the turtle’s count. The values of the turtle’s count and magnetic field are further transmitted to the pressure sensors. Pressure sensors detect the values, such as earthquake magnitude and water level, and feed all these values into the fuzzy logic system for decision making for changing modes of partial aggregation indicating a No Tsunami alert and no aggregation indicating a tsunami alert. For fuzzy input, we considered values of the electromagnetic field and turtle count given in [
20] and real-time values, such as earthquake magnitude and water level from the Global Historical Tsunami database [
25]. Moreover, streaming datasets from IoT devices can also be incorporated in the proposed model with the inclusion of Apache Spark in the proposed framework [
26].
Table 3 explains the selected inputs for our fuzzy system.
Table 4 shows the rules for fuzzy logic and outcome generation.
Figure 2 presents a graphical representation of one of the rules to provide a general understanding. The pseudo-code of the proposed system is presented in Algorithm 1.
| Algorithm 1: The pseudo-code of the proposed system |
| Input c, em, p, w |
| If em ≤ 1 and (c in range 3,8) and p < 3.5 and w < 1 |
| X = “Partial aggregation/No alert” |
| return X; |
| Else if em ≤ 1 and c < 3 and p ≥ 3.5 and w ≥ 1 |
| X = “No aggregation/Tsunami alert” |
| return X; |
| Else if (em ≥ 1 and em ≤ 4) and c < 3 and p ≥ 3.5 and w ≥ 1 |
| X = “No aggregation / Tsunami alert” |
| return X; |
| Else if em ≤ 1 and (c in range 3,8) and p ≥ 3.5 and w ≥ 1 |
| X = “No aggregation/Tsunami alert” |
| return X; |
| Else em ≤ 1 and c < 3 and p ≥ 3.5 and w ≤ 1 |
| X = “Partial aggregation/No alert” |
| return X; |
| End |
3.2. Energy Saving through Partial Data Aggregation Mode
In case of a No Tsunami detection, low seismic activity, or earthquake with low magnitude, the relay nodes will be in full aggregation mode and hence will save the energy of the sensor nodes. For this purpose, the magnitude should be less than 3.5. Data are sent to relay/aggregators, which can relay and aggregate the information. Aggregated data are forwarded to the gateway sensor connected to the coast area with fiber optic cable. It is worth noting that partial aggregation is an effective scheme for minimizing energy consumption and delay compared to other aggregation schemes, such as no aggregation and full aggregation [
27]. The time division multiple access (TDMA) method is used to allocate the time slot for data transmission of each node. Time division multiple access is a well-known technology used in many wired and wireless transmission media. It effectively allocates time to different nodes to send data using the link’s bandwidth.
3.3. Early Warning of Tsunami through No Aggregation
Once the earthquake magnitude increases over the threshold, i.e., 3.5, the relay nodes will change their mode to no aggregation because a tsunami was detected, and they will pass the data immediately to the gateway. The proposed approach will minimize the delay without affecting the efficiency of the early warning system.
3.4. Analysis of the Proposed Model
Figure 3 presents the implementation framework of the proposed model. The proposed model is a revised version of the work presented in an early study [
28], where the researchers presented a rather less expensive model compared to the currently available systems employing underwater buoys, which usually require high maintenance costs [
13]. We revised their work with more focus on the control of energy and delay, the two important factors of event-based sensor networks. The benchmarked model controlled the energy-using relay nodes and focused on an early warning system. However, after analyzing that model, it can be concluded that the sensor will still receive the data in case of no warning detection, hence consuming energy. On the other hand, if energy is controlled, it can increase the chance of delay, which cannot be tolerated in case of an early warning system for a tsunami. The estimated cost of our proposed system is approximately USD 800, which low-income countries can easily afford. Our design also used instruments that can be built within the country itself instead of importing them from developed countries. Our proposed model offers a more optimal solution compared to the benchmarked model due to optimized features and hardware. A detailed comparison of our model with the benchmarked one is given in
Table 5.
4. Results
This section presents the evaluation and comparison of our proposed model. We used MATLAB for implementation and SPSS to evaluate our proposed model. The simulation of the model was performed using the following parameters as shown in
Table 6.
We plotted graphs for the data generated to compare the output of energy and delay and calculated the Pearson coefficient to analyze the results. For each graph, the X-axis shows the number of rounds, which is the complete cycle of our algorithm. We have a total of 50 rounds, so 50 rounds mean it ran 50 times. The Y-axis represents either energy consumption in Joules or the delay measured in milliseconds.
Figure 4 depicts energy consumption during tsunami detection. The diagram indicates a strong positive correlation between the two variables where the increase in the number of rounds increases energy consumption during tsunami detection.
Table 7 contains the results of the Pearson correlation, which indicates the high positive correlation (r = 0.764) between the number of rounds and energy consumption in joules, and the
p-value (
p < 0.01) is evidence of the significant association between the two variables. The criterion for statistical significance is that the result will be significant if the
p-value is less than the level of significance (0.01 or 1%) in this study. So, we can see that the
p-value is (0.001), less than (0.01); hence, there is sufficient evidence of the significant association between the two variables.
Figure 4 portrays the positive correlation between the two variables, the delay in observations during tsunami detection and the number of rounds that increase proportionally during tsunami detection.
Figure 5 shows the positive correlation between the two variables. When the number of rounds increases, the estimated value of delay time also increases during tsunami detection.
In
Table 8, the value of the Pearson correlation (r = 0.951) indicates a strong positive correlation between the two variables, which means that with the increase in the number of rounds, the estimated value of delay also increases, and the
p-value (
p < 0.01) shows a significant association between the two variables.
Figure 5 shows the positive correlation between the two variables: the energy consumption during the No Tsunami alert and the number of rounds.
Figure 6 shows the positive correlation between the two variables. When the number of rounds increases, then the energy consumption also increases during the No Tsunami alert. In
Table 9, the value of the Pearson correlation (r = 0.960) indicates a strong positive correlation between the two variables, which means that with the increase in the number of rounds, the energy consumption in joules also increases, and the
p-value (
p < 0.01) shows a significant association between the two variables. The criterion for statistical significance is that the result will be significant if the
p-value is less than the level of significance (0.01 or 1%) in this study. So, we can see that the
p-value is (0.000), less than (0.01); hence there is sufficient evidence of the significant association between the two variables.
Figure 7 indicates another high positive correlation between two variables: the delay in observations during the No Tsunami alert and the number of rounds increasing proportionally.
In
Table 10, the value of the Pearson correlation (r = 0.935) tells that a strong positive correlation between the two variables exists, which means that with the increase in the number of rounds, the estimated value of delay time during a No Tsunami alert also increases, and the
p-value (
p < 0.01) shows a significant association between the two variables.
4.1. Comparisons of Energies during Tsunami Detection and No Alert
The pattern in
Figure 4 and
Figure 6 indicates that when the number of rounds increases, the energy consumption increases rapidly in case of no aggregation. On the other hand, in the case of partial aggregation, the increase in energy consumption increases with the increase in the number of rounds, but the increasing trend in the case of partial aggregation is less than that of no aggregation.
4.2. Comparisons of Delay during Tsunami Detection and No Alert
The pattern of
Figure 5 and
Figure 7 indicates the upward trend, but for the sake of comparison, if we see the graphs critically, in the case of partial aggregation, when the number of rounds increases, the estimated value of delay time increases rapidly. Moreover, in the case of no aggregation, the estimated value of delay time increases very slowly with the increase of the number of rounds. Hence, an increasing trend is high in the case of partial aggregation compared to no aggregation.
4.3. Comparison of Correlations for Energies
Table 7 and
Table 9 show the values of the Pearson correlation in energy consumption during tsunami detection when there is no aggregation and when there is partial aggregation. The Pearson value is r = 0.764 when there is no aggregation and r = 0.960 when there is partial aggregation, which indicates that the correlation between the number of rounds and energy consumption with no aggregation is highly positive but not very close to a perfect positive correlation. On the other hand, the correlation between the number of rounds and energy consumption with partial aggregation is again highly positive but very close to a perfect positive correlation. Hence, we can say that the correlation between the two variables is higher when there is partial aggregation than the correlation when there is no aggregation.
4.4. Comparison of Correlations for Delay
Table 8 and
Table 10 show the Pearson correlation values of several rounds vs. estimated values of delay time when no aggregation and partial aggregation are r = 0.951 and r = 0.935, respectively. The Pearson value (r = 0.951) shows a strong positive correlation and close to perfect positive correlation between the number of rounds and delay time when there is no aggregation. Similarly, the Pearson value (r = 0.935) indicates a strong positive correlation between two variables with partial aggregation but not as close to a perfect positive correlation as in the no aggregation case. So, we can say that the correlation between two variables is stronger when there is no aggregation compared to partial aggregation.
4.5. Limitation of the Model
The proposed scheme can work for early warning detection of tsunamis because of an earthquake with a specified low and high magnitude. However, the recent Tsunami in Tonga resulted from the erupted volcano, and it presents a new challenge for Tsunami alert and opened many questions in the research world to tackle. The proposed model does not cover any Tsunami which is not a result of an earthquake. Further, due to a lack of permission and the unavailability of deployed sensors and datasets, the impact of the Tsunami on the behavior analysis of marines is still an open area of research.
5. Conclusions
The paper proposed and simulated an economical sensor network fuzzy-based model with capabilities of low energy consumption, early tsunami detection, and data collection. The cost of our model can be further reduced by designing multifunction sensors, thus eliminating the need for different types of sensors, resulting in the most needed economic impact for underdeveloped countries. We also incorporated no aggregation and partial aggregation for optimizing two important factors, i.e., delay and energy. Our fuzzy-logic-based algorithm takes input values, such as electromagnetic field, turtle count, earthquake, and water level, and based on these values, real-time alerts of a tsunami are released, while real-time data are stored in a database for future research.


