Article

Simulation Assessment of Inlet Parameters and Membrane-Surface-Structure Effects on CO2 Absorption Flux in Membrane Contactors

by
Amin Mojarad Garehbagh
1,
Saeid Rajabzadeh
2,3,*,
Mahmoud A. Shouman
4,
Mohamed R. Elmarghany
4,
Mohamed S. Salem
4,
Nasrul Arahman
5,
Toraj Mohammadi
1 and
Hideto Matsuyama
3
1
Centre of Excellence for Membrane Science and Technology, Department of Chemical, Petroleum and Gas Engineering, Iran University of Science and Technology (IUST), Narmak, Tehran 16846-13114, Iran
2
School of Civil and Environmental Engineering, University of Technology Sydney (UTS), City Campus, Broadway, NSW 2007, Australia
3
Research Center for Membrane and Film Technology, Department of Chemical Science and Engineering, Kobe University, Rokkodaicho 1-1, Nada, Kobe 657-8501, Japan
4
Mechanical Power Engineering Department, Faculty of Engineering, Mansoura University, Mansoura 35516, Egypt
5
Department of Chemical Engineering, Universitas Syiah Kuala, Banda Aceh 23111, Indonesia
*
Author to whom correspondence should be addressed.
Sustainability 2022, 14(21), 14527; https://doi.org/10.3390/su142114527
Submission received: 26 September 2022 / Revised: 12 October 2022 / Accepted: 31 October 2022 / Published: 4 November 2022

Abstract

:
The management of global carbon dioxide (CO2) emissions is considered one of the main environmental problems facing the modern world. One of the potential techniques for CO2 capture is absorption, using membrane contactor modules. Most of the previous research that dealt with membrane contactor simulations considered the whole membrane surface as the active reaction surface. However, in this paper, a more realistic model of the membrane-contactor module is presented, taking into account the effects of the pore size and surface porosity. CO2 absorption into the monoethanolamine (MEA) solution in hollow fiber membrane-contactor modules was numerically investigated. A computational fluid dynamics simulation was established using essential basic fluid dynamics and mass transfer equations in reactive mode. An algorithmic function was used to present the relations between the CO2 absorption flux and the hollow fiber length, membrane surface pore size, and porosity. The simulation results were compared to previously obtained experimental results without using any fitting parameters, and a good agreement was found with an average error of 8.5%. The validated simulation was then used to predict the effects of the MEA inlet velocity and concentration, the membrane surface pore size, and porosity on the total CO2 absorption flux. A maximum absorption flux of about 1.8 mol/m2·s was achieved at an MEA concentration of 4 M with a pore size of 0.2 microns, a surface porosity of 1%, and an inlet velocity of 0.25 m/s. The extrapolation technique was then used to predict the values of the absorption flux at longer fiber lengths. The concentration profiles around the pores at the gas–liquid contact surface of the membrane were obtained and presented. The proposed model exhibited excellent potential to evaluate the effective reaction surface in hollow fiber membrane contactors. This model could be considered the first step to obtaining accurate predictions of the membrane contactor gas absorption performance based on its surface structure.

1. Introduction

In recent decades, the development of industrial activities has increased greenhouse gas concentration in the atmosphere, including carbon dioxide (CO2). Increased CO2 emissions are significant contributors to catastrophic environmental changes. Carbon dioxide gas contributes to around 55% of the observed global warming [1]. This vital issue sparked interest in CO2 capture [2]. Hollow fiber membrane contactor (HFMC) technology is a potential candidate for greenhouse gases (especially CO2) abatement. It has considerable advantages over conventional CO2 recovery techniques [1,3,4]. In HFMC modules, the membrane lumen, bulk, and module shell enable direct contact between gas and liquid phases without the dispersion of one phase into the other. While acid gases flow on one side of the membrane, filling the membrane bulk structure to reach the other side, absorbent liquid flows on the other surface of the membrane. Tiny liquid–gas interfaces are formed in the openings of the pores adjacent to the absorbent liquid. It is a crucial point in the gas–liquid contacting process to avoid entering absorbent liquid into the membrane pores. This phenomenon is known as wetting in HFMC, and it sharply and strongly decreases the module performance [5].
Yan et al. [6] compared the performance of several chemical and physical absorbents and concluded that chemical absorbents have better performance because of their higher absorption rate due to their fast reaction with CO2. Several kinds of chemicals were used to absorb CO2 in the liquid phase, including organic and inorganic bases [7,8,9,10,11,12]. Among the reported chemical absorbents, different types were used. The amine solutions exhibited fast reaction rates, resulting in a higher CO2 absorption flux, minor damage to the membrane structure, and less toxicity and safety issues [7,11]. Monoethanolamine (MEA) solution was widely used in HFMC processes with considerable reported advantages. According to previous investigations, MEA exhibited higher CO2 removal performance, compared to other absorbents, such as sodium hydroxide (NaOH), triethanolamine (TEA), diethanolamine (DEA), and 2-amino-2-methyl-1-propanol (AMP) [8,10].
CO2 capture techniques were previously investigated, taking into account various parameters, such as solvent absorption, pressure, and temperature-swing adsorption in the presence of a variety of solid sorbents, membranes, and cryogenic distillation [13]. Using MEA as a liquid absorbent showed high potential as a technique for carbon capture. On the other hand, with the development in the production of ceramic and metallic membranes, effective membranes could be fabricated with significantly effective separation, compared to the liquid absorption technique. A study was held to investigate the feasibility of using membrane-based carbon capture technology compared to the amine-based absorption technique [14]. The study compared the use of three plants: two of them use amine liquid absorption, and the third is a membrane-based plant. The latter showed high potential compared to the other two. A CO2 avoided cost, which is an economic indicator to estimate the additional cost of processing the carbon capture facility, of 46 USD/tons was established using a membrane-based plant compared to 58 and 71 USD/tons exhibited by the other two plants. The merits of membrane-based plants may include compactness, as membranes may provide 1000 times more interfacial area per unit volume compared to absorption–adsorption processes [2]. Other advantages are modularity, ease of installation, flexibility, lower cost with lesser energy consumption, and fewer chemical requirements [15,16].
Kreulen et al. [17,18] established that a very thin layer covers the membrane contactor surface, and a gas–liquid reaction occurs at this thin film layer at the mouth of the pores. The thin film gas-absorbed layer theory is dominated by physical absorption, even for very low porosity membranes. Even in the cases of membranes with very low surface porosity (<3%) and pore size of 5 nm, when water was used as the absorbent liquid (physical absorption), the membrane surface pore size and porosity had little to no effect on the gas absorption flux. Therefore, this assumption was used in most gas–liquid membrane contacting simulations. Although the membrane surface pore size and porosity effects were very well evaluated for physical gas absorption by Kreulen et al. [18], no such evaluation was performed for chemical absorption processes. While the effects of membrane surface pore size and porosity on the performance of the membranes used in liquid filtration are very well studied in many studies [19,20], this effect is still not clear for gas absorption processes, and more evaluation is still needed. In our previous studies [21,22], we considered that all membrane surfaces were active for the reaction based on the aforementioned studies [17,18]. According to our previous studies, at high MEA concentrations (higher than 2 mol/L and especially for 4 mol/L) and low porosity membranes, the assumption of a thin film of a saturated MEA layer at the reaction interface was found to be lacking. Simulation results considerably deviated from the experimental results. Comite et al. [23] observed a very similar trend when they used a membrane with a high porosity of 60%. Although they considered the effect of amine reaction products on the CO2 absorption flux, the effects of the membrane surface porosity and pore size were also neglected.
In this study, we systematically considered the membrane surface porosity and pore size effects on the CO2 gas absorption flux. In previously reported papers, all the membrane surfaces were considered active areas for reaction. In the current study, we tried to fulfill the gas–liquid membrane contacting simulation without considering the assumption of covering thin film over the pores. Our simulation results, without using any fitting parameters, show that at high MEA concentration, membrane surface pore size and porosity play key roles in determining the absorption flux. Simulation results were compared with experimental results obtained in our previous study [21,22]. The agreement between the simulation and experimental results was satisfactory.

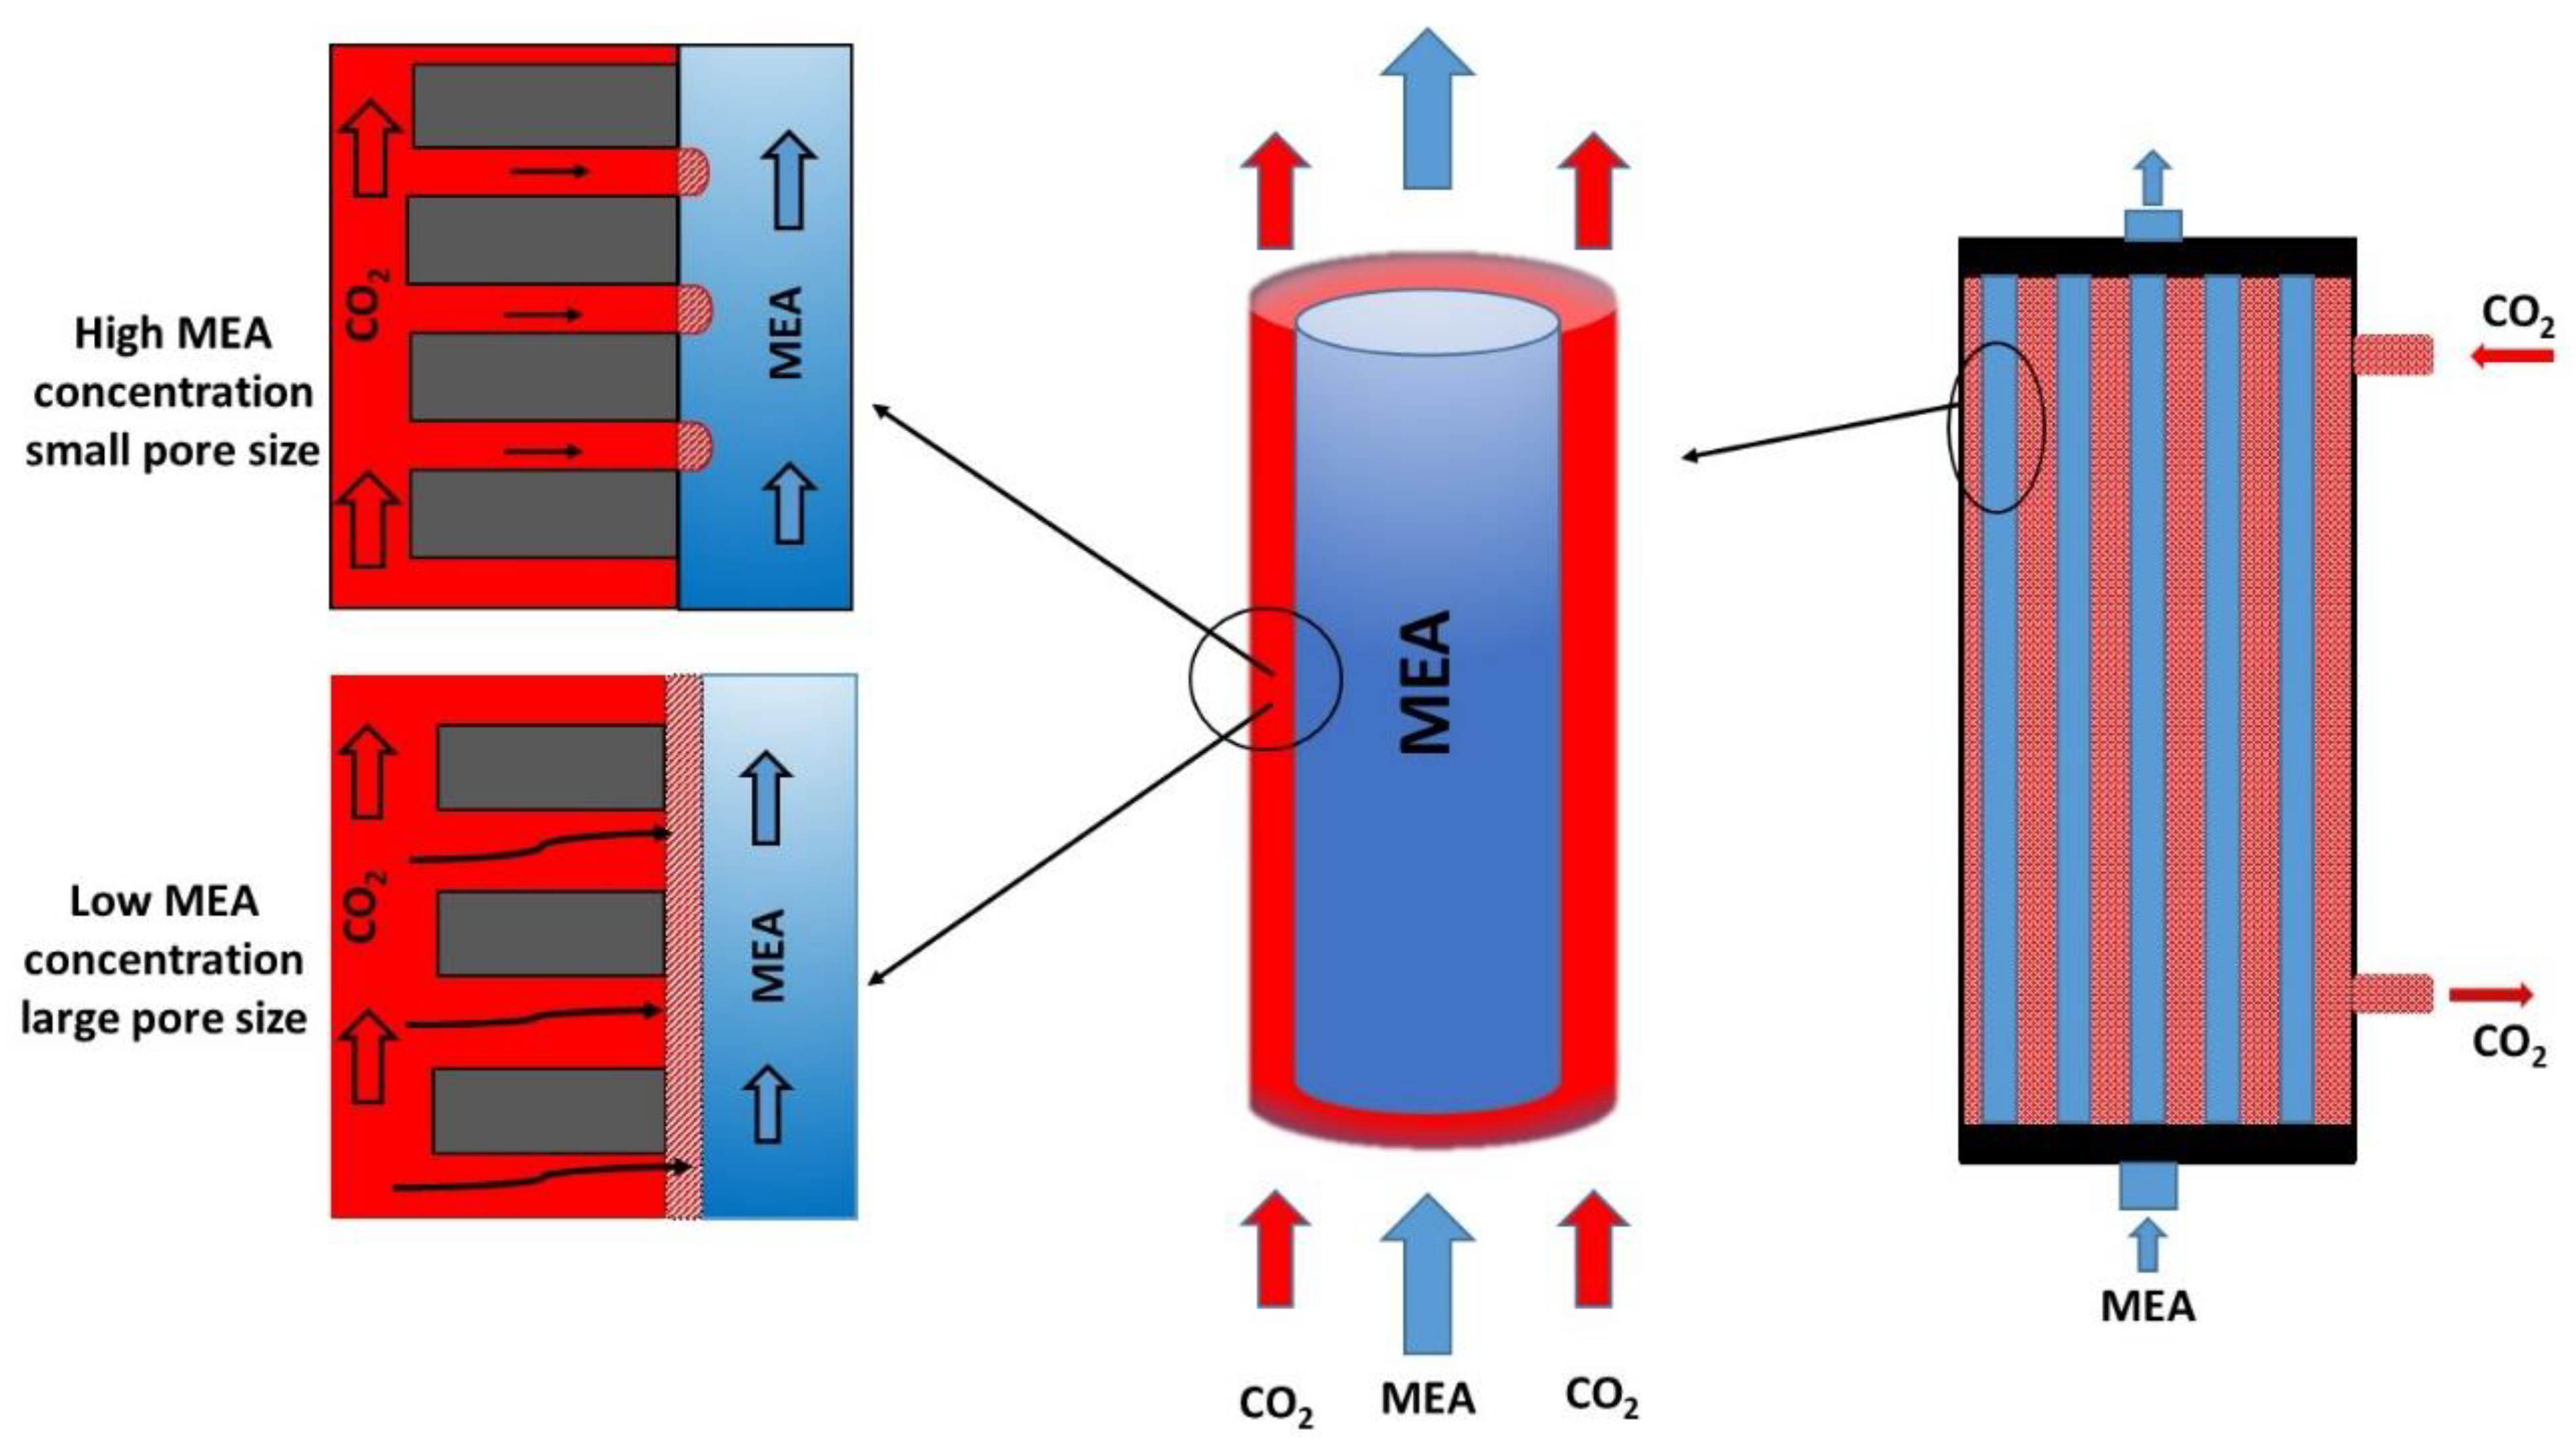
2. Computational Fluid Dynamics (CFD) Simulation in Reactive Mode

In this study, a 3D model was established using the commercial software package COMSOL Multiphysics 5.4 to assess the effects of the membrane surface pore size and porosity on the CO2 absorption into MEA solution. Since many experimental and simulation studies [23,24,25] were performed on CO2 absorption into the MEA solution, this system was selected for more reliable access to the established physical properties and previous experimental results published, including the authors’ [22]. This led to more dependable simulation results with less deviation from the experimental data. Generally, an HFMC configuration usually comprises several hollow fibers, each performing independently. Therefore, investigating a single fiber performance can be sufficient to predict the performance of the whole HFMC module [23,24,26,27]. The proposed model is based on the assumption of non-wetted mode, where the CO2 gas completely fills the membrane pores. In this model, the CO2 was fed into the shell side of the HFMC, while the MEA solution went through the lumen. Due to the non-wetted assumption, the contact between the two fluids only occurred over the membrane pores surface within the lumen side, as shown in Figure 1 and Figure 2. In the simulation, the CO2 was transported from the shell to the lumen side through tiny cylinders representing the membrane pores. The effects of the membrane surface pore size and porosity on the CO2 absorption flux at the interface of the MEA and CO2 were numerically evaluated.

2.1. Simulation Assumptions

The main simulation assumptions are summarized as follows:
-
Feed gas on the shell side is pure CO2 to simplify the mass transfer resistance on the gas side. Otherwise, gas phase resistance becomes important, and the whole membrane with tortuosity and pore size should be considered, which is practically impossible to run, even with a supercomputer.
-
Laminar and a steady-state hydrodynamically fully developed MEA solution is considered for feed flow. Although this assumption might not be ideal for the entrance length, it is the most suitable assumption. Otherwise, it would take too much processing time and power without much change in results.
-
Isothermal feed flow all over the module.
-
A very smooth wall (no-slip condition at the wall).
-
Gravity effects are neglected in this simulation as evident in previous studies [28,29,30].
-
Henry’s law was applied to calculate the CO2 concentration at the interface of the gas–liquid contact at the mouth of the pores (i.e., thermodynamic equilibrium state).
-
The non-wetted mode was assumed, indicating that the pores are filled with CO2 with no absorbent entry into the pores.
-
The reaction between CO2 and the MEA is very fast (instantaneous), as the reaction parameters satisfied the instantaneous reaction regime conditions, as can be seen in [22].
-
Axis symmetry condition is assumed at the hollow fiber axis.

2.2. Governing Equations

Based on the previous assumptions, the steady-state material balance equations can be expressed as follows [18]:
D C O 2 ( 2 C C O 2 r 2 + 1 r C C O 2 r ) u z C C O 2 z k   C C O 2 C M E A = 0
D M E A ( 2 C M E A r 2 + 1 r C M E A r ) u z C M E A z 2   k   C C O 2 C M E A = 0
where D   presents the species diffusivity (m2/s), C   is the species concentration (mole/m3), and k is the reaction rate coefficient [m3/mol·s]. The CO2 concentration (mol/m3) inside the absorbent at the pores surfaces mouths is calculated by Equation (3):
C C O 2 = P C O 2   · H C O 2
where P   represents the CO2 pressure (atm), and H is Henry’s constant (mol/m3·atm).
The velocity distribution for the MEA, u ( r ) , can be estimated as a flow in a circular pipe using Equation (4) [31].
u ( r ) = u m a x ( 1 ( r R ) 2 )
where r is the radius (m), R is the fiber inner radius (m), and u m a x (m/s) is the maximum liquid velocity in the membrane lumen, which can be obtained by dividing the liquid flow rate by the area of the lumen of the HFMC.
The reaction between the gas and the MEA, which is assumed to occur at the lumen side and be instantaneous, can be expressed using Equation (5). The reaction rate constant of the reaction reported by Hikita et al. [32] was used in the simulation (5.92 m3/mol. s at 25 °C):
CO 2 + 2 RNH 2     RNHCOO +   RNH + 3  
r a t e = d C C O 2 d t = ( 1 2 ) ( d C M E A d t ) = k   C C O 2 C M E A
Table 1 summarizes the different physical properties that are used in this simulation, considering the effect of amine products on the physical properties of the MEA solution [22].
The CO2 absorption flux ( J ) (mol/m2. s) can be estimated using Equation (7) [25], assuming instantaneous reaction, thus no CO2 in the MEA outflow.
J CO 2 = 1 2 π R L 1 2 0 R 2 π r u ( r ) C M E A i n l e t     C M E A i n t e r f a c e ( r ) z = L d r + 2 0 R 2 π r u ( r ) C co 2 i n t e r f a c e ( r ) z = L d r
For the simulation, the following boundary conditions were used:
-
Zero CO2 concentration is assumed at the hollow fiber inlet with the MEA concentration equal to the feed concentration.
-
CO2 concentration is calculated using Equation (3) with no MEA flux at the pore mouths.
-
Outflow condition is also considered at the fiber outlet.
-
The rest of the membrane surfaces are considered walls with no-slip conditions.

2.3. Simulation Time Reduction

Firstly, to reduce the simulation time while maintaining an acceptable level of accuracy, several cuts of hollow fiber were created with different angles, as shown in Figure 3. The chosen angles were 90°, 45°, 27°, 9°, and 2.5°. Additionally, several fiber lengths ranging from 100 microns up to 7200 microns were investigated. As described in Table 2, HFMC absorption flux with a very short length was calculated to evaluate the effect of cutting angle. Later on, calculations for longer lengths of the HFMC were performed, and the results were extrapolated for the full length of the fiber. The extrapolated results were then compared to the experimental results as will be shown in the following section of the manuscript. The main used input parameters are summarized in Table 3. The absorption flux was estimated for each case and is shown in Table 3.
As shown in Table 3, the hollow fiber cutting angle seems to have a negligible effect on the CO2 absorption flux simulated values at different lengths, with a maximum error of about 0.8%. Therefore, a 2.5° angle was used to expedite the simulation process. The results were extended over the whole fiber to decrease the simulation time. As it is clear from Table 3, the CO2 absorption flux is extraordinarily high at the entrance of the membrane, and it sharply decreases by increasing the membrane length. This is because, at the entrance, no layer was yet formed across the membrane surface to decrease the diffusion rate, hence decreasing the flux.

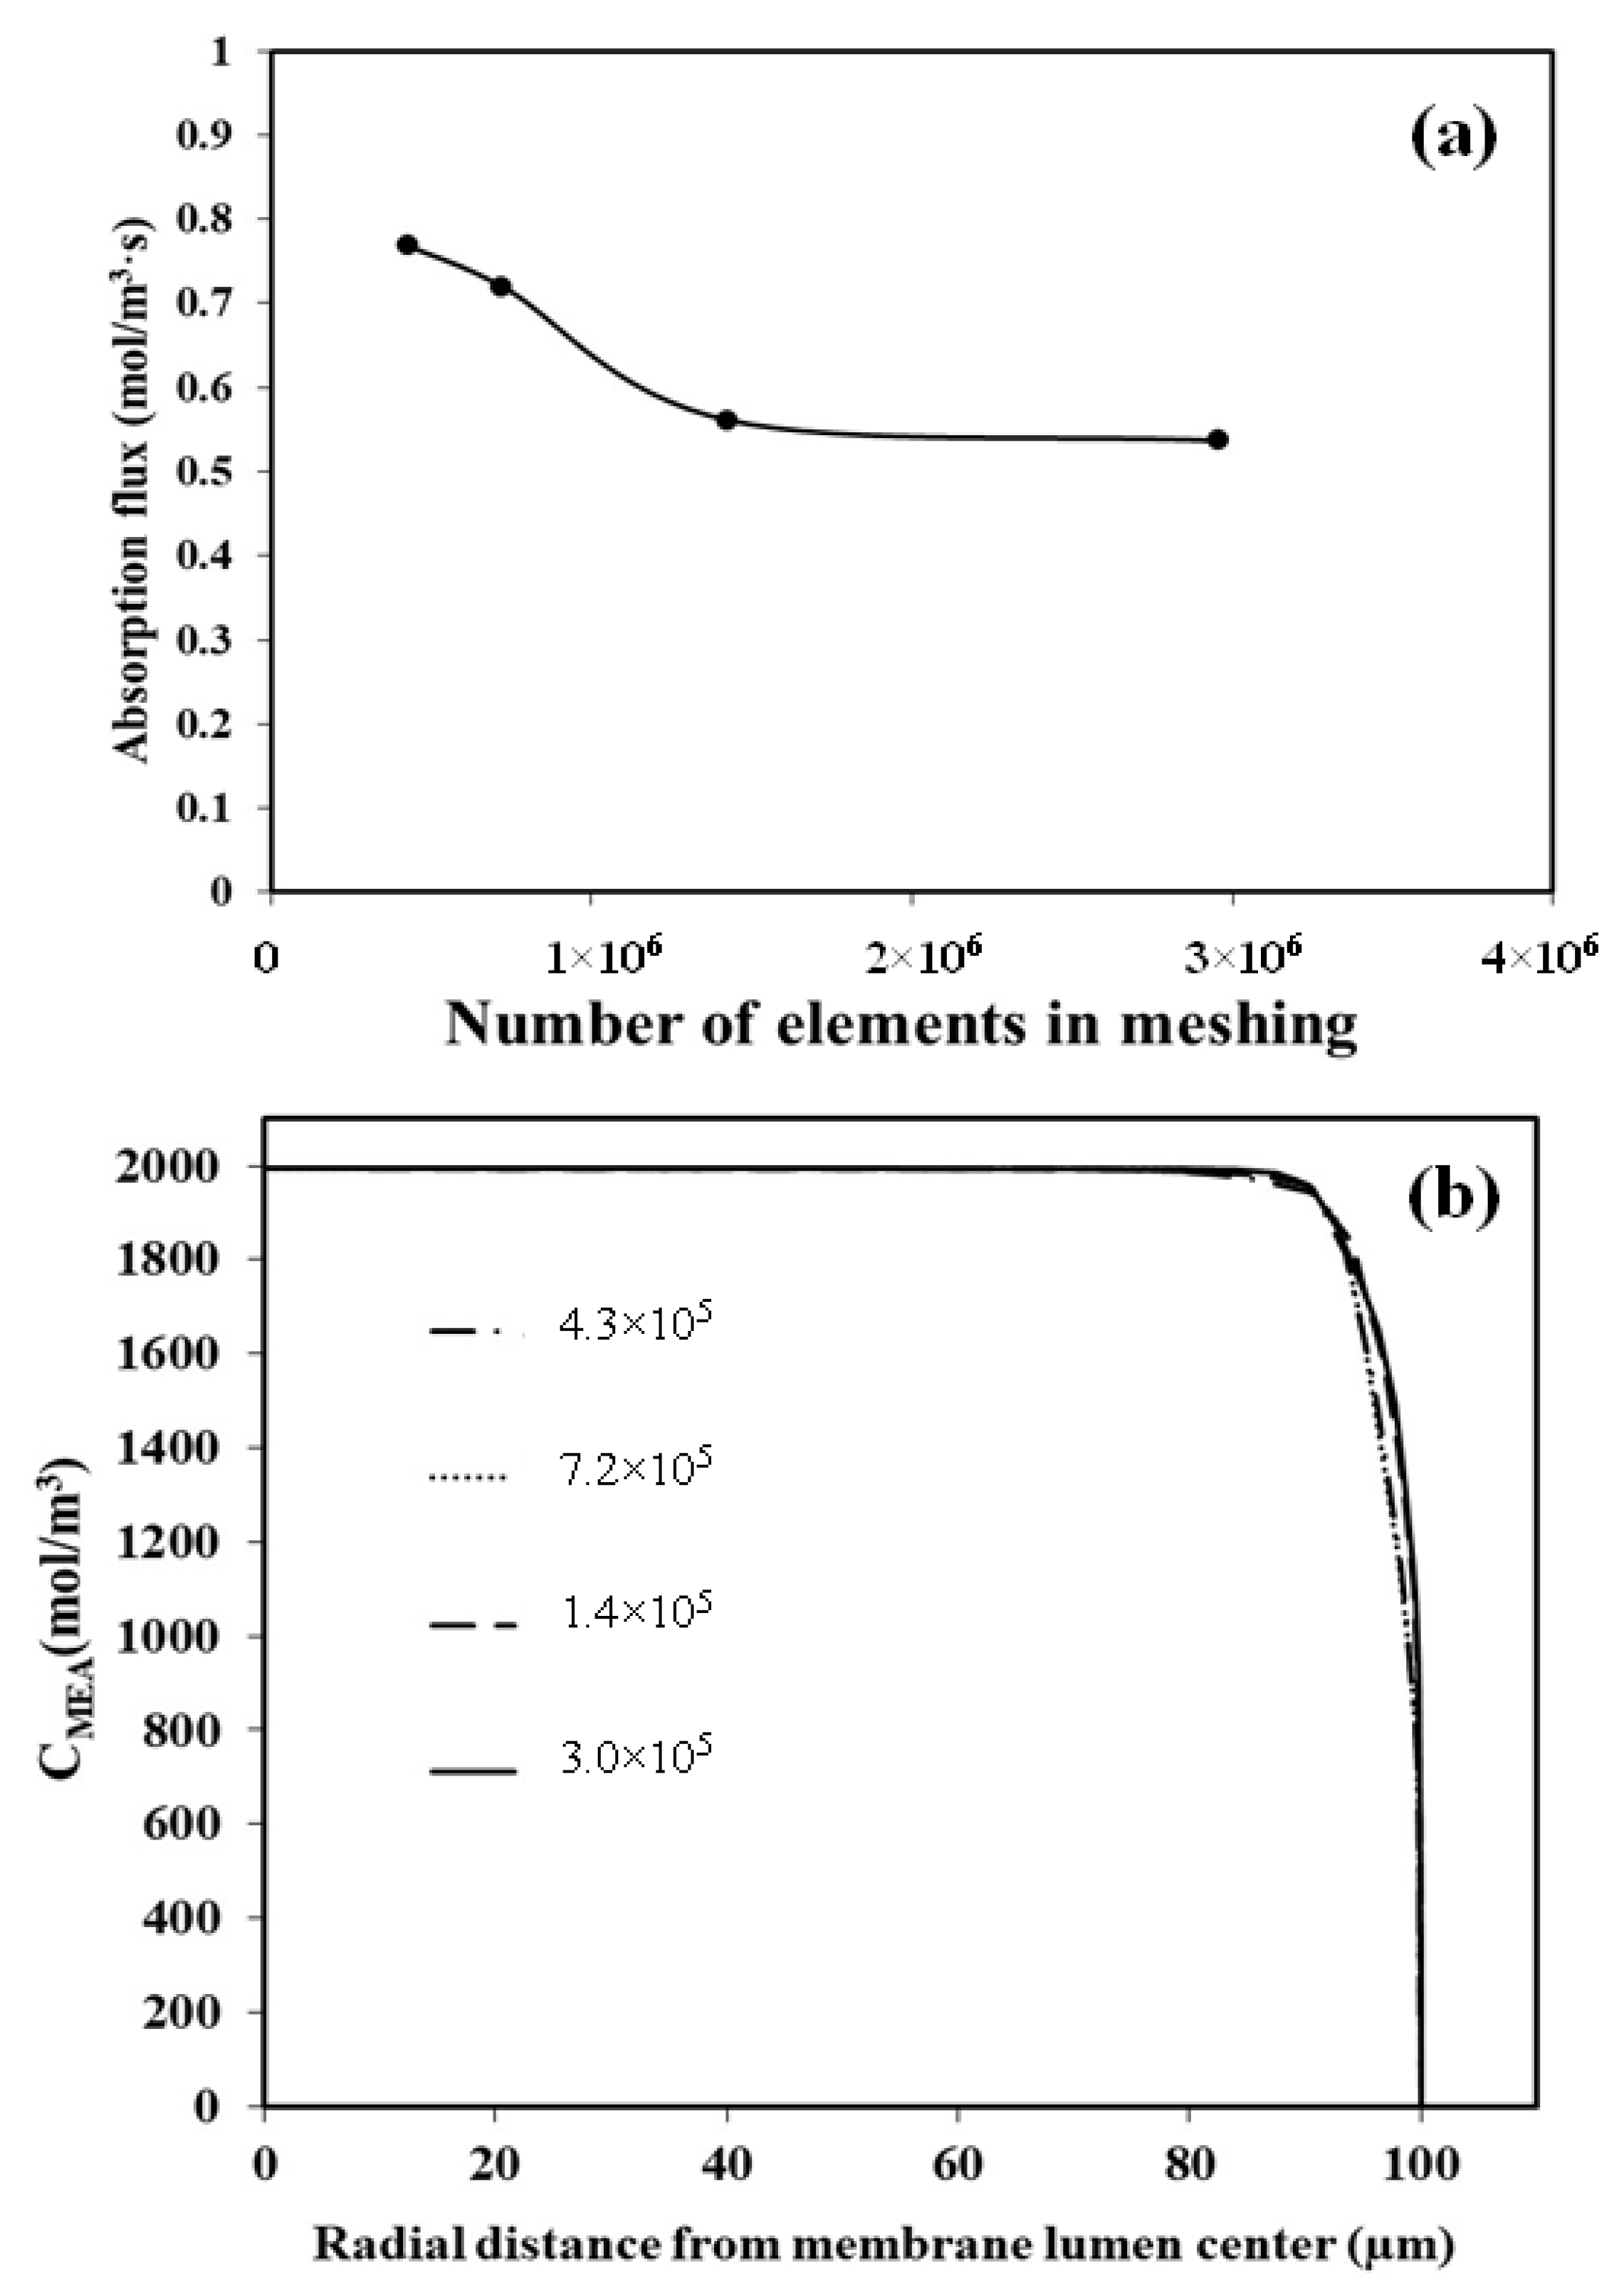
2.4. Mesh Dependency Test

A mesh dependency test was performed to determine the proper mesh size for the required simulation. Four fibers with a length of 1 mm and 2.5° cut and different mesh sizes from 430,327 elements to 2,958,891 elements were investigated. The absorption flux and MEA concentration profile at the fiber outlet were estimated for each case. The mesh dependency test results are shown in Figure 4. Considering the absorption flux (Figure 4a), the error between the mesh with 1,427,212 elements and the finer mesh with 2,958,891 elements is about 4.5%. Therefore, this mesh size (1,427,212 elements) was chosen for completing the results, thus allowing for faster calculations while maintaining reasonable accuracy. The difference in the MEA profile for different mesh sizes was completely negligible for all mesh sizes as shown in Figure 4b. Although not shown here, the MEA concentration profile in this study is very similar to our previous MEA concentration profile [22].

3. Results and Discussion

3.1. Simulation Validation

Instead of actually simulating the absorption flux in the full length of the hollow fiber, which would have needed too many calculations, memory, computing power, and time, another approach was chosen to estimate the CO2 absorption flux. The absorption flux of several hollow fibers with different short lengths was calculated. Then, the calculated CO2 absorption flux was used to calculate the coefficients of a mathematical function that could be used to present the relation between the actual hollow fiber length in the experimental condition and the calculated absorption flux. This function was then used to extrapolate the absorption flux of the actual length, and the estimated results were then compared to experimental results in our previous studies. The simulation results of the absorption flux at different fiber lengths for different MEA concentrations are shown in Figure 5. By increasing the fiber length, the CO2 absorption flux was noticed to sharply decrease at first, and then its change became almost flat. We think the initial extraordinarily high CO2 absorption flux is due to the non-fully developed MEA concentration boundary layer at the membrane entrance. By increasing the length, the flow regime became fully developed, and the concentration boundary layer formed, thus decreasing the CO2 contact with a fresh, non-saturated MEA solution. Subsequently, the CO2 absorption flux sharply decreased. Based on the results in Figure 5, for more than 1000 µm of the hollow fiber length, the trend of the CO2 absorption flux becomes almost linear in the logarithmic figure. The trendline for the relationship between the fiber length and the absorption fluxes was noticed to be similar to an algorithmic relation (y = A + B * ln(x)). Thus, the curve-fitting technique was used to estimate the function coefficients A and B values at different MEA concentrations. These values were calculated and are tabulated in Table 4.
Kumar et al. [26] found that when a physical absorption was applied for HFMC, by increasing the absorbent inlet velocity from 0.1 to 0.5 m/s, the effect of the membrane length on the local CO2 absorption flux decreased sharply. At an inlet velocity of 0.5 m/s, no considerable change was noticed in the local CO2 absorption flux over the length of the HFMC. It was reported by Shirazian et al. [12] that when a fast reaction occurs between CO2 and the chemical absorbent, the CO2 removal efficiency does not change with the membrane length very much. By decreasing the reaction rate, the membrane length effect becomes considerable. Since MEA was used for CO2 absorption in our study, and the reaction rate for CO2 in MEA is instantaneous, extrapolating the CO2 absorption flux over the hollow fiber membrane length looks reasonable. Although not shown here, as it is still under current investigation, the calculation time and memory were considerably decreased when a different software was used to make the HFMC simulation, and the results were then exported to Comsol. Then, we were able to extend our calculation to nearly 15 cm length of the fiber (15 times longer than the current calculation). The new simulation and calculation results showed similar results to the current calculation and extrapolation that was performed here with less than 8% error.
Using the estimated relation, the absorption flux was estimated under the same conditions as the previous experimental results, and the simulation results were compared to the actual experimental results of Rajabzadeh et al. [22]. The comparison results are shown in Figure 6. The simulation results show an acceptable agreement with the experimental results in all ranges of the studied MEA concentration, with a maximum error of less than 20%, which validates the proposed simulation. This agreement becomes clearer at high MEA concentration (4 mol/L). Comparing our current calculation with that of the calculation we performed in our previous work with all surfaces as active layers available for reaction shows that the current calculation considering the pore size and porosity shows much better agreement with experimental results. Thus, it can be concluded that the simulation and the curve fitting techniques used could estimate the CO2 absorption flux of the membrane contactor with an acceptable degree of accuracy. It is worth mentioning that the effect of the amine reaction products is already included in our previous simulation. Therefore, we firmly believe that changing the CO2 absorption flux, especially at a high MEA concentration (4 mol/L), is related to the effect of membrane surface porosity.
Figure 7 shows the CO2 concentration distribution contours over the membrane pores at two different MEA concentrations of 1 and 4 mol/L. It is noteworthy that by increasing the absorbent concentration, the CO2 concentration around the pores decreases. It approaches the saturation concentration just at the mouth of the pores, and the chance for CO2 to diffuse around the pores sharply decreases. This is because the reaction rate of the MEA with CO2 considerably increases. On the other hand, at low MEA concentrations, the CO2 finds the chance to diffuse around the pores. Therefore, there is a chance to make a saturated CO2-absorbed layer over the pores which covers the membrane surface, thus making the membrane structure effect negligible.

3.2. Effect of Average Absorbent Velocity

In order to further verify our developed simulation, we tried to compare our simulation results with that of the experimental results [22] when the average absorbent velocity is changed. The results are shown in Figure 8. As can be clearly seen, the simulation results are in good agreement with the experimental results. Hence, this confirms the ability of the simulation and extrapolating techniques to estimate the CO2 absorption flux of the membrane contactor with an acceptable degree of accuracy.
Figure 9 presents the CO2 concentration distribution contours over the membrane pores at two different inlet absorbent velocities. As can be seen, by increasing the absorbent flow rate, the CO2 concentration around the pores decreases. The CO2 concentration approaches the saturation concentration just at the mouth of the pores, and the chance for CO2 to diffuse around the pores decreases sharply. By increasing the absorbent velocity, the thickness of the concentration boundary layer of MEA at the membrane surface decreases, and the CO2 reaction rate increases since the chance of contacting CO2 with fresh MEA increases. Contrary to the high absorbent average velocity, CO2 finds the chance to diffuse slightly more around the pores at a low absorbent velocity. This condition increases the chance of making a saturated CO2-absorbed layer on the pores covering the membrane surface, decreasing the effect of the membrane structure. However, this effect is not as clear as changing the absorbent concentration.

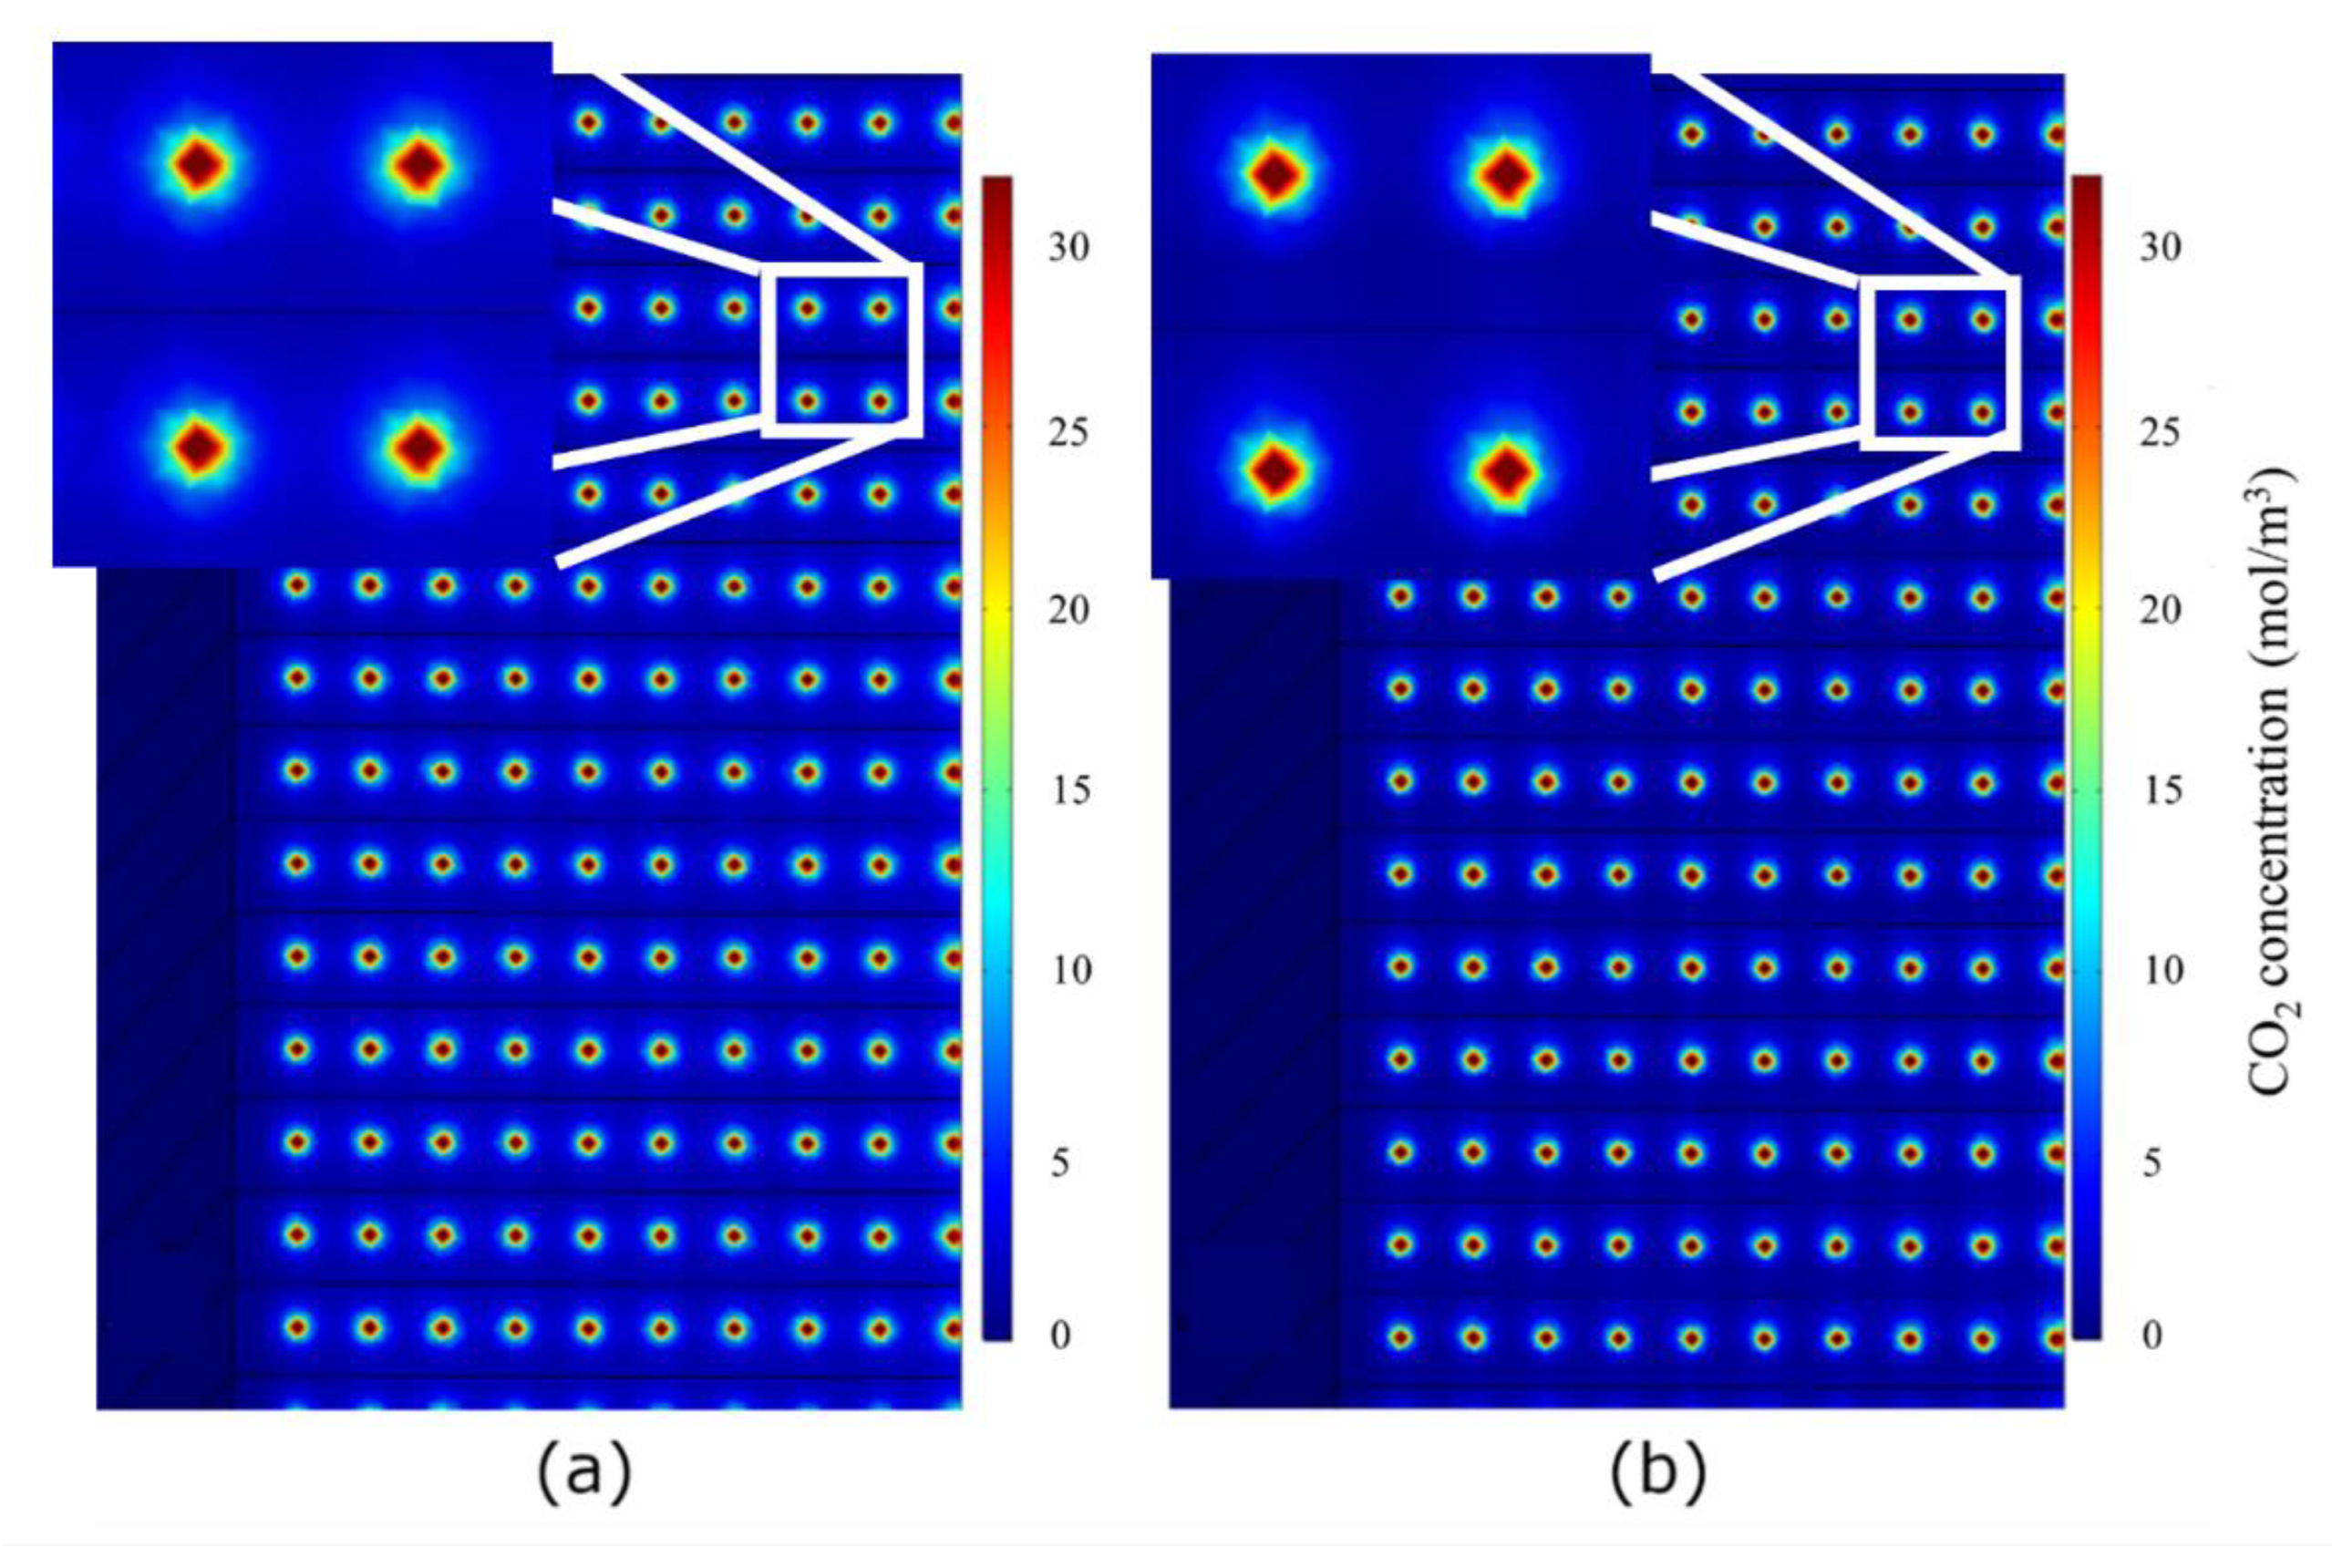
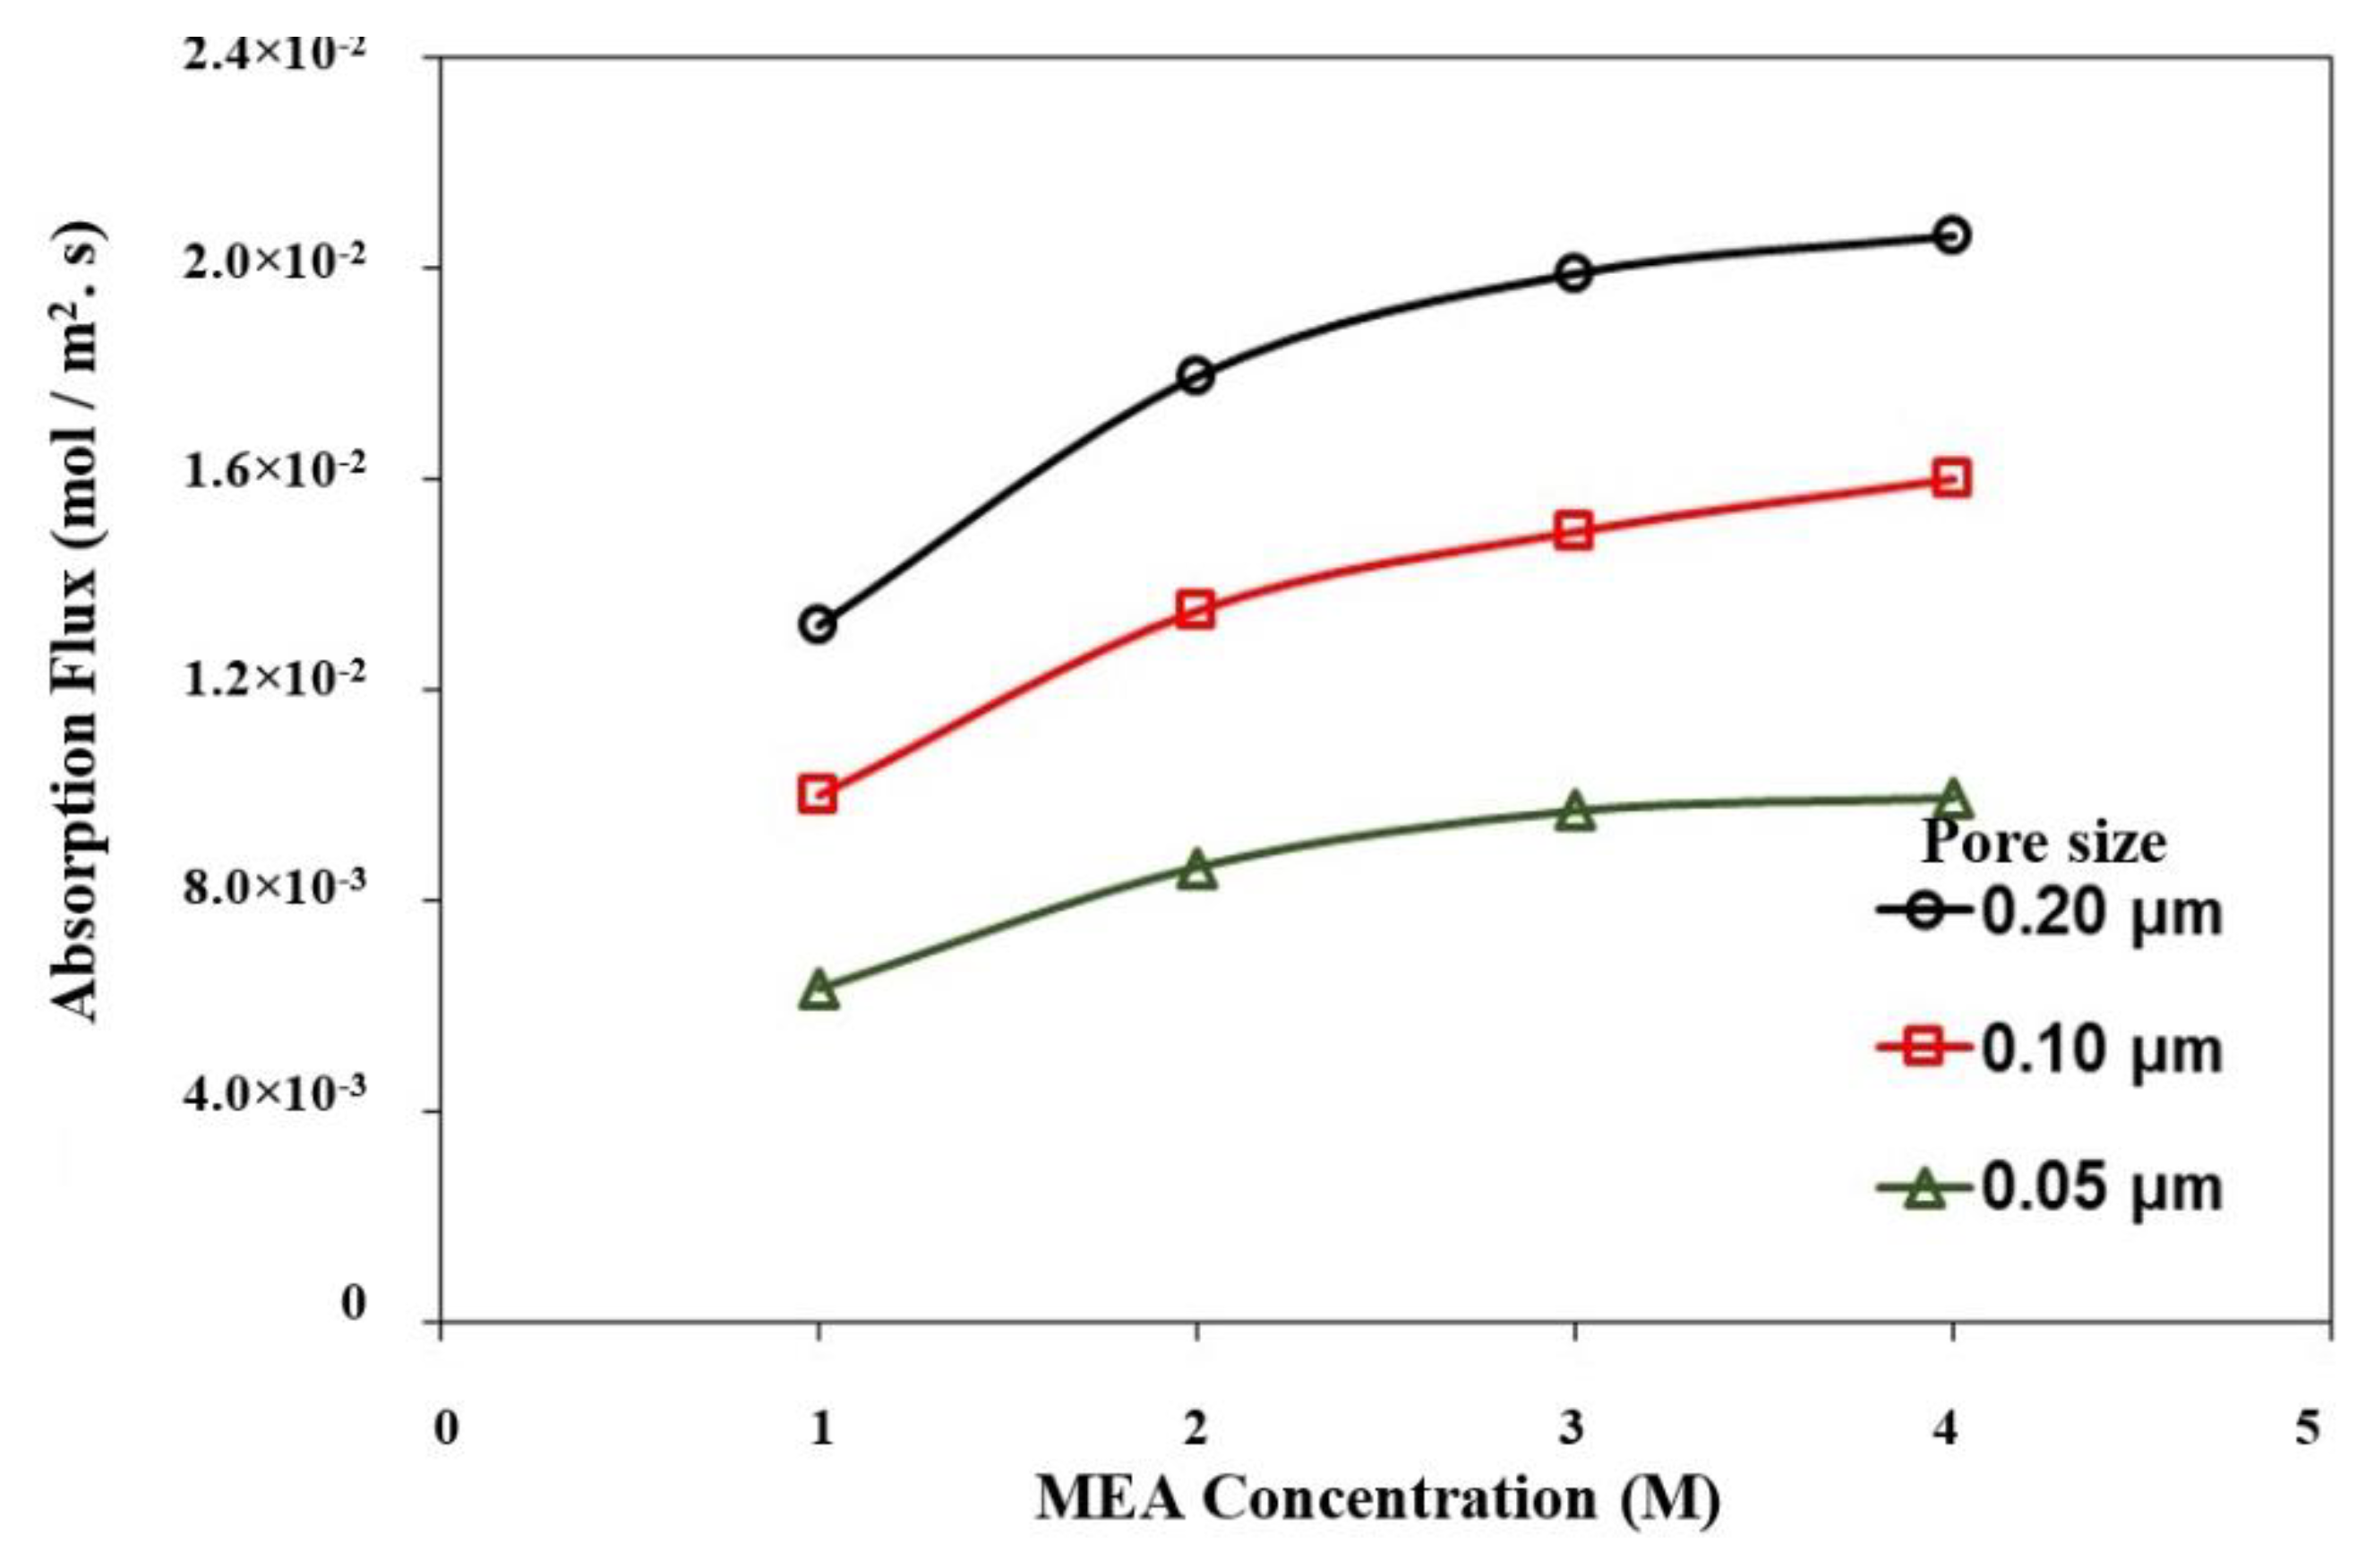
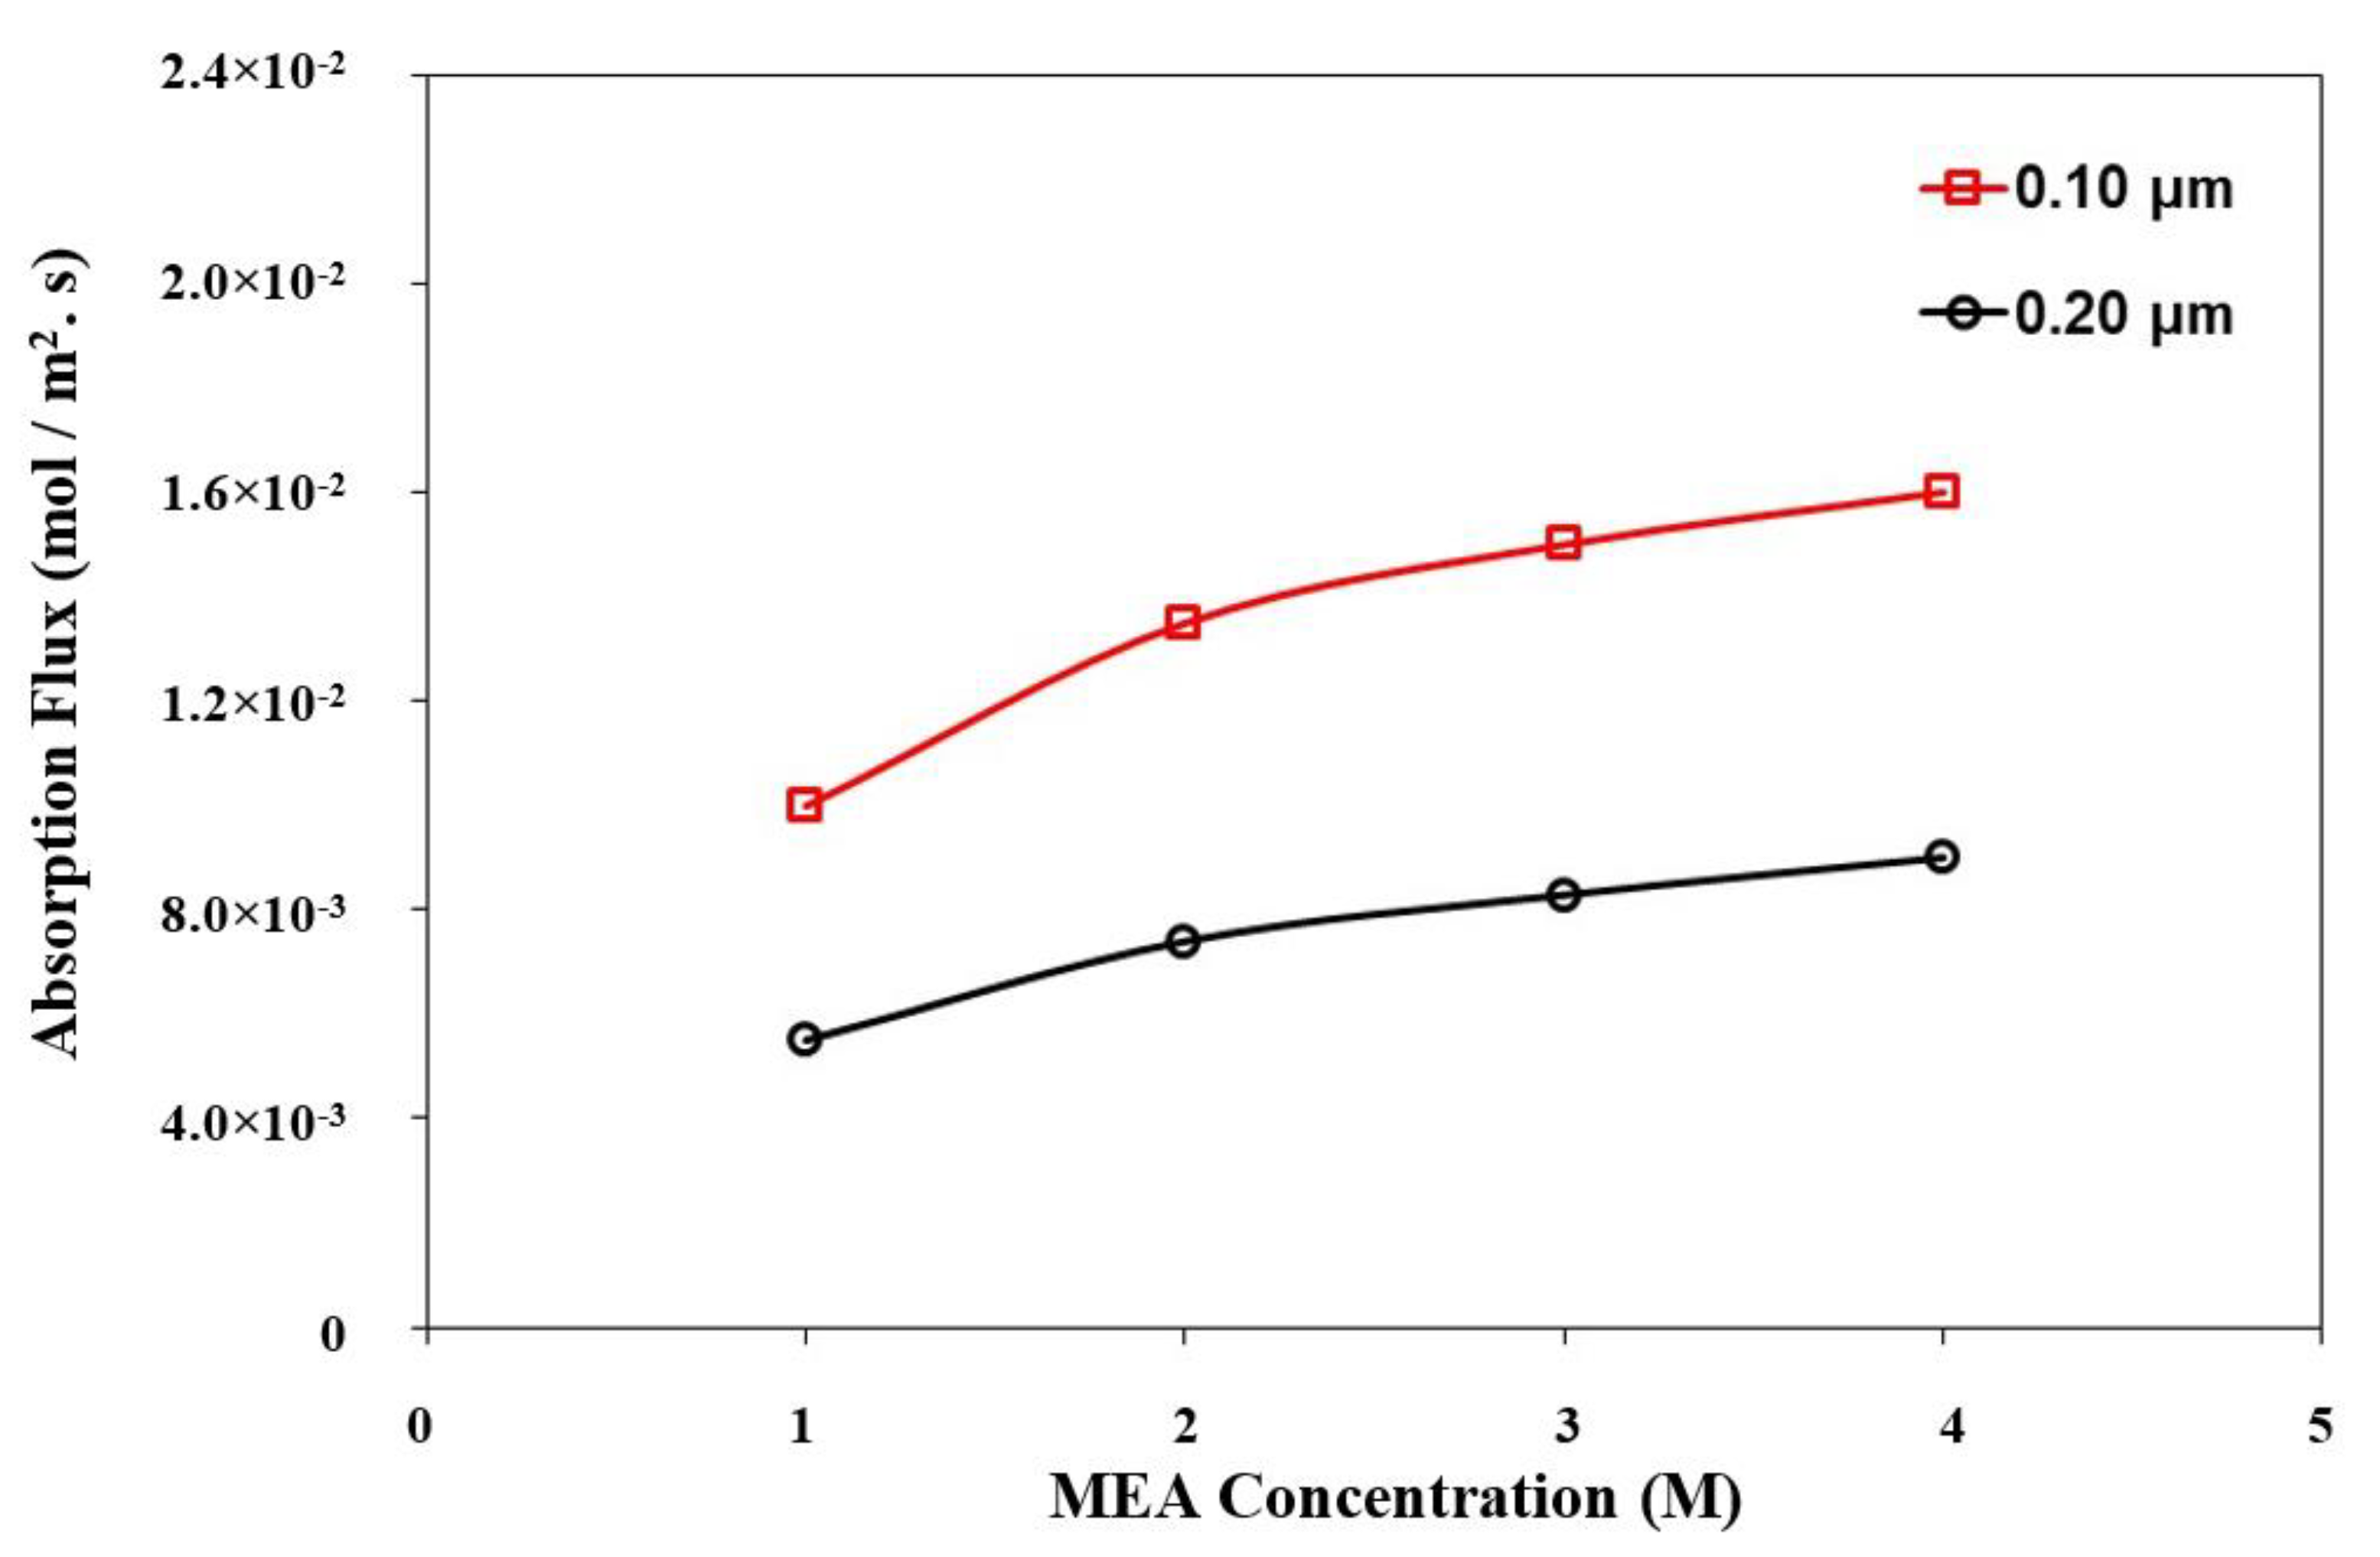
3.3. The Effect of Changing the Porosity and Pore Size

The model was then used to study the effect of the membrane porosity and pore size on the CO2 absorption flux at four different MEA solution concentrations. The pore size increased from 0.05 µm to 0.2 µm while keeping the number of pores the same, thus, increasing the surface porosity with the increase in pore size. The simulation results are shown in Figure 10. Increasing the surface porosity by increasing the membrane surface pore size was found to significantly enhance the CO2 absorption flux, as shown in Figure 10. Increasing CO2 absorption flux by increasing the surface porosity is entirely plausible since it provides a higher chance of contact between CO2 and MEA and results in higher CO2 absorption flux. When the chemical reaction is used for HFMC gas absorption at low surface porosity at the interface, it is the absorption-controlling step.
The effect of the membrane pore size on the CO2 absorption flux at a fixed surface porosity of 1% was evaluated by changing the pore size diameter with changing the number of pores to keep the porosity fixed at 1%. Figure 11 shows the effect of the membrane surface pore size on the CO2 absorption flux at fixed surface porosity for two different pore sizes of 0.1 µm and 0.2 µm. Additionally, Figure 12 presents the flux contours around the pores for two different pore sizes, namely 0.1 and 0.2 microns. It should be mentioned here that the number of pores in the simulation increases exponentially by decreasing the pore diameter. In this study, when the pore size is decreased to 0.05 µm, the calculation time and needed memory are increased exponentially. Thus, we could not perform the calculation for 0.05 µm pore size, as it was far beyond our workstation capabilities. Surprisingly, we can see that membranes with a smaller pore size showed a higher gas absorption flux. This trend sounds interesting because it is strongly in line with our raised hypothesis that when the pore size is large, the possibility of forming the thin film layer of MEA with dissolved CO2 near the pore mouth increases. When this layer forms, the CO2 cannot contact fresh MEA, and the reaction rate and CO2 absorption flux decrease. On the other hand, when the pore size is small, the chance for CO2 to diffuse around the pore mouth and make a thin layer decreases as soon as CO2 exits from the pore and contacts the fresh MEA. Therefore, the reaction rate and CO2 absorption flux increase. This phenomenon is schematically shown in Figure 1. It can be concluded that using a membrane with a small pore size at a fixed surface porosity is much more beneficial for the CO2 absorption flux. However, fabrication costs would probably increase. A future economic study is required to estimate the optimal pore size which can achieve high performance at a reasonable cost.

4. Conclusions and Future Work

A numerical simulation was established to simulate the absorption of CO2 into MEA within hollow fiber membrane contactor modules. The simulation was used to establish a relationship between the absorption flux and the fiber length, which was used to estimate the CO2 absorption flux at long hollow fibers. The simulation results were validated using experimental data from our previously published paper. The simulation results were in good agreement with the experimental results with a maximum error of less than 20%. The validated simulation was then used to investigate the effects of the absorbent inlet velocity and concentration and membrane surface pore size and porosity at the liquid–gas interface on the CO2 absorption flux and the CO2 concentration profiles. Using high absorbent velocity, MEA concentration, porosity, and small pore size at a fixed-surface porosity was beneficial for obtaining high CO2 absorption flux. The CO2 concentration contours showed that by using high absorbent velocity, MEA concentration, low porosity, and small pore size at a fixed surface porosity, the CO2 concentration is limited just to the mouth of the pores of the membrane. In this situation, the possibility of CO2 diffusion around the mouth of the pore decreases, and the CO2 absorption flux increases. Although it needs more detailed investigations, the established simulation showed the potential to be efficiently utilized to study the absorption phenomenon within the membrane contactors.
Future investigations regarding the model may include a full parametric investigation to study the limits of the proposed model and the effects of changing the pore size and porosity of the membrane on the model results compared to the experimental results. Using the same model for other absorption pairs is also an important study. Applying the fitting over long hollow fiber lengths is also in the works. The effect of impurities in the CO2 stream should also be investigated, as it may block the membrane pores which may decrease the absorption flux and affect the module performance. Additionally, the effects of long-term operation on the module performance are a very vital parameter for practical applications.

Author Contributions

Conceptualization, S.R. and T.M.; methodology, M.A.S. and M.S.S.; software, A.M.G.; validation, M.R.E. and N.A.; formal analysis, S.R.; writing—original draft preparation, A.M.G.; writing—review and editing, S.R. and M.S.S.; supervision, T.M. and H.M. All authors have read and agreed to the published version of the manuscript.

Funding

This work was partially supported by Kobe University Strategic International Collaborative Research Grant (Type B Fostering Joint Research). The experimental part of this research was partially funded by Iran National Science Foundation (INSF) (Grant No. 96008182).

Institutional Review Board Statement

Not applicable.

Informed Consent Statement

Not applicable.

Data Availability Statement

The data supporting reported results are available upon request.

Acknowledgments

The authors would like to thank Mansoura University for their support in finishing and publishing this manuscript.

Conflicts of Interest

The authors declare no conflict of interest.

References

  1. Gabelman, A.; Hwang, S.T. Hollow Fiber Membrane Contactors. J. Membr. Sci. 1999, 159, 61–106. [Google Scholar] [CrossRef]
  2. Sreenivasulu, B.; Gayatri, D.V.; Sreedhar, I.; Raghavan, K.V. A Journey into the Process and Engineering Aspects of Carbon Capture Technologies. Renew. Sustain. Energy Rev. 2015, 41, 1324–1350. [Google Scholar] [CrossRef]
  3. Li, J.L.; Chen, B.H. Review of CO2absorption Using Chemical Solvents in Hollow Fiber Membrane Contactors. Sep. Purif. Technol. 2005, 41, 109–122. [Google Scholar] [CrossRef]
  4. Mansourizadeh, A.; Ismail, A.F. Hollow Fiber Gas-Liquid Membrane Contactors for Acid Gas Capture: A Review. J. Hazard. Mater. 2009, 171, 38–53. [Google Scholar] [CrossRef] [PubMed]
  5. Mosadegh-Sedghi, S.; Rodrigue, D.; Brisson, J.; Iliuta, M.C. Wetting Phenomenon in Membrane Contactors—Causes and Prevention. J. Membr. Sci. 2014, 452, 332–353. [Google Scholar] [CrossRef]
  6. Yan, Y.; Zhang, Z.; Zhang, L.; Chen, Y.; Tang, Q. Dynamic Modeling of Biogas Upgrading in Hollow Fiber Membrane Contactors. Energy Fuels 2014, 28, 5745–5755. [Google Scholar] [CrossRef]
  7. Wang, R.; Li, D.F.; Liang, D.T. Modeling of CO2 Capture by Three Typical Amine Solutions in Hollow Fiber Membrane Contactors. Chem. Eng. Process. Process Intensif. 2004, 43, 849–856. [Google Scholar] [CrossRef]
  8. Nakhjiri, A.T.; Heydarinasab, A.; Bakhtiari, O.; Mohammadi, T. The Effect of Membrane Pores Wettability on CO2 Removal from CO2/CH4 Gaseous Mixture Using NaOH, MEA and TEA Liquid Absorbents in Hollow Fiber Membrane Contactor. Chin. J. Chem. Eng. 2018, 26, 1845–1861. [Google Scholar] [CrossRef]
  9. Rosli, A.; Shoparwe, N.F.; Ahmad, A.L.; Low, S.C.; Lim, J.K. Dynamic Modelling and Experimental Validation of CO2 Removal Using Hydrophobic Membrane Contactor with Different Types of Absorbent. Sep. Purif. Technol. 2019, 219, 230–240. [Google Scholar] [CrossRef]
  10. Rongwong, W.; Jiraratananon, R.; Atchariyawut, S. Experimental Study on Membrane Wetting in Gas-Liquid Membrane Contacting Process for CO2 Absorption by Single and Mixed Absorbents. Sep. Purif. Technol. 2009, 69, 118–125. [Google Scholar] [CrossRef]
  11. Shoukat, U.; Pinto, D.D.D.; Knuutila, H.K. Study of Various Aqueous and Non-Aqueous Amine Blends for Hydrogen Sulfide Removal from Natural Gas. Processes 2019, 7, 160. [Google Scholar] [CrossRef] [Green Version]
  12. Shirazian, S.; Nakhjiri, A.T.; Heydarinasab, A.; Ghadiri, M. Theoretical Investigations on the Effect of Absorbent Type on Carbon Dioxide Capture in Hollow-Fiber Membrane Contactors. PLoS ONE 2020, 15, e0236367. [Google Scholar] [CrossRef] [PubMed]
  13. Aaron, D.; Tsouris, C. Separation of CO2 from Flue Gas: A Review. Sep. Sci. Technol. 2005, 40, 321–348. [Google Scholar] [CrossRef]
  14. Ji, G.; Zhao, M. Membrane Separation Technology in Carbon Capture. In Recent Advances in Carbon Capture and Storage; Yun, Y., Ed.; InTech: Rijeka, Croatia, 2017; Chapter 3; ISBN 978-953-51-3006-2. [Google Scholar]
  15. Seader, J.D.; Henley, E.J.; Roper, D.K. Separation Process Principles. Choice Rev. Online 1999, 36, 36–5112. [Google Scholar] [CrossRef]
  16. He, X.; Hägg, M.B. Membranes for Environmentally Friendly Energy Processes. Membranes 2012, 2, 706–726. [Google Scholar] [CrossRef] [PubMed] [Green Version]
  17. Kreulen, H.; Smolders, C.A.; Versteeg, G.F.; van Swaaij, W.P.M. Microporous Hollow Fibre Membrane Modules as Gas-Liquid Contactors. Part 1. Physical Mass Transfer Processes. A Specific Application: Mass Transfer in Highly Viscous Liquids. J. Membr. Sci. 1993, 78, 197–216. [Google Scholar] [CrossRef] [Green Version]
  18. Kreulen, H.; Smolders, C.A.; Versteeg, G.F.; van Swaaij, W.P.M. Microporous Hollow Fibre Membrane Modules as Gas-Liquid Contactors Part 2. Mass Transfer with Chemical Reaction. J. Membr. Sci. 1993, 78, 217–238. [Google Scholar] [CrossRef] [Green Version]
  19. Yuliwati, E.; Ismail, A.F. Effect of Additives Concentration on the Surface Properties and Performance of PVDF Ultrafiltration Membranes for Refinery Produced Wastewater Treatment. Desalination 2011, 273, 226–234. [Google Scholar] [CrossRef]
  20. Yuliwati, E.; Ismail, A.F.; Matsuura, T.; Kassim, M.A.; Abdullah, M.S. Effect of Modified Pvdf Hollow Fiber Submerged Ultrafiltration Membrane for Refinery Wastewater Treatment. Desalination 2011, 283, 214–220. [Google Scholar] [CrossRef]
  21. Rajabzadeh, S.; Yoshimoto, S.; Teramoto, M.; Al-Marzouqi, M.; Ohmukai, Y.; Maruyama, T.; Matsuyama, H. Effect of Membrane Structure on Gas Absorption Performance and Long-Term Stability of Membrane Contactors. Sep. Purif. Technol. 2013, 108, 65–73. [Google Scholar] [CrossRef]
  22. Rajabzadeh, S.; Yoshimoto, S.; Teramoto, M.; Al-Marzouqi, M.; Matsuyama, H. CO2 absorption by Using PVDF Hollow Fiber Membrane Contactors with Various Membrane Structures. Sep. Purif. Technol. 2009, 69, 210–220. [Google Scholar] [CrossRef]
  23. Albarracin Zaidiza, D.; Wilson, S.G.; Belaissaoui, B.; Rode, S.; Castel, C.; Roizard, D.; Favre, E. Rigorous Modelling of Adiabatic Multicomponent CO2 Post-Combustion Capture Using Hollow Fibre Membrane Contactors. Chem. Eng. Sci. 2016, 145, 45–58. [Google Scholar] [CrossRef]
  24. Kumar, P.S.; Hogendoorn, J.A.; Feron, P.H.M.; Versteeg, G.F. Approximate Solution to Predict the Enhancement Factor for the Reactive Absorption of a Gas in a Liquid Flowing through a Microporous Membrane Hollow Fiber. J. Membr. Sci. 2003, 213, 231–245. [Google Scholar] [CrossRef]
  25. Albarracin Zaidiza, D.; Billaud, J.; Belaissaoui, B.; Rode, S.; Roizard, D.; Favre, E. Modeling of CO2 Post-Combustion Capture Using Membrane Contactors, Comparison between One- and Two-Dimensional Approaches. J. Membr. Sci. 2014, 455, 64–74. [Google Scholar] [CrossRef]
  26. Kumar, P.S.; Hogendoorn, J.A.; Feron, P.H.M.; Versteeg, G.F. New Absorption Liquids for the Removal of CO2 from Dilute Gas Streams Using Membrane Contactors. Chem. Eng. Sci. 2002, 57, 1639–1651. [Google Scholar] [CrossRef] [Green Version]
  27. Rezakazemi, M.; Niazi, Z.; Mirfendereski, M.; Shirazian, S.; Mohammadi, T.; Pak, A. CFD Simulation of Natural Gas Sweetening in a Gas–Liquid Hollow-Fiber Membrane Contactor. Chem. Eng. J. 2011, 168, 1217–1226. [Google Scholar] [CrossRef]
  28. Yuan, C.; Li, L.; Li, Y.; Pan, Z.; Zhang, N.; Borhani, T.N.; Zhang, Z. Modeling of CO2 Absorption into 4-Diethylamino-2-Butanol Solution in a Membrane Contactor under Wetting or Non-Wetting Conditions. Carbon Capture Sci. Technol. 2022, 100069. [Google Scholar] [CrossRef]
  29. Ismail, M.S.; Mohamed, A.M.; Poggio, D.; Walker, M.; Pourkashanian, M. Modelling Mass Transport within the Membrane of Direct Contact Membrane Distillation Modules Used for Desalination and Wastewater Treatment: Scrutinising Assumptions. J. Water Process Eng. 2022, 45, 102460. [Google Scholar] [CrossRef]
  30. Zhang, X.; Koirala, R.; Date, A.; Jegatheesan, V. Modelling and Simulation of Flux Prediction and Salinity Variation in Direct Contact Membrane Distillation for Seawater Desalination and Brine Treatment. Desalination 2022, 540, 116021. [Google Scholar] [CrossRef]
  31. Bird, R.B.; Stewart, W.E.; Lightfoot, E.N. Transport Phenomena, Revised Se; John Wiley & Sons: New York, NY, USA, 2006. [Google Scholar]
  32. Hikita, H.; Asai, S.; Ishikawa, H.; Honda, M. The Kinetics of Reactions of Carbon Dioxide with Monoethanolamine, Diethanolamine and Triethanolamine by a Rapid Mixing Method. Chem. Eng. J. 1977, 13, 7–12. [Google Scholar] [CrossRef]
Figure 1. A schematic diagram of a membrane contactor module.
Sustainability 14 14527 g001
Figure 2. A schematic diagram of the feed flow in a hollow fiber membrane; The cylinders represent the membrane pores in the model extended in the membrane thickness.
Sustainability 14 14527 g002
Figure 3. Different angle cuts of the hollow fibers.
Sustainability 14 14527 g003
Figure 4. Effect of mesh size on (a) absorption flux and (b) MEA concentration profile.
Sustainability 14 14527 g004
Figure 5. The estimated absorption flux at different fiber lengths for four different MEA concentrations; The main parameters for this calculation are membrane surface porosity of 1%, a pore diameter of 0.2 µm, and an MEA average velocity of 0.25 m/s.
Sustainability 14 14527 g005
Figure 6. Comparing the simulation results in the current study with that of the experimental results and simulation without considering the effect of the membrane surface porosity [22]; fiber length of 27 cm, a pore diameter of 0.2 µm, and an MEA average velocity of 0.25 m/s.
Sustainability 14 14527 g006
Figure 7. CO2 concentration distribution over the membrane surface (absorbent concentration: (a) 1 mol/L and (b) 4 mol/L with pores diameter of 0.2 µm. circles in the figure show a hollow fiber pore mouth.
Sustainability 14 14527 g007
Figure 8. Simulation results versus experimental results at different absorbent average velocities; Main parameters for simulations: Fiber length of 27 cm, a membrane surface porosity of 1%, a pore diameter of 0.2 µm, and an absorbent concentration of 2 mol/L.
Sustainability 14 14527 g008
Figure 9. CO2 concentration distribution over the membrane surface; absorbent average velocity: (a) 0.062 m/s and (b) 0.5 m/s, pore diameter of 0.1 µm, and an absorbent concentration of 2 mol/L.
Sustainability 14 14527 g009
Figure 10. The effect of the membrane surface porosity on the CO2 absorption flux. The number of pores was kept constant, and the pore size varied from 0.05 µm to 0.2 µm.
Sustainability 14 14527 g010
Figure 11. The effect of the membrane pore size on the CO2 absorption flux. The surface porosity was fixed at 1%, and the pore size varied from 0.1 µm to 0.2 µm.
Sustainability 14 14527 g011
Figure 12. CO2 concentration distribution over the membrane surface: pore diameter: (a) 0.1 µm and (b) 0.2 µm, an absorbent average velocity of 0.062 m/s, and an absorbent concentration of 2 mol/L.
Sustainability 14 14527 g012
Table 1. Physical properties at different MEA concentrations.
MEA Concentration (M)1234
D C O 2 (m2/s) 1.66 × 10 9 1.397 × 10 9 1.17 × 10 9 9.49 × 10 10
D M E A (m2/s) 9.45 × 10 10 7.96 × 10 10 6.68 × 10 10 5.41 × 10 10
H C O 2 (mol/m3·kPa) 0.217 0.135 0.1385 0.142
k (m3/mol·s) 5.92
Table 2. Absorption flux simulation values at different angle cuts and lengths.
Cutting Angle (°)90452792.5
Fiber
Length (µm)
Absorption Flux (mol/m2·s)
1000.9320.9310.9310.9300.930
3000.3920.3920.3900.3900.389
600-0.2600.2590.2580.258
900--0.240.240.24
1800---0.1990.198
3600---0.1740.174
7200----0.161
Table 3. Main input parameters for the mesh dependency test.
MEA Concentration (mol/L)Absorbent Velocity (m/s)Pore Size (µm)Surface Porosity
20.250.11%
Table 4. Algorithmic function coefficients for different MEA concentrations.
MEA Concentration (mol/L)1234
A0.26340.51940.70550.8807
B−0.04652−0.09283−0.1269−0.1592
Publisher’s Note: MDPI stays neutral with regard to jurisdictional claims in published maps and institutional affiliations.

