Article

Power System Stability Improvement of FACTS Controller and PSS Design: A Time-Delay Approach

by
Preeti Ranjan Sahu
1,
Rajesh Kumar Lenka
2,
Rajendra Kumar Khadanga
3,
Prakash Kumar Hota
4,
Sidhartha Panda
5 and
Taha Selim Ustun
6,*
1
Department of Electrical and Electronics Engineering, NIST Institute of Science and Technology, Berhampur 761008, Odisha, India
2
School of Electrical Engineering, Vellore Institute of Technology, Vellore 632014, Tamil Nadu, India
3
Department of Electrical and Electronics Engineering, Centurion University of Technology and Management, Bhubaneswar 752050, Odisha, India
4
Department of Electrical Engineering, Veer Surendra Sai University of Technology, Burla 768018, Odisha, India
5
Department of Electrical and Electronics Engineering, Veer Surendra Sai University of Technology, Burla 768018, Odisha, India
6
Fukushima Renewable Energy Institute, Fukushima 9630298, Japan
*
Author to whom correspondence should be addressed.
Sustainability 2022, 14(21), 14649; https://doi.org/10.3390/su142114649
Submission received: 6 October 2022 / Revised: 31 October 2022 / Accepted: 3 November 2022 / Published: 7 November 2022
(This article belongs to the Special Issue Advanced Renewable Energy for Sustainability)

Abstract

:
The existence of low-frequency oscillations in power systems is the cause of power angle instability, limiting the transmission of maximum tie-line power. One of the effective ways to improve the stability limits is by installing a power system stabilizer and supplementary excitation control to augment with an automatic voltage regulator (AVR) supplemental feedback stabilizing signal. This paper proposes a new strategy for simultaneously tuning the power system stabilizer (PSS) and FACTS controller, considering time delays. The design of the proposed controller is modeled as an optimization problem, and the parameters of the controller are optimized through the grasshopper optimization algorithm (GOA). The suggested controller’s efficacy is evaluated for both single-machine infinite bus systems and multi-machine power systems under various disturbances. It also investigated the performance of the proposed controller with variations in signal transmission delays. The results obtained from GOA optimized proposed controller are compared with those obtained from the differential evolution algorithm, genetic algorithm, and whale optimization algorithm. In this context, the proposed GOA optimized controller reduced the objective function value by 16.32%, 14.56%, and 13.72%, respectively, in the SMIB system and 1.41%, 9.98%, and 13.31%, respectively, for the multi-machine system compared with the recently published WOA, and the well-established GA and DE. Further, the proposed controller is found to be stable and effectively increases stability even under small disturbances.

1. Introduction

A sustainable power system accommodates higher penetration of renewable generations via effective planning and operational approaches to ensure system reliability and stability generally undergoes structural and technological transformations [1,2,3,4,5,6]. System stability, being one of the essential aspects [7,8,9,10,11,12], numerous stability issues may be caused by heavily loaded long tie-lines in an interconnected power system. There have been different approaches to mitigating negative impacts of inreased renewable penetration into the grid [13,14,15,16,17]. On this note, the design of a suitable power system stabilizer (PSS) is currently a research interest. With the increasing usage of FACTS devices for the enhancement of power system oscillations damping, proper synergism of FACTS controller and PSS is essential. As the power system is non-linear in nature, the control parameters of FACTS devices and PSS are estimated, taking the system’s non-linearity into consideration [18,19]. When the FACTS controller and PSS are utilized simultaneously in the power system, investigating the coordination strategy becomes as essential as presenting an appropriate function to prepare this procedure. Generally, it can prove to be an optimization process to estimate the values of their controller parameters at the same time.
When a damping controller based on a PSS and a FACTS device is designed and operated in a coordinated manner, it leads to the enhancement of power system performance. This coordinated process works well and is an important topic of research and study these days [20,21,22,23,24]. Installation of the PSS at a location close to the generator and that of a FACTS device away from the generator have to be taken into consideration. Therefore, the transmission delay that is caused by each sensor and signal transmission in the power system should be considered during the design of the damping controller based on FACTS-PSS [25]. Moreover, different algorithms like the linear matrix inequality technique, residue method, and multi-model adaptive approach for control have been applied to enhance the damping of the coordinated controller. The verification of the robustness of the design approach in the coordinated technique is the main topic of discussion, as the high efficiency and effectiveness of the techniques ensure a robust controller design that varies with the system configuration.
In recent times, a lot of research is going on, which are heuristic in nature that uses likenesses of a social system [26]. Because of their ability to identify optimal solutions to multi-modal, non-differentiable, and complex objective functions, these techniques can be promising problem solvers when applied in the research community.
In recent times, various algorithms have been used for modeling damping controllers that are based on PSS and FACTS. From the present literature analysis, it is perceived that the combined coordinated structure of PSS and SSSC have significant relevance for the lead-lag controller. Nowadays, various intelligent methods have been extensively used in this coordinated design. PSS has been designed in combination with other FACTS controllers in the literature, such as PSS and SSSC by GA [27], and PSS and SVC by improved teaching-learning techniques [28]. The author in [29] discussed the coordinated control of two FACTS controllers, such as TCSC and SSSC, using various disturbances. The author investigates the time delay method for the coordinated SSSC and PSS controller using a hybrid PSO-GSA technique [30]. The author analyses the coordinated structure of SSSC and PSS using the ACO technique [31]. The author investigates the coordinated SSSC and PSS design using a hybrid technique [32]. In [33,34], the author discussed simultaneous tuning of PSS and SSSC controllers using modified SCA. Similarly, in [35], PSO is used to tune SSSC and PSS controllers. In [36], authors suggested a coordinated structure of PSS and SSSC controllers using modified WOA. The author investigated the PSS and STATCOM using the learning BAT algorithm in [37]. In [38] the PSS and SVC parameters were tuned by using the BFPSO algorithm. The coordinated STATCOM and PSS design using SOA discussed in [39]. The MWOA-NM algorithm was proposed in [40] to co-ordinately tune the PSS and SSSC parameters. Furthermore, in [41], a PSO with an exponential delay algorithm is proposed to co-ordinately tunning AVR and PSS parameters. In [42], the author discussed the simultaneous tuning of SSSC-POD with PSS using the mayfly optimization technique. The various intelligent techniques are extensively used by several researchers in modeling the coordinated structure of FACTS controller together with PSS.
In [43], Saremi et al. proposed a grasshopper optimization algorithm (GOA) based on the social activity of grasshoppers. The GOA has gained popularity over the years because of its simple structure, gradient-free mechanism, and convergence to an optimum global value instead of an optimum local value. The GOA processed the optimization problem in two stages: exploration and exploitation. This technique randomly varies the solutions in the exploration stage, leading to a more extensive search space and discovering its promising areas. After exploration, the GOA exploits the search area to get the optimum solution. However, an improper balance between exploration and exploitation leads to converging the solution to a local one instead of tracking for the global solution. The obtained results for the optimization problem with GOA are compared with PSO, FPA, BA, FA, SMS, and GA. The obtained results with GOA show supremacy over others in finding the global solution. Previous research shows that researchers are more interested in simultaneously tuning the FACTS controller and the PSS when it comes to improving stability. In this present work, the following objectives are accomplished.
  • This paper investigates the simultaneous tuning of the PSS and FACTS controller considering the potential time delays. Its goal is to improve power system stability in the presence of potential time delay.
  • GOA is utilized to fine-tune control parameters for the proposed fuzzy lead-lag controller design. To illustrate the robustness of the proposed design methodology, simulation results for both single-machine infinite-bus and multi-machine power systems are presented under different disturbances and faults.
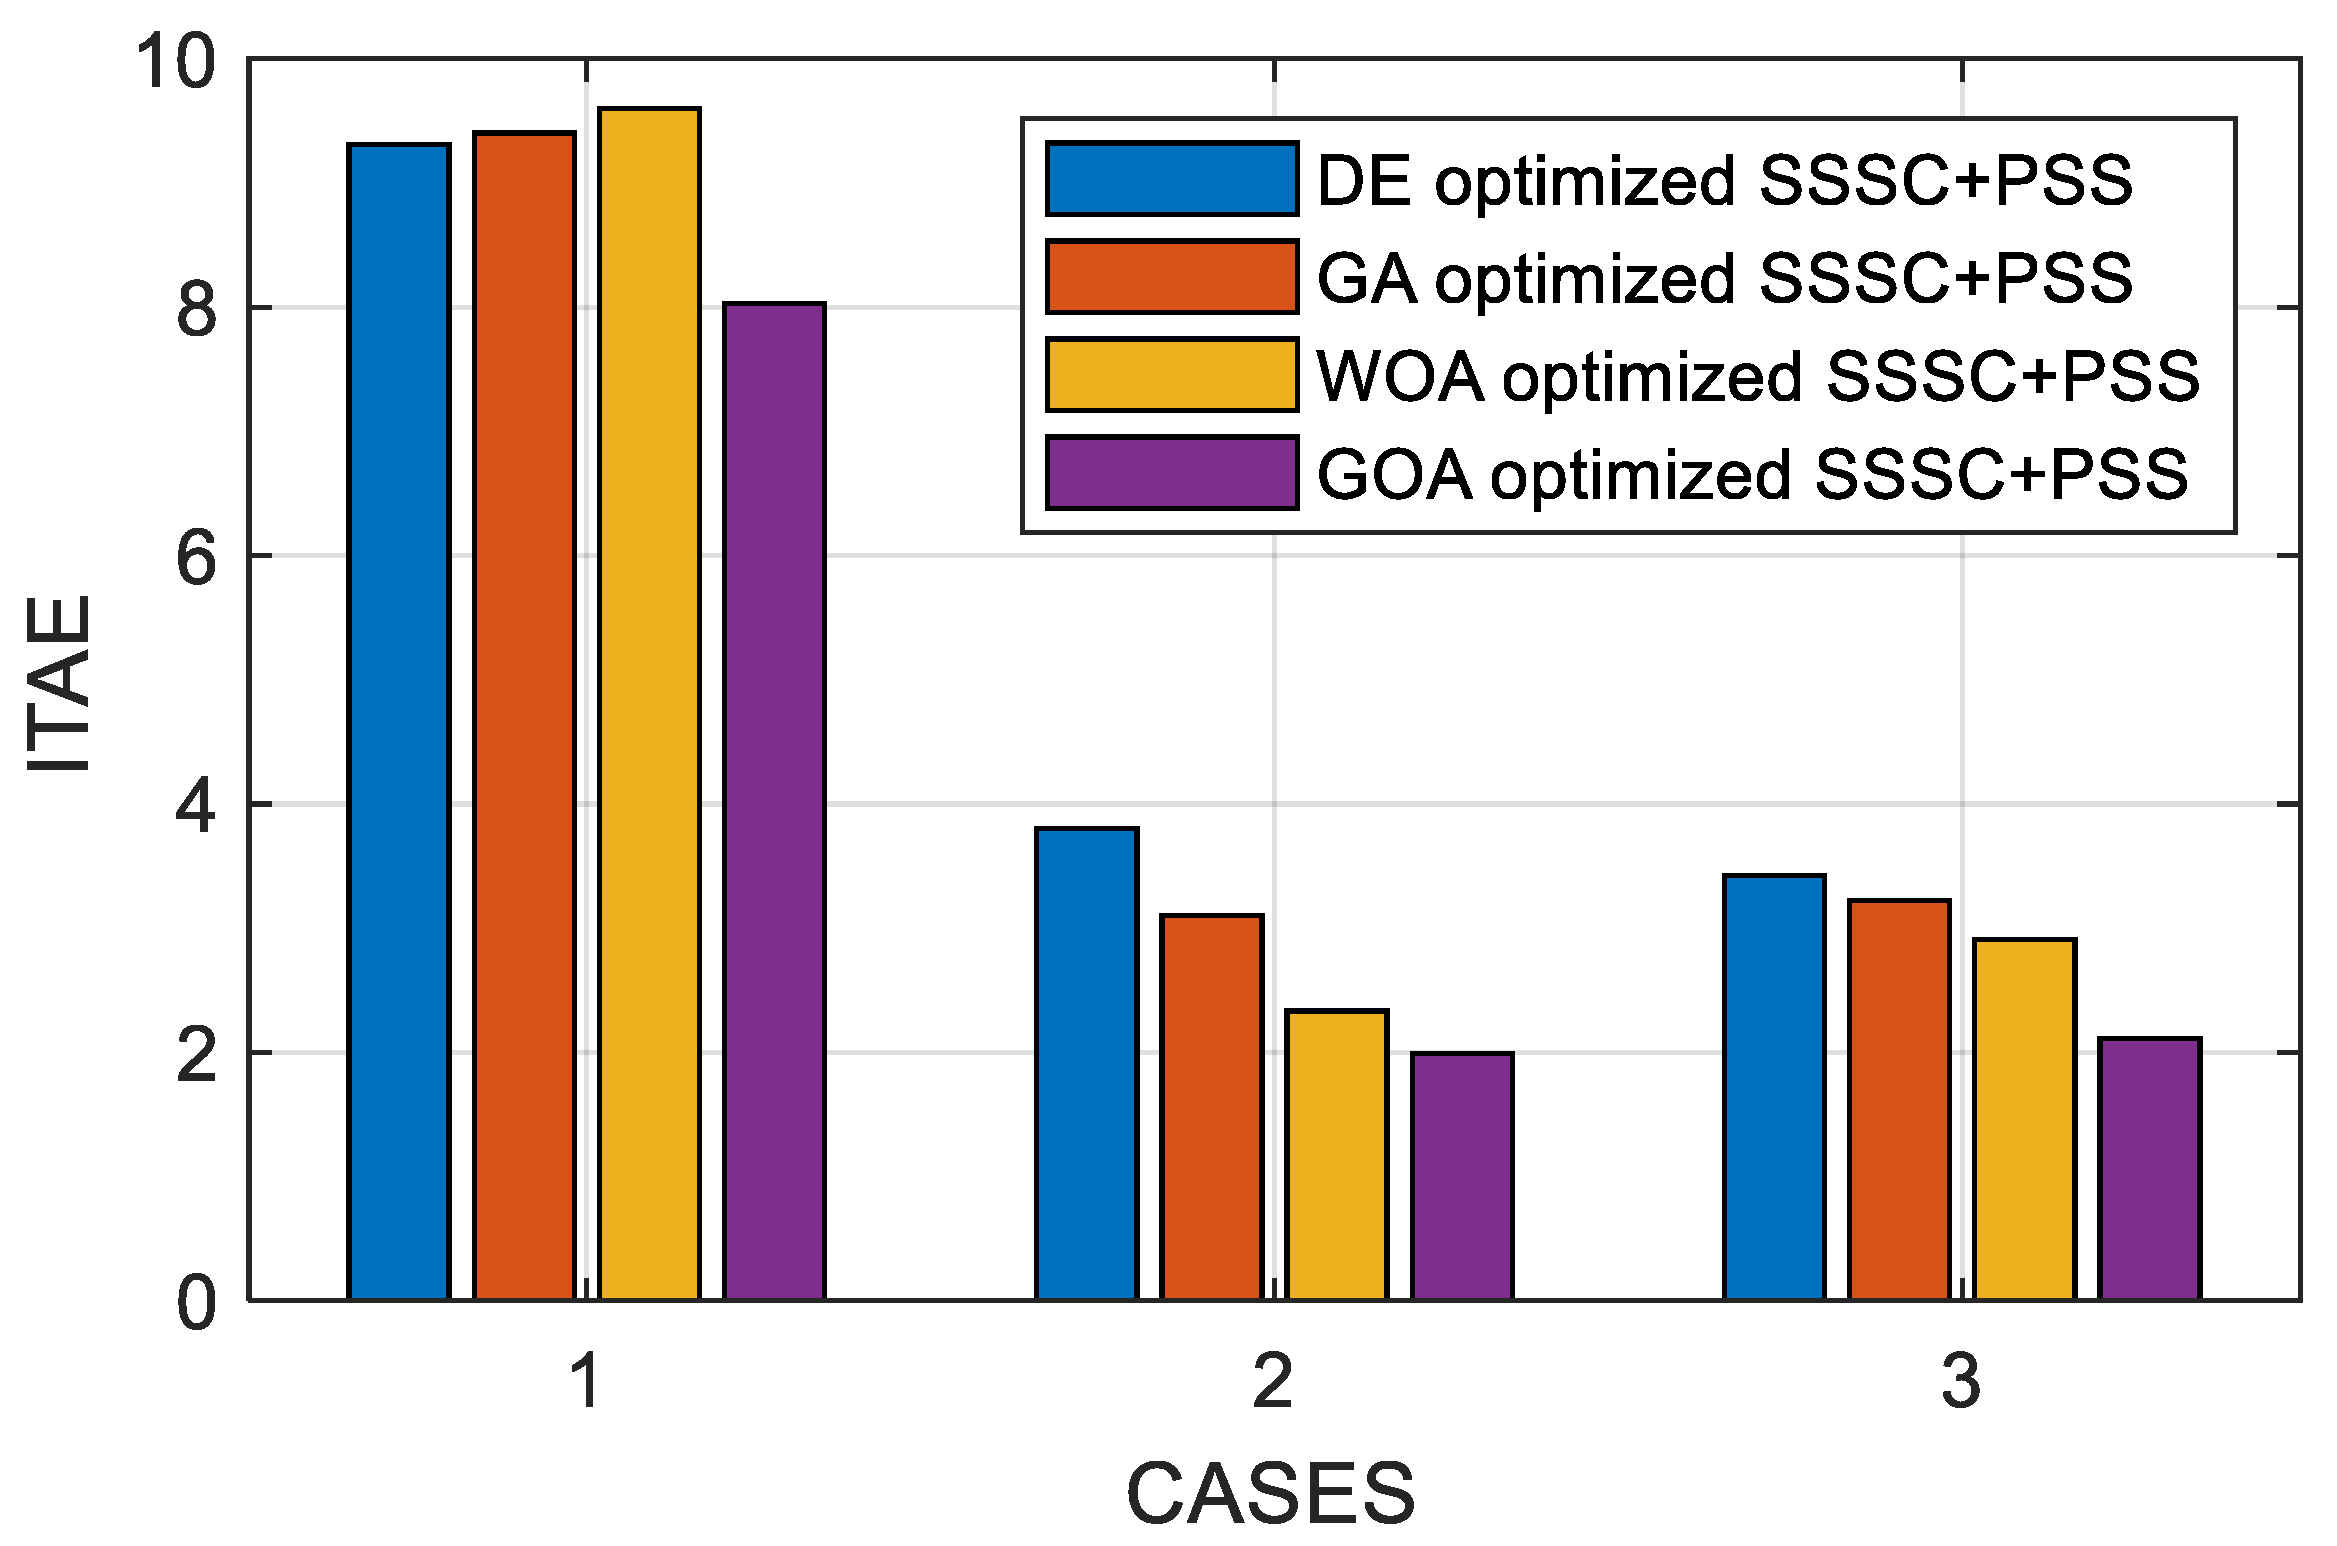
  • The percentage decrease in J value with the GOA technique compared with the recently published WOA, well-established GA, and DE are 16.32%, 14.56%, and 13.72%, respectively, in the SMIB system. The percentage decrease in J value with the proposed GOA technique compared with the recently published WOA, well-established GA, and DE are 1.41%, 9.98%, and 13.31%, respectively, for a multi-machine system.
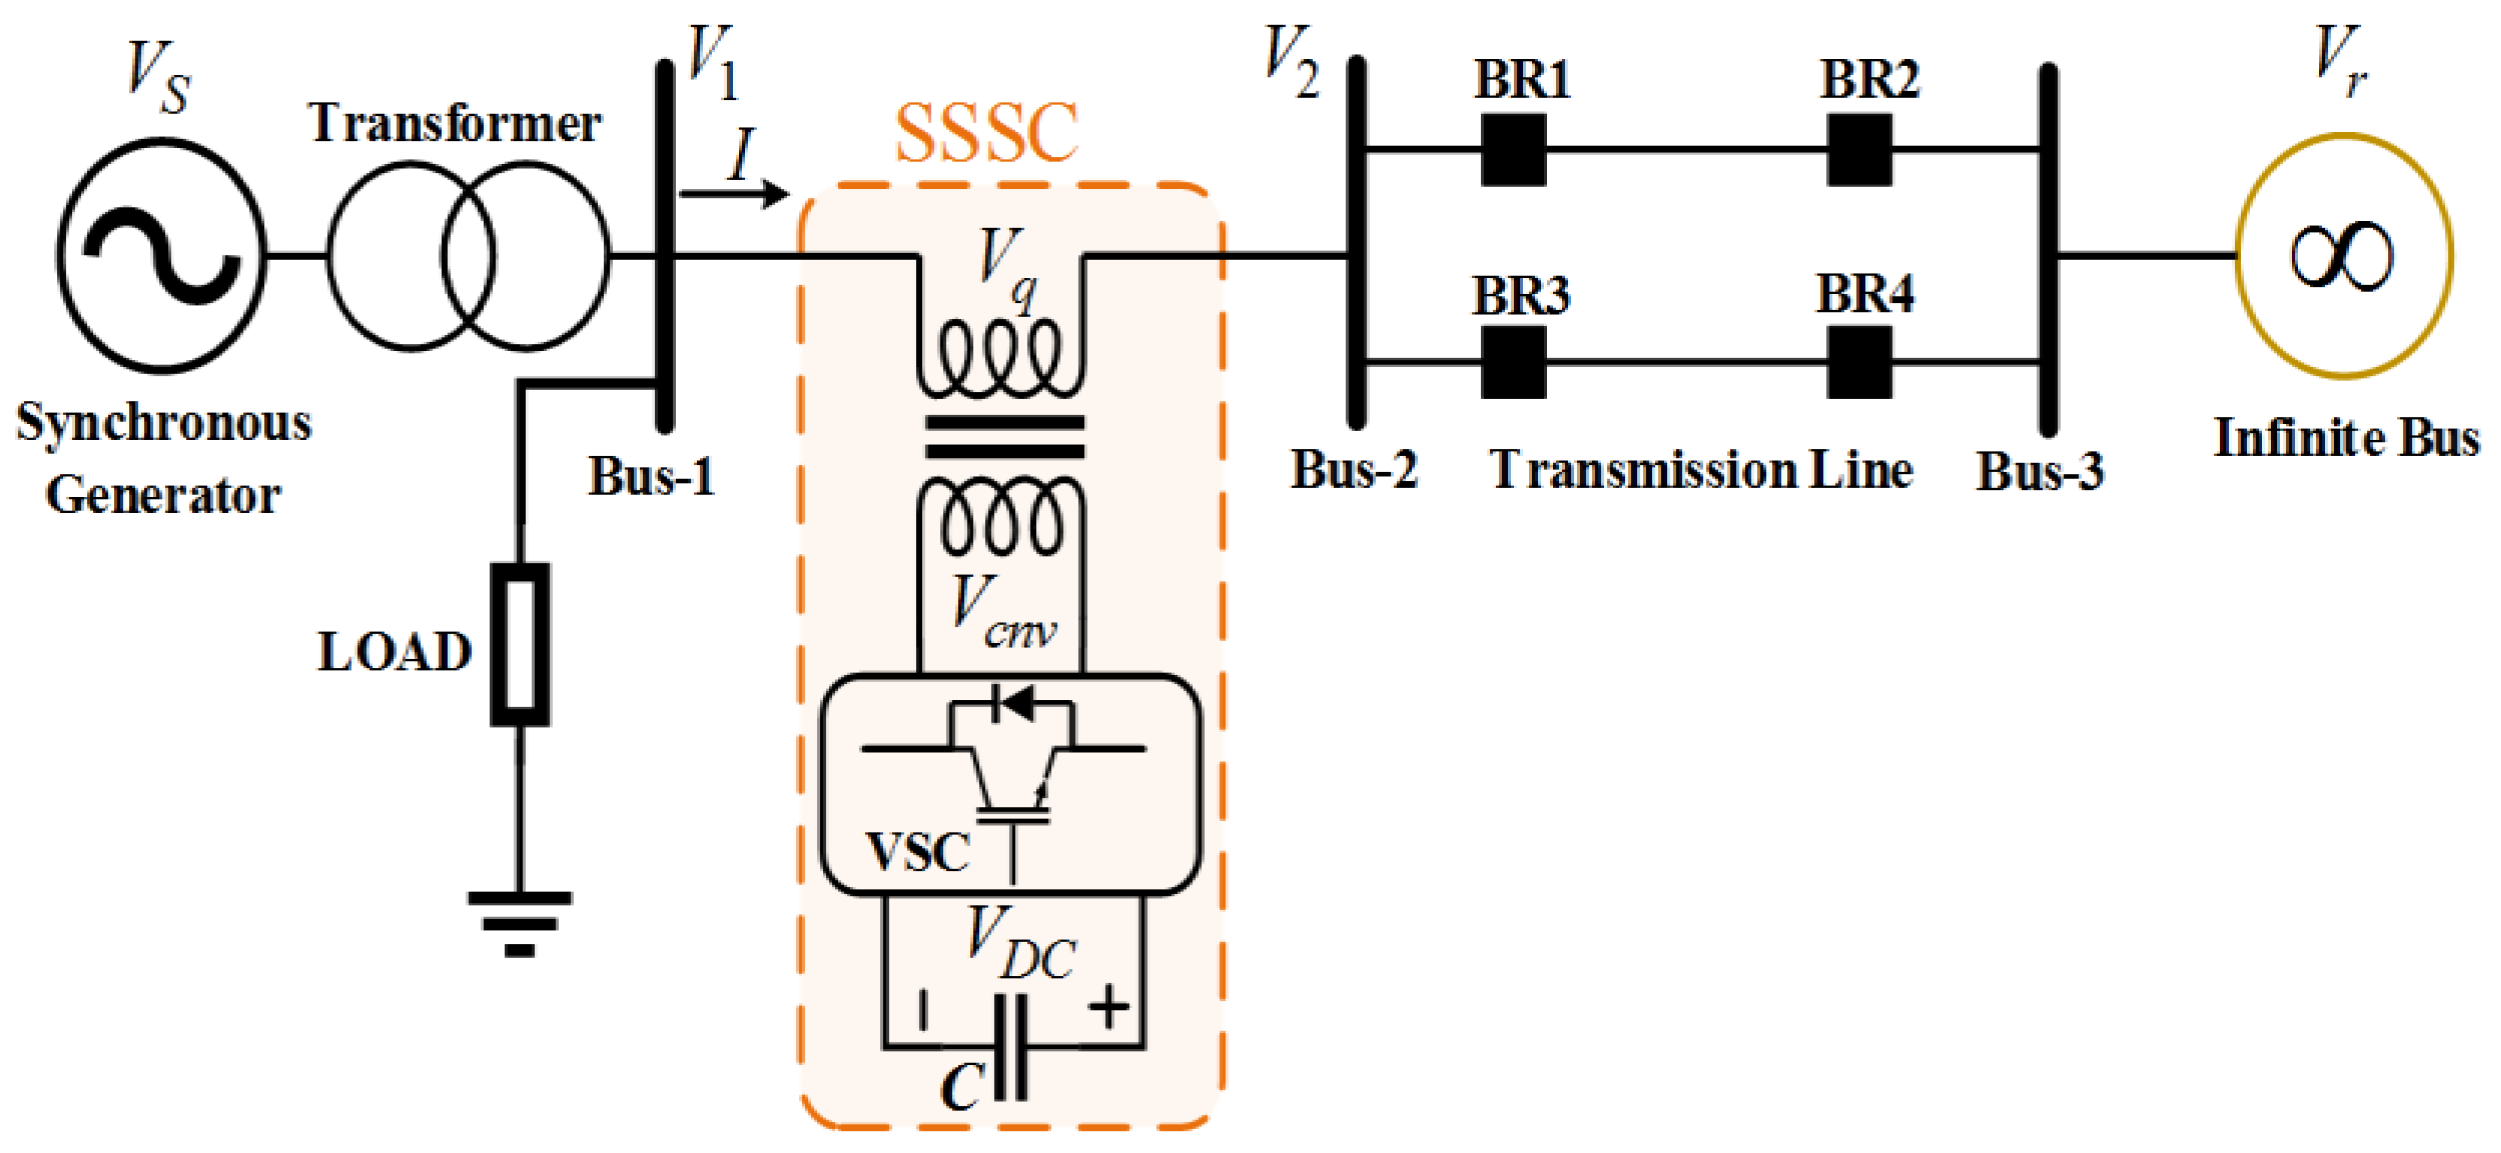
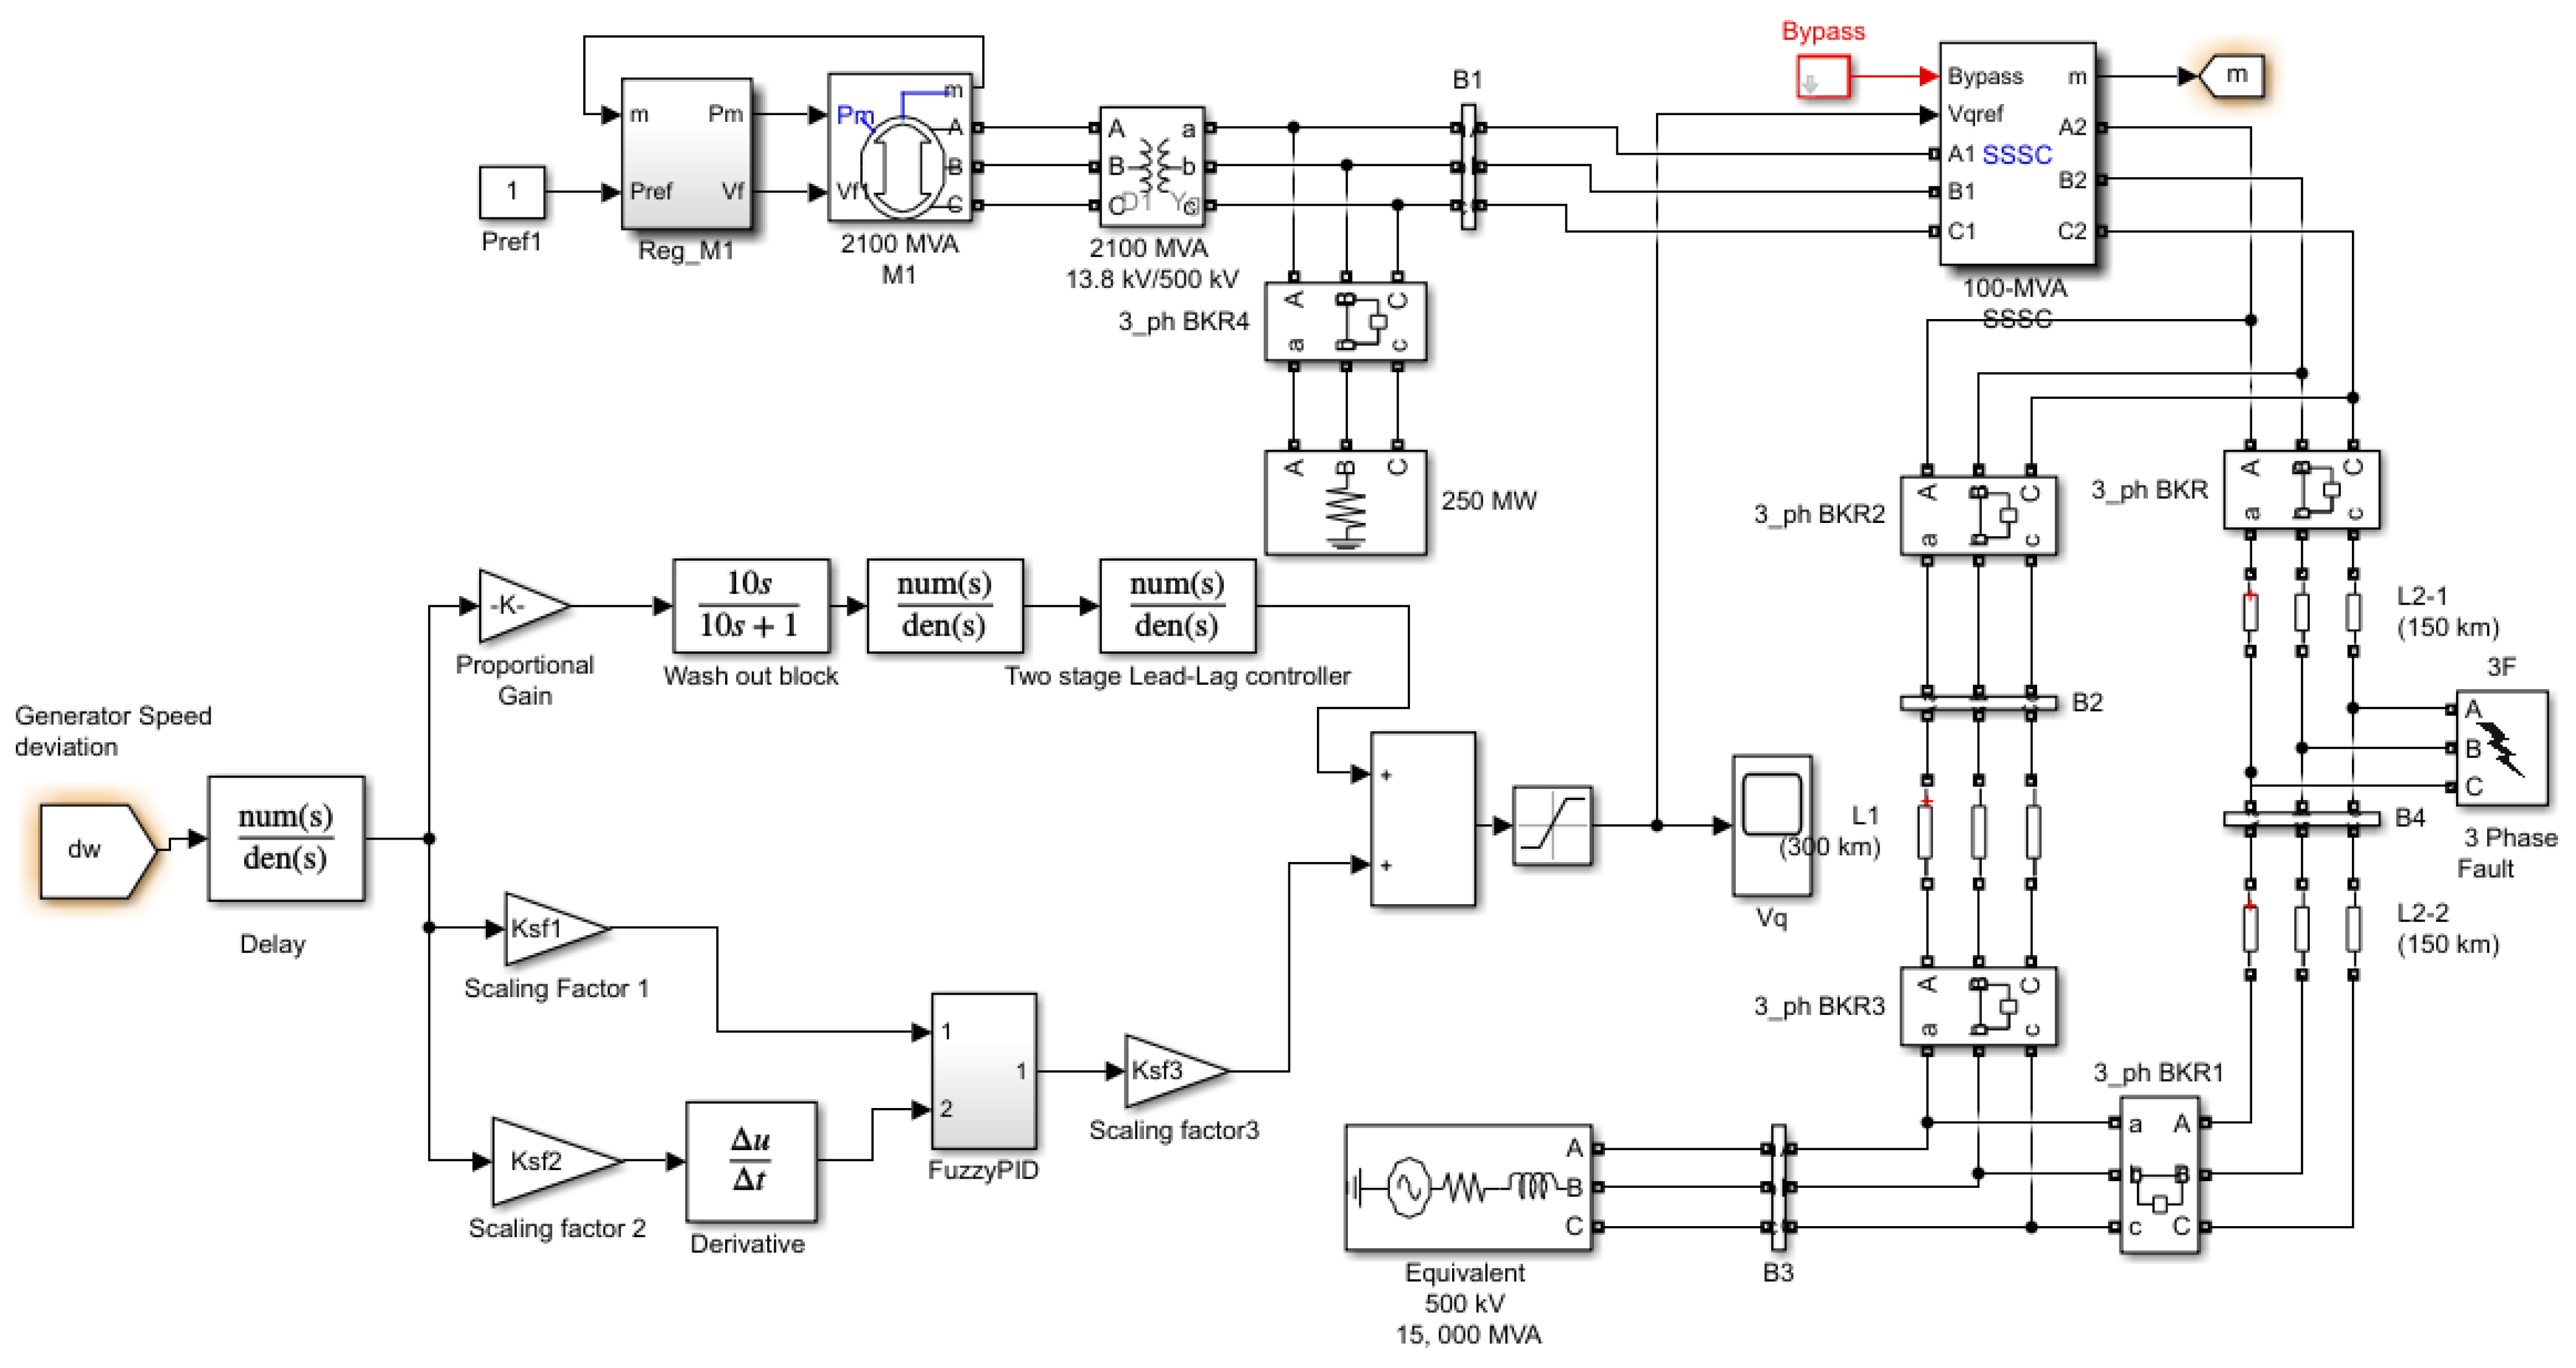
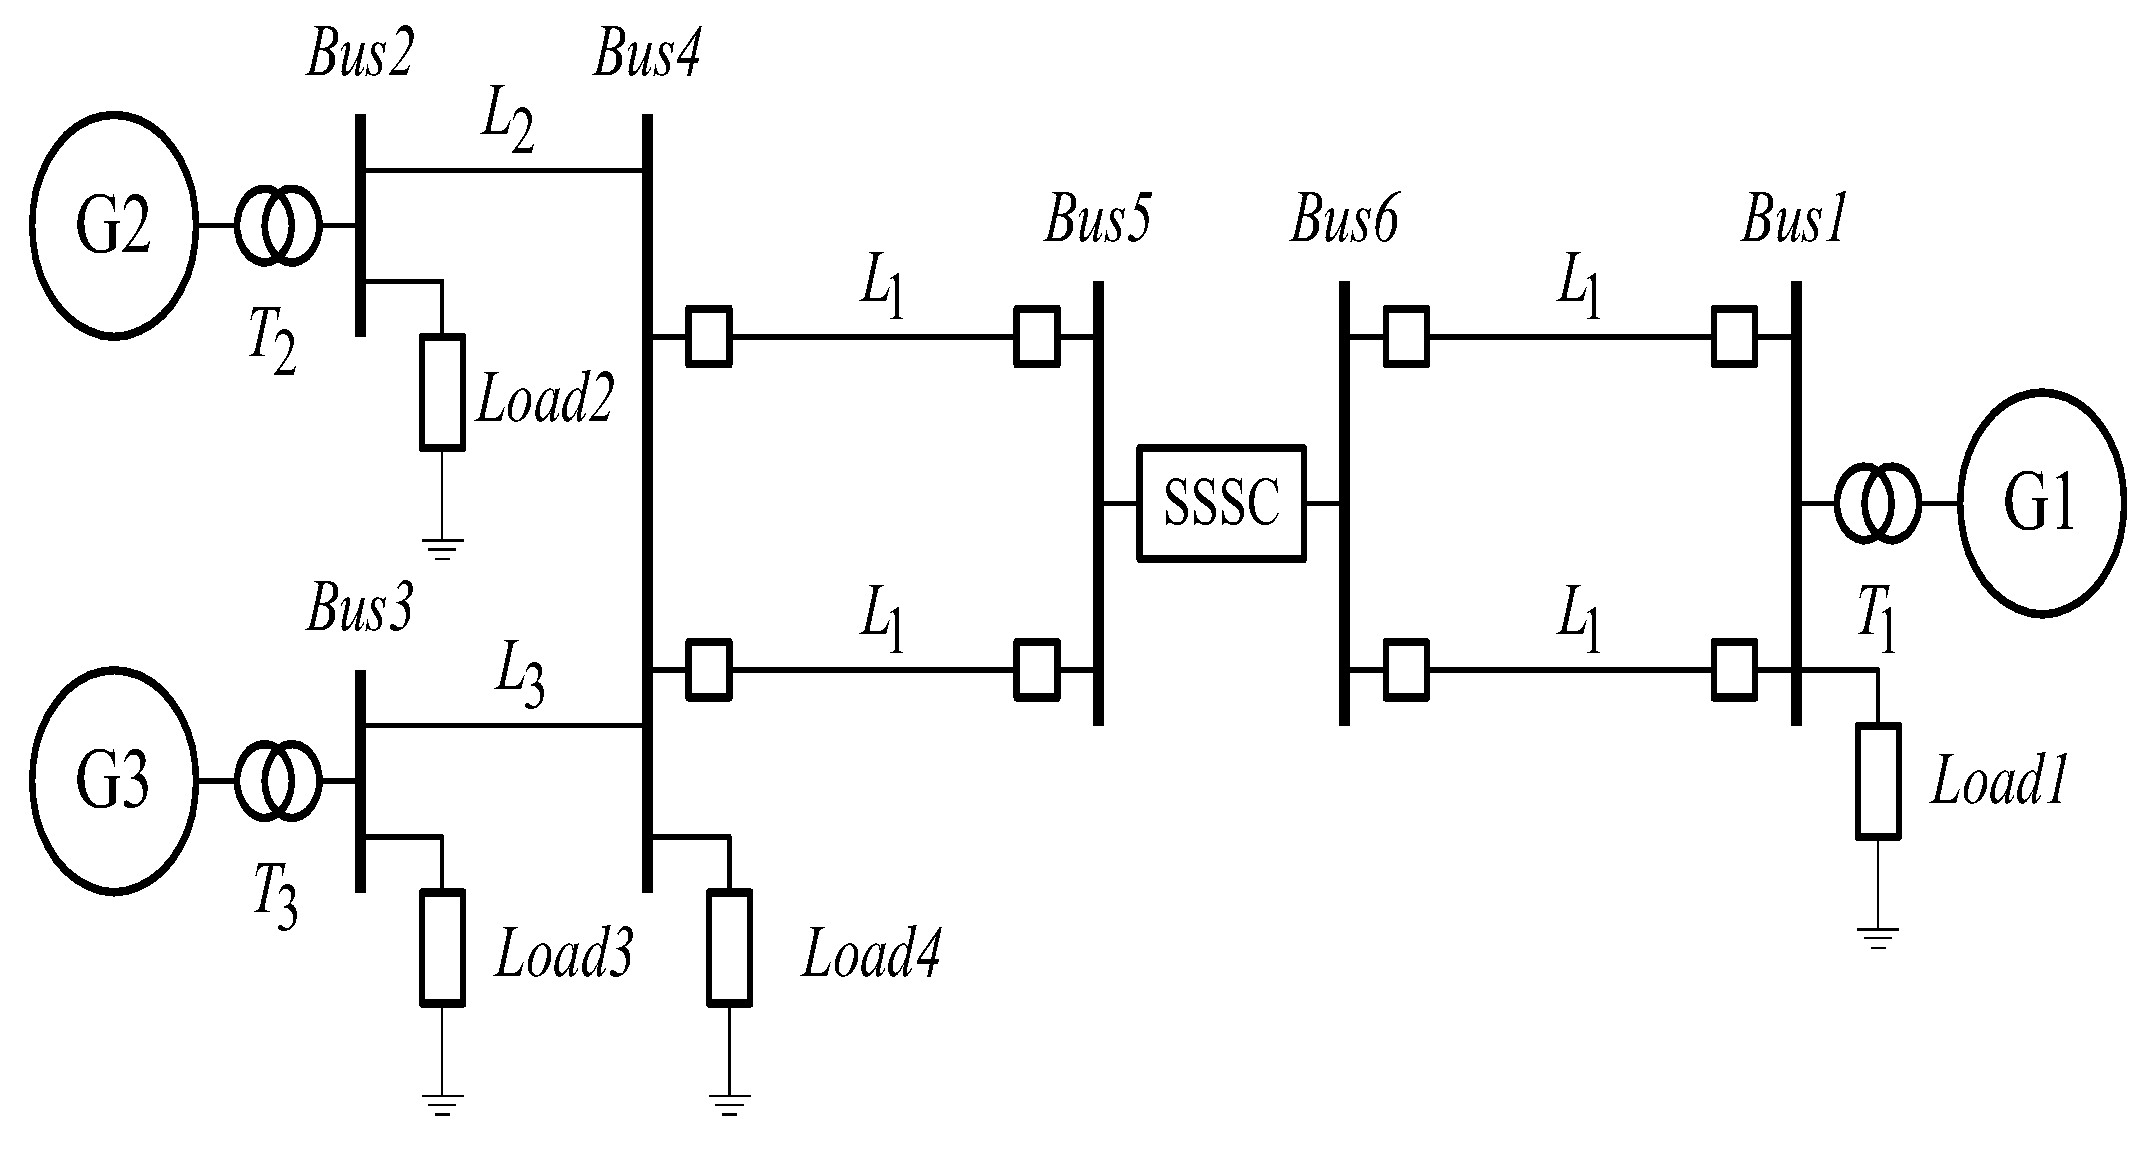
2. System Modeling

It is necessary to do the evaluation of the performance of any damping controller based on PSS and SSSC along with their proper design. Therefore, a SMIB system is considered, as shown in Figure 1, comprising a synchronous generator that is linked to an infinite bus with the help of a transformer and an SSSC. Moreover, the hydraulic turbine and governor (HTG) equipped in the generator signifies a nonlinear hydraulic turbine model, a servomotor, and a PID governor system. Apart from this, some other equipment existing within the generator includes the excitation system consisting of a DC exciter along with a voltage regulator, in the absence of saturation function of the exciter and a PSS.
In Figure 1, the transformer is represented by T; the infinite bus and generator terminal voltages are represented by VB and VT, respectively; V1 and V2 are the bus voltages, the output voltage of the SSSC converter and the DC voltage source is represented by Vcnv and VDC, respectively; the line current is I and the total flow of real power in the transmission lines and that of a single line are each represented by PL and PL1, respectively.

Model of SSSC

An AC voltage can be generated and controlled with the help of a solid-state voltage-sourced converter (VSC) called SSSC. The line impedance is virtually compensated by the controllable voltage (Vq) injection by SSSC, which is connected in series with the transmission lines of the power system. The quadrature component of the line current Vq influences the flow of power in the transmission lines independent of the line current magnitude by reproducing the reactance of either an inductor or a capacitor. Moreover, a VSC that is present on the transformer’s secondary side is used to alter Vq. Additionally, a capacitor linked on the direct current side of the VSC usually acts as a DC voltage source. This DC voltage source then provides AC voltage using forced commutated power electronics devices. The dynamic control of polarity and magnitude of Vq determines the extent to which the transmission lines are compensated as the device operates in both capacitive and inductive modes [44]. However, charging of capacitors and losses occurring in the transformer and VSC draw some amount of active power from the line. The PWM inverters, which are based on IGBT, have been utilized in the current study [45,46,47].

3. The Proposed Approach

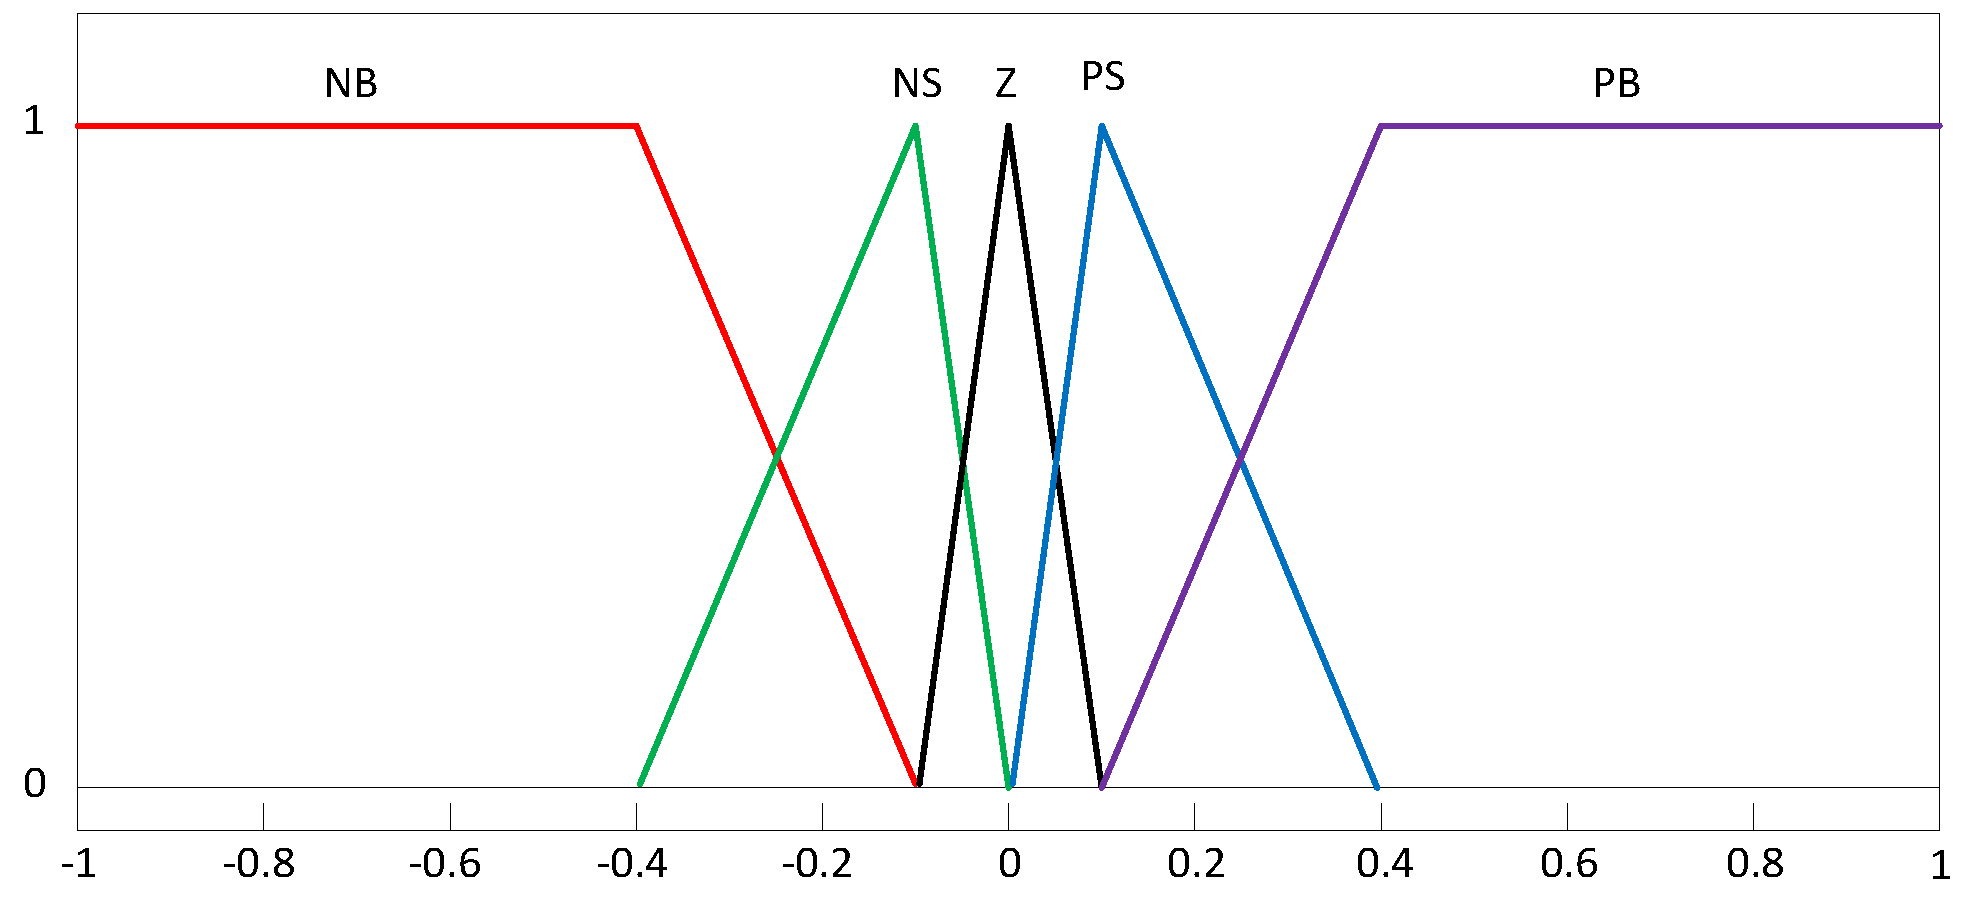
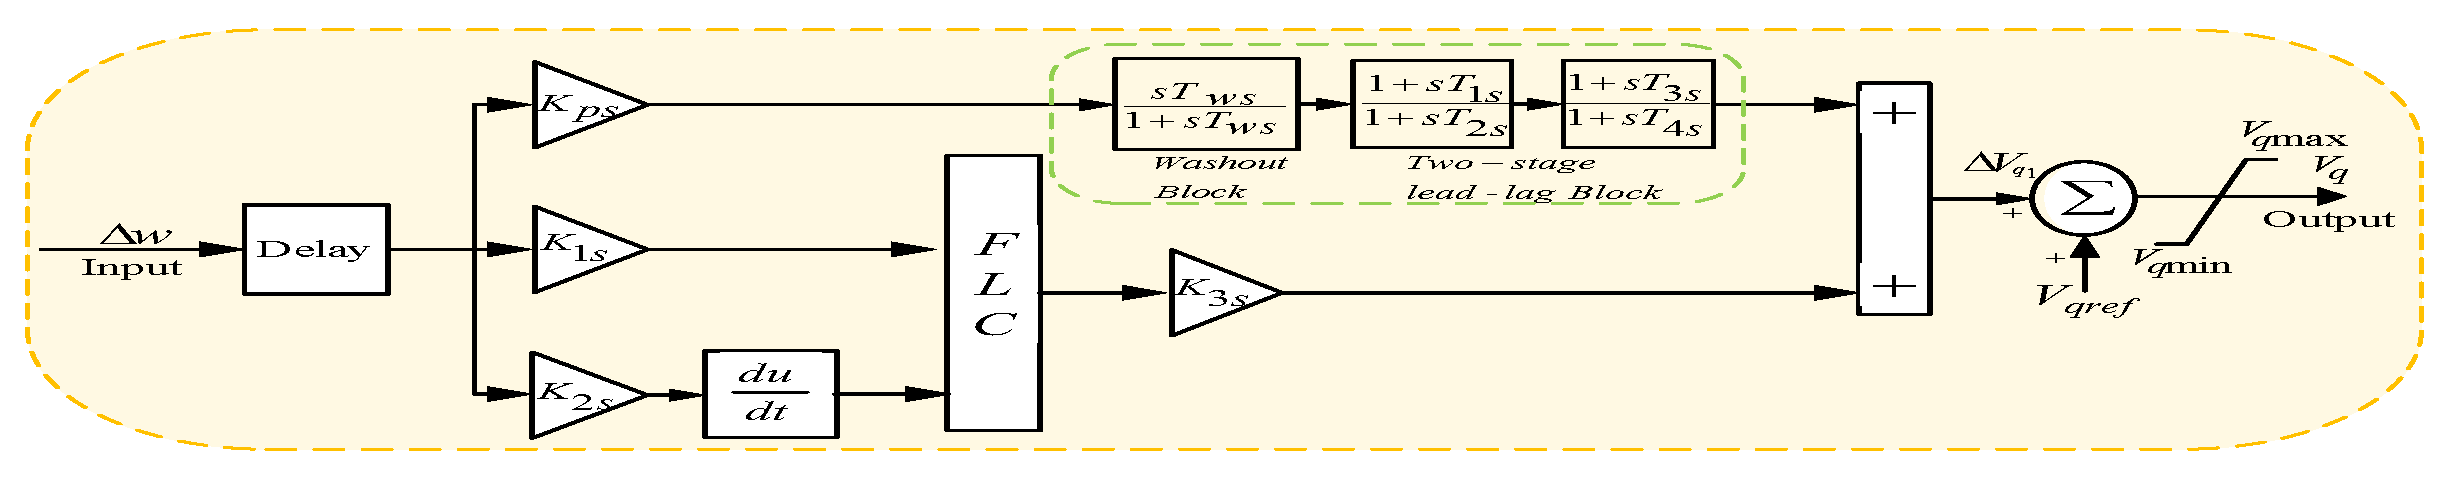
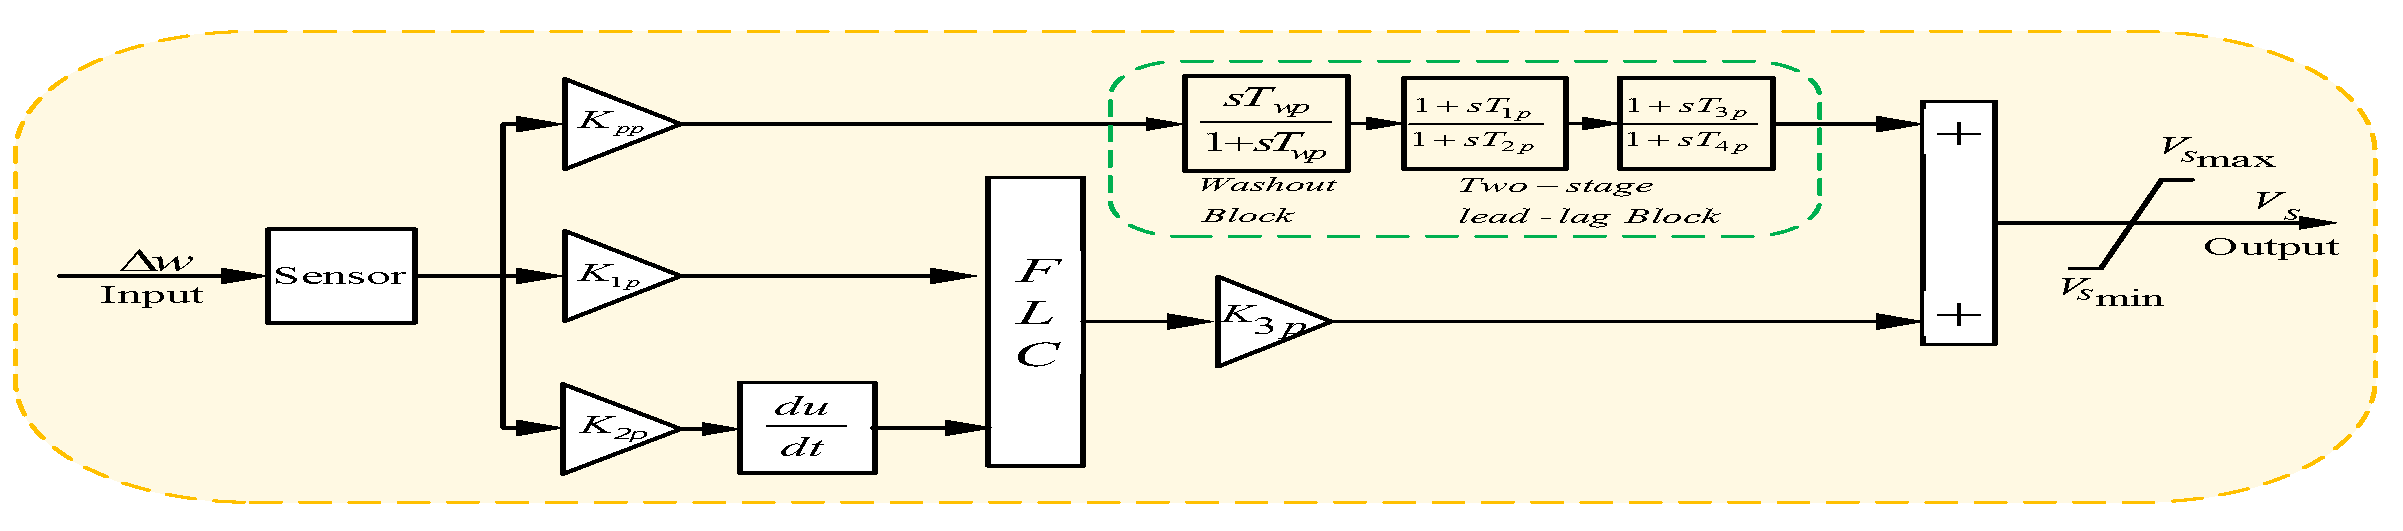
3.1. Proposed Fuzzy Structured FACTS Controller Structure with PSS

The ability of a fuzzy logic controller (FLC) to boost the performance of the lead-lag controller has been recognized by many authors. It deals with structure parameters and updates the online parameters of the controller [48]. Membership function (MF) tuning, as well as rule tuning, being the two types of fuzzy control tuning methods, play a significant role in fuzzy control performance enhancement. The strong rule base and standard MFs techniques are used by focusing on the applications. Scaling factors are to be tuned in ideal fuzzy lead-lag control [49]. In real-time applications, designing the controller is done with the help of triangular MFs, owing to the cost-effectiveness of its practical parametric illustration in comparison with others. In this paper, we selected triangular MFs to design the controller. On the other hand, a steady characterization of MFs is normally considered to make efficient use of memory, computational efficiency, and necessity of performance analysis [50]. As a result, for obtaining the output of the FLC, MFs’ error derivative is chosen. The MFs are based on five fuzzy linguistic factors: positive big, negative big, positive small, negative small, and zero. The MFs considering the output of FLC, error derivative, and error is shown in Figure 2.
The SSSC injected voltage (Vq) is governed by the damping controller, which is based on the PSS and SSSC. This Vq is used for damping and hence can be considered the controller output while inputting the speed deviation (∆ω). Here the proposed controller is comprised of two lead-lag components, as detailed in Figure 3. The structure comprises a gain block with gain KPS, a signal washout block serving as a high-pass filter, and a phase compensation block to provide appropriate phase-lead characteristics between input and output signals and which are two-staged, as shown in the figure. The output of the PSS structure shown in Figure 4, Vs cumulate with the reference voltage of the excitation system, Vref. From the washout function’s perspective, the time constant value TWS = TWP may lie somewhere between 1–20 s and is not critical. In the present analysis, K P S and K P P are the controller gains, k 1 s , k 2 s , k 3 s and k 1 p , k 2 p , k 3 p are the scaling factors and time constants (T1s, T2s, T3S, and T4S) to be computed.
In the present study, time delay means communication delay that is inherently present in any control system. A communication delay in a power grid is defined as the time between sending a signal from the source device to the receiving of the signal at the destination device. Typically, SSSC devices are installed at locations that are far away from the generating units. The speed deviation of the generator is taken as an input signal to the proposed fuzzy lead-lag structured SSSC controller, as shown in Figure 3. Transmitting the speed deviation signal from the generator to the SSSC controller will take some time; therefore, the time delay is included for the SSSC controller, as shown in Figure 3. Owing to the advancement in optical fiber communication, synchronous phasor measurement can be done by a wide-ranging measuring system that can then be transmitted simultaneously to control centers. Thus, considering generator angle and speed deviation as remote signals, they can be put to use for designing purposes. However, the delay in the transmission network poses a major problem while using these types of signals as the delay results in significant degradation of that particular transmission line performance. Even in the worst scenarios, a dedicated channel of communication should avoid exceeding a delay of 50 ms during signal communication [45]. So, the remedial solution is to take care of the time delays of this order during the designing of the controller, as it is done in most cases these days. If improvement of the power system stability is taken into consideration, the remote speed deviation signal is preferred over the local tie-line power and line current signals for damping controllers based on FACTS. Thus, a 15 ms sensor time constant and 50 ms time delayed signal transmission are each considered for PSSs and SSSC-based controllers, respectively.

3.2. Optimization Problem
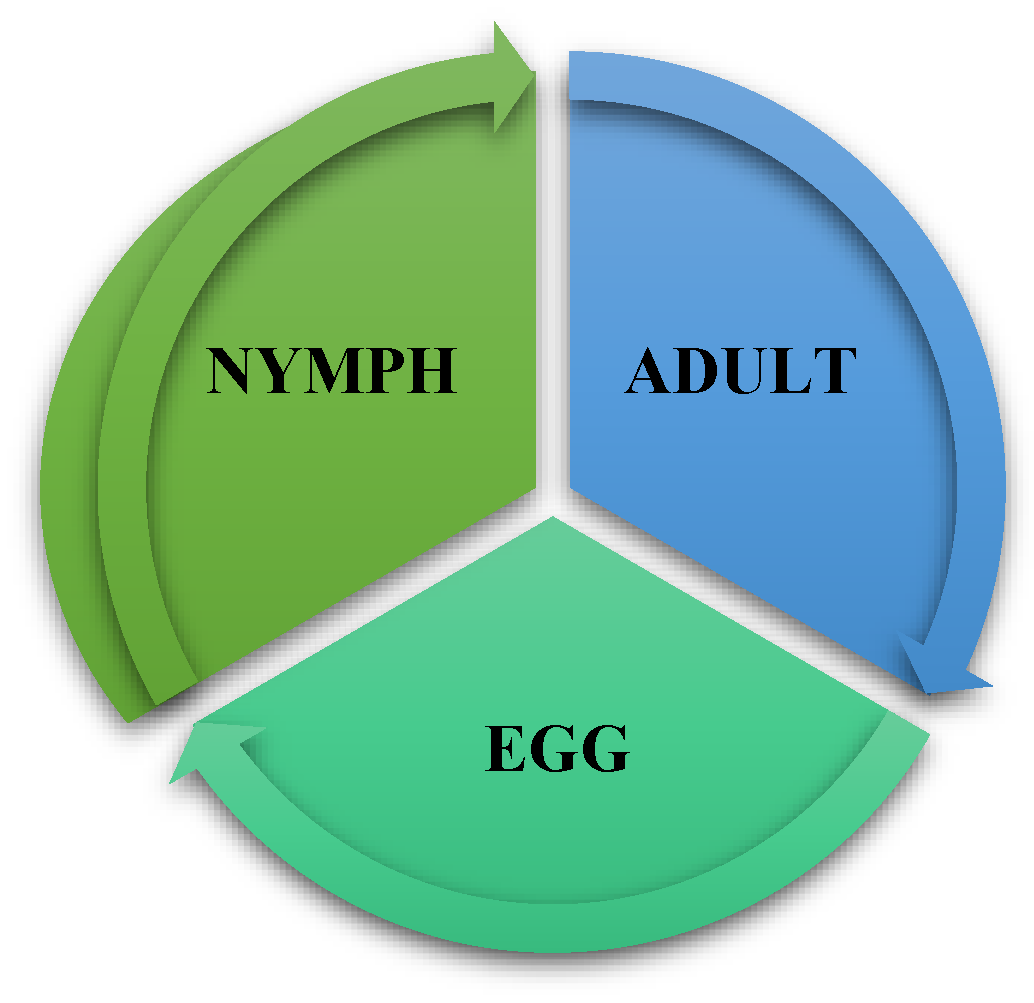
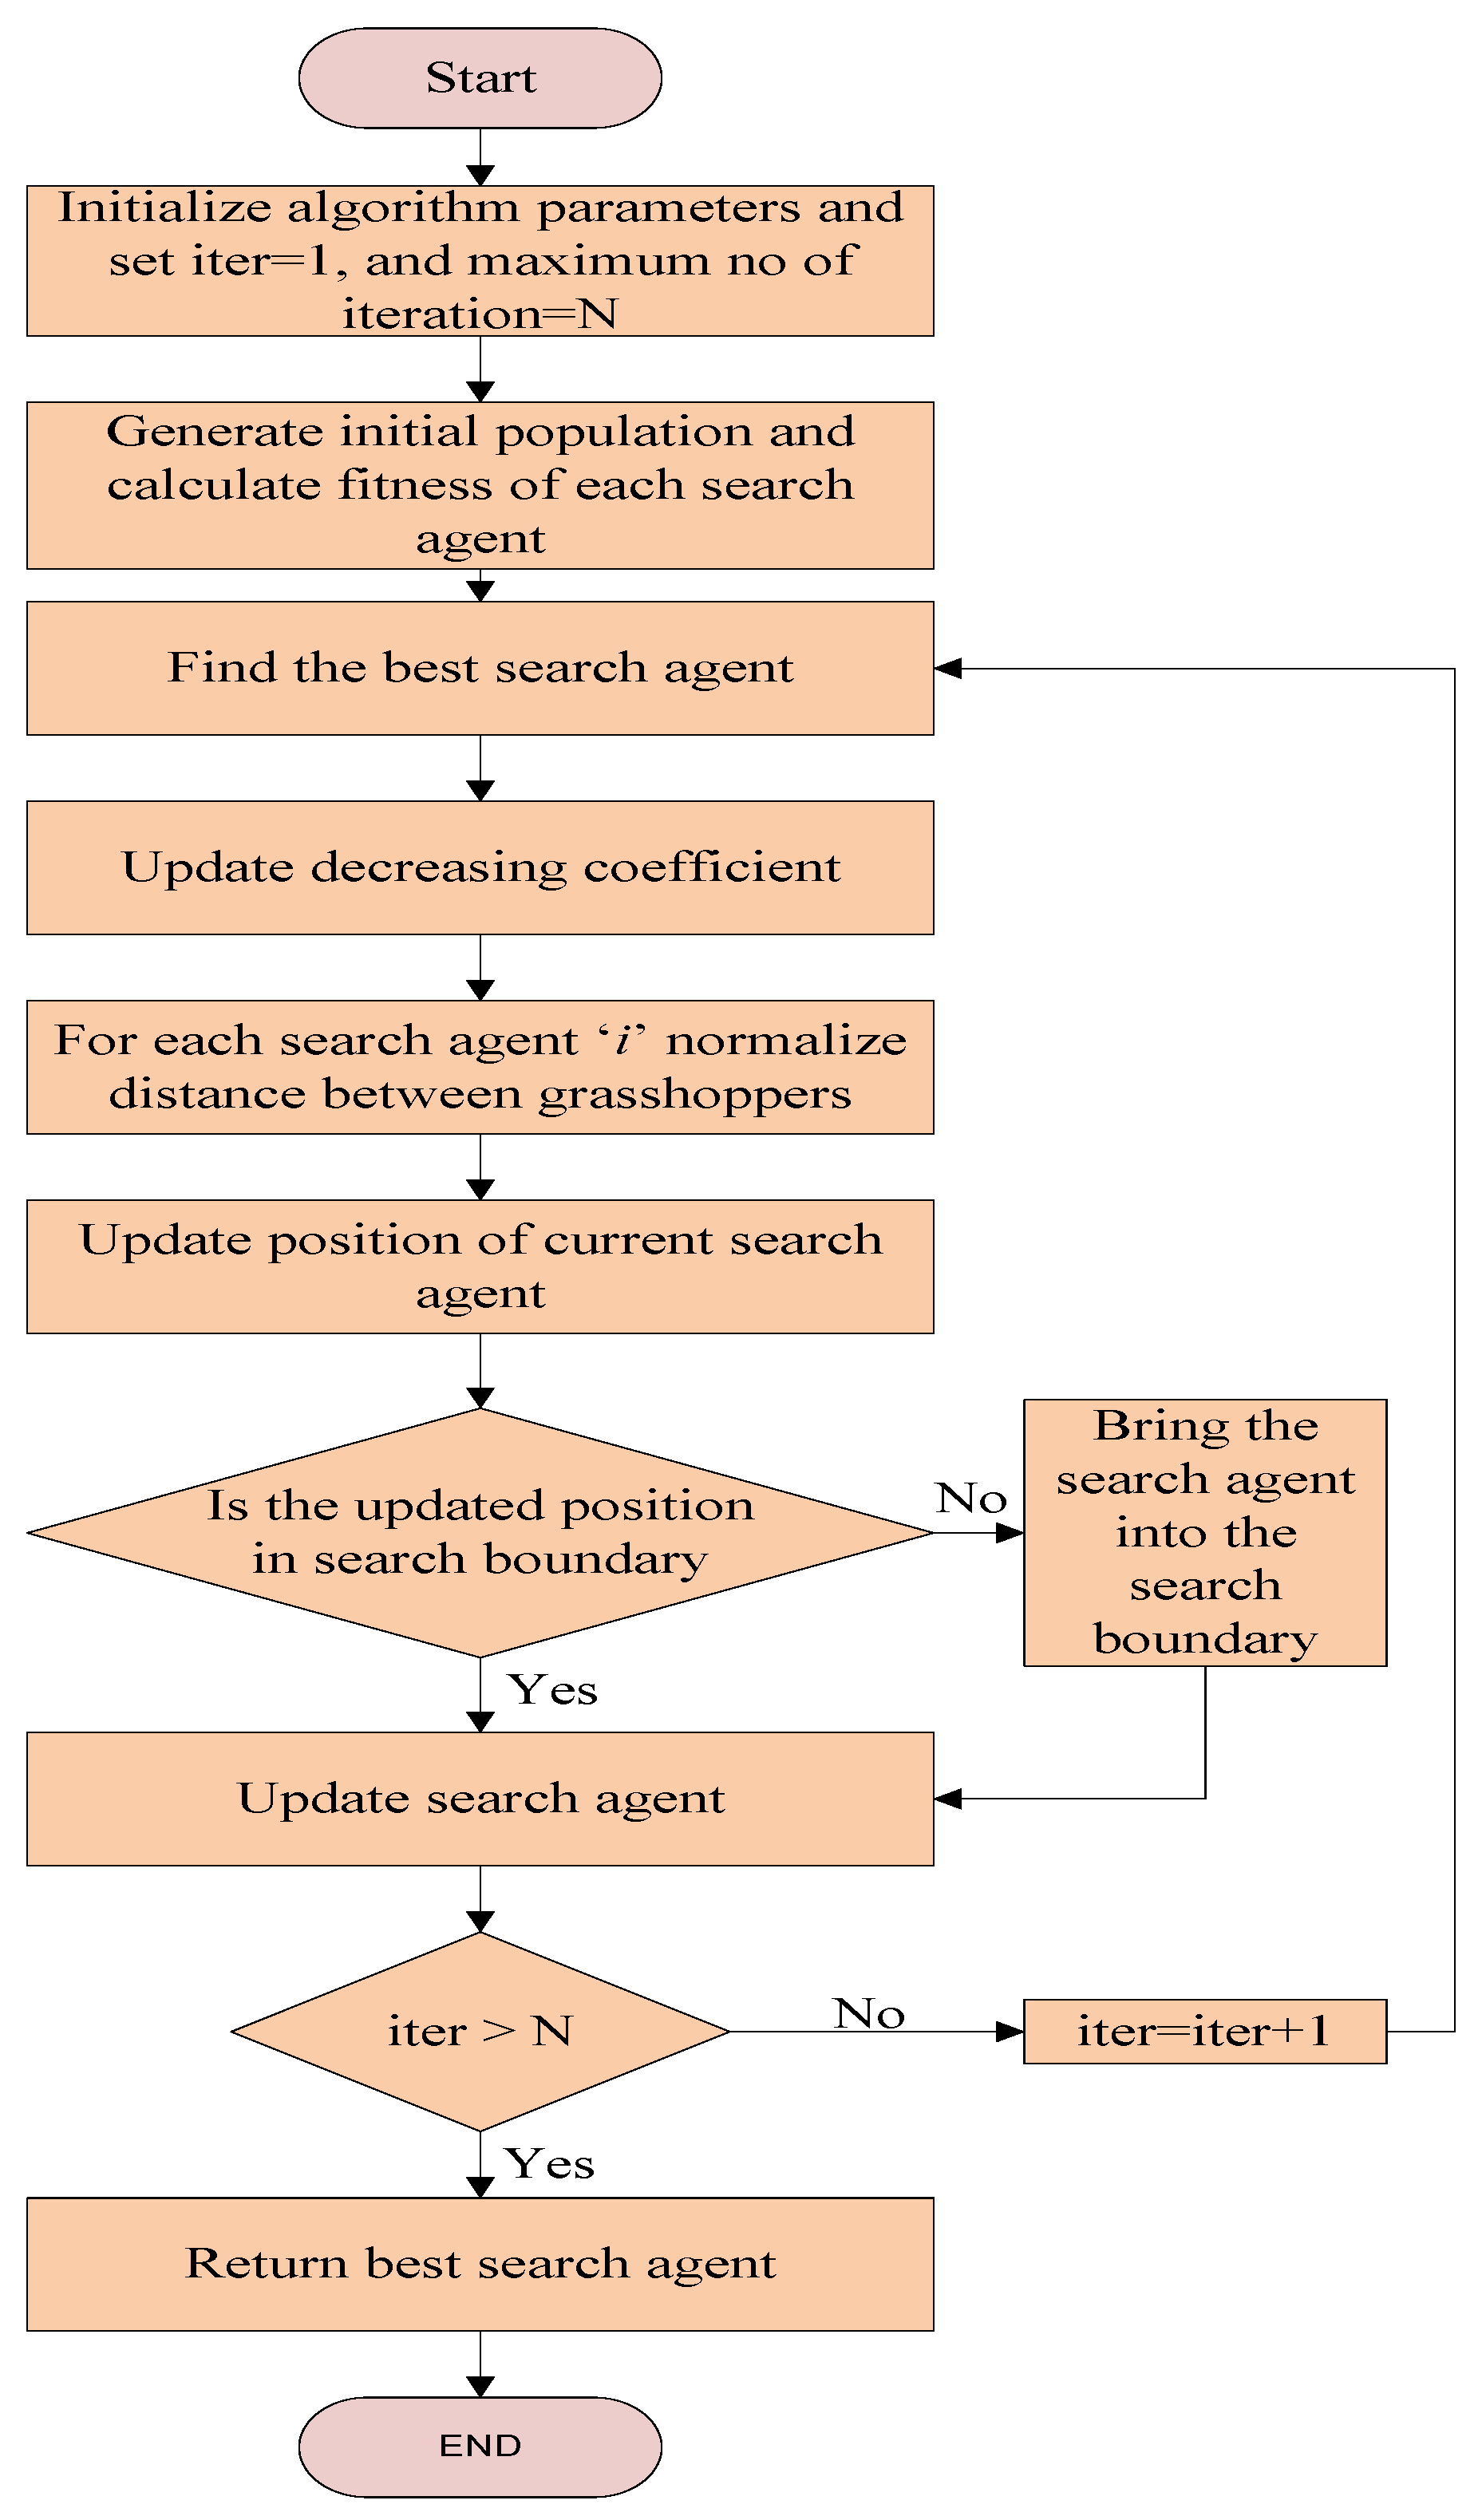
TWS =TWP = 10 s is used in the present work and is pre-specified [20]. The objective is to determine the time constants along with gains associated with the controller. As Δ V q is zero during steady-state conditions, Vqref becomes constant. However, during dynamic conditions, the modulation of the injected series voltage Vq is done by applying a certain algorithm in order to damp out the system oscillations. Vqref can be assumed to be constant due to the slow operation of the power flow loop during the steady state. Thus, under dynamic conditions, the effective value of Vq can be formulated as
V q = V q r e f + Δ V q 1
With the help of any one of the remote signals like speed–deviation, tie-line power, or the deviation in the power angle, the system oscillation can be observed, and minimizing any one of such deviations could be the objectives of researchers. In the proposed work, the two objective functions that are considered are an integral time absolute error of speed deviation for the SMIB power system and that of speed signals corresponding to the inter-area and local oscillation modes. Both the objective functions are expressed below:
For the SMIB power system:
J = 0 t | Δ ω | t d t
For power systems consisting of multiple machines:
J = 0 t ( | Δ ω L | + | Δ ω I | ) t d t
where, t = time range of simulation.
The time domain simulation of the above power system model is performed for a specified time period for the purpose of the objective function. The range of the damping controller and PSS lie within the prescribed bounds. The aim of improving the system response in terms of settling time and overshoots is achieved by minimization of the objective function. Therefore, the optimization problem is expressed from the discussed design approach as follows:
Minimize J
Subject to
K 1 S min K 1 S K 1 S max   K 1 P min K 1 P K 1 P max K 2 S min K 2 S K 2 S max   K 2 P min K 2 P K 2 P max K 3 S min K 3 S K 3 S max   K 3 P min K 3 P K 3 P max K p s min K p s K p s max   K p p min K p p K p p max T 1 s min T 1 s T 1 s max   T 1 p min T 1 p T 1 p max T 2 s min T 2 s T 2 s max   T 2 p min T 2 p T 2 p max T 3 s min T 3 s T 3 s max   T 3 p min T 3 p T 3 p max T 4 s min T 4 s T 4 s max   T 4 p min T 4 p T 4 p max
It is to be noted that two gains, eight-time constant parameters, and six scaling factors are needed to be optimized for a SMIB system consisting of one damping controller and one PSS. Similarly, for a power system composed of multiple machines such as multiple PSSs and damping controllers, which is equivalent to the no. of generators, optimization is carried out on all the parameters.

4. GOA Method

It has been demonstrated that the Grasshopper Optimization Algorithm (GOA) [43] benefits from high exploration while exhibiting very fast convergence speed. Exploration and exploitation balance smoothly with the unique adaptive mechanism in this algorithm. These features possibly enable the GOA algorithm to deal with greater exploration of search space and outperform other methods. Furthermore, computational complexity is superior to that of many techniques, which is displayed in the literature. These powerful characteristics of the GOA technique motivated us to propose this present study.

Overview of GOA

Grasshoppers are an insect. Because of their harm to agriculture and crop production, they are treated as a pest. A real grasshopper is shown in Figure 5. The life cycle of grasshoppers appears in Figure 6. Grasshoppers show some substantial behaviors during the food search phase. Typically, grasshoppers engage themselves in groups and can form some of the largest swarms in the animal kingdom. The discovery of swarming activities in the same nymph and adult period characterizes the grasshopper group. As mentioned above, the nature-inspired methods reasonably split the search space into two tendencies: exploration and exploitation. These two factors, as well as the seeking of food, are carried out by grasshoppers. Therefore, a mathematical model of grasshopper behavior can be designed by considering the above-discussed aspects.
The mathematical model designed in this paper for the swarming behavior of grasshoppers is presented below:
X i = S i + F i + W i
where X i symbolizes the i-th grasshopper’s position, social interaction denotes S i , F i is the nth grasshopper’s gravitational force, and W i denotes wind speed factor. The above circumstances can be constructed as X i = r 1 I i + r 2 F i + r 3 W i . The above-mentioned r 1 , r 2 , and r 3 are randomized values selected between [0, 1].
S i = l = 1 l k N s ( d k l ) . d ^ k l
where d k l signifies the distance of k-th from l-th grasshopper and may be calculated as d k l = | X l X k | and s is the force that describes the potency of social interaction forces and d ^ k l = X l X k d k l is a unit vector from k-th grasshopper to l-th grasshopper. This is known as social interaction forces (s function), and is calculated as:
s ( r ) = a e r l e r
where a signifies intensity of attraction and l indicates attractive length scale.
This function s describes the effect on grasshopper communal interaction gathered from [39]. We consider the distance of function s between 0 and 15 as in [43]. It is worth noting that the repulsion occurs when the distance lies between 0 and 2.079. No attraction or repulsion occurs when the distance between two grasshoppers is 2.079. It is called the comfort zone. According to [43], the attraction steadily increases from 2.079 to 4 distance units before slowly decreasing beyond 4 distance units. The change in parameter values l and a in Equation (8) leads to various social behaviors of artificial grasshoppers. Figure 7 depicts a pictorial representation of the comfort zone and social interaction of grasshoppers.
The function ‘s’ segregates the space between two grasshoppers into attraction, repulsion, and comfort zones. However, this function returns zero value if the separation between two grasshoppers is more than 10. Hence, with larger separation, this function fails to apply forces between two grasshoppers. Therefore, to address this issue, this paper mapped the separation between the grasshoppers to a value between 1 to 4. In Equation (6), the F component is calculated as:
F i = g e g
where the gravitational constant is denoted by g and the unity vector directed towards the earth’s center is represented by e g .
The component W in Equation (6) is estimated as
W i = u e w
where the drift constant is represented by u and the unity vector in the wind direction is denoted by e w .
In the nymph stage, a grasshopper does not have wings. Hence, its movement is predominantly influenced by wind speed. By replacing Equation (7), (9), and (10) in Equation (6), solving the grasshopper swarming behavior can be represented as follows:
X i = l = 1 l k N s ( | X l X k | ) X l X k d k l g e g + u e w
where N is the number of grasshoppers. As nymphs primarily stay on the ground, their location should lie below the threshold value. However, we cannot use this equation in this optimization algorithm because it avoids the search space condition such as exploration and exploitation. Nevertheless, this model cannot be utilized specifically to explain optimization issues, mostly because the grasshoppers quickly attain the comfort zone and the swarm does not converge to a predetermined point. To resolve the optimization problems, a modified form of the above equation is considered as follows.
X i d = c ( l = 1 l k N c u b d l b d 2 S ( | X l d X k d | ) X l X k d k l ) + T d
where u b d and l b d represent upper and lower bounds, respectively, in the dimension D-th dimension, The target value denotes T d and c is a decreasing constant that reduces the attraction, repulsion, and comfort zones. In Equation (12), the term S represents social interaction, as in Equation (6). Gravity is ignored in Equation (11) and the wind direction is assumed to always be towards the target.
The first term of Equation (12) gives information about the position of the other grasshopper and the interaction between them in nature. The second term counts the tendency of them to move toward the food. In Equation (12), the parameter c represents the grasshopper’s deceleration as it approaches and takes food. To increase the applicability of the optimization technique random behavior of the grasshopper is considered. To incorporate randomness into grasshopper interaction, each term in Equation (12) is multiplied by random variables. Exploiting and exploring the search space requires mathematical formulas and tuning the level of exploitation and exploration requires a search agent. In the nymph stage, the grasshopper search for food in the local search space due to the absence of wings. However, in the adult stage, they seek a larger search space region. In exploration, the grasshopper discovers a favorable place with a higher chance of finding food. Exploration arises first in this strategy, as it does in stochastic optimization because the first attention is on locating promising search space. Following exploration, exploitation is used to locate food in potential local locations in order to obtain the best global value. As the number of iterations increases, c has a significant impact on the grasshopper’s behavior. Outside c reduces the search space around the target maximum, whereas inner c reduces grasshopper attraction or repulsion forces.
The value of c should decrease relative to the number of iterations to maintain the proper balance between exploration and exploitation. This phenomenon encourages the algorithm towards exploitation as the number of iterations increases. The decreasing coefficient c diminishes the size of the comfort zone in proportion to iteration counts, as in Equation (13).
c = c m I c m c n L
where c m and c n are the maximum and minimum values, the current iteration is denoted by I , while the maximum number of iterations is denoted by L . The value of c m and c n in this technique are 1 and 0.00001, respectively. The proposed flowchart of the GOA technique is represented in Figure 8.

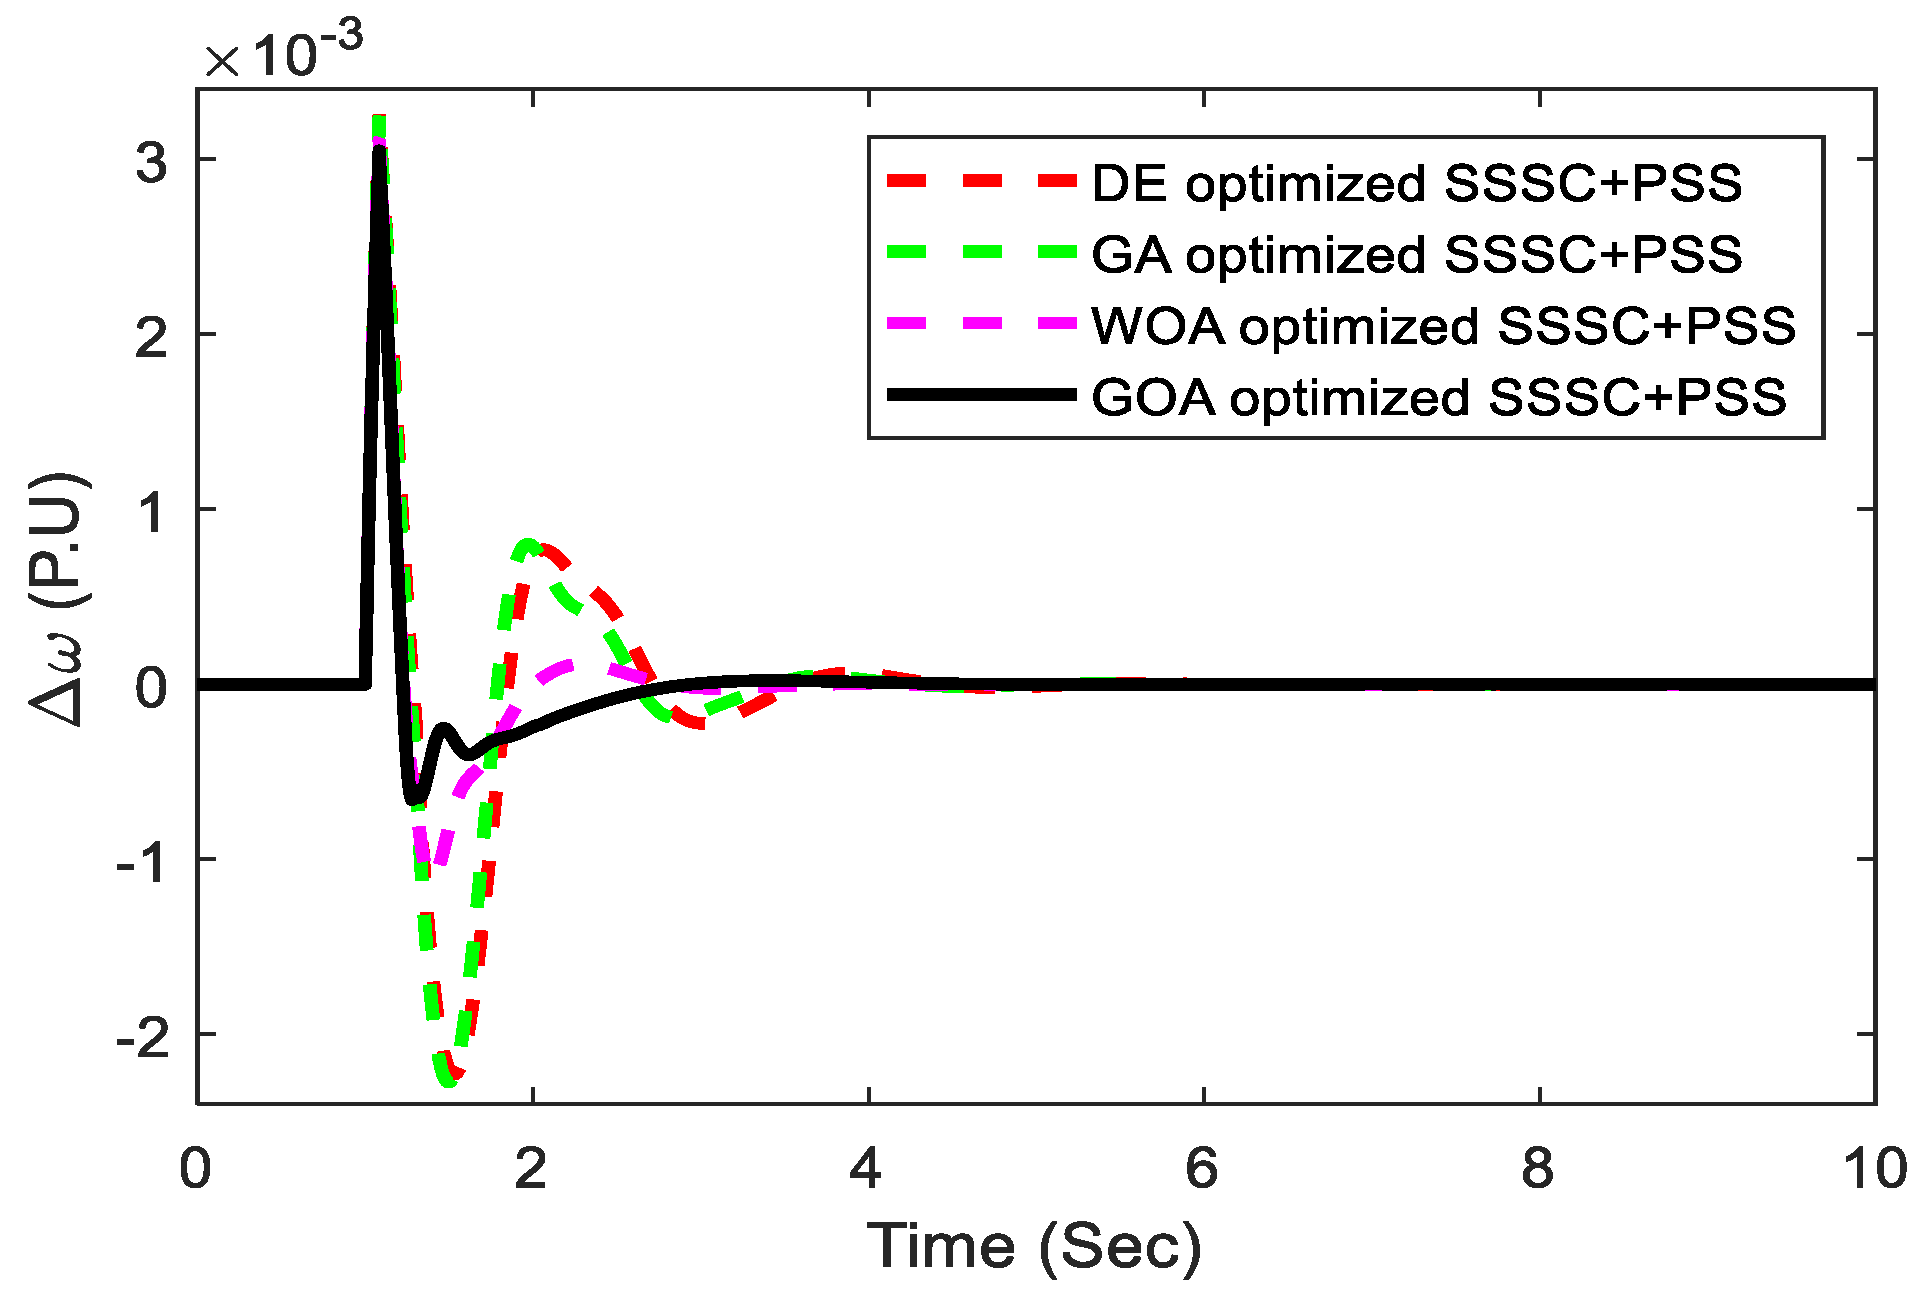
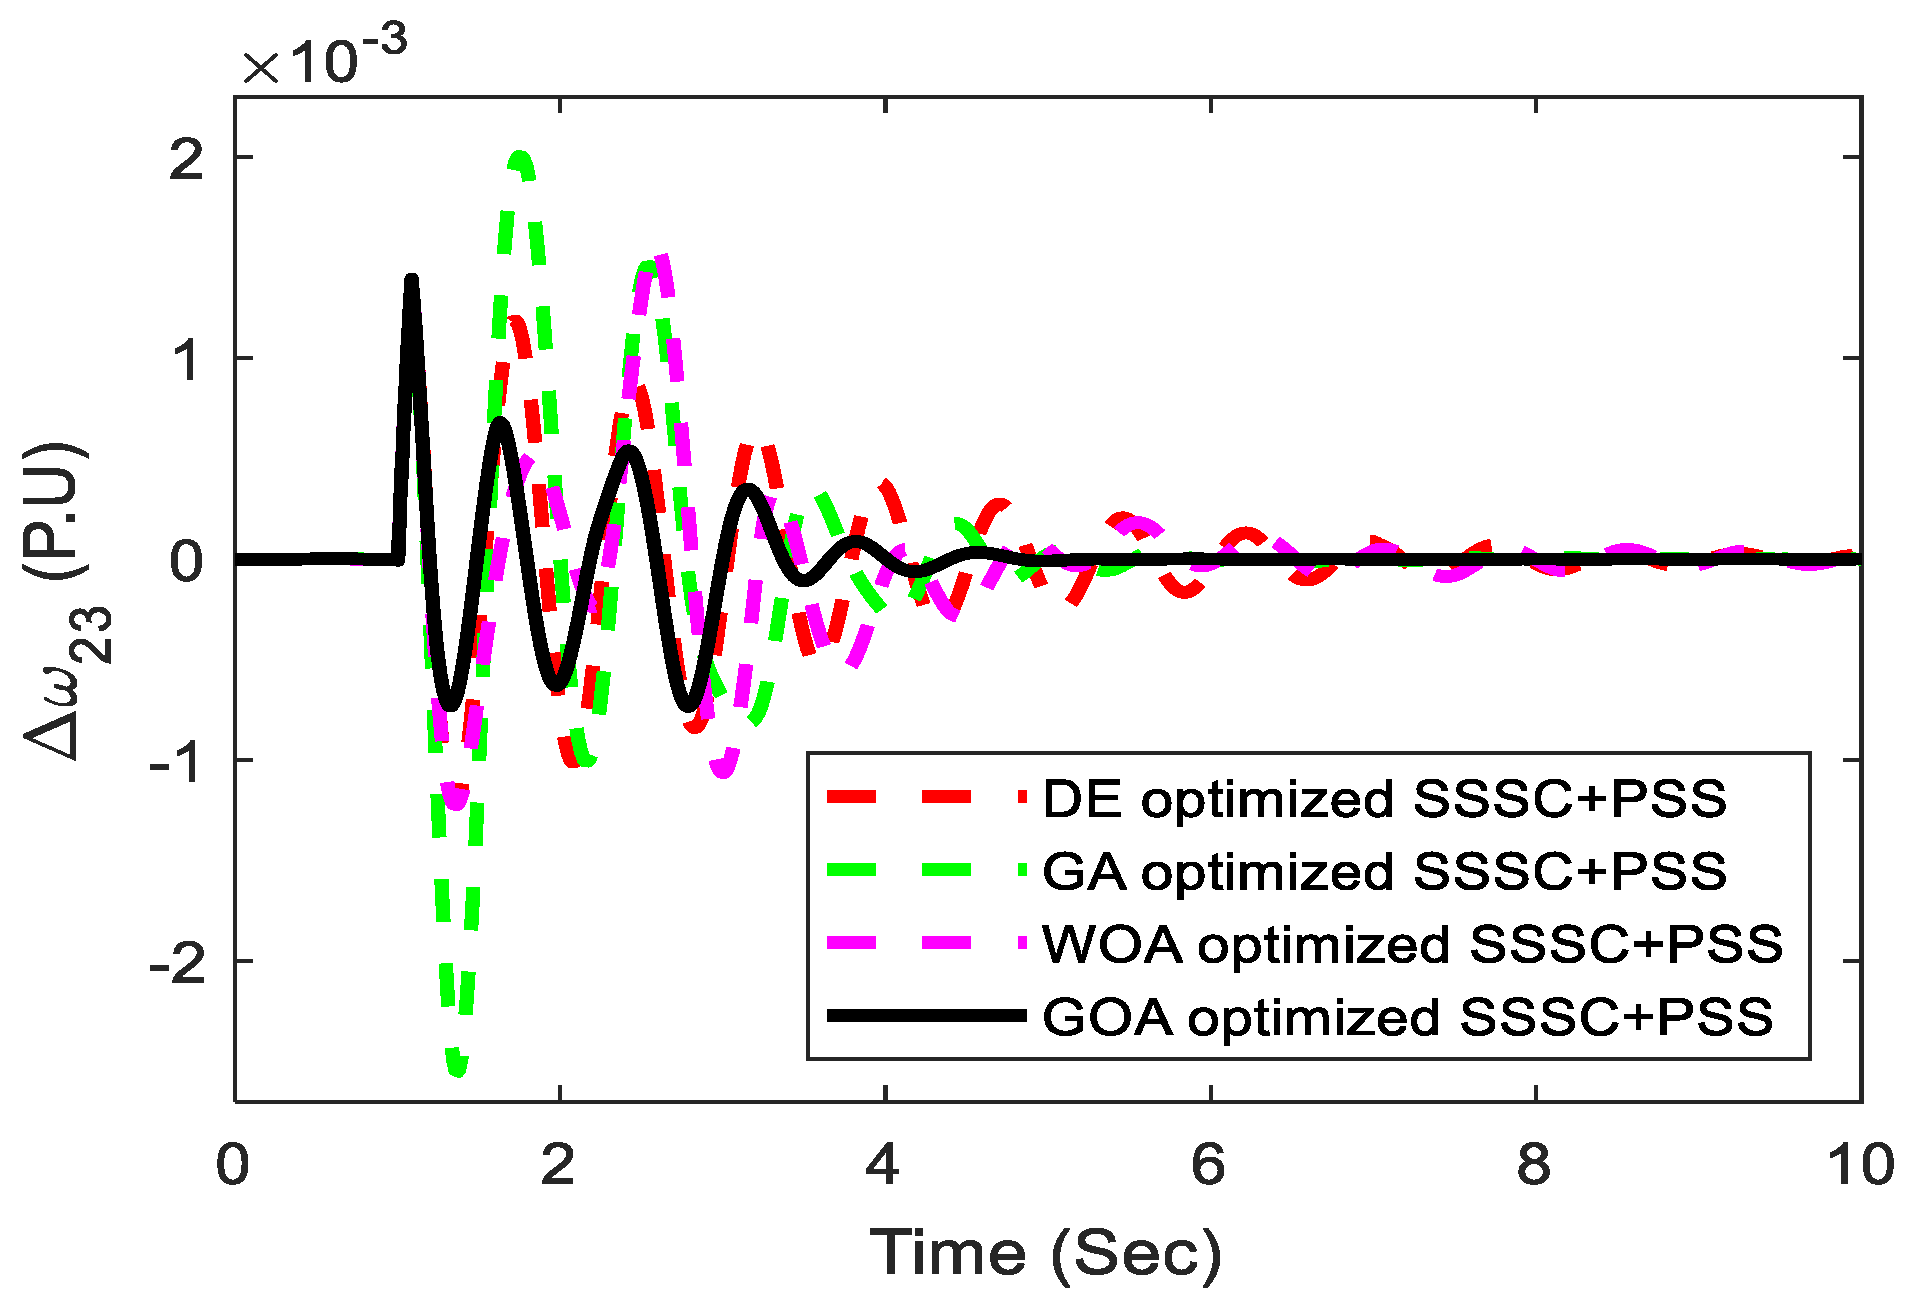
5. Results and Discussion

For the calculations and design of the damping controller, a toolbox named Sim Power Systems (SPS) was used extensively. Engineers may easily create and build models in the SIMULINK environment with the MATLAB-based design tool SPS. Models of typical power equipment such as transformers, transmission lines, power electronics, and machines, are all present in its libraries. Load flow and initialization of the three-phase machines can be performed with the help of the ‘Powergui’ block. Thus, the analysis of the developed models can be done by the graphical user interface (GUI) tools that are provided by it.

5.1. SMIB Power System

Figure 9 depicts the SMIB power system model designed in MATLAB consisting of a generating unit in connection with a double-circuited parallel line transmission line, generally. The above connection is established by connecting a step-up transformer and an SSSC in between. For tuning the proposed controller, the GOA algorithm is employed using an m file. Simulation of the entire model is done along with simultaneous calculation of the objective function owing to the occurrence of any disturbance in the system using the MATLAB R2016a environment. Further, the controller parameters can be found by minimization of the fitness values of Equation (2), whose optimization is carried out using the GOA algorithm. Table 1 displays the optimized parameters. To validate the dominance of the GOA technique, a comparison of the ITAE values of well-established GA, DE algorithm, and recently published WOA techniques have been made, as displayed in Table 2. In this proposed simulation work, different parameters have been initialized for the application of GOA, GA, DE, and WOA. Maximum no. of generation and population size is the common control parameters of the algorithms. In this paper, the comparison between the optimization techniques is carried out by considering the same search agents (30 search agents) and total iterations (500 iterations). The selection of various parameter values for the GOA algorithm must be made carefully for implementation and efficient performance. The following are the many cases that were chosen here:

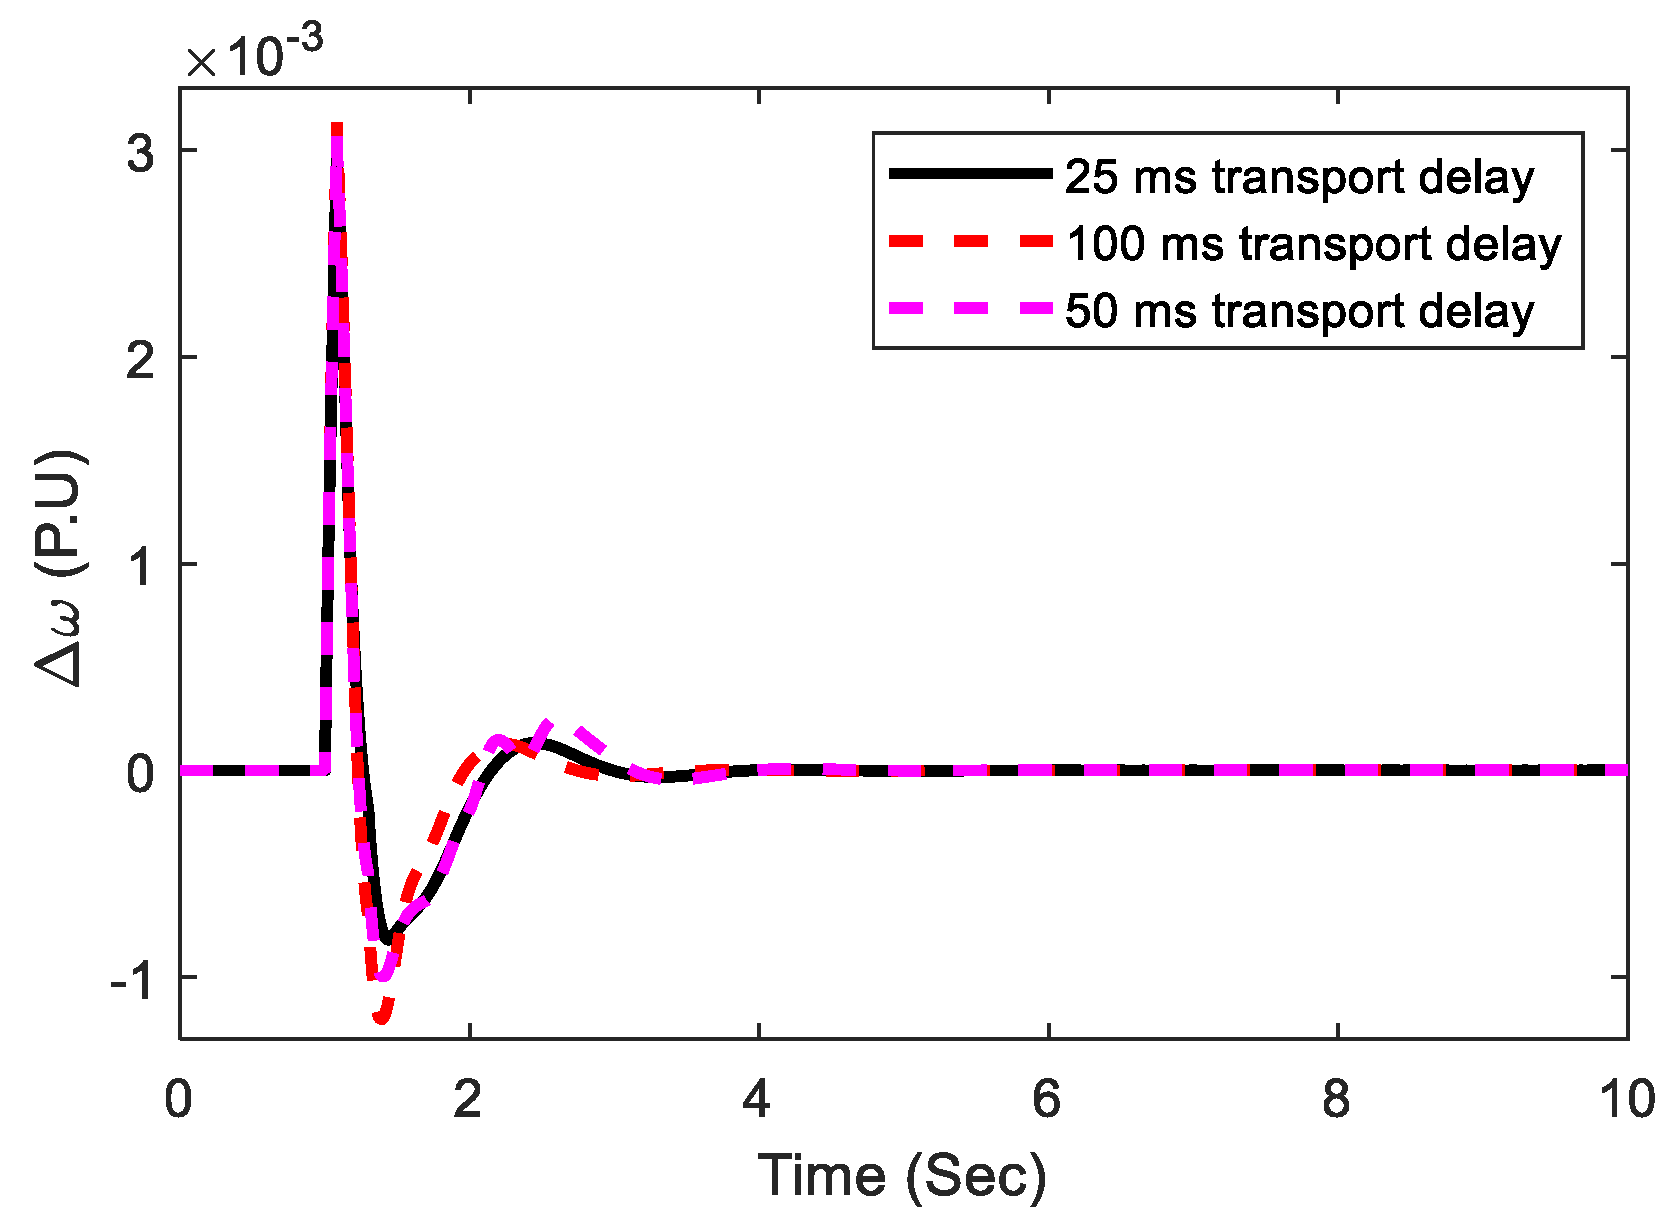
5.1.1. Case A: Nominal Loading Condition

The performance of the suggested controller is demonstrated at Pe = 0.85 pu and δ 0 = 52.3 deg, which are the nominal loading conditions in terms of the occurrence of a severe disturbance in the system. A 3-cycles, 3-phase fault is imposed at the mid-section of the transmission line linking bus-2 and bus-3 at time t = 1 s, and the system returns to its previous state after it is cleared. The system’s various responses are depicted in Figure 10, Figure 11, Figure 12 and Figure 13, including speed deviation in pu, tie-line power PL in MW, power angle in δ (degree), and SSSC injected voltage Vq in pu. From the different responses, we reached the conclusion that the GOA-optimized suggested controller provides improved dynamic response when compared with the well-established GA, DE algorithm, and recently published WOA-optimized controller. It can also be shown that the recommended GOA-optimized controller has good low-frequency oscillation damping capabilities and can easily stabilize the device by adjusting the SSSC-injected voltage. In comparison with recently published WOA, DE, and GA-optimized controllers, the suggested technique offers improved dynamic response in terms of minimal overshoot, minimum undershoot, and settling time, as shown in Figure 10, Figure 11, Figure 12 and Figure 13. As a result, the suggested controller increases the restriction on power system stability and capacity. Figure 14 displays various transmission delays considering speed deviation. Here it is observed that transport delays have a significant inverse effect on the system responses.

5.1.2. Case B: Light Loading Condition

To test the superiority of the suggested controller, the generator’s loading state is changed to light loading (Pe = 0.5 pu and δ 0 = 33.23 deg). At the midpoint of the transmission line, a 5-cycle 3-phase fault arises, followed by load removal at t = 1.0 s at bus-1. Figure 15, Figure 16 and Figure 17 show the system’s response to this possibility, which clearly illustrates the quality of the suggested controller for changes in working conditions and types of disturbance. In addition, when compared with the well-known GA, DE algorithm, and the recently published WOA-optimized controller, the proposed GOA approach delivers improved transient response. It can be seen that the GOA-optimized coordinated design of the PSS and SSSC controller substantially suppresses the rotor angle swing, which provides good damping characteristics for electromechanical oscillation modes.

5.1.3. Case C: Heavy Loading Condition

The robustness of this controller is carried out in this condition (Pe = 1.0 pu and δ 0 = 60.73 deg). In this situation, the load is disconnected near bus 1 at t = 1.0 s for 300 ms. Figure 18 depicts the speed deviation response under heavy loading conditions. In comparison to the well-established GA, DE algorithm, and recently published WOA-optimized controller, the effectiveness of the GOA-optimized proposed controller provides more reliable performance. It is evident from the figure that system stability is retained, and power system oscillations with the proposed controllers are effectively damped out. The ITAE values for the three situations mentioned above are plotted in Figure 19 to demonstrate the enhancement by the proposed GOA technique.
The SMIB system’s transient response parameters using proposed controller optimized with DE/GA/WOA/GOA techniques are displayed in Table 3.

5.2. Extension to Multi-Machine Power System

The power system involving multiple machines and tie lines is represented in Figure 20. In between bus 5 and bus 6, the SSSC controller is placed as shown in Figure 20.
The various scenarios selected are as follows.

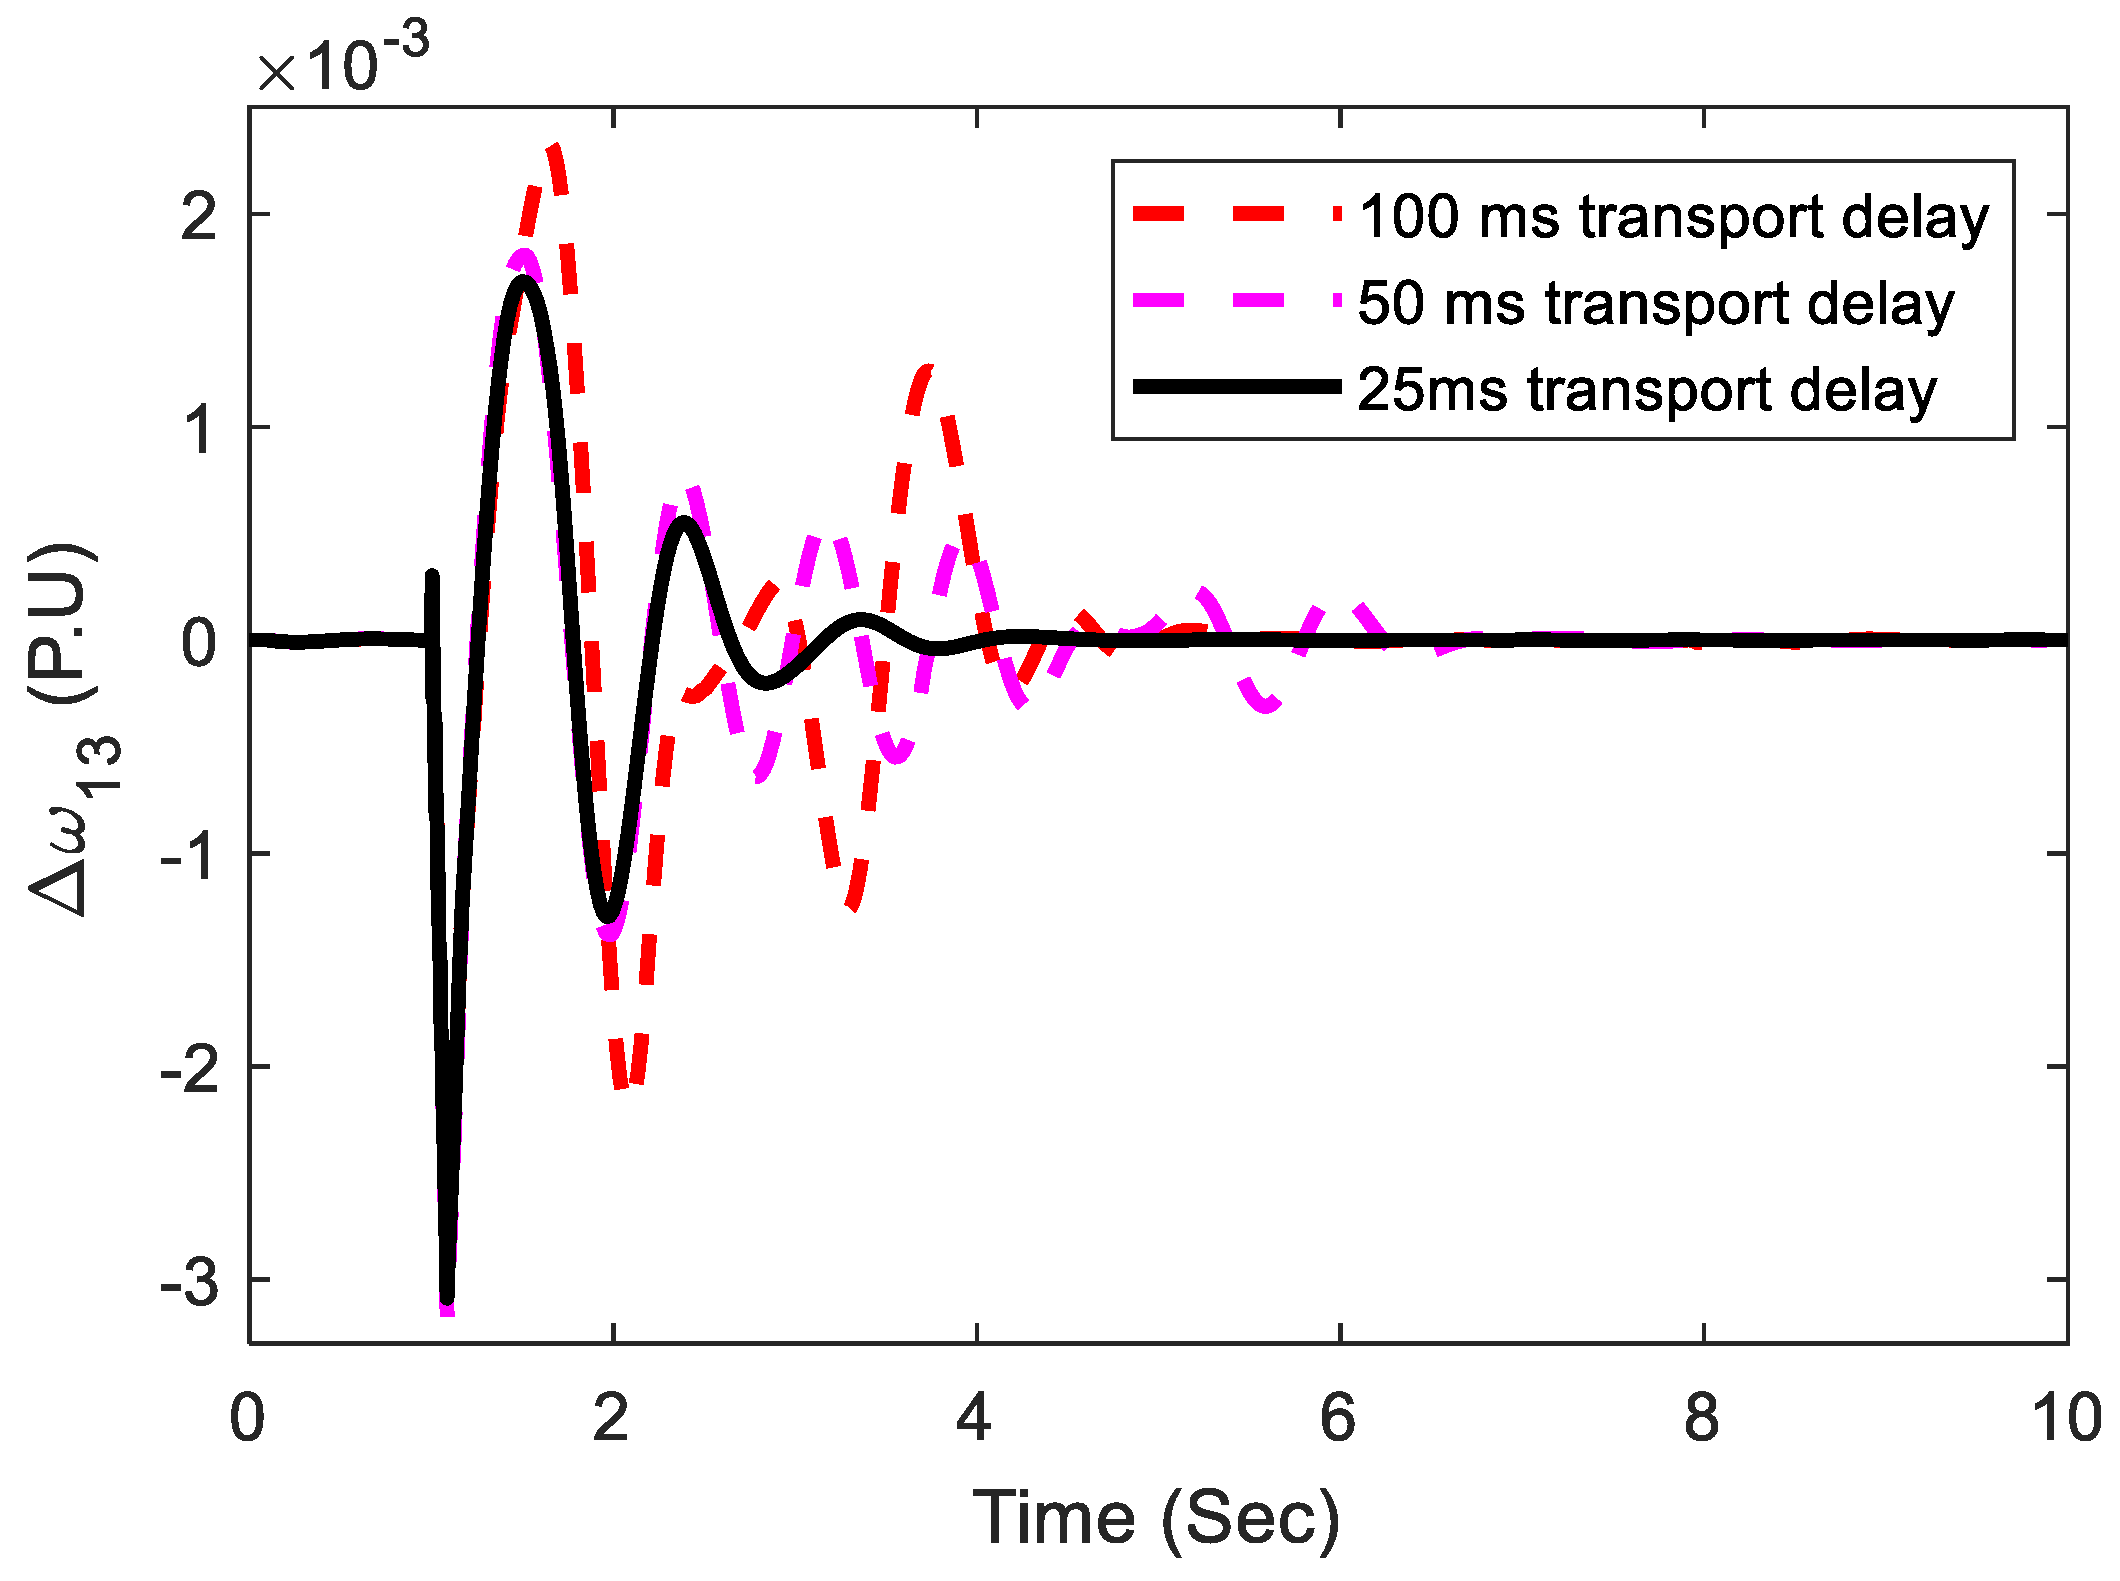
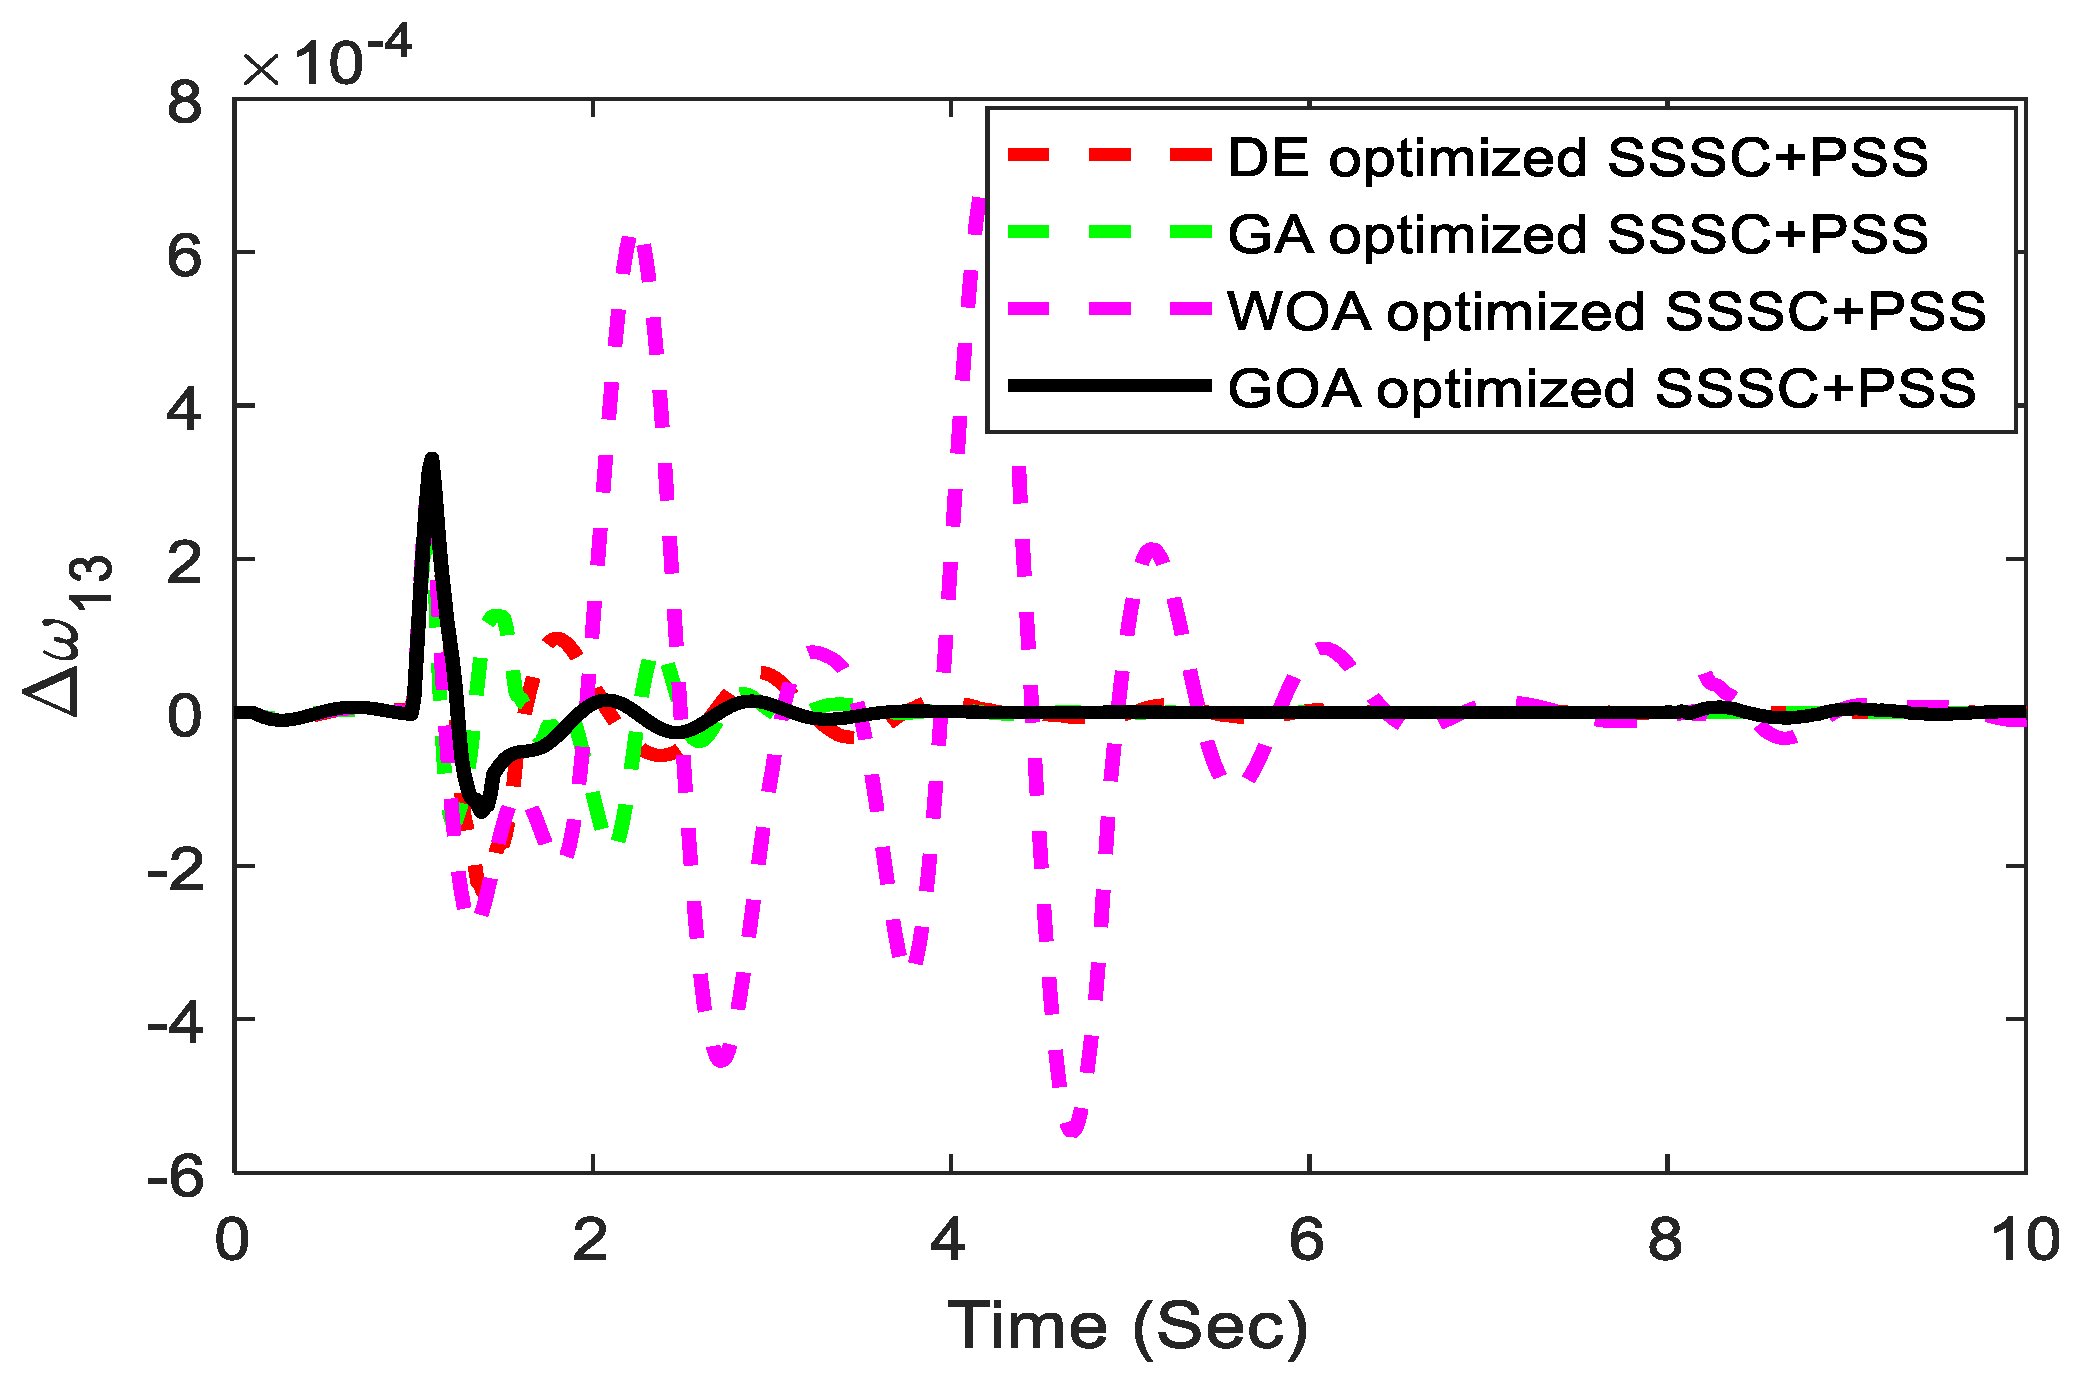
5.2.1. Scenario 1: Three-Phase Fault Disturbance

At t = 1 s, in one of the line sections joining bus 1 and bus 6, a 3-phase self-clearing fault is implemented. The duration of fault is taken as a 3-cycle. At bus 6, after clearing it, the system gains back to its original state. The response of the system is exposed in Figure 21 and Figure 22. From these figures, the local mode and inter-area modes of oscillations are observed to be greatly oscillatory in the absence of controllers. So, the suggested controllers aim at improving the stability of the power system significantly by modulation of the SSSC injected voltage and stabilization of the signals of PSSs and thereby suppress these oscillations. The effectiveness of the proposed coordinated design approach is examined by varying the transport delay signals.
Initially, a 50 ms time delay for signal transmission is considered. The effectiveness of the proposed control approach is examined by varying the delay time. Figure 23 and Figure 24 illustrate the response of the system, which shows that the variation in time delay doesn’t have a remarkable effect on the proposed controller performance.

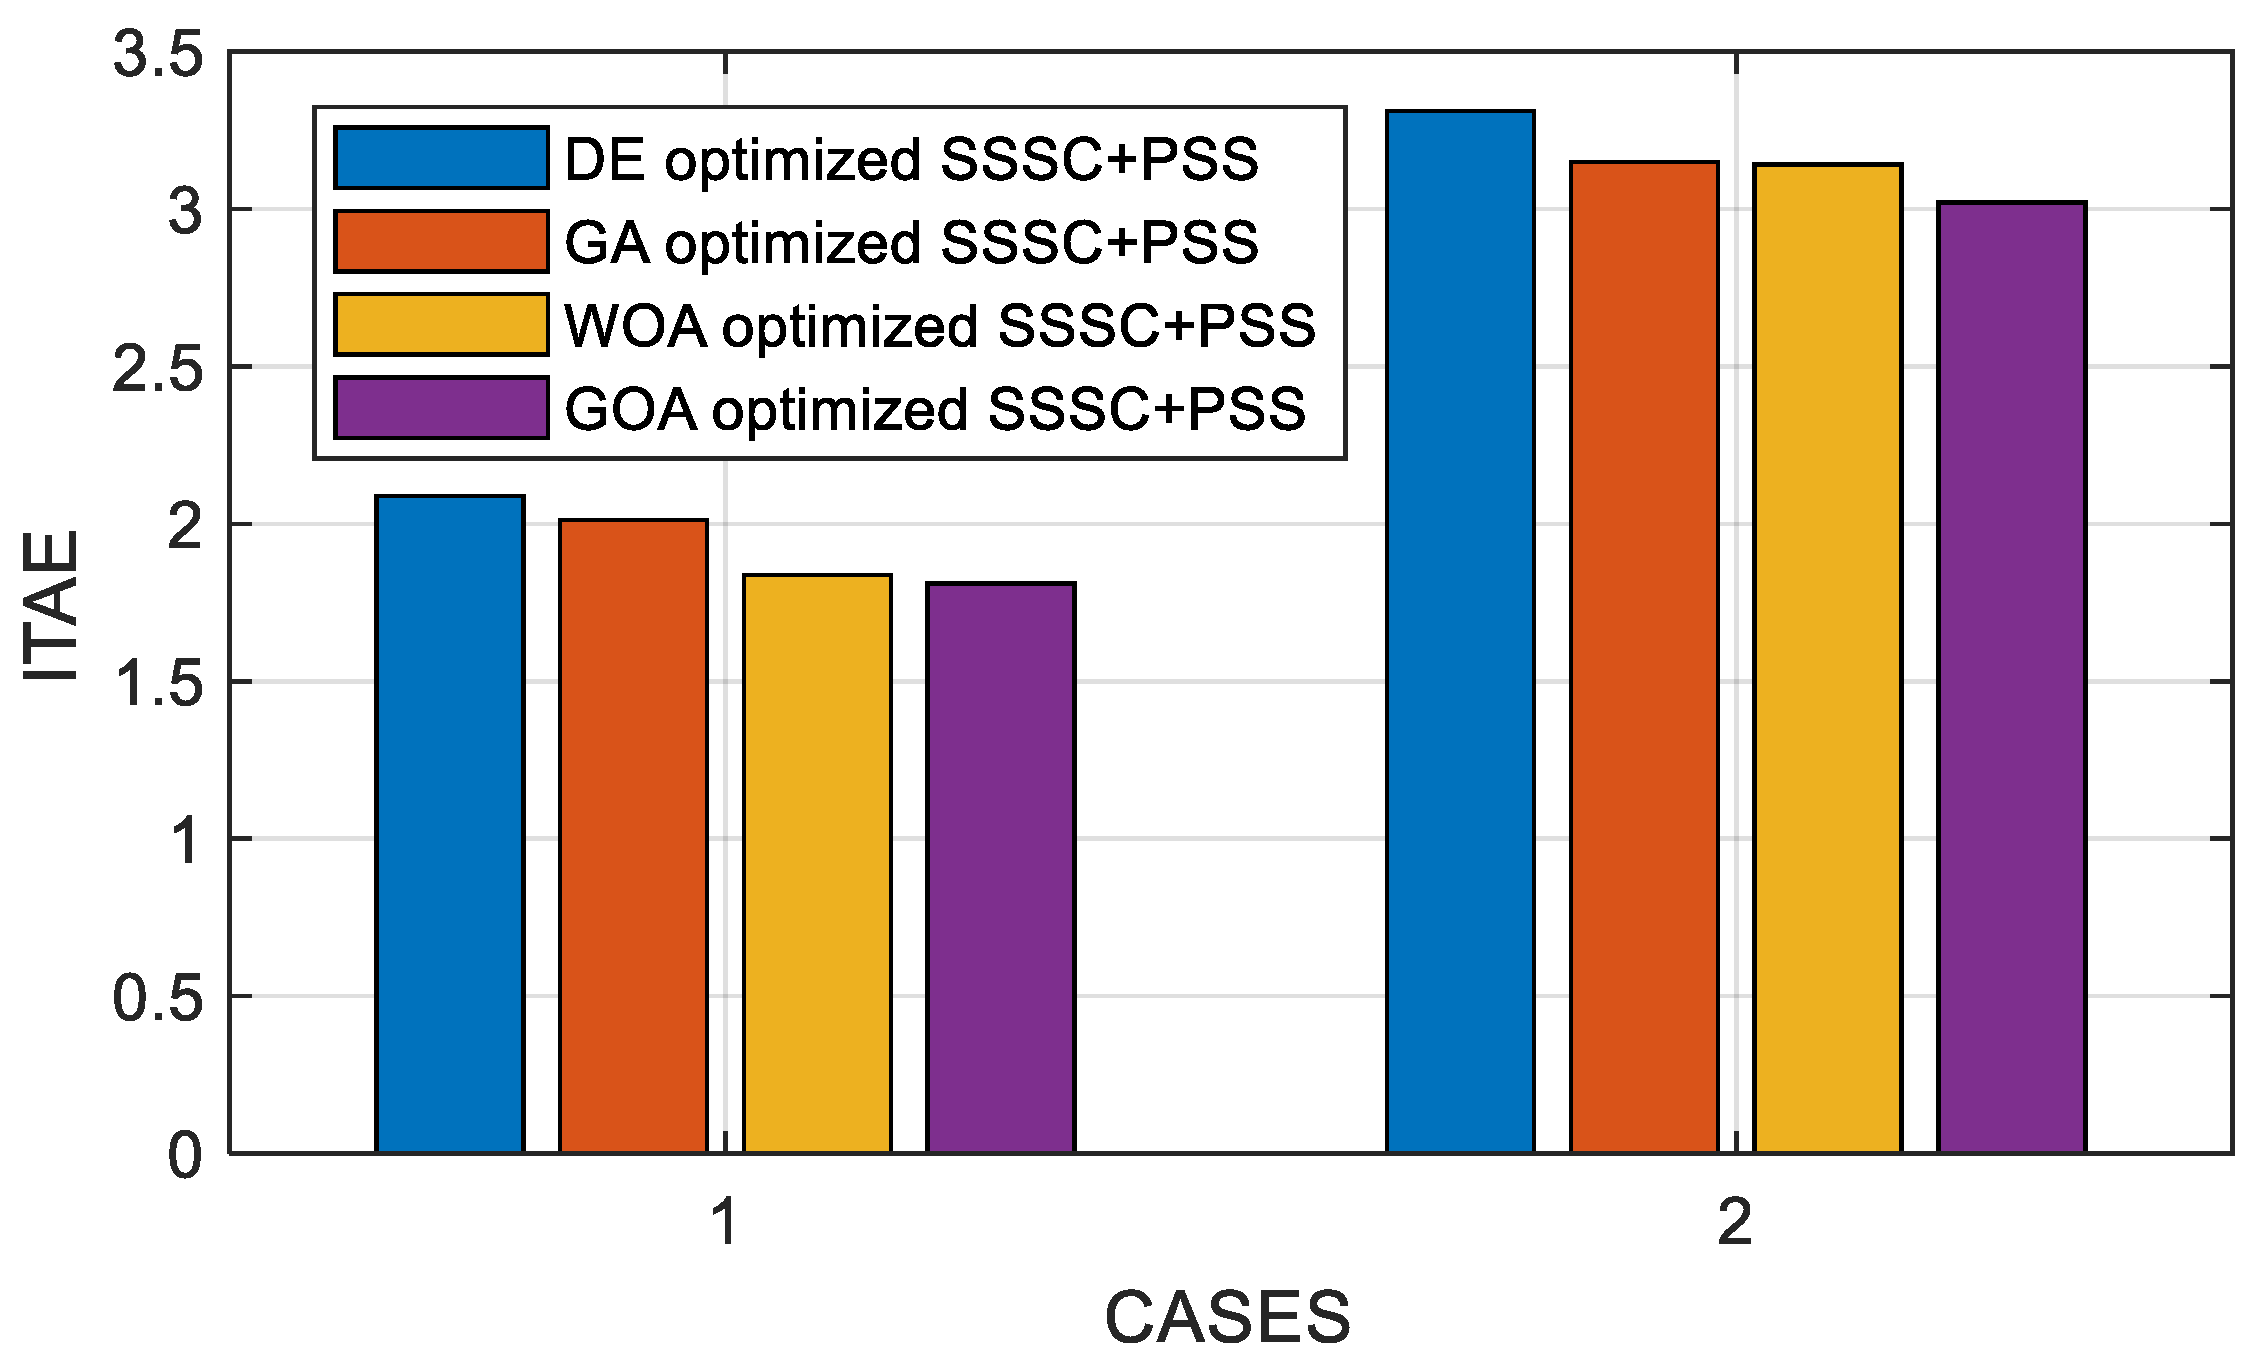
5.2.2. Scenario 2: Small Disturbance

Further, a small or minor disturbance in the system is considered to ensure the complete examination of the suggested controller’s performance. The small disturbance is simulated by detaching the load at bus 4 at t = 1.0 s for a duration of 100 ms. Figure 25 and Figure 26 illustrate the system response for the above-mentioned situation and from which the robustness and efficient damping ability of the proposed controller even under small disturbance conditions is clearly justified. The figure shows the efficacy of PSS and SSSC in the damping of low-frequency oscillations. From the figures, it is obvious that the GOA-optimized coordinated design is stable and ensures stability for large variations in loading conditions. As can be seen from Figure 25 and Figure 26, the proposed GOA-optimized controller significantly outperforms the WOA, DE, and GA-optimized proposed controller in terms of dampening power system oscillations and reducing settling time. The ITAE values for the above-mentioned two scenarios of the multi-machine system are displayed in a bar plot, as displayed in Figure 27, to better illustrate the improvement by the proposed approach.
Table 4 shows the optimum parameters of the proposed controller for multi-machine systems. Table 5 illustrates that GOA methods that take into consideration multiple instances had the lowest ITAE values when compared with DE, GA, and WOA methods.
From the simulation the following observations are made:
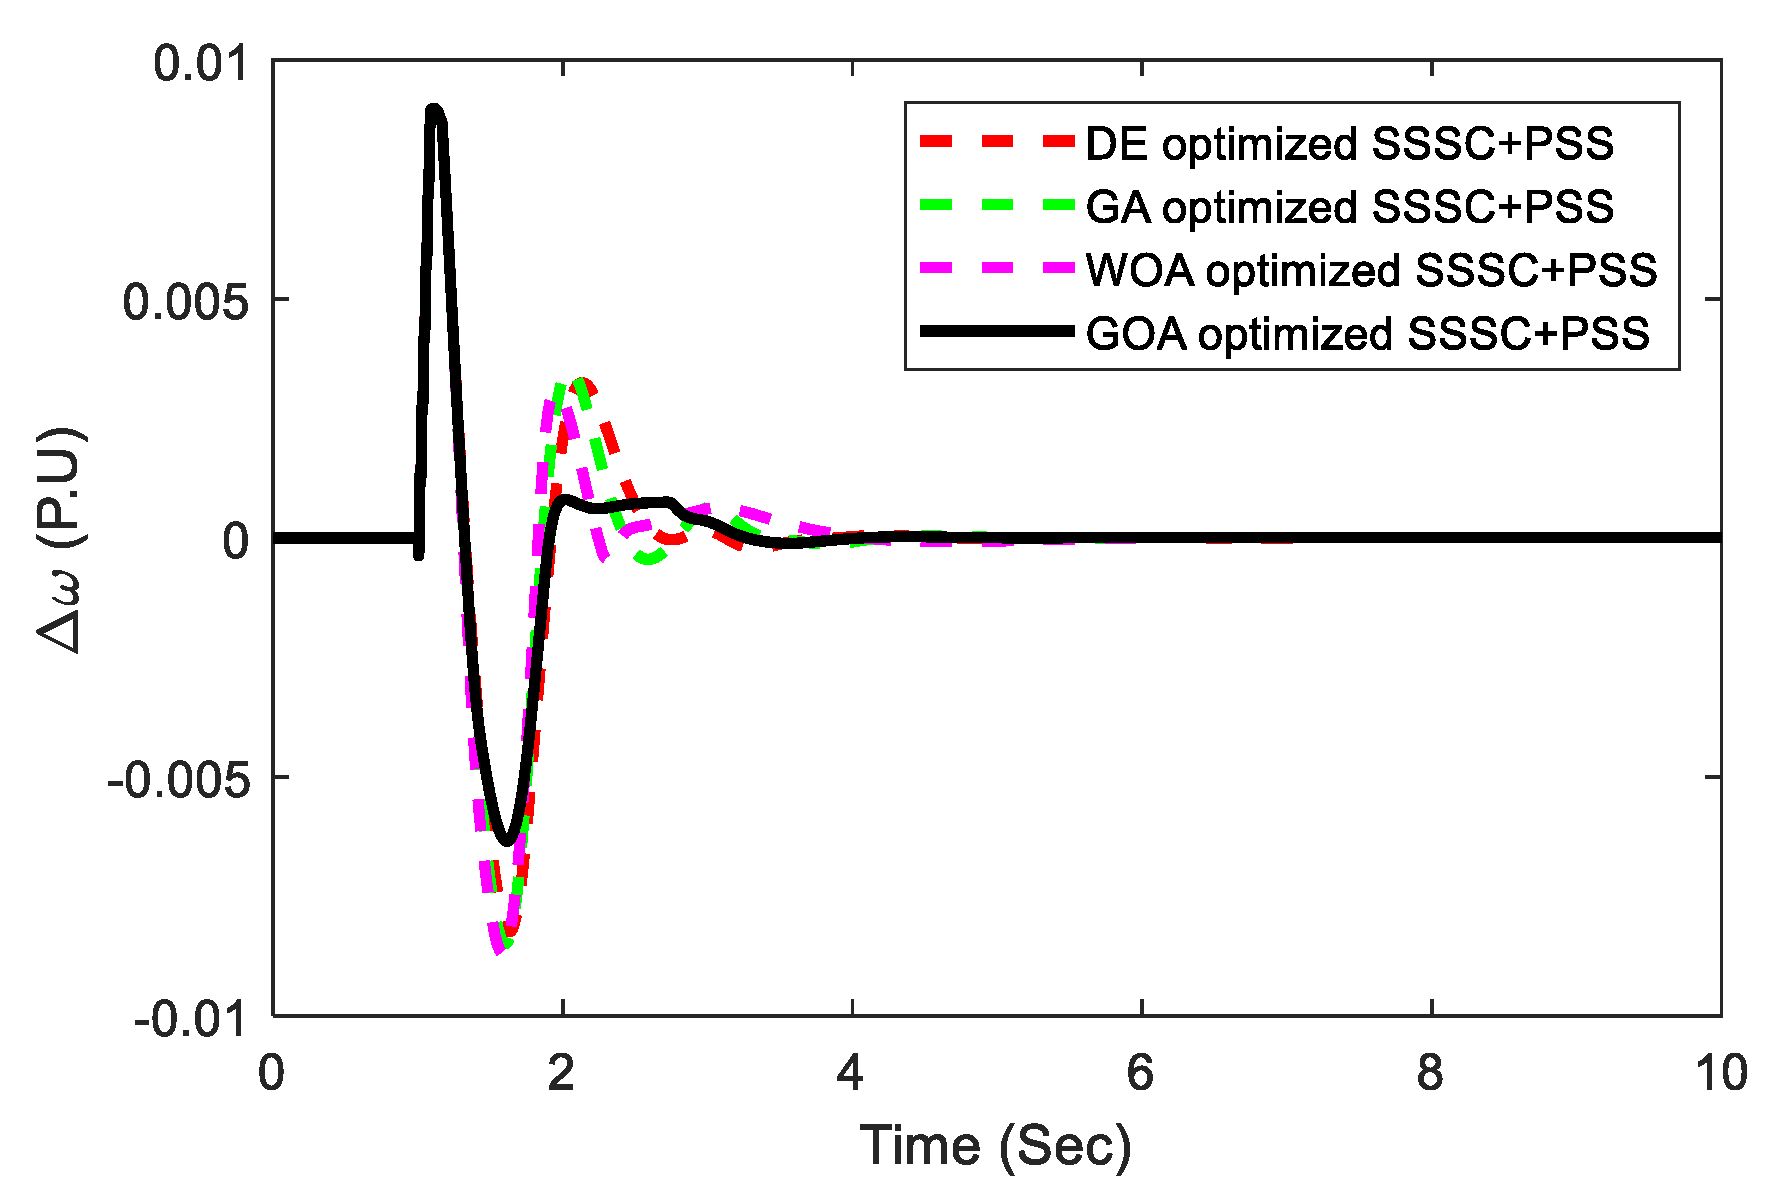
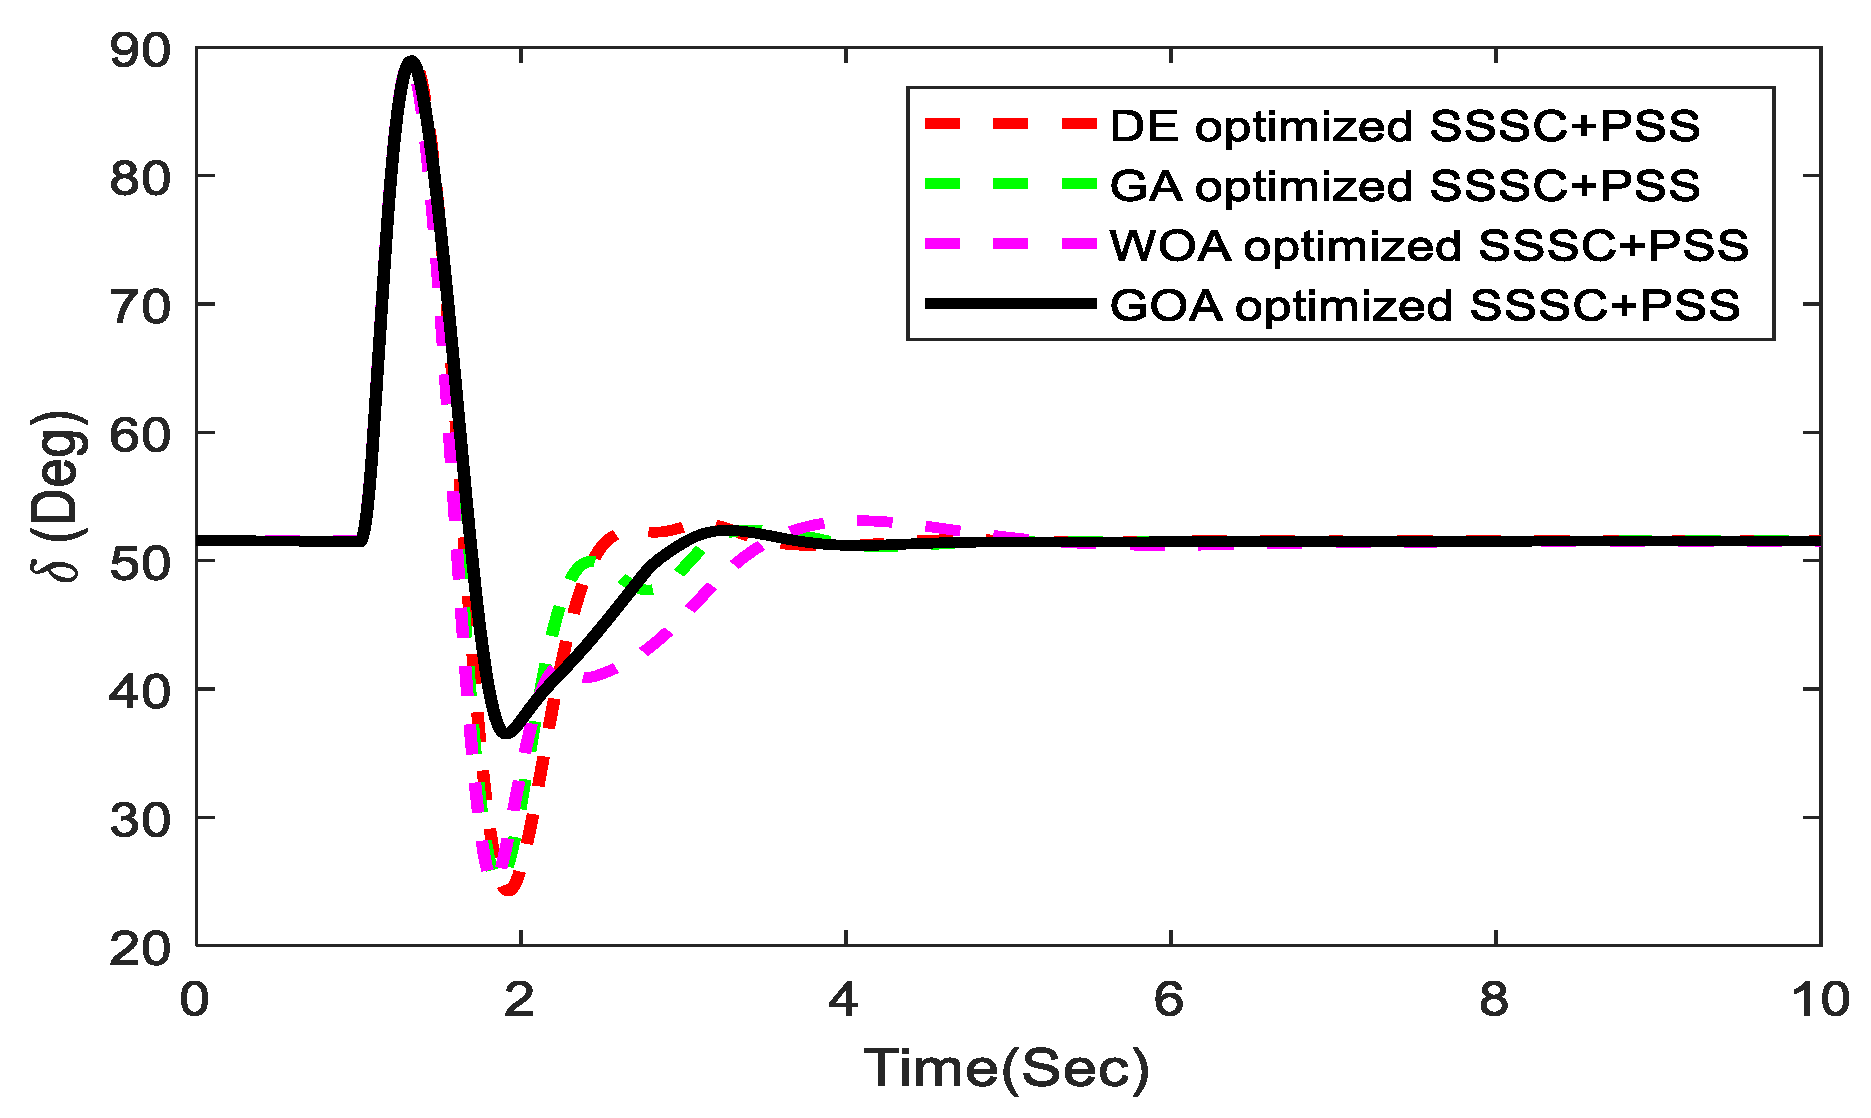
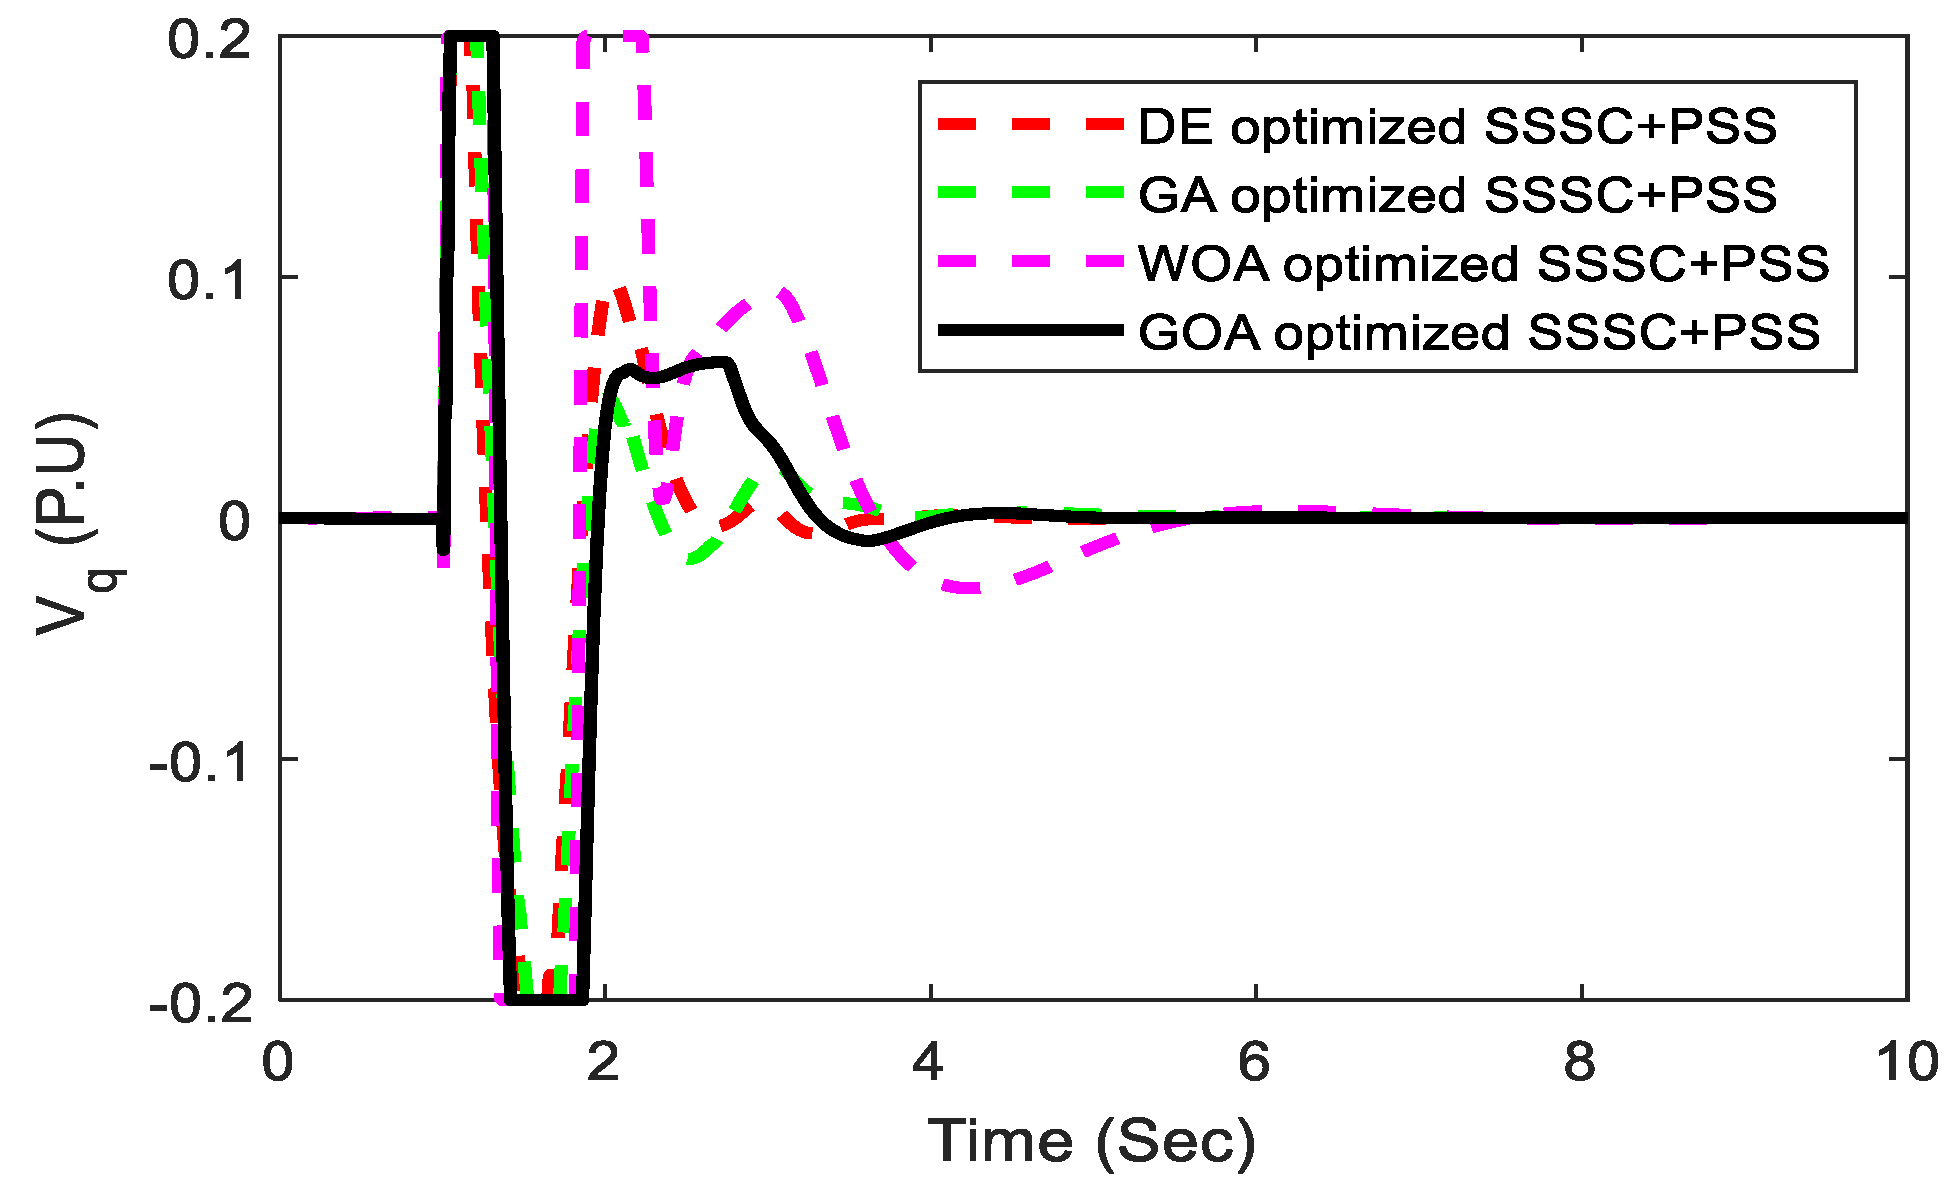
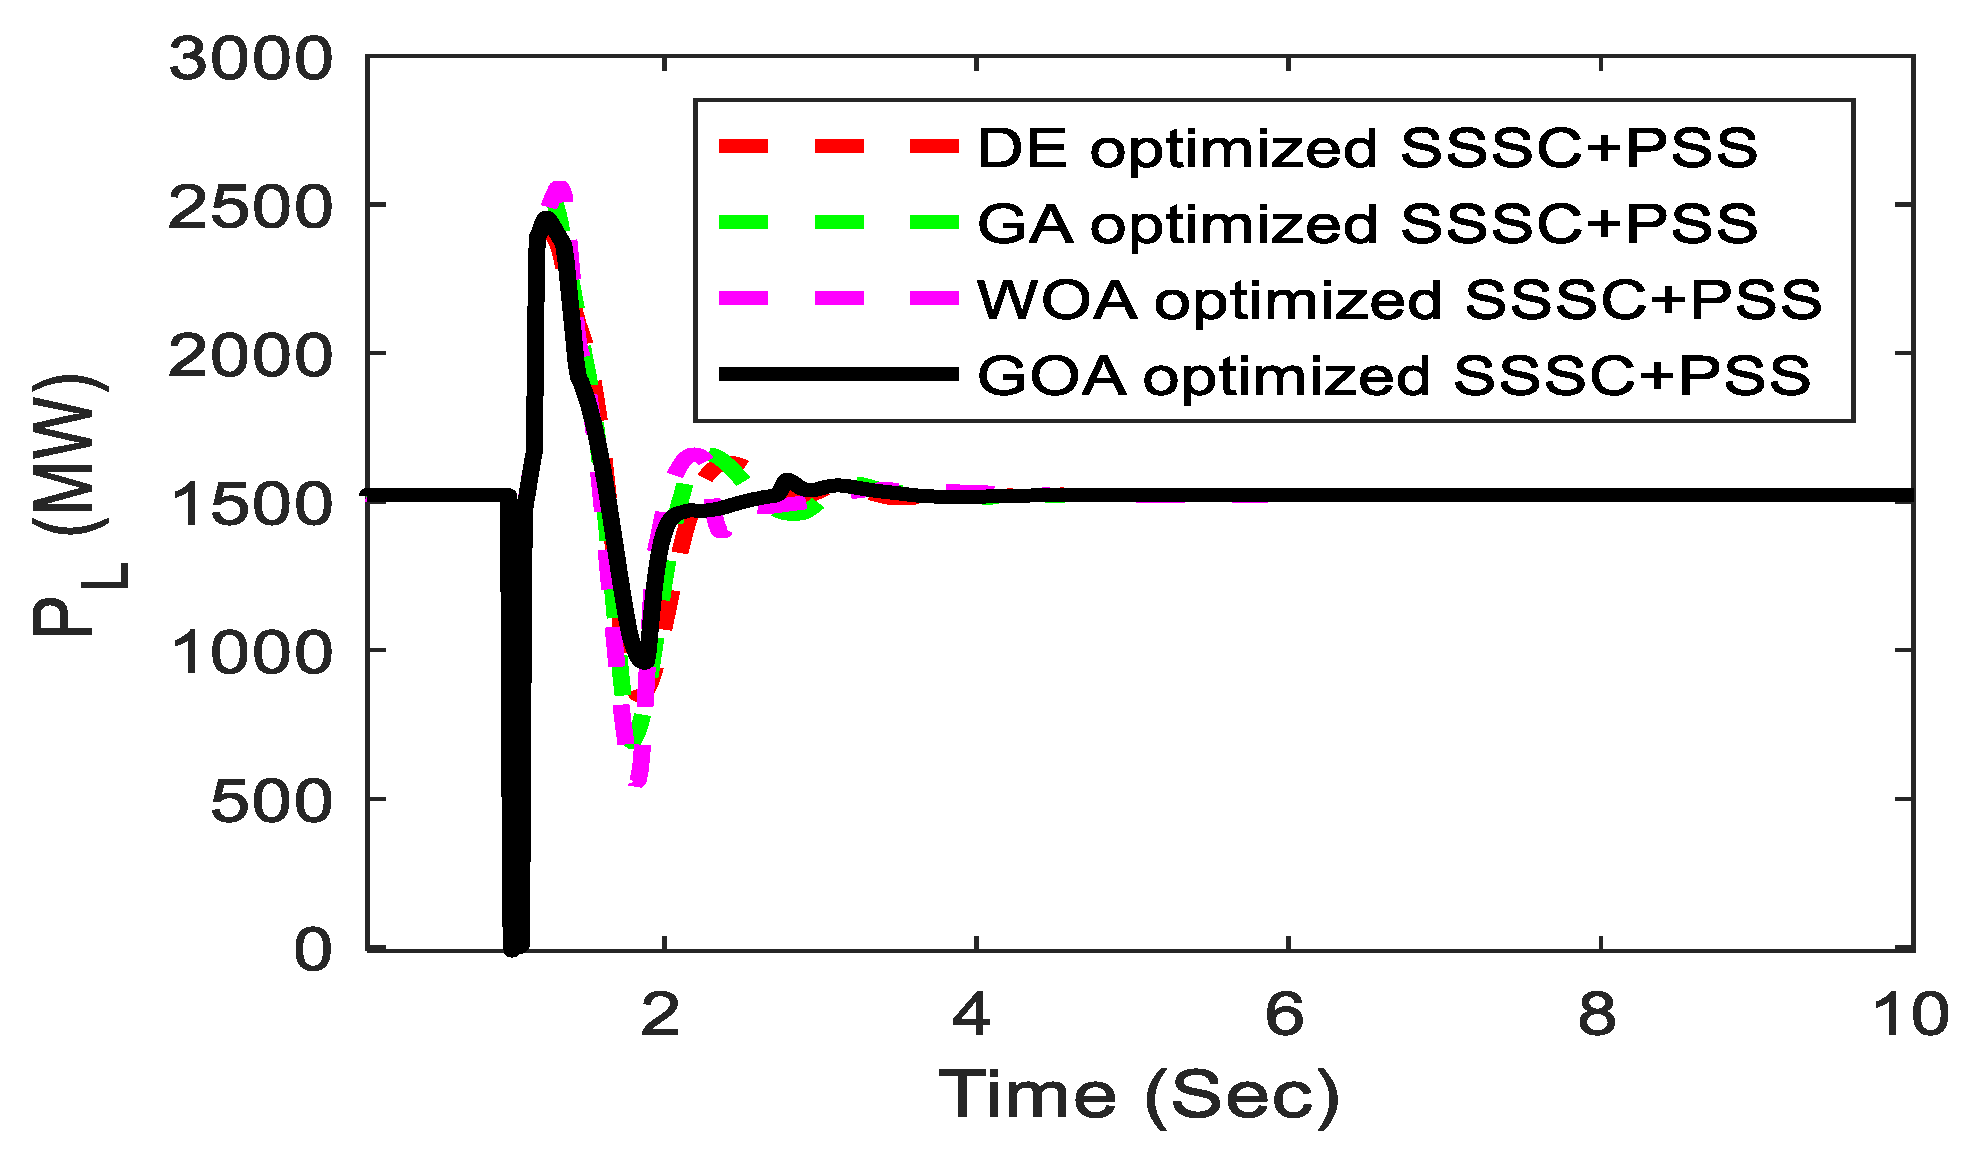
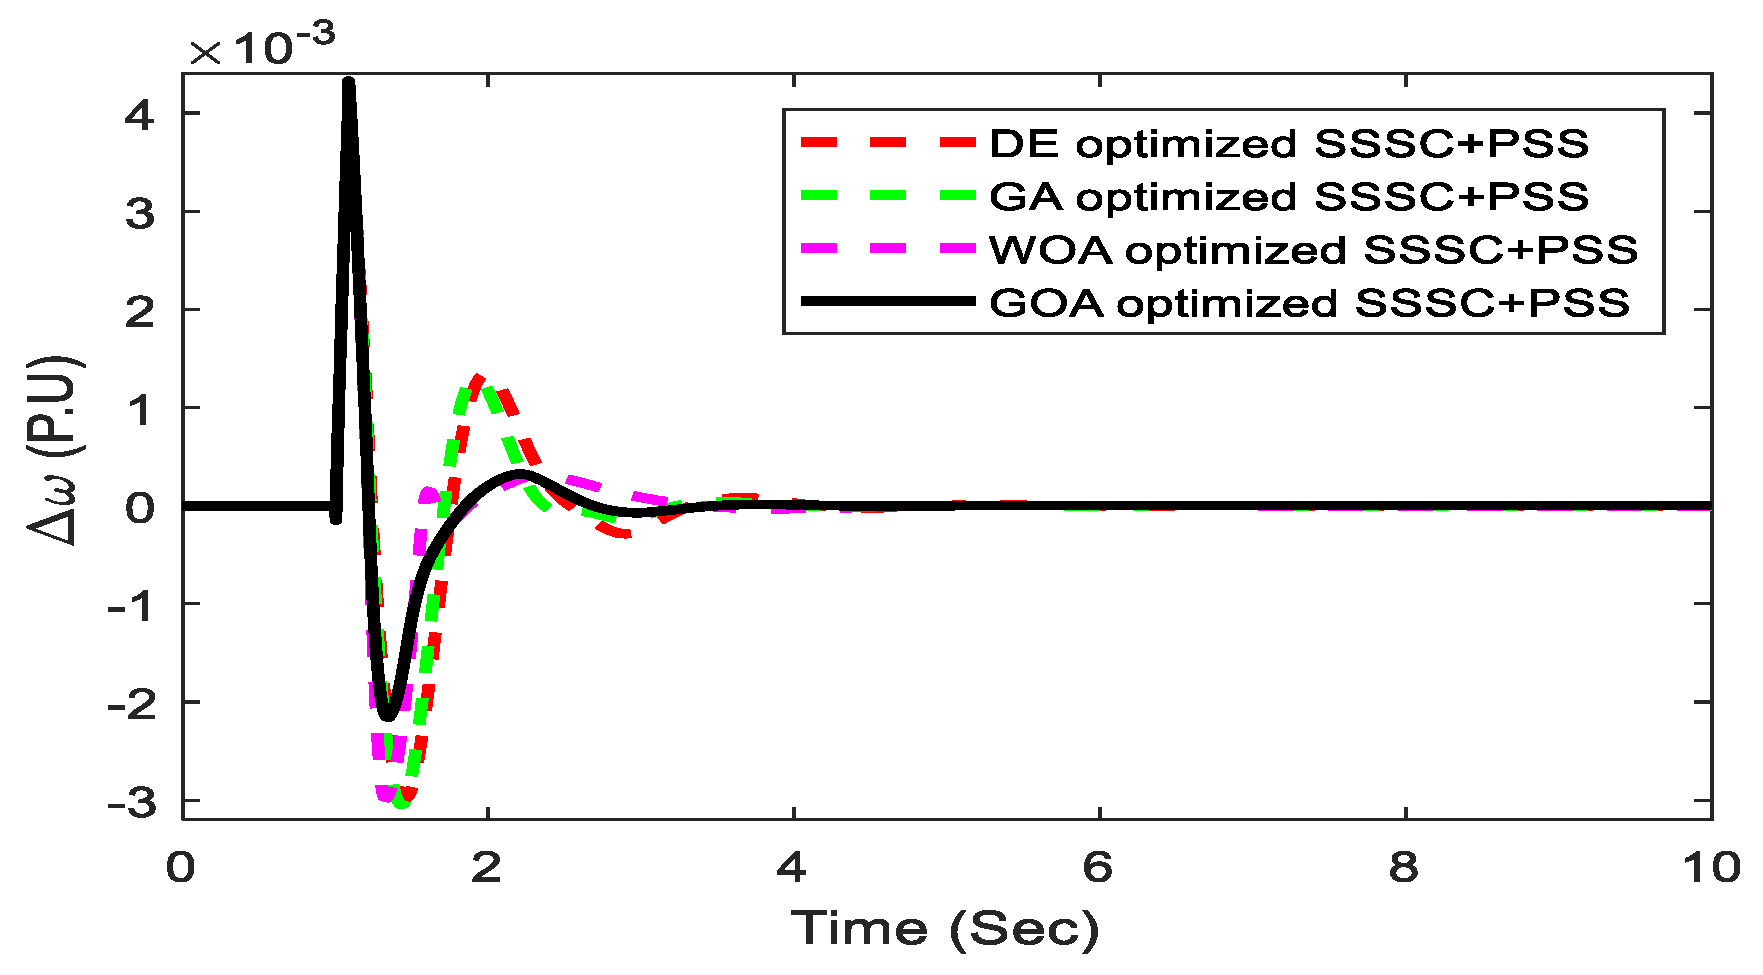
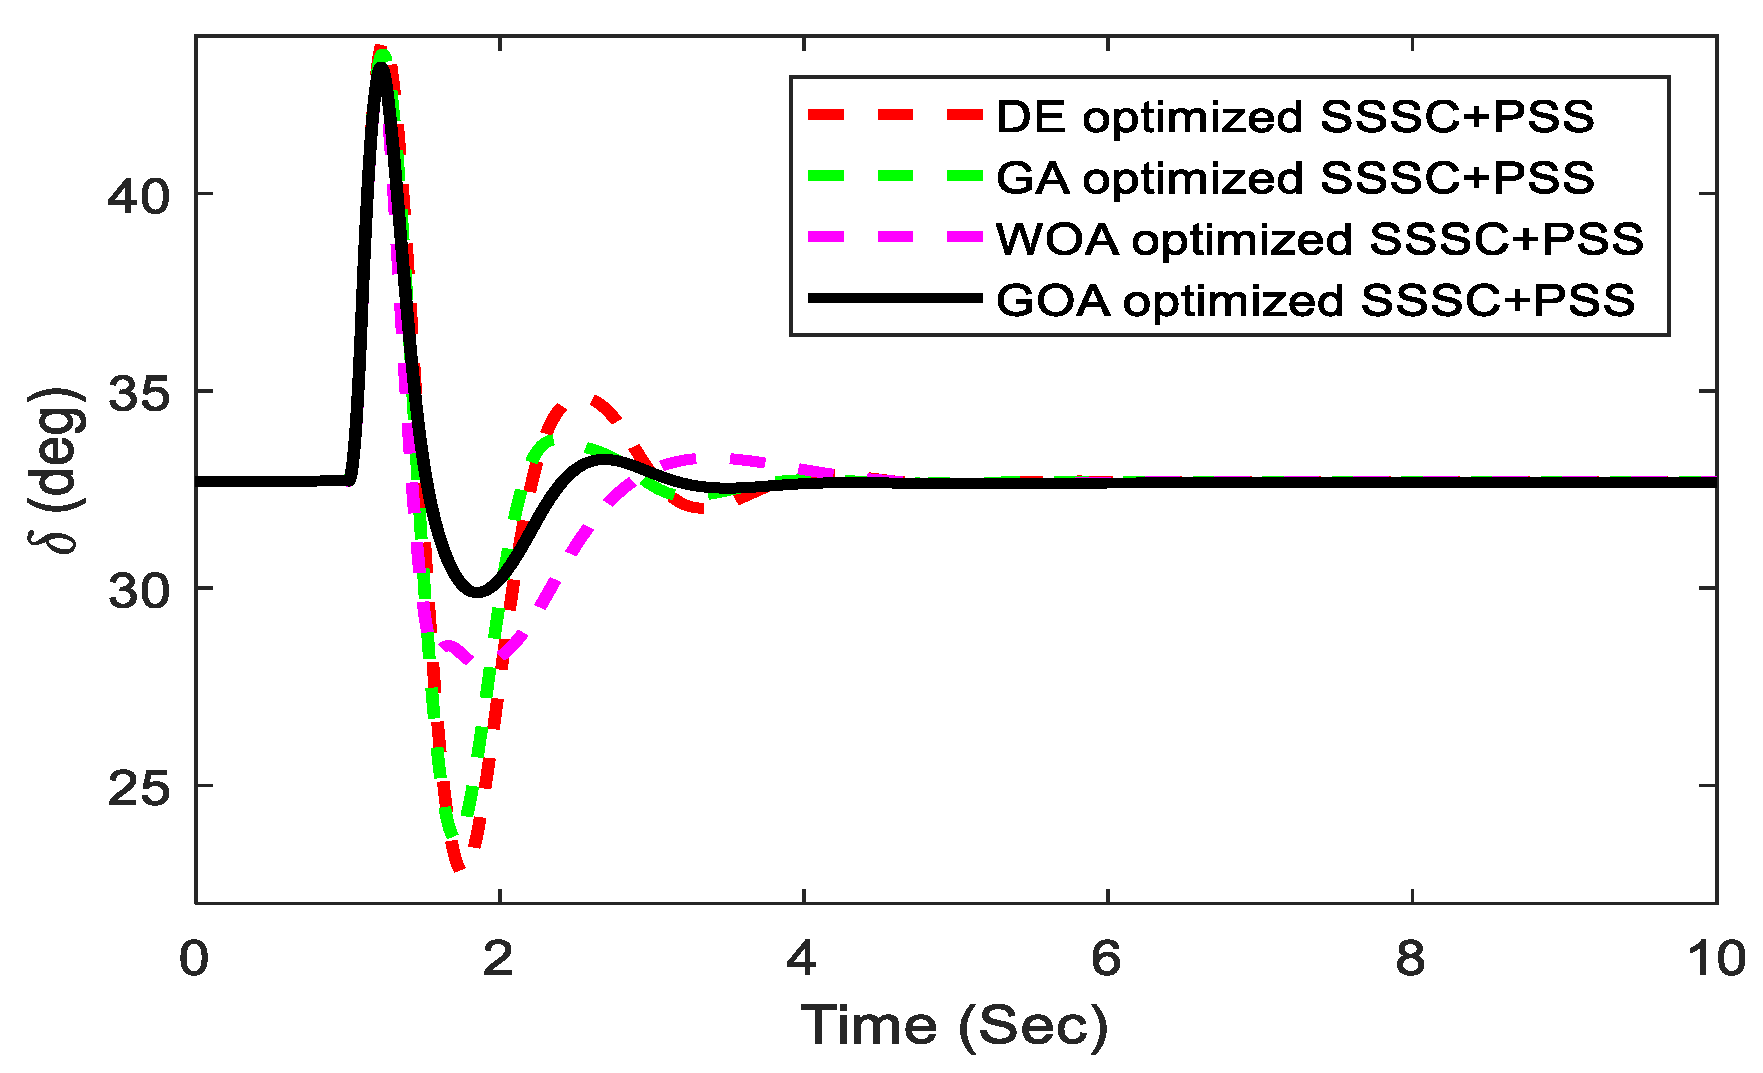
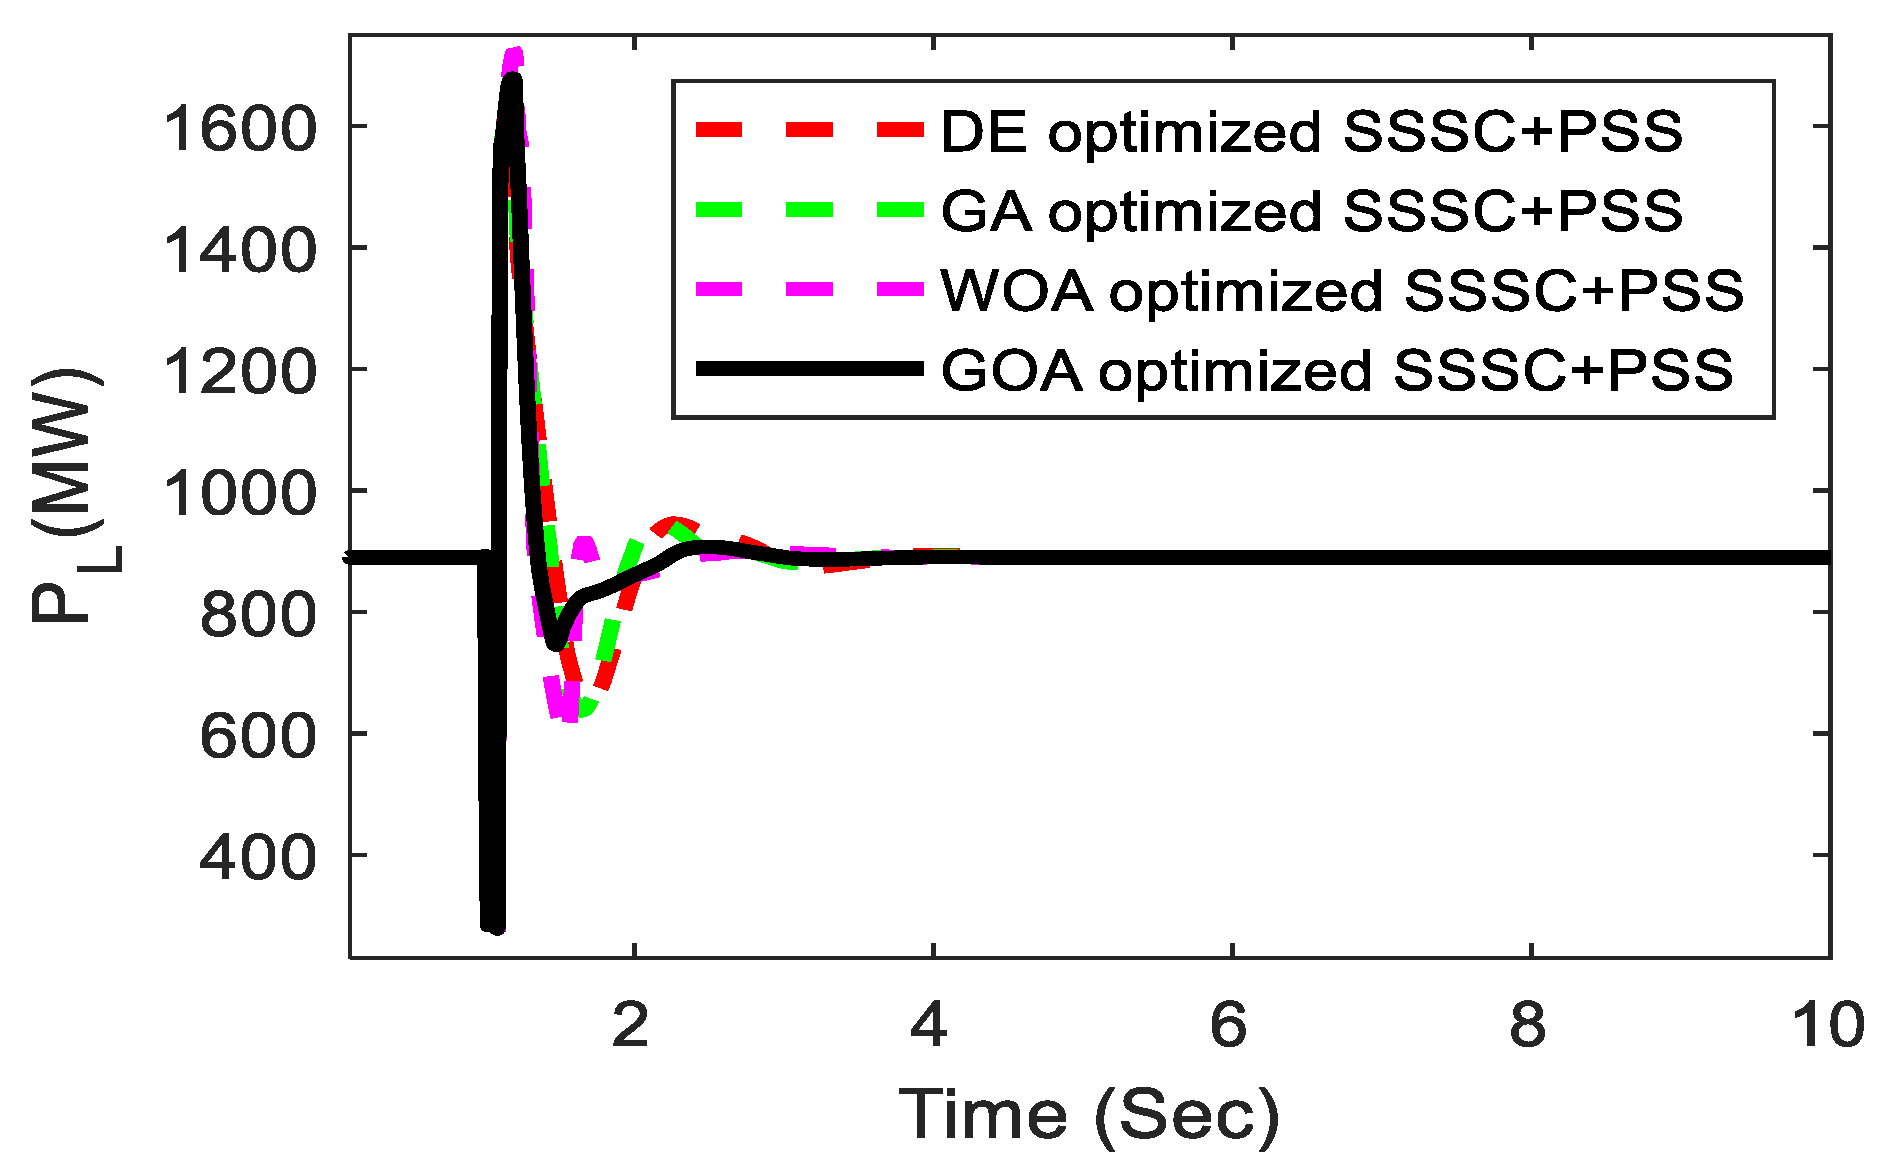
  • Initially, a SMIB system with a fuzzy lead-lag structured controller is considered, and the dominance of GOA as related to WOA, DE, and GA is demonstrated.
  • The percentage decrease in J value with the GOA technique compared with recently published WOA, well-established GA, and DE are 16.32%, 14.56%, and 13.72%, respectively, in the SMIB system. The percentage decrease in J value with the proposed GOA technique compared with recently published WOA, well-established GA, and DE are 1.41%, 9.98%, and 13.31%, respectively, for the multi-machine system.
  • The effectiveness of the GOA is validated with various load conditions and results confirmed that GOA performed better compared with the recently published WOA, and well-established GA and DE optimization algorithms.
The wide adoption of the GOA algorithm in recent optimization problems is due to its exploration ability in the initial stage of optimization. Furthermore, this assists in exploring the promising regions in the search space. Due to large attraction forces between the grasshoppers, exploitation is high in the last step. The GOA maintains a smooth balance between exploration and exploitation to avoid convergence to local optima points. This behavior is due to the proposal of the adaptive comfort coefficient. The application of GOA in the electrical engineering domain enhances its reliability and accuracy by its capability of solving many unimodal as well as multi-modal complex problems.
The trends toward the growth of meta-heuristic algorithms enhanced in recent years due to their potential benefits, including (1) dynamic condition flexibility, (2) fast convergence speed, and (3) solving convex problems.
Computer engineering and electrical engineering fields dominate the application of GOA from the analysis of the literature.

6. Conclusions

In the present work, the investigation of the enhancement of the power system steadiness by the coordinated application of numerous damping controllers is thoroughly achieved. A time-domain objective function is utilized to diminish the oscillations of the power system for the controller design problem that has been proposed. Then a GOA technique is employed to achieve proper tuning of the controller parameters optimally and coordinately. Further, the effectiveness of the suggested coordinated strategy is tested through the simulation results obtained at various load conditions and disturbances. It is observed that the suggested controllers are robust enough to manage fault sites and variations in operating conditions. Thereby, the stability of the system is enhanced by generating the stabilizing output signals. Finally, when the proposed approach is applied to a multi-machine system and simulation is carried out, the consequences lead to the decision that the GOA-optimized intended controller becomes superior compared with the well-established GA, DE algorithm, and recently published WOA-optimized controller. The percentage decrease in J value with GOA technique compared with recent published WOA, well-established GA and DE are 16.32%, 14.56%, and 13.72%, respectively, in the SMIB system. The percentage decrease in J value with proposed GOA technique compared with recent published WOA, well established GA and DE are 1.41%, 9.98%, and 13.31%, respectively, for a multi-machine system. The simulation outcomes substantiate that the intended controller is particularly versatile for the real-world application to power systems.

Author Contributions

Conceptualization, P.R.S.; Formal analysis, R.K.L. and T.S.U.; Funding acquisition, T.S.U.; Investigation, R.K.K.; Methodology, P.K.H.; Project administration, T.S.U.; Resources, S.P.; Supervision, T.S.U. All authors have read and agreed to the published version of the manuscript.

Funding

This research received no external funding.

Conflicts of Interest

The authors declare no conflict of interest.

Nomenclature

GA: Genetic algorithm; PSO: Particle swarm optimization; SVC: Static VAR compensator; TCSC: Thyristor controlled series compensator; hPSO-GSA: hybrid particle swarm optimization and gravitational search algorithm; BFPSO: Bacterial-foraging oriented by particle swarm optimization; MWOA-NM: Modified whale optimization algorithm-nelder-mead UPFC: Unified power flow controller; SOA: Seeker optimization algorithm; GSA: Gravitational search algorithm; ACO: Ant Colony Optimization; FPA: Flower Pollination Algorithm; BA: Bat Algorithm; FA: Firefly Algorithm; SMS: State of Matter Search; US: Undershoot; ST: Settling time.

References

  1. Ustun, T.S.; Hashimoto, J.; Otani, K. Impact of Smart Inverters on Feeder Hosting Capacity of Distribution Networks. IEEE Access 2019, 7, 163526–163536. [Google Scholar] [CrossRef]
  2. Latif, A.; Hussain, S.M.S.; Das, D.C.; Ustun, T.S. Double stage controller optimization for load frequency stabilization in hybrid wind-ocean wave energy based maritime microgrid system. Appl. Energy 2021, 282, 116–171. [Google Scholar] [CrossRef]
  3. Latif, A.; Paul, M.; Das, D.C.; Hussain, S.M.S.; Ustun, T.S. Price Based Demand Response for Optimal Frequency Stabilization in ORC Solar Thermal Based Isolated Hybrid Microgrid under Salp Swarm Technique. Electronics 2020, 9, 2209. [Google Scholar] [CrossRef]
  4. Hussain, I.; Das, D.C.; Sinha, N.; Latif, A.; Hussain, S.M.S.; Ustun, T.S. Performance Assessment of an Islanded Hybrid Power System with Different Storage Combinations Using an FPA-Tuned Two-Degree-of-Freedom (2DOF) Controller. Energies 2020, 13, 5610. [Google Scholar] [CrossRef]
  5. Latif, A.; Hussain, S.M.S.; Das, D.C.; Ustun, T.S. Optimization of Two-Stage IPD-(1+I) Controllers for Frequency Regulation of Sustainable Energy Based Hybrid Microgrid Network. Electronics 2021, 10, 919. [Google Scholar] [CrossRef]
  6. Chauhan, A.; Upadhyay, S.; Khan, M.T.; Hussain, S.M.S.; Ustun, T.S. Performance Investigation of a Solar Photovoltaic/Diesel Generator Based Hybrid System with Cycle Charging Strategy Using BBO Algorithm. Sustainability 2021, 13, 8048. [Google Scholar] [CrossRef]
  7. Das, A.; Dawn, S.; Gope, S.; Ustun, T.S. A Strategy for System Risk Mitigation Using FACTS Devices in a Wind Incorporated Competitive Power System. Sustainability 2022, 14, 8069. [Google Scholar] [CrossRef]
  8. Ranjan, S.; Das, D.C.; Sinha, N.; Latif, A.; Hussain, S.M.S.; Ustun, T.S. Voltage stability assessment of isolated hybrid dish-stirling solar-thermal-diesel microgrid with STATCOM using mine blast algorithm. Electr. Power Syst. Res. 2021, 196, 107239. [Google Scholar] [CrossRef]
  9. Singh, N.K.; Koley, C.; Gope, S.; Dawn, S.; Ustun, T.S. An Economic Risk Analysis in Wind and Pumped Hydro Energy Storage Integrated Power System Using Meta-Heuristic Algorithm. Sustainability 2021, 13, 13542. [Google Scholar] [CrossRef]
  10. Das, A.; Dawn, S.; Gope, S.; Ustun, T.S. A Risk Curtailment Strategy for Solar PV-Battery Integrated Competitive Power System. Electronics 2022, 11, 1251. [Google Scholar] [CrossRef]
  11. Latif, A.; Hussain, S.M.S.; Das, D.C.; Ustun, T.S. Optimum Synthesis of a BOA Optimized Novel Dual-Stage PI − (1 + ID) Controller for Frequency Response of a Microgrid. Energies 2020, 13, 3446. [Google Scholar] [CrossRef]
  12. Dey, P.P.; Das, D.C.; Latif, A.; Hussain, S.M.S.; Ustun, T.S. Active Power Management of Virtual Power Plant under Penetration of Central Receiver Solar Thermal-Wind Using Butterfly Optimization Technique. Sustainability 2020, 12, 6979. [Google Scholar] [CrossRef]
  13. Abdolrasol, M.G.M.; Hannan, M.A.; Hussain, S.M.S.; Ustun, T.S.; Sarker, M.R.; Ker, P.J. Energy Management Scheduling for Microgrids in the Virtual Power Plant System Using Artificial Neural Networks. Energies 2021, 14, 6507. [Google Scholar] [CrossRef]
  14. Latif, A.; Hussain, S.M.S.; Das, D.C.; Ustun, T.S. Design and Implementation of Maiden Dual-Level Controller for Ameliorating Frequency Control in a Hybrid Microgrid. Energies 2021, 14, 2418. [Google Scholar] [CrossRef]
  15. Dawn, S.; Gope, S.; Das, S.S.; Ustun, T.S. Social Welfare Maximization of Competitive Congested Power Market Considering Wind Farm and Pumped Hydroelectric Storage System. Electronics 2021, 10, 2611. [Google Scholar] [CrossRef]
  16. Kumar, K.K.P.; Soren, N.; Latif, A.; Das, D.C.; Hussain, S.M.S.; Al-Durra, A.; Ustun, T.S. Day-Ahead DSM-Integrated Hybrid-Power-Management-Incorporated CEED of Solar Thermal/Wind/Wave/BESS System Using HFPSO. Sustainability 2022, 14, 1169. [Google Scholar] [CrossRef]
  17. Farooq, Z.; Rahman, A.; Hussain, S.M.S.; Ustun, T.S. Power Generation Control of Renewable Energy Based Hybrid Deregulated Power System. Energies 2022, 15, 517. [Google Scholar] [CrossRef]
  18. Gholipour, E.; Isazadeh, G.H. Design of a new adaptive optimal wide area IPFC damping controller in Iran transmission network. Int. J. Electr. Power Energy Syst. 2013, 53, 529–539. [Google Scholar] [CrossRef]
  19. Kundur, P.; Balu, N.J.; Lauby, M.G. Power System Stability and Control; McGraw-Hill: New York, NY, USA, 1994; Volume 7. [Google Scholar]
  20. Ali, E.S.; Abd-Elazim, S.M. Coordinated design of PSSs and TCSC via bacterial swarm optimization algorithm in a multimachine power system. Int. J. Electr. Power Energy Syst. 2012, 36, 84–92. [Google Scholar] [CrossRef]
  21. Cai, L.J.; Erlich, I. Simultaneous coordinated tuning of PSS and FACTS damping controllers in large power systems. IEEE Trans. Power Syst. 2005, 20, 294–300. [Google Scholar] [CrossRef]
  22. Padiyar, K.R.; Prabhu, N. Design and performance evaluation of sub-synchronous damping controller with STATCOM. IEEE Trans. Power Deliv. 2006, 21, 1398–1405. [Google Scholar] [CrossRef]
  23. Abd-Elazim, S.M.; Ali, E.S. Coordinated design of PSSs and SVC via bacterial foraging optimization algorithm in a multi-machine power system. Int. J. Electr. Power Energy Syst. 2012, 41, 44–53. [Google Scholar] [CrossRef]
  24. Ray, S.; Venayagamoorthy, G.K.; Watanabe, E.H. A computational approach to optimal damping controller design for a GCSC. IEEE Trans. Power Deliv. 2008, 23, 1673–1681. [Google Scholar] [CrossRef]
  25. Panda, S.; Yegireddy, N.K.; Mohapatra, S.K. Hybrid BFOA–PSO approach for coordinated design of PSS and SSSC-based controller considering time delays. Int. J. Electr. Power Energy Syst. 2013, 49, 221–233. [Google Scholar] [CrossRef]
  26. Bastos-Filho, C.J.; Chaves, D.A.; Silva, F.S.; Pereira, H.A.; Martins-Filho, J.F. Wavelength assignment for physical-layer-impaired optical networks using evolutionary computation. J. Opt. Commun. Netw. 2011, 3, 178–188. [Google Scholar] [CrossRef]
  27. Jolfaei, M.G.; Sharaf, A.M.; Shariatmadar, S.M.; Poudeh, M.B. A hybrid PSS–SSSC GA-stabilization scheme for damping power system small signal oscillations. Electr. Power Energy Syst. 2016, 75, 337–344. [Google Scholar] [CrossRef]
  28. Farah, A.; Belazi, A.; Alqunun, K.; Almalaq, A.; Alshammari, B.M.; Hamida, M.B.B.; Abbassi, R. A new design method for optimal parameters setting of PSSs and SVC damping controllers to alleviate power system stability problem. Energies 2021, 14, 7312. [Google Scholar] [CrossRef]
  29. Ain, Q.; Jamil, E.; Hameed, S.; Naqvi, K.H. Effects of SSSC and TCSC for enhancement of power system stability under different fault disturbances. Aust. J. Electr. Electron. Eng. 2020, 17, 56–64. [Google Scholar] [CrossRef]
  30. Khadanga, R.K.; Satapathy, J.K. Time delay approach for PSS and SSSC based coordinated controller design using hybrid PSO–GSA algorithm. Electr. Power Energy Syst. 2015, 71, 262–273. [Google Scholar] [CrossRef]
  31. Kamarposhti, M.A.; Colak, I.; Iwendi, C.; Band, S.S.; Ibeke, E. Optimal coordination of PSS and SSSC controllers in power system using ant colony optimization algorithm. J. Circuits Syst. Comput. 2022, 31, 2250060. [Google Scholar] [CrossRef]
  32. Khampariya, P.; Panda, S.; Alharbi, H.; Abdelaziz, A.Y.; Ghoneim, S.S. Coordinated Design of Type-2 Fuzzy Lead–Lag-Structured SSSCs and PSSs for Power System Stability Improvement. Sustainability 2022, 14, 6656. [Google Scholar] [CrossRef]
  33. Kar, M.K.; Kumar, S.; Singh, A.K.; Panigrahi, S. A modified sine cosine algorithm with ensemble search agent updating schemes for small signal stability analysis. Int. Trans. Electr. Energy Syst. 2021, 31, e13058. [Google Scholar] [CrossRef]
  34. Rout, B.; Pati, B.B.; Panda, S. Modified SCA algorithm for SSSC damping Controller design in Power System. ECTI Trans. Electr. Eng. Electron. Commun. 2018, 16, 46–63. [Google Scholar] [CrossRef] [Green Version]
  35. Bindumol, E.K.; Mini, V.; Chandran, N. Coordinated Control of PSS and SSSC using PSO to Improve Power System Stability. In Emerging Technologies for Sustainability; CRC Press: Boca Raton, FL, USA, 2020; pp. 293–302. [Google Scholar]
  36. Sahu, P.R.; Hota, P.K.; Panda, S. Modified whale optimization algorithm for coordinated design of fuzzy lead-lag structure-based SSSC controller and power system stabilizer. Int. Trans. Electr. Energy Syst. 2019, 29, e2797. [Google Scholar] [CrossRef]
  37. Ansari, J.; Abbasi, A.R.; Heydari, M.H.; Avazzadeh, Z. Simultaneous design of fuzzy PSS and fuzzy STATCOM controllers for power system stability enhancement. Alex. Eng. J. 2022, 61, 2841–2850. [Google Scholar] [CrossRef]
  38. Esmaili, M.R.; Hooshmand, R.A.; Parastegari, M.; GhaebiPanah, P.; Azizkhani, S. New coordinated design of SVC and PSS for multi-machine power system using BFPSO algorithm. Procedia Technol. 2013, 11, 65–74. [Google Scholar] [CrossRef] [Green Version]
  39. Afzalan, E.; Joorabian, M. Analysis of the simultaneous coordinated design of STATCOM-based damping stabilizers and PSS in a multi-machine power system using the seeker optimization algorithm. Int. J. Electr. Power Energy Syst. 2013, 53, 1003–1017. [Google Scholar] [CrossRef]
  40. Sahu, P.R.; Hota, P.K.; Panda, S.; Lenka, R.K.; Padmanaban, S.; Blaabjerg, F. Coordinated Design of FACTS Controller with PSS for Stability Enhancement Using a Novel Hybrid Whale Optimization Algorithm–Nelder Mead Approach. Electr. Power Compon. Syst. 2022, 1–6. [Google Scholar] [CrossRef]
  41. Rodrigues, F.; Molina, Y.; Silva, C.; Ñaupari, Z. Simultaneous tuning of the AVR and PSS parameters using particle swarm optimization with oscillating exponential decay. Int. J. Electr. Power Energy Syst. 2021, 133, 107215. [Google Scholar] [CrossRef]
  42. Fortes, E.V.; Martins, L.F.; Costa, M.V.; Carvalho, L.; Macedo, L.H.; Romero, R. Mayfly Optimization Algorithm Applied to the Design of PSS and SSSC-POD Controllers for Damping Low-Frequency Oscillations in Power Systems. Int. Trans. Electr. Energy Syst. 2022, 2022, 5612334. [Google Scholar] [CrossRef]
  43. Saremi, S.; Mirjalili, S.; Lewis, A. Grasshopper optimization algorithm: Theory and application. Adv. Eng. Softw. 2017, 105, 30–47. [Google Scholar] [CrossRef] [Green Version]
  44. Panda, S. Multi-objective evolutionary algorithm for SSSC-based controller design. Electr. Power Syst. Res. 2009, 79, 937–944. [Google Scholar] [CrossRef]
  45. Panda, S.; Swain, S.C.; Rautray, P.K.; Malik, R.K.; Panda, G. Design and analysis of SSSC based supplementary damping controller. Simul. Model Pr. Theory 2010, 18, 1199–1213. [Google Scholar] [CrossRef]
  46. Khuntia, S.R.; Panda, S. ANFIS approach for SSSC controller design for the improvement of transient stability performance. Math. Comput. Model. 2013, 57, 289–300. [Google Scholar] [CrossRef]
  47. Panda, S. Differential evolution algorithm for SSSC-based damping controller design considering time delay. J. Frankl. Inst. 2011, 348, 1903–1926. [Google Scholar] [CrossRef]
  48. Mudi, K.R.; Pal, R.N. A self-tuning fuzzy PI controller. Fuzzy Sets Syst. 2000, 115, 327–388. [Google Scholar] [CrossRef]
  49. Woo, Z.W.; Chung, H.Y.; Lin, J.J. A PID type fuzzy controller with self-tuning scaling factors. Fuzzy Sets Syst. 2000, 115, 321–326. [Google Scholar] [CrossRef]
  50. Abdolrasol, M.G.; Hannan, M.A.; Hussain, S.S.; Ustun, T.S. Optimal PI controller based PSO optimization for PV inverter using SPWM techniques. Energy Rep. 2022, 8, 1003–1011. [Google Scholar] [CrossRef]
Figure 1. SMIB system with FACTS controller.
Sustainability 14 14649 g001
Figure 2. The membership functions for FLC output, error, and error derivative.
Sustainability 14 14649 g002
Figure 3. Proposed fuzzy lead-lag structured SSSC controller.
Sustainability 14 14649 g003
Figure 4. Proposed fuzzy lead-lag structured power system stabilizer.
Sustainability 14 14649 g004
Figure 5. Real grasshopper.
Sustainability 14 14649 g005
Figure 6. Grasshopper’s life cycle.
Sustainability 14 14649 g006
Figure 7. Interaction between grasshoppers to change their position.
Sustainability 14 14649 g007
Figure 8. Flowchart of the GOA.
Sustainability 14 14649 g008
Figure 9. Proposed SMIB system in MATLAB/SIMULINK.
Sustainability 14 14649 g009
Figure 10. Nominal loading speed deviation response.
Sustainability 14 14649 g010
Figure 11. Power angle response.
Sustainability 14 14649 g011
Figure 12. SSSC injected voltage.
Sustainability 14 14649 g012
Figure 13. Nominal loading tie-line power.
Sustainability 14 14649 g013
Figure 14. Various transmission delays considering speed deviation.
Sustainability 14 14649 g014
Figure 15. Light loading speed deviation response.
Sustainability 14 14649 g015
Figure 16. Light loading power angle response.
Sustainability 14 14649 g016
Figure 17. Tie-line power.
Sustainability 14 14649 g017
Figure 18. Heavy loading speed deviation response.
Sustainability 14 14649 g018
Figure 19. ITAE value comparisons of proposed approach with DE, GA, and WOA for SMIB system.
Sustainability 14 14649 g019
Figure 20. Multi-machine system.
Sustainability 14 14649 g020
Figure 21. Response of inter-area mode of oscillations.
Sustainability 14 14649 g021
Figure 22. Local-area mode of oscillations response.
Sustainability 14 14649 g022
Figure 23. Transmission delay considering inter-area oscillations.
Sustainability 14 14649 g023
Figure 24. Transmission delay considering local-area oscillations.
Sustainability 14 14649 g024
Figure 25. Inter-area mode of oscillations response.
Sustainability 14 14649 g025
Figure 26. Local-area mode of oscillations response.
Sustainability 14 14649 g026
Figure 27. ITAE value comparisons of proposed approach with DE, GA, and WOA.
Sustainability 14 14649 g027
Table 1. GOA optimized proposed SSSC and PSS parameters for the SMIB system (i = S for SSSC and i = P for PSS).
Optimization TechniquesElements/Parameters KPiT1iT2iT3iT4iK1iK2iK3i
DESSSC controller22.010.29230.34081.24411.15021.72001.86701.9664
PSS3.0751.86071.45811.47640.13601.71711.57121.0303
GASSSC controller89.440.26691.76531.80480.08571.00570.56620.6161
PSS67.480.46960.24841.10001.88860.02170.29921.3733
WOASSSC controller65.361.57460.70340.74931.31920.57501.81490.0263
PSS15.771.01110.93670.46320.01020.88061.83130.8059
GOASSSC controller77.812.92931.72991.92083.18163.36871.40021.6572
PSS19.300.06361.38184.17971.73071.31872.20523.4003
Table 2. SMIB System ITAE values considering DE, GA, WOA, and GOA techniques.
Techniques/CasesDEGAWOAGOA
Case-a (×10−4)9.3119.4029.6008.033
Case-b (×10−4)3.8023.1012.3331.989
Case-c (×10−4)3.4223.2252.9102.111
Table 3. SMIB system’s transient response parameters using the proposed controller with DE/GA/WOA/GOA algorithms.
Studied Controller/
Algorithms
Speed Deviation for Case-aSpeed Deviation for Case-bSpeed Deviation for Case-c
US (×10−3)STITAE
(×10−3)
US
(×10−3)
STITAE
(×10−3)
US
(×10−3)
STITAE
(×10−3)
DE −8.53.469.31−2.983.723.80−2.244.053.422
GA −8.13.429.40−3.043.443.10−2.273.403.225
WOA −8.63.659.60−2.973.132.33−1.103.382.910
GOA −6.343.328.03−2.152.741.98−0.652.702.111
Table 4. GOA optimized proposed SSSC and PSS parameters (i = S for SSSC and i = P for PSS).
Optimization TechniquesElements/Parameters KPiT1iT2iT3iT4iK1iK2iK3i
DESSSC controller11.480.12950.01610.12660.07880.02890.10290.0465
PSS-11.670.04900.03780.04590.01810.13050.06350.1122
PSS-27.0950.10470.11170.09450.03350.10300.17180.1758
PSS-33.0650.04960.11720.13150.08910.04910.18990.0256
GASSSC controller148.381.37590.54130.75541.72413.29150.59900.0121
PSS-1115.141.78161.68990.24701.07211.67393.72550.7186
PSS-25.5351.79711.63661.35110.26910.38252.02671.3590
PSS-3156.380.21051.59691.49851.37040.92351.62721.7362
WOASSSC controller18.740.14210.07370.34410.22030.09500.35560.2218
PSS-118.060.12250.33310.12700.15750.34400.28520.1094
PSS-25.1450.03310.18050.23340.10820.24730.34760.0636
PSS-312.1250.06170.03440.02440.23490.29440.20900.2354
GOASSSC controller19.4750.26980.15790.26500.33370.29690.22450.0387
PSS-17.820.13450.30300.12740.01740.19020.34740.0038
PSS-219.3150.27401.17710.31910.03030.11750.36990.0619
PSS-38.6950.05080.13290.09850.19610.28720.35300.0338
Table 5. ITAE values assessment for multi-machine system.
Techniques/CasesDEGAWOAGOA
Case-a (×10−4)2.0892.0121.8371.811
Case-b (× 10−4)3.3113.1503.1423.021
Publisher’s Note: MDPI stays neutral with regard to jurisdictional claims in published maps and institutional affiliations.

