Article

Evaluation of SWMM-LID Modeling Applicability Considering Regional Characteristics for Optimal Management of Non-Point Pollutant Sources

Water Environmental Research Department, National Institute of Environmental Research (NIER), Gyeonseo-dong, Seo-gu, Incheon 22689, Korea
*
Author to whom correspondence should be addressed.
Sustainability 2022, 14(21), 14662; https://doi.org/10.3390/su142114662
Submission received: 5 September 2022 / Revised: 2 November 2022 / Accepted: 4 November 2022 / Published: 7 November 2022

Abstract

:
Urbanization and climate change have deteriorated the runoff water circulation and quality in urban areas worldwide. Consequently, low-impact development (LID) and green infrastructure (GI) techniques have been applied to manage impermeable land and non-point source pollutants. Herein, the impacts of urban characteristics, sewer system type, and precipitation intensity on surface runoff were analyzed using the Storm Water Management Model (SWMM) to derive an effective water circulation strategy for urban and complex areas through the optimal allocation of LID/GI strategies. The runoff rates were estimated to be 77.9%, 37.8%, and 61.7% for urban areas with separated and combined sewer systems and complex areas with combined sewer systems, respectively. During low rainfall, runoff was intercepted in areas with combined sewer systems, and runoff and pollutant load were lower than that in areas with separated sewer system. In contrast, wastewater was diluted during heavy rainfall; however, the total pollutant load was higher than in separated areas. The analysis of scenarios according to the regional distribution of each LID type resulted in high efficiency when combined sewers were applied during the distributed placement of catchment areas. Additionally, LID infrastructure was applied in areas with separated sewers when the placement was concentrated at the end of the basin.

1. Introduction

In South Korea, land-use intensification and increased economic activities have led to an increase in impermeable-land area by 2.6 times in 2017, which is a 7.7% increase from the 1970s [1]. Seoul showed the highest increase in impermeable land area (52.8%), while most of the other metropolitan cities showed an increase in impermeable land area that exceeded 20% [1]. Urbanization and increasing impermeable land area directly impact topography, soil type, vegetation cover, and water circulation [2]. Climate change and urban development, in the event of increased precipitation, have been observed to lead to an increased runoff rate in urban basins, decreased groundwater level, and increased non-point source (NPS) pollutant load [3].
Consequently, the Water Environment Conservation Act 2018 was amended, and the national water circulation management target (impermeable area and water circulation rates) was set as part of “integrated measures for non-point source pollutant management [4]”. Implementation policy and strategies were reviewed to achieve the set targets [5]. For water circulation management, integrated measures for non-point source pollutant management (2021–2025) were defined by the Ministry of Environment Korea [6]; the impermeable area and water circulation rates were established using the HSPF (Hydrological Simulation Program–Fortran) watershed model for 17 metropolitan cities and provinces and 818 small-scale areas. Mid- and long-term targets were set to achieve the water quality recovery management targets for basins with over 25% of impermeable areas [1].
However, regions with 25% or above impermeable areas are highly urbanized with a higher percentage of drainage system distribution (81.8% nationwide in 2018, 100% in Seoul Metropolitan City). This factor limits the application of improvement measures for impermeable areas solely based on basin rainfall–runoff patterns. It is necessary to have a regionally suitable management of impermeable areas and water circulation through effective low-impact development (LID) practices and infrastructure aimed at reducing non-point source pollution based on the total runoff pattern using drainage sewer runoff models [7]. Various models have been applied for implementing LID or green infrastructure (GI), among which the Storm Water Management Model (SWMM) is the most widely used sewer runoff model.
Qin et al. [8] and Luan et al. [9] have used SWMM to evaluate LID strategies for drainage sewer modeling to analyze LID surface runoff based on rainfall scenarios in two Chinese cities, namely Samzan and Beijing. Bai et al. [10] applied LID (infiltration, storage types) in Suqian City, Jiangsu Province, from which the surface runoff rate was assessed to be high in the infiltration type. Shin et al. [11] and Lee et al. [12] designated priority management regions for reducing combined sewer overflow (CSO) emissions during rainfall and non-point source pollutants occurring from residential and industrial areas in Suyeong-gang River, Busan City, and analyzed the runoff mitigation effect using the LID approach. Zhang et al. [13] and Bhandari et al. [14] analyzed the flood mitigation effects through the application of LID considering the groundwater in the states of Washington and Maryland in the United States.
Zhang and Chui [15] considered infrastructure types, volumes, and locations for model application by examining previous research relevant to the spatial allocation of LID, best management practice (BMP), and GI for their research related to the effect of the method of land use, LID infrastructure type, and spatial allocation in water circulation. Zhen et al. [16], in their study and application of LID on a tributary basin of the Swift Creek reservoir near Richmond (Chesterfield, VA, USA), concluded that the consideration of various parameters of infrastructure location, including the percentage of impermeable area, soil characteristics, drainage function, runoff path, etc., results in variable outcomes given their complexity. Kuller et al. [17] tested the feasibility of blue–green rainwater systems in Melbourne City, Australia, and concluded that an installation upstream was most effective as it processes the initial runoff. Vittorio and Ahiablame [18] modeled the reduction effect of the long-term runoff amount according to LID installation at the Deer Creek basin in Missouri, United States. Their analysis highlighted the difficulties in selecting an optimal location or region because installation at the drainage sewer end or downstream of the basin showed good results. Baek et al. [19] applied LID to the model in catchments where rural, forest, and urban basins are complex. The studies suggested that the combined sewer system is effective for application in a high area at the end of the basin, and the separated sewer type is effective for application in urban areas.
Despite various studies that utilize sewer models and the LID approach, research investigating the relationships among the factors affecting management is lacking. Additionally, a detailed analysis of the runoff characteristics specific to the region and the type of drainage sewer is necessary to evaluate the water circulation management objectives set for each basin. A customized management plan is also necessary after implementing effective non-point source pollutant mitigation.
In this study, SWMMs were applied to selected regions, including regions that were solely urban and regions that comprised urban and rural complexes, for analyzing the runoff from separated and combined sewer systems. Based on the data obtained for each region, scenarios considering the distribution and type for each region were created to analyze the effects of the application of LID infrastructure. An optimal management strategy to ensure that the water circulation objectives are achieved was developed by analyzing the simulated results for each scenario.

2. Materials and Methods

2.1. Study Area

Based on the data reported by Lee et al. [1], small-scale areas with 25% or above impermeable land area were selected for this study. In Seoul, 52.8% of the total land area was impermeable land, higher than that in other metropolitan cities, indicating that many regions here had high growth rates of impermeable land areas following urbanization. There were 22 small areas with more than 25% of the Han River water system, which accounted for 49% of the total 45 water systems. Therefore, Seoul was identified as a region that required proper management of impermeable land areas for protection against urban flooding caused by rainfall and non-point source pollutant load in runoff. The impermeable area of Seoul’s small area is more than 25%, wherein the combined and separated sewers’ systems are based on the flow and characteristics of the sewers [20]. Gangseo-gu, a region with a separated sewer system, was designated as region A. Yangcheon-gu, a region with a combined sewer system, was designated as region B. These regions in Seoul were selected as dense urban areas, and Seo-gu, Incheon City, a region with a combined sewer system and the third-highest impermeable land area (21.4%), was designated as region C and was selected as an urban and rural complex (Figure 1).
The land-use status of the dense urban areas in Seoul and complex areas in Incheon City are shown in Figure 2. More than 80% of the dense urban areas in Seoul were water-impermeable land. Moreover, the land area (traffic and residential areas) was observed to be highly distributed. Study region A utilized a separated sewer system. The total area of study region A was 2.73 km2, 84.3% of which was impermeable land. Furthermore, traffic areas accounted for 50.1% of the total area, and forests accounted for 15.7% of the total area and were evenly distributed. Study region B utilized a combined sewer system. The total area of study region B was 0.91 km2, 91.2% of which was impermeable land. Moreover, residential and traffic areas accounted for 42.4% and 34.0% of the total area, respectively. Forests occupied 8.8% of the total area and were concentrated in the north-east region. In study areas A and B, the impermeable land area was greater than 80%, but transportation was mainly in the separated-type area, and the residential areas were mainly in the combined-type area. Study region C, a complex area, utilized a combined sewer system. The total area of study region C was 1.58 km2, 46.2% of which was impermeable land, which was lower than that in the Seoul urban area. In study region C, traffic areas (30.4%) showed the highest distribution, and rice paddies and fields accounted for 26.6% of the total area and were present on the outer areas of the region. The rest of the study region C was mainly used for residential and transportation purposes. Upstream forests accounted for 24.1% of the total area of study region C (comprising urban and rural areas) and were evenly distributed (Table 1).

2.2. Selection of Models

In this study, SWMM was selected as a numerical model for simulating the water flow by sewer type that could apply improvement strategies, such as LID and GI, for impermeable areas. SWMM was developed by the Environmental Protection Agency (EPA) and is most commonly used for the analysis of the characteristics of runoff in a sewer network, as it can track runoff to the surface and groundwater following rainfall in the watershed [21]. In addition, it is possible to calculate storage, surcharge flow, backwater, and contaminants and simulate the treatment of pollutants [21]. It can also be used to simulate flow in sewers as well as non-point pollutants in urban basins, LIDs, and GIs to analyze the impermeable surface area and apply water circulation improvement effects. In addition, it has the advantage of enabling the interpretation of various basin characteristics from rural areas to urban areas as a model for interpreting various hydrological phenomena occurring in combined-type urban areas. Moreover, continuous modeling simulation and simulation of a single event modeling are possible, and small drainage to large drainage basins can be applied [22].
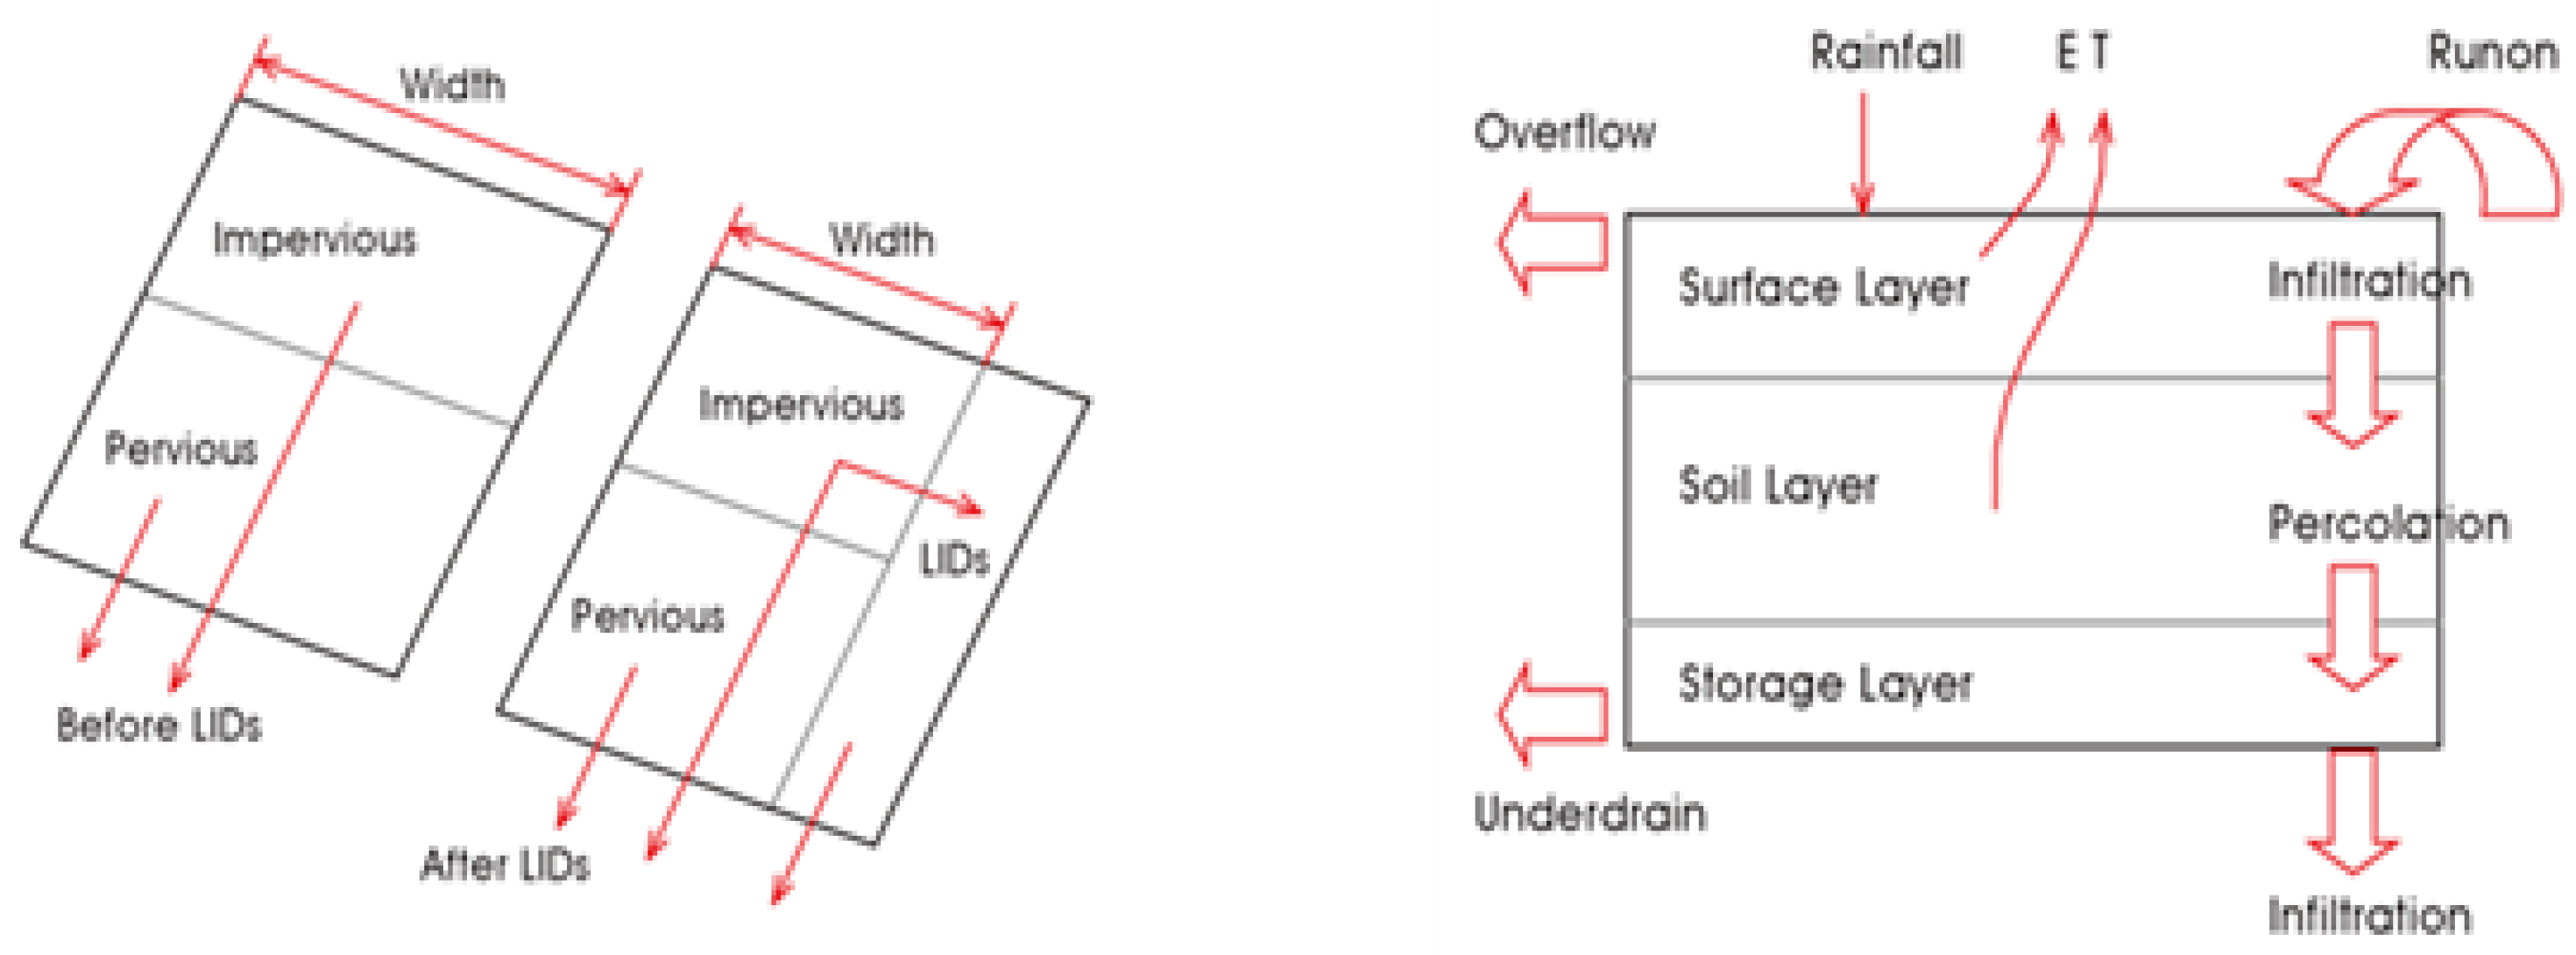
The LID techniques that can be simulated in SWMM-LID Control include the bio-retention of cells, permeable pavement, infiltration trenches, rain barrels, and vegetative swales. The quantitative hydrological impact assessment of infiltration and storage strategies and LID planning elements is also possible [23]. Figure 3 is a schematic diagram of the concept of LID simulation index outflow [24].
The LID module consists of three layers, and it is possible to apply LID strategies of the same specifications to basin areas with different land-cover characteristics based on characteristics per unit area, which can be simulated by changing the variables that determine the mathematical and hydrological characteristics. To develop an appropriate water circulation plan, we used the model to compare the outflow quantity by the urban characteristics of the study region, topography, and sewer system types.

2.3. Input Data for Construction of Outflow Path

Table 2 shows the input data that was used for SWMM. The weather data applied the Seoul Meteorological Observatory’s hourly data for rainfall in 2018. The study regions were used as input data for weather by applying the Thyssen Network method. The total rainfall was 1284 mm.
The results calculated using ArcGIS software were applied to the basin area and topographic data. Data pertaining to manholes and pipelines in Seoul and Incheon were extracted from the Urban Information System database.
To determine the prediction accuracy when simulating the model, we compared the observed and simulated level at the measurement point of the water meter in Seoul. To analyze the accuracy of the model, we selected three indicators, namely R2, Nash–Sutcliffe efficiency (NSE), and correlation, presented by Donigian [25] and EPA [26], and verified the results.

2.4. Analysis of Flow and NPS Pollutatnt loads Change Sewer Characteristics

The sewers were divided into a combined sewer and a separate sewer. A combined sewer is a way of treating sewage and rainwater together. CSOs occur when the capacity of the sewage treatment plant is exceeded. This adversely affects the water quality of urban areas. In order to reduced CSOs, storage tanks are installed, treated and discharged into rivers. A separated sewer is a method of allowing sewage and rainwater to flow separately. Rainwater flows into a separate rainwater pipeline [27].
To analyze the outflow characteristics by urban characteristics, topography, and weather, we used the sewer network details of the study regions to develop the SWMM.
In this study, the sewer characteristics were specified as separated sewers that carry rainwater and sewage separately (A), combined sewers with a storage tank installed (B), and combined sewers without a storage tank (C). A storage tank was located at the end of the B region. The storage tank was set to a structure in which overflow occurred when the storage tank capacity (Q = 17,785 m3) was exceeded.
To calculate the sewage load of the combined sewer system, we used the flow rate of the inflow water of the Seonam sewage treatment center and its BOD and T-P concentrations. The collection capacity at the end and the final overflow water were calculated by applying the ratio of the study area to the planned sewage volume in case of rain and the storage capacity of the reservoir.
Spatial outflow characteristics were identified for each region using the simulation results of the outflow quantity by space. The pollutant load was evaluated as biochemical oxygen demand (BOD) and total phosphorus (T-P) load.
To estimate sewage in combined sewer, treatment calculation data from the Seonam sewage treatment center were used. In addition, flow rates, BOD and TP concentrations were also applied.
The runoff calculation was made using the curve number (CN) method. The routing technique applied dynamic waves [28].
For water-quality simulation, the annual average BOD and T-P load for each land category described in the Water Pollution Total Volume Management Technical Guidelines were applied.
Due to the large impermeable area of the study area, the power-exponential method was applied to better describe the initial washing [29]. In order to activate the build-up function and the wash-off function of the pollution load, previous research was presented [30,31]. Initial buildup was applied, taking into account 30 days of rainfall from 0.
The outflow quantity results by urban characteristics according to the combined and separated sewer systems and outflow changes according to the regional characteristics of urban density and complex areas were compared.

2.5. Construction of LID Scenarios to Achieve Water Circulation Goal

The installation location of LID is critical for deriving the optimal benefits of non-point pollution reduction. The flow rate and water quality of the rainfall-runoff water flowing into the installed facility vary depending on the installation location. In other words, the same facility may show different efficiencies in different regions.
BMP is mostly related to individual engineering practices, whereas LID and GI more often indicate macroscopic planning and development for an entire urban area [15]. Today, optimal LID design is key to rainwater management in urban areas [32]. The optimization objective can take many forms, such as reducing runoff volume, peak flow, combined sewer overflow volume, pollutant load, first flush volume, or minimizing cost [33]. GI is similar to LID, but it also represents a green network [34]. It has goals beyond rainwater management, such as maximizing ecosystem services, restoring watersheds, and conserving biodiversity [35].
Therefore, in this study, scenarios were simulated for determining effective LID and GI strategies that could help achieve the water circulation goal. We applied permeable pavement, which is currently widely used, as a GI strategy. Water-permeable pavement can reduce runoff by allowing rainwater to penetrate the soil. It is suitable for areas with low groundwater levels, has excellent effects in regions with large roads or parking areas, and can reduce flooding and improve runoff water quality [36,37]. We applied a tree box filter as an LID strategy. Since additional sites need not be secured for installing tree box filters and because they are mainly installed in the landscape space of street trees before the water enters facilities such as manholes, installing tree box filters on roads in urbanized areas is easy [38]. Table 3 shows the input values of the parameters for each element technology used in the SWMM-LID simulation. For the range of values of the input layer, the major literature and LID application cases were referenced [39,40,41].
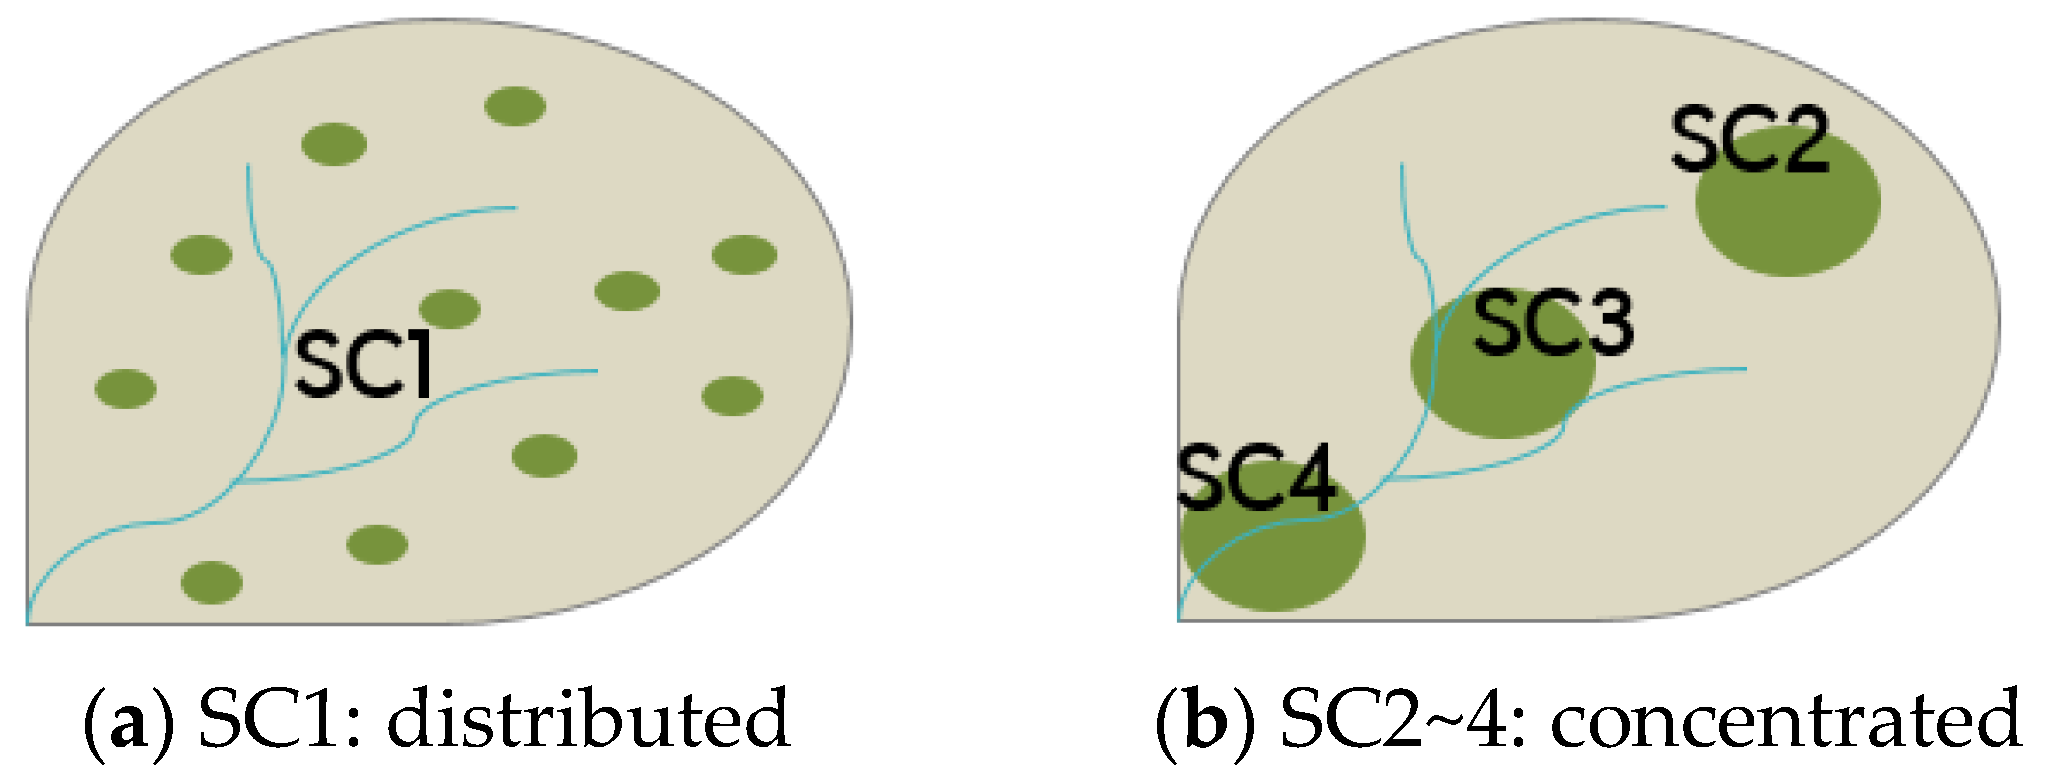
Table 4 depicts the scenarios that were considered for evaluating the effect of the runoff reduction strategies. This was set as the basis for the application of a 3% impermeable area reduction considering the target reduction rate (40.3%→37.6%) of the small area of 25% or more in the third comprehensive non-point source pollutants management plan [42]. After calculating the impermeable area ratio of each sub-catchment (region A~C), only the ratio of 3% was applied by converting the impermeable area into a permeable area. In addition, to establish a scenario that considered the location and type of strategies, the method of distributing and installing LID and GI strategies throughout the basin and intensively arranging them in upper, middle, and lower streams was applied (Figure 4). The same area (approximately 0.1 km2) for LID and GI applied to scenarios 1~4.

3. Results and Discussion

3.1. Results for Establishment of the Sewer Model

Figure 5 shows the outflow path derived using the SWMM, which was established by dividing the combined and separated urban and rural complex areas of Seoul and Incheon. Table 5 lists the characteristics of the sewer networks and sub-catchments in the study regions.
Gangseo-gu and Yangcheon-gu fell under the jurisdiction of the Seonam sewage treatment center (Figure 1). However, the rainfall outflow from the separated sewer system of Gangseo-gu flowed into the river, whereas the sewage and rainfall outflows from the combined sewer system of Yangcheon-gu flowed to the Seonam sewage treatment center.
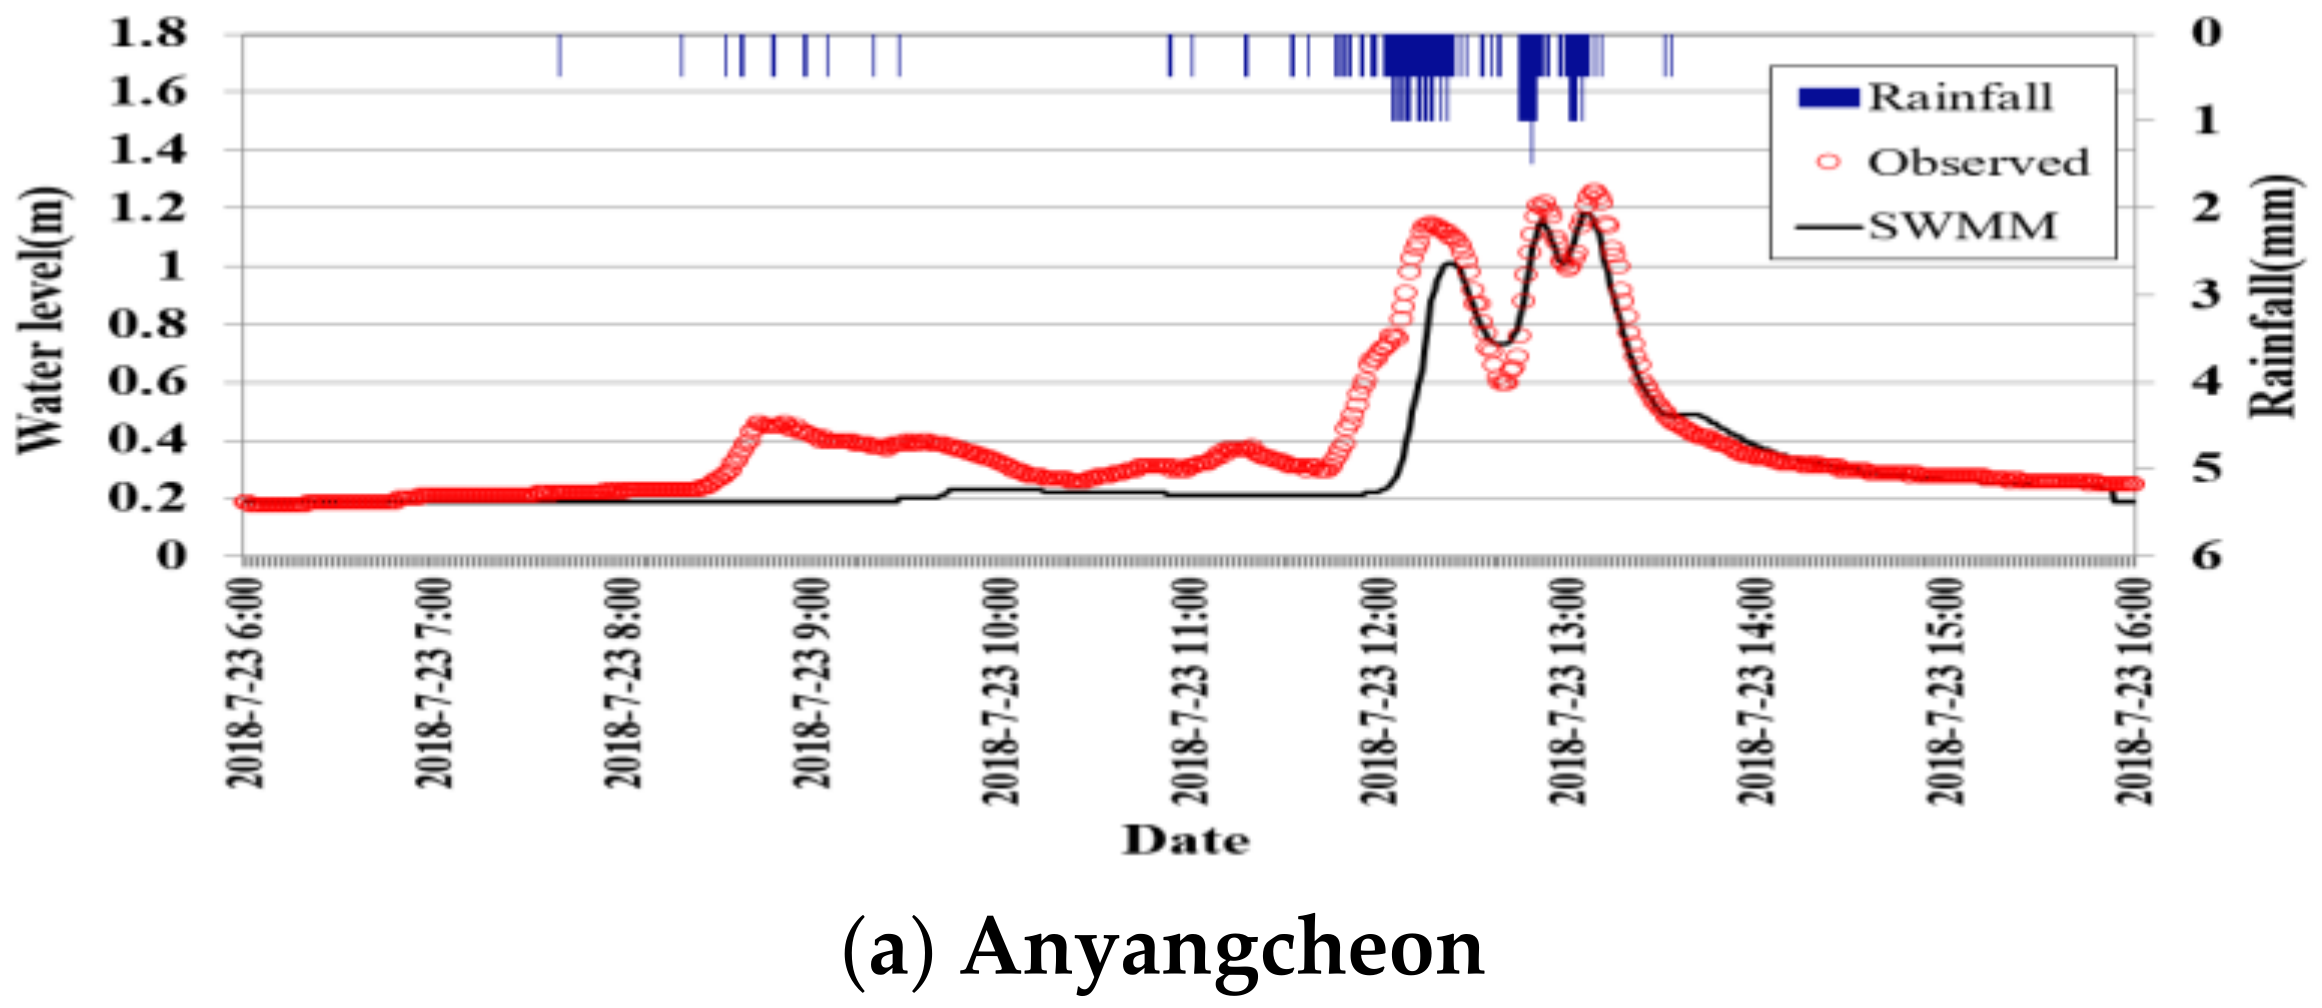
The results of the reliability analysis of the SWMM model are shown in Figure 6. The constructed SWMM model was verified by comparing the observed water level at the measurement point of the water-level meter in Seoul and the water level predicted by the SWMM model after applying actual rainfall data. Among the 94 water-level systems located in the jurisdiction of Seoul, the water-level-monitoring points located in the Noryangjin and Anyangcheon drainage areas were selected and verified with the water-level-observation points belonging to the treatment area of the Seonam sewage treatment center.
The data were verified through a comparative review of the results of the leakage simulation and actual observation surveys for major heavy rain cases in 2018. From the verification, the objective function comparing the actual water level was calculated to be 0.7 or more, establishing the high reliability of the model (Table 6).

3.2. Analysis of Effluent Results by Regional Characteristics

By analyzing the results of each drainage area outflow point in the study area, we determined the spatial outflow characteristics of the urban areas (combined and separated sewer systems) and complex areas (combined sewer system) to identify the optimal management plan for reducing runoff (Figure 7). The outflow points are described in Figure 5 as the drainage area division. The points were selected taking into account the upstream, midstream, and downstream.
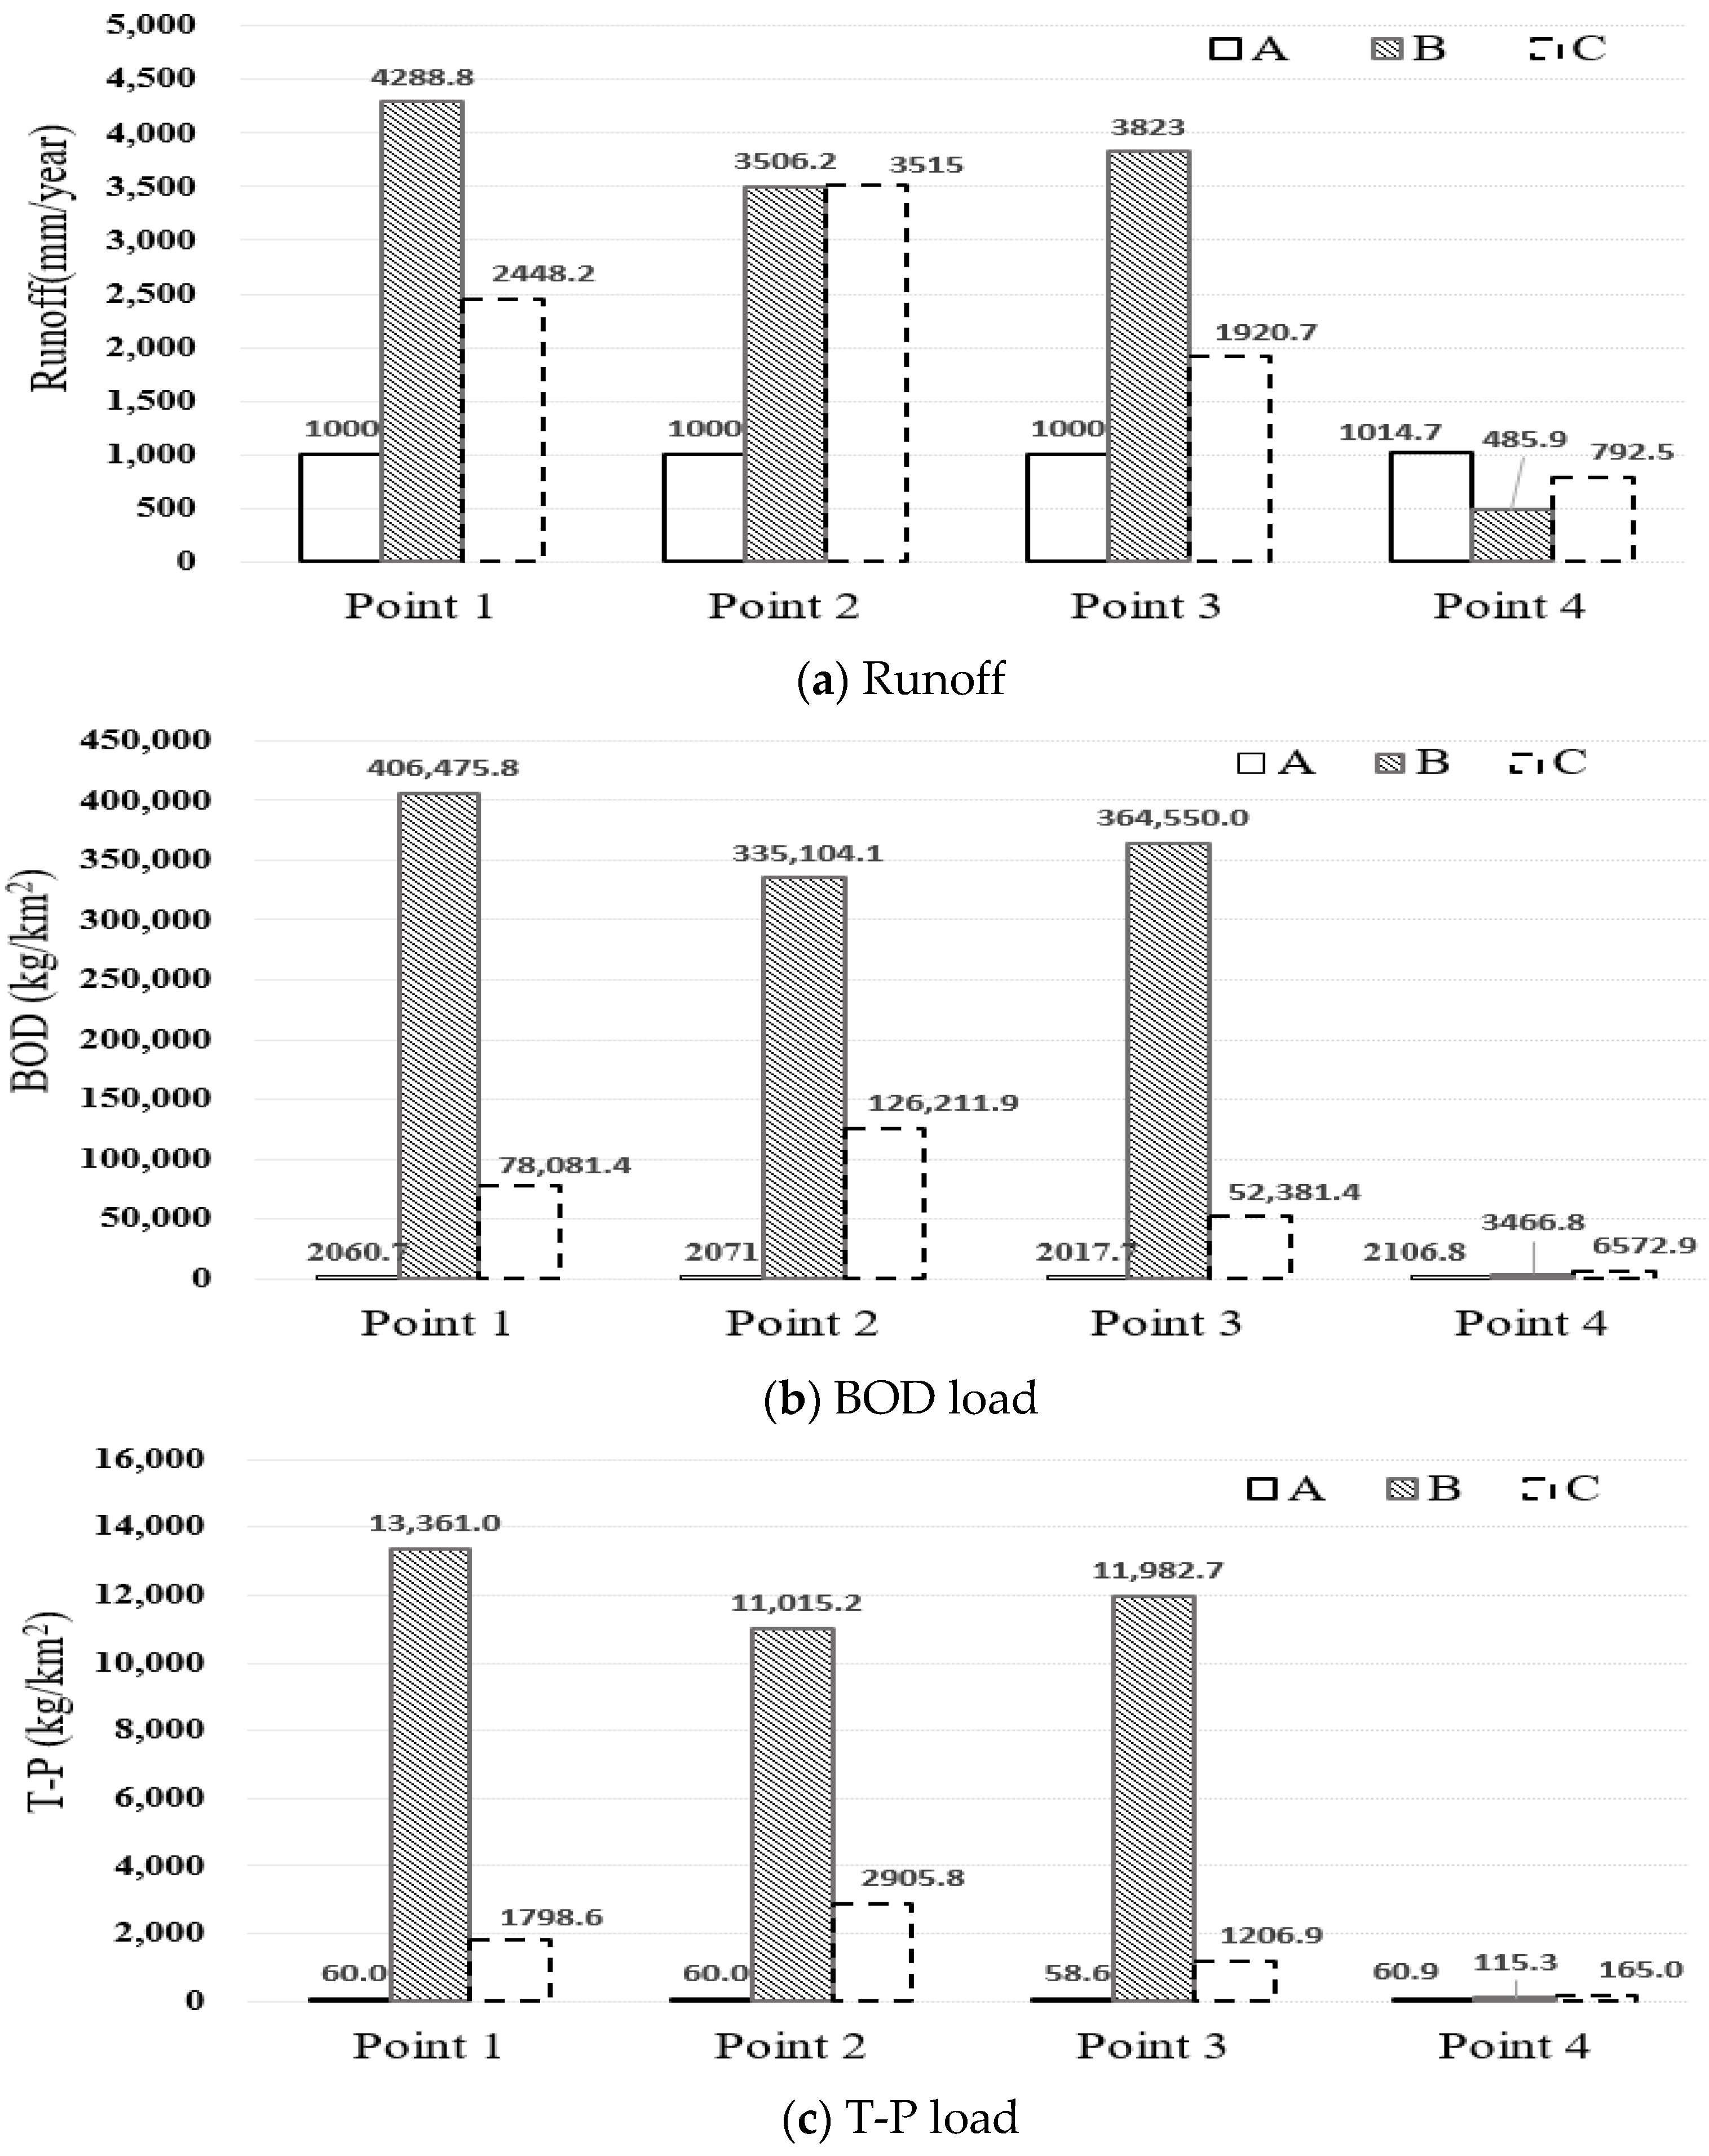
Figure 8 shows the results of the SWMM simulation for each outflow point derived using the weather data pertaining to 2018 and the total rainfall of 1284.1 mm per year. The results of the outflow rate compared to total rainfall (1284.1 mm) are as follows. The outflow rate in region A (point 4) was found to be the highest at 79%. The outflow rate in region B (point 4) was determined to be 37.8%. This may be because the storage tank contained sewage, considering the collection capacity. The outflow rate in region C (point 4) was found to be 61.7%. The final outflow indicated that the pollutant loads were as follows: combined sewer system (region C) > combined sewer system (region B) > separated sewer system (region A). In the case of the combined sewer system, CSOs occurred at point 4 (for region B and C). These results were the same for the combined sewer system, but in region C, the system was without a storage tank, so sewage and rainwater were discharged together. In comparison, region B was equipped with a storage tank (point 4). Since the storage tank capacity (Q = 17,785 m3) was treated, the amount of runoff and pollution emissions were greatly reduced. In the areas with separated sewer systems, we observed similar flow rates and pollutant loads for each point. In the areas with combined sewer systems, the outflow rates of the terminal points in regions B and C were lower than those of the areas with separated sewer systems. However, the pollutant load (BOD and T-P) in the areas with combined sewer types was higher than that of areas with separated sewer systems because, in the combined sewer systems, the outflow included sewage. The analysis of the drainage area outflow points (Figure 7) in regions B and C (points 1 to 3) corresponding to the middle and upper streams of the combined sewer systems showed a high runoff and pollutant load due to the combined sewer network.

3.3. Optimal Effects Analysis by Simulating LID Scenarios

Table 7 shows the results of the analysis of the effects of the LID strategies on water circulation based on the SWMM-LID scenarios shown in Table 4 and Figure 4. When the SC1 scenario, which included the distributed installation of runoff reduction strategies in the impermeable land areas throughout the entire basin, was applied, the outflow-reduction efficiency was observed to be the highest regardless of region and type of sewer system (combined or separated). Similarly, the highest BOD and T-P load-reduction efficiency was observed for the SC1 scenario. Our results revealed that the outflow-reduction efficiency when the SC1 scenario was applied was up to 10 times higher than that when the other scenarios were applied.
When the SC1 scenario was applied, the highest outflow-reduction efficiency (21%) was seen in region B, whereas in regions A and C, the outflow-reduction efficiency was observed to be similar (12%) compared to GI. This difference in outflow-reduction efficiency between region B and regions A and C may be because region B comprised large areas of impermeable land, and the water circulation was improved to a greater extent when the LID distribution was applied to the combined sewer system. When LID was applied, the outflow-reduction efficiency improved in all regions. Moreover, the outflow reduction effects of the scenarios SC2–4 were similar for both GI and LID. The order of pollutant-load-reduction efficiency for all the scenarios was as follows: region B > region C > region A. In the cases of urban separated sewer systems and complex areas, the runoff-reduction efficiency was higher when the SC4 scenario, wherein outflow reduction strategies were concentrated downstream, was applied than that when the SC2 or SC3 scenarios were applied. In the case of urban combined sewer systems, a higher outflow-reduction efficiency was observed when the SC2 scenario, wherein outflow reduction strategies were concentrated upstream, was applied than that when the SC3 or SC4 scenarios were applied. This was because in region A, forests and grasslands were evenly distributed throughout the basin, and the water-permeable area downstream of B and upstream of C was wider than in other areas (Figure 2). A comparison of the SC2–4 scenarios applied to urban and complex areas based on the land-use characteristics of the areas showed that the outflow-reduction efficiency was higher when the outflow reduction strategies were installed in locations with large areas of impermeable land. Previous studies have suggested that the application of LID in distributed to urban areas with a high impermeable area rate can efficiently improve peak flow and pollution load [41,43,44,45]. Therefore, if this method of an area with a high urban density and a large impermeable area is prioritized when selecting the LID location in the watershed, it is expected that the effect of reducing the amount of runoff and pollution load will be high. Therefore, applying outflow reduction strategies to combined sewer systems is recommended regardless of the installation of strategies based on the sewer network distribution and concentration.
Next, the outflow and BOD-reduction efficiencies were analyzed based on rainfall data. Rainfall data pertaining to the period 30 June–3 July 2018, with a rainfall of 157.4 mm, was applied. The outflow-reduction strategy included a tree box filter as an LID, which had a significant impact on the scenario analysis. The flow rate and BOD load for regions A, B, and C before and after the SC1 and SC4 scenarios were applied are shown in Figure 9. The flow rate and BOD load flowing out at the end of the basin were analyzed. When the rainfall intensity was high, the reduction in the BOD load was also high. This reduction in BOD load was higher in the combined sewer system than that in the separated sewer system. For both the urban and complex areas, when the SC1 scenario, wherein outflow reduction strategies were distributed, was applied, the outflow quantity was lower than that when the SC4 scenario, wherein runoff reduction strategies were concentrated downstream, was applied, indicating a higher reduction efficiency due to facility installation. In region B, before the outflow reduction strategies were applied, the outflow was 100.9 mm, whereas when the SC1 scenario was applied, the outflow was 85.7 mm, and when SC4 was applied, the outflow was 96.9 mm. Hence, SC1 presented the highest outflow-reduction effect (15%), which was four times greater than that presented by SC4 (Table 8). Our results indicated the improvement effects of the installation of LID strategies on water circulation when applied to urban areas with combined sewer systems and large areas of impermeable land.

4. Conclusions

Using SWMM, this study analyzed the effects on the runoff outflow characteristics and the impact of GI and LID strategies on the reduction in contamination by non-point pollutant sources and improvement the permeable area and water circulation in urban and complex areas. The results of the study are summarized as follows:
The SWMM simulation for the separated and combined sewer system areas by regional characteristics for 1284.1 mm rainfall revealed that the rainfall outflow in urban area with separated sewer systems was 79%, while in urban areas with combined sewer systems, the rainfall outflow was 37.8%, considering sewage mixing and an intercepted volume. Furthermore, the rainfall outflow for complex areas with combined sewer systems was 61.7%. The pollutant load was observed to be higher in the combined sewer system than that in the separated sewer system. In the case of low rainfall, the flow rate and the pollutant load were lower in the combined sewer system than in the separated sewer system because the sewage flow was diluted, and runoff was collected. During heavy rainfall, however, the sewage was diluted due to rainfall; nevertheless, the total pollutant load was higher in the combined system than in the separated sewer system. Therefore, when applying impermeable surface management strategies, the total volume of the combined sewer system and an initial outflow management of the separated sewer system should be considered.
The scenario analysis using SWMM-LID showed that the installation location of runoff reduction strategies affected its efficiency. The reduction rates of runoff and pollutant load were observed to be high when the strategies deployed to minimize rainfall outflow from the sewers were distributed. Distributed LID installations in urban areas with combined sewer systems could reduce the efficiency by up to 21%. If only intensive installation of LID was possible, it was highly effective in reducing rainfall runoff and improving water circulation when installed in dense urban areas with large areas of impermeable surfaces. LID is recommended for implementation in areas where impermeable surfaces are concentrated as opposed to areas where permeable surfaces are evenly distributed. When selecting a location for LID implementation within an area, areas with a higher permeable area ratio should be prioritized.
The results of the scenario analysis according to rainfall revealed that the reduction efficiency was highest when the SC1 scenario, wherein LID strategies were distributed, was applied regardless of the region and sewer characteristics. When applying this scenario in a dense urban area with a high proportion of impermeable area and a combined sewer system, the outflow was reduced by 15% compared to the that when other scenarios were applied and in other areas, indicating an improvement in water circulation.
Non-point-polluting areas are designated and managed in urban areas with high impermeable surface areas. Measures for non-point pollution and water circulation management are needed when preparing appropriate LID installation standards to prevent reckless urban development and damage to forests. On the basis of the results of this study, we aim to prepare guidelines for deploying LID/GI techniques specific to drainage systems considering artificial water circulation. In the future, these will be applied to an inspection and evaluation study of implementations for the promotion of water circulation policy based on the third Comprehensive Countermeasures for Non-point Pollutants by the Ministry of Environment. Additional policy support studies are needed for the stable operation and implementation of the system, such as calculating management indicators for inspection and evaluation as well as establishing a system.

Author Contributions

All authors contributed meaningfully to this study. Conceptualization, J.M.L. and M.P.; methodology, J.M.L., M.P. and J.-H.M.; software, J.M.L.; validation, J.M.L.; formal analysis, J.M.L. and J.L.; investigation, J.M.L., J.K. and H.J.; resources, J.M.L., J.K. and J.L.; writing—original draft preparation, J.M.L.; writing—review and editing, J.M.L.; visualization, J.M.L., J.L. and H.J.; supervision, M.P. and J.-H.M.; project administration, E.H.N. All authors have read and agreed to the published version of the manuscript.

Funding

This work was supported by a grant from the National Institute of Environmental Research (NIER), funded by the Ministry of Environment (ME) of the Republic of Korea (NIER-2021-01-01-029).

Institutional Review Board Statement

Not applicable.

Informed Consent Statement

Not applicable.

Data Availability Statement

Not applicable.

Conflicts of Interest

The authors declare no conflict of interest.

References

  1. Lee, J.M.; Park, M.; Park, B.K.; Choi, J.; Kim, J.; Kim, K.; Kim, Y. Evaluation of water circulation by modeling: An example of nonpoint source management in the Yeongsan River watershed. Sustainability 2021, 13, 8871. [Google Scholar] [CrossRef]
  2. Sarma, A.K.; Singh, V.P.; Kartha, S.A.; Bhattacharjya, R.K. (Eds.) Urban Hydrology, Watershed Management and Socio-Economic Aspects; Springer: Berlin/Heidelberg, Germany, 2016. [Google Scholar]
  3. Kim, B.S.; Kim, J.M.; Kim, S.S.; Shin, G.W.; Lee, S.J. A study on the runoff reduction according to the calculation method of the LID scale considering the land use area and the application of stormwater storage basin. J. Civ. Environ. Eng. Res. 2021, 41, 229–235. [Google Scholar]
  4. National Institute of Environmental Research (NIER). Customized Policy Support for Nonpoint Pollution Management and Water Circulation Improvement(Ⅲ); National Institute of Environmental Research: Incheon, Korea, 2018. [Google Scholar]
  5. Lee, J.M.; Ryu, J.; Choi, J.; Park, J.H.; Kim, J.; Shin, D.S.; Lee, J. Predicting the effect of impervious area change on water circulation rate in the Geum River watershed using HSPF modeling. Desalin. Water Treat. 2020, 200, 337–350. [Google Scholar] [CrossRef]
  6. National Institute of Environmental Research (NIER). Customized Policy Support for Nonpoint Pollution Management and Water Circulation Improvement(V); National Institute of Environmental Research: Incheon, Korea, 2020. [Google Scholar]
  7. National Institute of Environmental Research (NIER). Policy Support Research for Non-Point Pollution Management and Water Circulation Improvement (Ⅵ); National Institute of Environmental Research: Incheon, Korea, 2021. [Google Scholar]
  8. Qin, H.P.; Li, Z.X.; Fu, G. The effects of low impact development on urban flooding under different rainfall characteristics. J. Environ. Manag. 2013, 129, 577–585. [Google Scholar] [CrossRef] [PubMed] [Green Version]
  9. Luan, Q.; Fu, X.; Song, C.; Wang, H.; Liu, J.; Wang, Y. Runoff effect evaluation of LID through SWMM in Typical mountainous, low-lying urban areas: A case study in China. Water 2017, 9, 439. [Google Scholar] [CrossRef] [Green Version]
  10. Bai, Y.; Zhao, N.; Zhang, R.; Zeng, X. Storm water management of low impact development in urban areas based on SWMM. Water 2019, 11, 33. [Google Scholar] [CrossRef] [Green Version]
  11. Shin, D.S.; Park, J.B.; Kang, D.K.; Jo, D.J. An analysis of runoff mitigation effect using SWMM-LID model for frequently inundated basin. J. KOSHAM 2013, 13, 303–309. [Google Scholar]
  12. Lee, J.; Kang, D.K.; Park, M.; Kim, S. Study for management of non-point source in Sooyeong River watershed using SWMM. J. Korean Soc. Hazard Mitig. 2014, 14, 327–336. [Google Scholar] [CrossRef] [Green Version]
  13. Zhang, K.; Chui, T.F.M.; Yang, Y. Simulating the hydrological performance of low impact development in shallow groundwater via a modified SWMM. J. Hydrol. 2018, 566, 313–331. [Google Scholar] [CrossRef]
  14. Bhandari, S.; Jobe, A.; Thakur, B.; Kalra, A.; Ahmad, S. Flood Damage Reduction in Urban Areas with Use of Low Impact Development Designs. In Proceedings of the World Environmental and Water Resources Congress 2018, Minneapolis, MN, USA, 3–7 June 2018; pp. 52–61. [Google Scholar]
  15. Zhang, K.; Chui, T.F.M. A comprehensive review of spatial allocation of LID-BMP-GI practices: Strategies and optimization tools. Sci. Total Environ. 2018, 621, 915–929. [Google Scholar] [CrossRef]
  16. Zhen, J.X.; Yu, S.L.; Zhai, Y. A planning tool for watershed LID-BMP implementation. In Critical Transitions in Water and Environmental Resources Management, Proceedings of the World Water and Environmental Resources Congress, Salt Lake City, UT, USA, 27 June–1 July 2004; American Society of Civil Engineers: Reston, VA, USA, 2014; pp. 1–10. [Google Scholar]
  17. Kuller, M.; Bach, P.M.; Ramirez-Lovering, D.; Deletic, A. The location choice of water Sensitive Urban Design within a city: A case study of Melbourne. In Proceedings of the IWA World Water Congress and Exhibition, Brisbane, Australian, 9–13 October 2016. [Google Scholar]
  18. Vittorio, D.D.; Ahiablame, L. Spatial translation and scaling up of low impact development designs in an urban watershed. J. Water Manag. Model. 2015. [Google Scholar] [CrossRef] [Green Version]
  19. Baek, S.S.; Ligaray, M.; Park, J.P.; Shin, H.S.; Kwon, Y.; Brascher, J.T.; Cho, K.H. Developing a hydrological simulation tool to design bioretention in a watershed. Environ. Modell. Softw. 2019, 122, 104074. [Google Scholar] [CrossRef]
  20. National Institute of Environmental Research (NIER). A Study on the Policy Implementation and Evaluation System for Achieving Hydrologic Cycle Target; National Institute of Environmental Research: Incheon, Korea, 2020. [Google Scholar]
  21. Rossman, L.A. Storm Water Management Model User’s Manual Version 5.1; United States Environmental Protection Agency: Washington, DC, USA; Water Supply and Water Resources Division, National Risk Management Research Laboratory: Cincinnati, OH, USA, 2015.
  22. Baek, S.S.; Choi, H.; Park, J. Low impact development modeling: Literature review and suggestion for future work. J. Korean Soc. Environ. Eng. 2019, 41, 292–299. [Google Scholar] [CrossRef] [Green Version]
  23. Woon, E.; Jang, C.L.; Lee, K. Runoff analysis according to LID facilities in climate change scenario—Focusing on Cheonggyecheon basin. J. Korea Water Resour. Assoc. 2020, 53, 583–595. [Google Scholar]
  24. U.S. Environmental Protection Agency (USEPA). Storm water management model User’s manual version. Water Res. 2015, 5, 72–79. [Google Scholar]
  25. Donigian, A.S. Watershed model calibration and validation: The HSPF experience. In Water Environment Federation, National TMDL Science and Policy; Water Environment Federation: Alexandria, VA, USA, 2002; pp. 44–73. [Google Scholar]
  26. U.S. Environmental Protection Agency (USEPA). Lecture. Watershed Model Calibration and Validation: Issues and Procedures-# 15; U.S. Environmental Protection Agency (USEPA): Washington, DC, USA, 2011; Volume 11.
  27. Shin, M.H.; Jeon, J.H. Comparison of Characteristics of Nonpoint Source Pollution from Separate and Combined Sewer System. J. Korean Soc. Water Environ. 2017, 33, 97–106. [Google Scholar]
  28. Arjenaki, M.O.; Sanayei, H.R.Z.; Heidarzadeh, H.; Mahabadi, N.A. Modeling and investigating the effect of the LID methods on collection network of urban runoff using the SWMM model (case study: Shahrekord City). Model. Earth Syst. Environ. 2021, 7, 1–16. [Google Scholar] [CrossRef]
  29. Lee, H.W.; Choi, H.J. Analysis of Rainfall-runoff characteristics in Shiwha industrial watershed using SWMM. J. Korean Soc. Environ. Eng. 2015, 37, 14–22. [Google Scholar] [CrossRef]
  30. Kang, T.U.; Lee, S.H. Development on an automactic calibration module of the SWMM for watershed runoff simulation and water quality simulation. J. Korea Water Resour. Assoc. 2014, 47, 343–356. [Google Scholar] [CrossRef] [Green Version]
  31. James, W.; Huber, W.C.; Dickinson, R.E.; Pitt, R.E.; James, W.R.C.; Roesner, L.A.; Aldrich, J.A. Users Guide to SWMM; CHI: Ontario, CA, USA, 2005. [Google Scholar]
  32. Mao, X.; Haifeng, J.; Shaw, L.Y. Assessing the ecological benefits of aggregate LID-BMPs through modelling. Ecol. Model. 2017, 353, 139–149. [Google Scholar] [CrossRef]
  33. Rodríguez, R.; María, I.; Alejandro, L.G.M. A Discussion on the Application of Terminology for Urban Soil Sealing Mitigation Practices. Int. J. Environ. Res. Public Health 2022, 19, 8713. [Google Scholar] [CrossRef] [PubMed]
  34. Chen, C.; Wenshan, G.; Huu, H.N. Pesticides in stormwater runoff—A mini review. Front. Environ. Sci. Eng. 2019, 13, 1–12. [Google Scholar] [CrossRef]
  35. Fletcher, T.D.; Shuster, W.; Hunt, W.F.; Ashley, R.; Butler, D.; Arthur, S.; Trowsdale, S.; Barraud, S.; Semadeni, D.A.; Bertrand, K.J.L.; et al. SUDS, LID, BMPs, WSUD and more the evolution and application of terminology surrounding urban drainage. Urban Water J. 2015, 12, 525–542. [Google Scholar] [CrossRef]
  36. Jang, Y.S.; Mun, S.H.; Yang, S.L. An analysis of flood mitigation effect applying to LID in mokgamcheon watershed using SWMM model. Highw. Eng. 2013, 15, 75–83. [Google Scholar] [CrossRef]
  37. Lin, W.G.; Ryu, S.W.; Park, D.G.; Lee, J.H.; Cho, Y.H. Performance evaluation of the runoff reduction with permeable pavements using the SWMM model. Int. J. Highw. Eng. 2015, 17, 11–18. [Google Scholar] [CrossRef]
  38. Ministry of Environment. Manual for Installation and Management of Non-Point Pollution Reduction Facilities; Ministry of Environment: Sejong, Korea, 2020.
  39. Kim, E.S. Analysis of runoff according to Application of SWMM-LID Element Technology (I): Parameter Sensitivity Analysis. J. Korean Soc. Hazard Mitig. 2020, 20, 437–444. [Google Scholar] [CrossRef]
  40. Yeon, J.S.; Kim, S.D.; Choi, H.I.; Shin, H.S.; Kim, E.S. Rainfall runoff reduction analysis for the construction and maintenace costs of LID facilities. J. Korean Soc. Hazard Mitig. 2015, 15, 281–287. [Google Scholar] [CrossRef] [Green Version]
  41. Lee, J.; Kim, J.; Lee, J.M.; Jang, H.S.; Park, M.; Min, J.H.; Na, E.H. Analyzing the Impacts of Sewer Type and Spatial Distribution of LID Facilities on Urban Runoff and Non-Point Source Pollution Using the Storm Water Management Model (SWMM). Water 2022, 14, 2776. [Google Scholar] [CrossRef]
  42. National Institute of Environmental Research (NIER). Customized Policy Support for Nonpoint Pollution Management and Water Circulation Improvement (IV); National Institute of Environmental Research: Incheon, Korea, 2019.
  43. Wang, M.; Zhang, Y.; Zhang, D.; Zheng, Y.; Li, S.; Tan, S.K. Life-cycle cost analysis and resilience consideration for coupled grey infrastructure and low impact development practices. Sustain. Cities Soc. 2021, 75, 103358. [Google Scholar] [CrossRef]
  44. Lee, J.; Lee, Y.; Choi, J. Analysis of water cycle effect according to application of LID techniques. J. Wetl. Res. 2014, 16, 411–421. [Google Scholar] [CrossRef] [Green Version]
  45. Darnthamrongkul, W.; Mozingo, L.A. Toward sustainable storm water management: Understanding public appreciation and recognition of urban Low Impact Development (LID) in the San Francisco Bay Area. J. Environ. Manag. 2021, 300, 113716. [Google Scholar] [CrossRef] [PubMed]
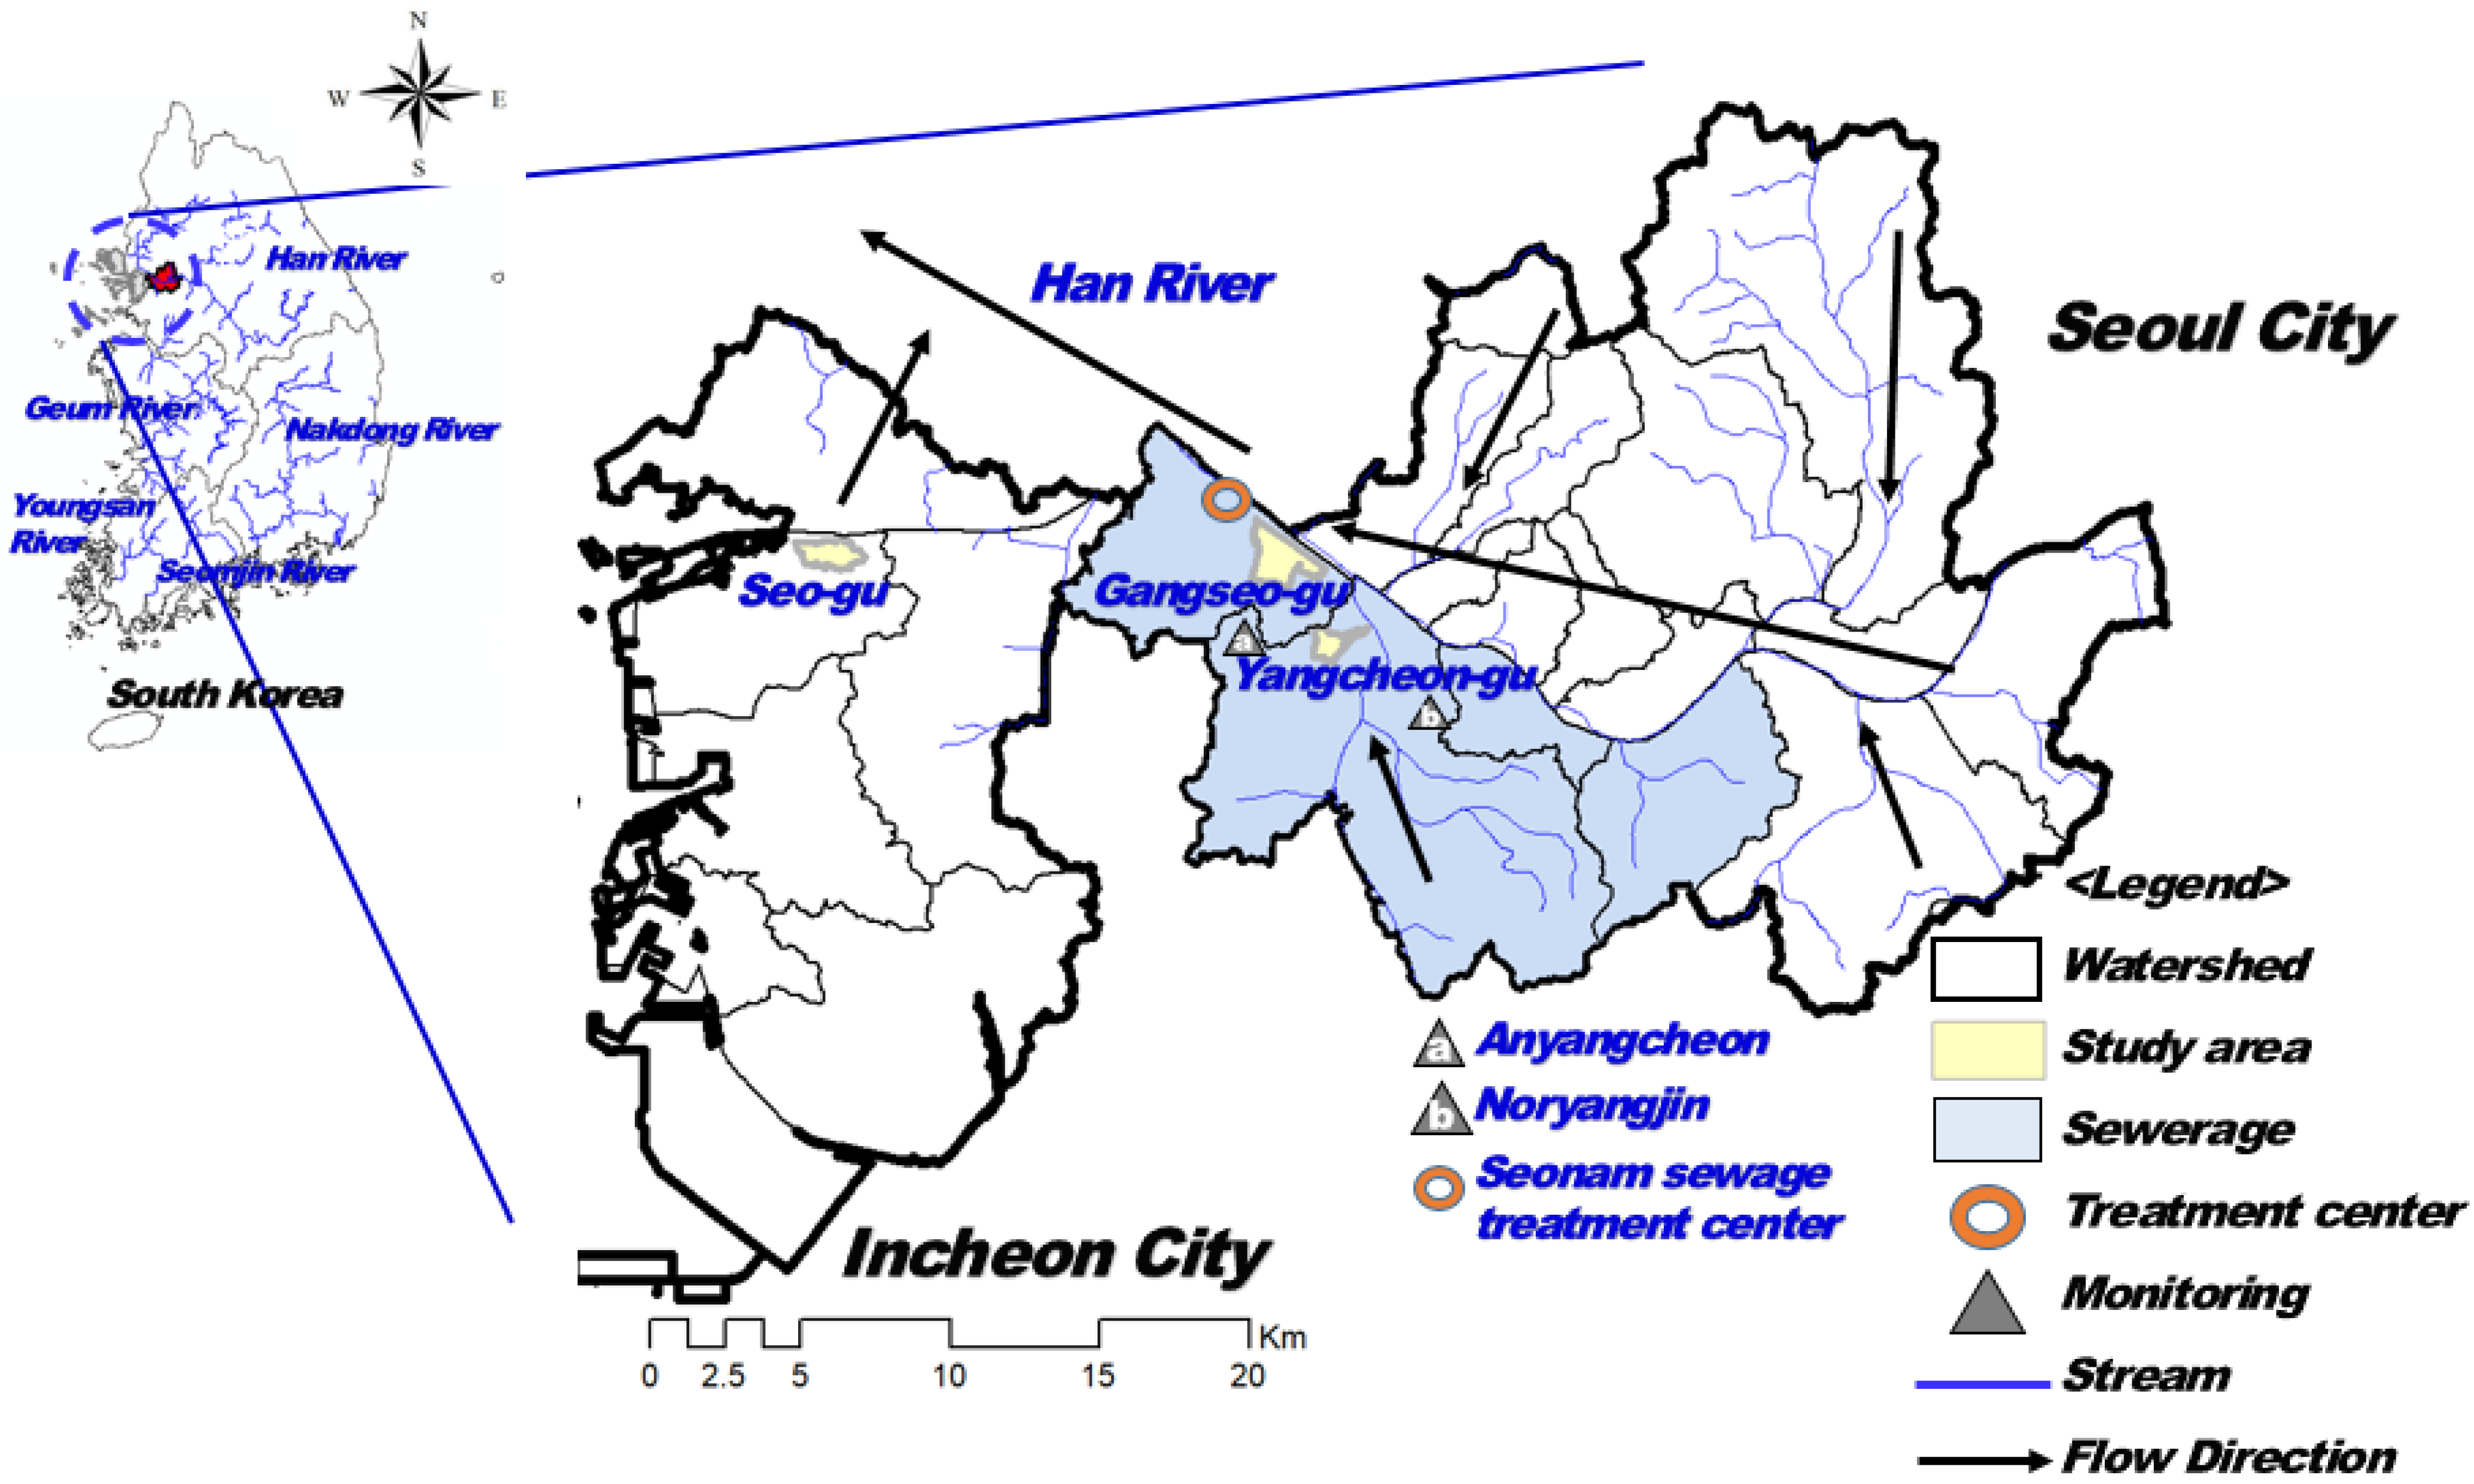
Figure 1. Study area.
Sustainability 14 14662 g001
Figure 2. Land-use status of the study area.
Sustainability 14 14662 g002
Figure 3. SWMM-LID surface runoff concept [24].
Sustainability 14 14662 g003
Figure 4. Scenarios of runoff reduction strategies for optimal effect analysis.
Sustainability 14 14662 g004
Figure 5. SWMM construction results (outflow path).
Sustainability 14 14662 g005
Figure 6. Water-level-monitoring points and results for model validation.
Sustainability 14 14662 g006aSustainability 14 14662 g006b
Figure 7. Drainage area runoff points.
Sustainability 14 14662 g007
Figure 8. Simulation results of runoff and NPS pollutant load by spillage point.
Sustainability 14 14662 g008
Figure 9. Analysis of reduction effect by rainfall scenario.
Sustainability 14 14662 g009aSustainability 14 14662 g009b
Table 1. Land-use status of the study area and the utilization ratio of the study regions.
CategoryUrban Area (Seoul)Complex Area (Incheon)
Gangseo-gu
(Separated Sewer)–
Region A
Yangcheon-gu
(Combined Sewer)–
Region B
Seo-gu
(Combined Sewer)–
Region C
Area (km2)Ratio (%)Area (km2)Ratio (%)Area (km2)Ratio (%)
Public area0.13.60.022.50.031.9
Industrial area0.051.9----
Traffic area1.3750.10.3134.00.4830.4
Commercial area0.3512.80.099.70.074.4
Residential area0.238.50.3942.40.148.9
Sports facilities0.062.30.021.90.010.6
Cultivation site0.145.10.010.80.053.2
Forest0.4315.70.088.880.3824.1
Rice field----0.106.3
Field----0.2415.2
Bare land----0.085.1
Total2.731000.911001.58100
Table 2. SWMM input data.
CategoryInput Parameters
Weather dataHourly data of rainfall in 2018 (Seoul Meteorological Observatory)
Pipeline dataName of the pipeline, upstream manhole, downstream manhole, pipeline shape, circular pipeline tubule, spherical pipeline width/height, pipeline extension, upstream ground height, upstream invert level, downstream invert level, downstream ground height, pipe slope, and roughness coefficient
Manhole dataManhole name, manhole specification, ground level, invert level,
and small basin information
Basin dataName of small basin, basin area (area by small basin), basin width, basin slope, water permeability (water permeability coefficient), water permeability surface storage, water permeability roughness coefficient, and water permeability loss factor
Interior drainage facility
(restrictions)
Drawings and specifications of connection status with existing pipelines to interior drainage facilities such as sewage storage facilities and rainwater pumping stations
Table 3. Selected values of SWMM-LID parameters.
LayerParametersGI StrategyLID Strategy
Permeable PavementTree Box Filter
SurfaceStorage depth (mm)100100
Vegetation0.00.0
Surface roughness (Mannings n)0.0120.13
Surface slope (%)21
SoilThickness (mm)200800
Porosity0.4370.437
Field capacity0.0620.062
Wilting point0.0240.024
Conductivity (mm/hr)120120
Conductivity slope3030
Suction Head (mm)4949
PavementThickness (mm)60-
Void ratio0.2
Impervious surface fraction0
Permeability (mm/hr)13
StorageThickness (mm)200300
Void ratio0.50.5
Conductivity (mm/hr)1313
Clogging factor00
Table 4. Scenarios of runoff reduction strategies for optimal effect analysis.
ScenariosGI StrategyLID Strategy
Permeable PavementTree Box Filter
SC1distributed3% area reduction in impermeable area *
SC2concentratedupstream
SC3midstream
SC4downstream
* Target reduction rate set in the 3rd comprehensive non-point source pollutants management plan by Korean ME.
Table 5. Characteristics of the sewer networks and sub-catchments in the study regions.
CategorySewer System TypeArea (km2)Sewer Length
(km)
Number of Sub-catchmentsNumber of SewersManhole,
Number of Spills
Urban areasSeparated sewer
(region A)
2.7330.3470498483
Combined sewer
(region B)
0.9116.9276310279
Complex
areas
Combined sewer
(region C)
1.5818.5438446444
Table 6. Reliability analysis results for SWMM.
SeparatedR2NSECorrelation
Anyangcheon0.81 (Very good)0.72 (Good)0.90 (Very good)
Noryangjin0.69 (Good)0.64 (Fair)0.83 (Very good)
NSE, Nash–Sutcliffe efficiency.
Table 7. Reduction efficiency analysis results by LID scenario (unit: runoff (mm/year), load (kg/km2)).
CategoryScenarioUrban Area (Seoul)Complex Area
(Incheon)
Region ARegion BRegion C
GILIDGILIDGILID
RunoffBase1014.7485.9792.5
SC1Distribution897.7
(−11.5%)
891.5
(−12.1%)
394.7
(−18.8%)
386.0
(−20.6%)
715.9
(−9.7%)
713.4
(−10%)
SC2Conc. *Upstream932.7 (−8.1%)454.9 (−6.4%)760 (−4.1%)
SC3Midstream946.3 (−6.7%)457.0 (−6%)763.2 (−3.7%)
SC4Downstream943.3 (−7%)456.3 (−6.1%)758.5 (−4.3%)
B
O
D
Base2106.83466.86572.9
SC1Distribution1863.4
(−11.6%)
1850.3
(−12.2%)
2925
(−15.7%)
2905.2
(−16.2%)
6095.4
(−7.26%)
6092.4
(−7.31%)
SC2Conc. *Upstream1936.0 (−8.1%)3254.3 (−6.2%)6377.7 (−3%)
SC3Midstream1964.5 (−6.8%)3263.8 (−5.9%)6408.9 (−2.5%)
SC4Downstream1958.3 (−7%)3269.2 (−5.8%)6362.6 (−3.2%)
T-PBase60.9115.3165
SC1Distribution53.8
(−11.5%)
53.5
(−12.2%)
97.2
(−15.7%)
96.6
(−16.3%)
153.1
(−7.2%)
152.9
(−7.4%)
SC2Conc. *Upstream55.9 (−8.1%)108.5 (−5.9%)160.2 (−2.9%)
SC3Midstream56.8 (−6.7%)108.9 (−5.6%)160.8 (−2.5%)
SC4Downstream56.6 (−7%)109.0 (−5.5%)159.8 (−3.1%)
* Concentration; BOD, biological oxygen demand; GI, green infrastructure; LID, low-impact development; T-P, total phosphorous.
Table 8. Analysis of reduction effect by rainfall scenario (unit: Flow (mm/hr), load (kg/km2)).
ScenarioUrban AreaComplex Area
Separated Sewer System
(Region A)
Combined Sewer System
(Region B)
Combined Sewer System
(Region C)
FlowBODT-PFlowBODT-PFlowBODT-P
Base127.4415.812.021100.983627.849123.31442.936.442
SC1112.8
(−11.4%)
368.1
(−11.5%)
10.647
(−11.4%)
85.7
(−15%)
763.4
(−8.7%)
25.293
(−9.2%)
113.2
(−8.2%)
1373.6
(−4.8%)
34.895
(−4.2%)
SC2125.2
(−1.7%)
408.4
(−1.8%)
11.813
(−1.7%)
96.9
(−4%)
813.5
(−2.7%)
27.093
(−2.7%)
118.9
(−3.6%)
1411.5
(−2.2%)
35.621
(−2.3%)
SC3125.2
(−1.7%)
408.6
(−1.7%)
11.817
(−1.7%)
97.3
(−3.6%)
815.1
(−2.5%)
27.156
(−2.5%)
118.5
(−4%)
1410.4
(−2.3%)
35.596
(−2.3%)
SC4124
(−2.7%)
404.6
(−2.7%)
11.697
(−2.7%)
97.2
(−3.7%)
816.9
(−2.3%)
27.163
(−2.5%)
118.6
(−3.8%)
1410.2
(−2.3%)
35.632
(−2.2%)
Publisher’s Note: MDPI stays neutral with regard to jurisdictional claims in published maps and institutional affiliations.