Abstract
If infiltration is uncontrolled and admits unconditioned air, the results will be undesirable. Controlling this problem will increase thermal comfort and decrease energy consumption. The aim of this paper is to assess the performance of different materials used to improve airtightness, which will increase energy efficiency. This research primarily adopted an experimental approach. A typical residential building in UAE was chosen as a case study. Current airtightness status was measured using a blower door test and infrared technique. Six commonly used materials used for airtightness in UAE were identified and applied in different zones of the building envelope, including exterior walls, door and windows. The test was run before implementing airtightness strategies, following which they were applied for one year. Overall performance and energy reduction were monitored to identify how consumption fell by which method was the most efficient. The results indicate that energy was 3% when applying the 6 different airtightness strategies. The base case energy consumption was 64,287 kWh per year. The energy consumption then decreased after applying the sealants to 62,341 kWh per year. Future recommendations are made to enhance airtightness in residential buildings in a hot and arid climate.
1. Introduction
The energy demand from building construction continues to increase and building sectors are responsible for 36% of global energy consumption and almost 40% of total CO2 emissions [1]. With buildings in the UAE consuming 80% of the country’s energy, the building sector has a key role to play in terms of energy efficiency [2]. Poor airtightness within buildings will result in high energy consumption. UAE was listed as fifth in terms of CO2 emissions per capita, with 40% of yearly electric loads coming from HVAC equipment and up to 60% of emissions occurring during the summer [3]. This alarming fact highlights the urgent need for urgent strategies to increase energy efficiency in buildings While attention is generally paid to the installation of the most efficient HVAC systems and thermal insulation in buildings, there has been little focus on the unintentional loss or gain of air from these buildings. In many countries, infiltration is the dominant source of outdoor air. Providing an appropriate comfortable indoor environment at minimal energy costs is a complex optimization process that includes, but may not be dominated by, airtightness concerns [4]. Sinnott (2011) [5] defined airtightness as “the flow through the building envelope as a function of pressure across it and thus leakage testing is based on the fundamental mechanics of airflow”. This means airtightness expresses the resistance of the building envelope to airflow paths in the building. Several studies have found that occupation of the dwelling can cause a 20–100% increase in leakage and there are large effects of weather conditions as well as the age of the construction on airtightness [6]. Thus, the effectiveness of airtightness strategies varies over time. A study in Belgium on the durability of airtightness of passive houses (ACH50 < 0.6 upon completion) reported that the average air leakage of houses increased by 30% just 2 years after the project had been completed [7]. Air leakage typically occurs through cracks and joints in the building envelope and through the use of doors. In the summer, infiltration can bring humid outdoor air into the building, which is also caused by wind, stack effect, and mechanical equipment within the building. Poor airtightness can lead to large infiltration rates, eventually causing an increase in energy consumption [8]. According to the Clean Energy Business Council in 2018 [9], residential buildings consume 18% of the GCC’s overall energy consumption and 43% of its electricity. Several researchers [10] have emphasized that improving the airtightness of buildings will lead to increased energy efficiency and savings. Authors in the UAE [11] have studied the impact of building characteristics and occupants’ behavior on the electricity consumption of households in Abu Dhabi. However, their calculations were not based on the potential impact of infiltration. The authors therefore recommended conducting a future study to assess the impact of airtightness of different type of buildings. Further research is thus needed in the field of airtightness, especially in UAE buildings. Consequently, the aim of this study was to enhance the energy efficiency of buildings while taking into account the airtightness of residential buildings in the UAE. The next section reviews relevant literature in this field.
2. Literature Review
2.1. The Importance of Airtightness in Buildings
To control airtightness factors, it is essential to first understand the contribution of cooling load components. In a medium-size building in the USA, these are 10% for duct leaks, 12% for duct gain, 16% for appliances, 20% for roof, 6% from walls, 30% from windows, and 6% through infiltration [12]. This shows that windows have high potential for heat exchange and addressing this will help to achieve greater airtightness. Previous studies in a hot climate predicted that potential annual cooling load and energy savings will reach 9.3% when accompanied by an 81% improvement in airtightness performance [13]. Numerous studies have highlighted the disadvantages of low-quality construction implementation with respect to airtightness, and concluded that the annual energy consumption of an insulated residence with an ACH rate of 2.5 accounts for poor implementation—roughly the same as a similar uninsulated case in which the ACH rate was 0.25 (29,942 kWh compared to 30,075 kWh). In addition, when altering the ACH rate, the cooling load demand remained steady at approximately 25,000 and 20,000 kWh for uninsulated and insulated cases, respectively [14]. Nevertheless, improving airtightness also helped to reduce the heating load, thus reducing the energy consumption up to 36% of the annual energy consumption [15]. Although the UAE produces its own energy, its energy balance in 2017 reached an overall consumption level of 110.60 billion kWh of electric energy per year, an average of 11,766 kWh per capita [16]. According to the Emirates Green Building Council, [17] the common points of air leakages are distributed as follows: 2% in electric outlets, 36% in floors, walls, and ceiling, 17% in ducts, 15% in pluming, 13% in doors, and 12% in windows. Unfortunately, in the UAE the airtightness regulations are not especially strict and therefore design teams are not particularly concerned with the airtightness of buildings (unless it has been specified by the client). To understand this, it is important to review the global experience in this field.
2.2. The Global Status of Building Airtightness
Improving airtightness has multiple benefits. For instance, one study [18] linked an improvement in thermal comfort and air quality with improved airtightness in low-income housing in Spain. An important study in Finland [19] concluded that in residential buildings, the construction method and insulation materials have an effect on airtightness performance that is distinct from the choice of structure, stories, and the ventilation strategies of the construction technology. Based on extensive airtightness measurements carried out in 159 social housing buildings in Southern Europe, another study [20] proposed the climate zone and age or year of construction as two more factors fundamental in determining airtightness performance. An experimental study in Korea [21] of two- story office buildings concluded that airtightness values may differ according to the measurement method and size of the buildings. Table 1 summarizes the results of recent studies of building airtightness, which will form a point of comparison for the results of the current study.

Table 1.
Summary of global studies on building airtightness status.
2.3. Methods for Measuring Airtightness
Small cracks and crevices can cause a gap where air exchange will take place. Multiple methods can be employed to accurately measure air infiltration. The blower door technique is now an extremely popular and reliable method for measuring air infiltration. This method comprises three components: a calibrated fan, a door panel system, and a device to measure fan flow and building pressure. The blower door fan should be sealed into an exterior doorway using the door panel frame. The fan then blows air into or out of the zone or outside the building, which creates a small pressure difference between the internal and external environments. The most common method is to suck air out of the room using the blower door. As a result, the air pressure inside the room is lower than it is outside air; usually the difference is about 50 Pascal. In the context of Ireland, another researcher evaluated Irish dwellings using a standard blower door test and found that a 22% improvement in airtightness may save an estimated average of 361 kWh per dwelling [29]. The blower door method has also been used in Turkey to test the effect of airtightness on energy consumption in container houses. These authors found that an 81% improvement might lead to a 9.3% reduction in annual energy demand [13]. Another notable method is the use of a thermal camera. Due to the pressure differences between indoor and outdoor environments, the air outside will rush into the building through the cracks or joints. This air will cool the location where a crack is located. This temperature discrepancy will clearly show up in the thermal image as a cold spot or cold area, allowing the operator to accurately locate and map the air infiltration pathway. This method will help inspectors and researchers detect not only air infiltration but also insulation defects, thermal bridges and moisture problems. This method has been adopted by numerous researchers. For instance, a study in China used the infrared camera to measure indoor and outdoor parameters such as air velocity, temperature, and pressure. Cracks were then identified by means of theoretical heat transfer and fluid mechanics analysis. The authors concluded that the error was within 3% [30]. Some researchers have adopted both methods; for example, a study in Australia [31] used both the blower door and thermal imaging to test 125 houses, providing the researchers with accurate measures of airtightness. Finally, simulation software can also be used [32] as well as manual calculations [33]. Having reviewed the literature, the next section describes the methods adopted for this research.
3. Methodology
3.1. Research Design
A medium residential building, a villa in Dubai, was chosen as a base case for this research. Figure 1 illustrates the case study and Table 2 presents the specifications of the villa. The actual energy consumption was collected by the villa owners from September 2017 to August 2018. The researcher sealed all cracks and gaps in the houses except for windows/door glazing frames, as these were the main areas that needed to be studied. The gaps therefore sealed included: ends of floor joists, joist hangers, around doors, beneath doors and door frames, along the top and bottom edges of skirting boards, between and around sections of suspended floors, around loft hatches, through the eaves, around roof lights, through gaps behind plasterboard, cracks and holes, around the supplies from external meter boxes, around a wall-mounted fan, around pull switches, boiler flues and heating pipes, around waste pipes passing into floor voids and through recessed spotlights. Thus, the only parts left untouched were the glazing windows and the glazing doors along with their frames. Following this procedure, the blower door test was conducted on 1 September 2018 to determine the airtightness of the building. According to European Commissions, the blower door test was used first in Europe to measure the air leakage of the building envelope, but is now explicitly described in the European Standards EN-13829 [34]. The blower door test was conducted on 6 zones where the window in each was treated using one of the 6 sealing methods, which comprised 2 types of sealants, 2 types of tapes, and a foam and liquid membrane. Table 3 explains each zone in terms of the room area, glazing area, and presents images of the products along with their specifications. Each product was applied inside and outside around the window frames for zones 1, 2, 3, 4, and 5 separately. Sealants were applied inside and outside on the edge of the glazing. Figure 2 illustrates the window sections and marks the exact location of the sealant application. All these zones were then closed and the test was conducted for the entire house, including ground floor glazed door frames. The results were then obtained and compared, following which, the energy consumption for one year was monitored to study the effect in each zone.
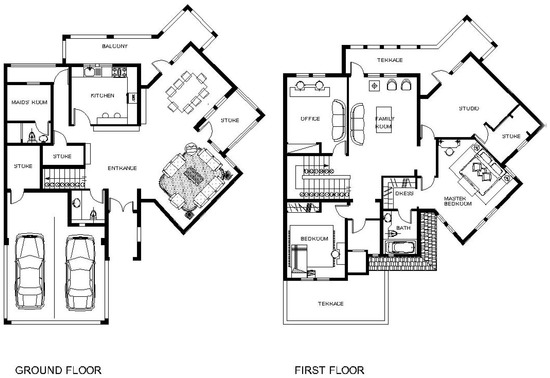
Figure 1.
Map of the case study building (not to scale).
Table 2.
Specifications of case study.
Table 3.
Test zones and sealing strategies with their specifications.
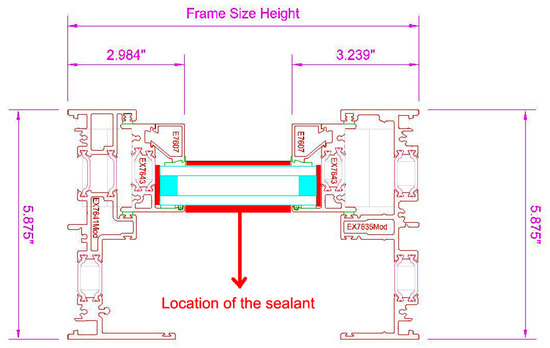
Figure 2.
Architectural details of windows with the location of the sealant.
3.2. Test Procedure
The test initially took place on 1 September 2018 without any glazing improvement; this was the “baseline” stage. The airtightness of the villa envelopes was measured using a fan pressurization test in each zone separately, where the fan was used to create a series of pressure differences across the building envelope between the building interior and the outdoors. The test method complied with ASTM Standard E779 (ASTM, 2010) which describes the fan pressurization test procedure in detail, including specifications of the test equipment and analysis of the test data [35]. The tenants were asked to leave the house for three days. Precautions were taken to ensure there was minimal damage to the glazing windows and doors. The HVAC system was completely shut off and emergency contacts were collected. The test itself involved: (1) collecting baseline and induced envelope pressure and test fan flow data using a central computer; (2) analyzing data using the methods in E779 while still in the test building with the test equipment still installed; (3) identifying problems with test data, correcting problems in the building test conditions if necessary (e.g., doors blowing open), and collecting additional data to correct the problem; (4) reporting the data in terms of CFM (m3/h) at 50 and 75 Pa induced envelope pressure, CFM/ft2 (m3/h per m2) above grade enclosure at 50 and 75 Pa, and CFM/ft2 (m3/h per m2) of total enclosure at 50 and 75 Pa; (5) reporting the test results for the baseline case in terms of the airflow rate at a certain reference pressure difference divided by the building volume, floor area, and envelope surface area. On 2 September 2018, the sealing company was received in the villa and each zone was sealed. This was the “base case” stage. Figure 2 illustrates the structural details and sealing locations of the glazing windows. On 3 September 2018, the same procedure using the blower door was conducted (defined as the “airtight case” stage). Energy reduction was monitored from 4 September 2018 till 4 September 2019. The results were then collated and are analyzed in Section 4. When the openings of the air movement were temporarily covered, the measuring devices were connected to the internal and external referencing pressure tubes. The differences in zero flow pressure were recorded where (Δp0,1+) is the average of the positive values recorded over a minimum of 30 s, (Δp0,1-) is the average of the negative values recorded over a minimum of 30 s, and (Δp0,1) is the average of all values recorded over a minimum of 30 s. Adequate time was allowed for induced pressure to stabilize throughout the building envelope. Tenants were assured that the villa would not become over-pressurized (>100 Pa) as this would have presented a risk to the internal finish and fabric of the villa.
3.3. Thermal Imaging
Thermal imaging testing is an important quality control measure with respect to assessing building airtightness. It is difficult to identify small air gaps using building airtightness testing alone, therefore, in this research, a camera was used to identify patterns of heat loss that are invisible to the naked eye [36]. The thermal imaging and blower door test complement each other and their combined use quickly indicated air leaks within the case study. Initially, the thermal imaging helped the researcher to identify the insulation defects in roofs and floors and general air leakage everywhere except the windows. After fixing all these leakages, the glazing was ready for the test. Thermal imaging was used to assess the window performance before and after applying the different sealants. The camera used for this research was a FLIR E95 Thermal Camera. It has a sensitivity of 0.03 °C View and measures temperatures from −4 to 2732 °F (−20 to 1500 °C).
3.4. Mathematical Background
3.4.1. Airflow Rate
To predict the air permeability at 4 Pa and 50 Pa, m3/(h·m2), the following power law equation was used to predict building leakage [37]:
where:
Q = C × ΔPn
Q = the air leakage rate (m3/s),
C = the flow coefficient m3/(s.Pan),
ΔP = the building pressure (Pa),
n = the pressure exponent.
3.4.2. Fan Pressure (FP)
This is the fan pressure measured when using a self-referenced fan or when the internal zone pressure is negative. When using a fan which is not self-referenced and the zone is positive, fan pressure is calculated by subtracting the measured zone pressure from the absolute value of the fan pressure.
If the Pr A > 0 and fan are not self-referencing, then FP= |PrB| − PrA.
If the PrA < 0 or fan is self-referencing, then FP = PrB.
3.4.3. Airtightness in a Specific Flow Rate
The airtightness for a specific flow rate can be expressed as equivalent leakage area and normalized leakage area. The specific flow rate w50 can be defined as airflow through the building envelope at 50 Pa divided by the floor area at pressure of 50 Pa [38]. Thus:
where:
W50 = Q/Afloor
W50 = specific flow rate at pressure differences of 50 Pa (cm2),
Q = the leakage air volume flow rate of a fan with a pressure difference of 50 Pa (m3/h),
Afloor = floor area (m2).
3.4.4. Air Permeability
The final air leakage results were expressed as a rate of leakage per hour per square meter of the villa envelope at a reference pressure differential of 50 Pa (m3·h−1·m−2 @50 Pa). This was calculated by dividing the total leakage flow rate (Q50) by the envelope area (AE) [39]. Thus:
where:
AP50 = Q50/AE
Q50 = CL × 50n,
AP50 = air permeability,
Q50 = air leakage rate at a pressure differences of 50 Pa,
AE = envelope area m2,
CL = air leakage coefficient,
50n = differential pressure.
4. Results
4.1. Thermography Analysis
The infrared camera was used to identify the leakage around the windows. The air leakages appear as blue on the IR screen while the blue patches indicate the conductive heat gain. Table 4 illustrates the thermal imaging of the baseline where heat and leakages were indicated. The table also suggests solutions and provides feedback on each zone. Obviously, the leakage is apparent in the gaps of the frame, making significant infiltration.
Table 4.
Thermography analysis of the zones.
4.2. Baseline Airtightness Performance
In this stage, the blower door test was implemented to assess the six zones. The results are summarized in Table 5 and clearly show that air leakage was relatively high. The vast majority of airflow at 10 Pa, and Q10 was 592.45 m3/h which appeared in the villa excluding the test zones, followed by the master bedroom which presents 201.41 m3.
Table 5.
Base Case Air Leakage Test.
4.3. Airtight Case Performance
In this stage, the sealants were applied as per Table 3. Each zone was allocated a certain sealant to test its efficiency. Table 6 presents the results of the leakage test after applying the sealants. These indicate lower air leakage with a different percentage in each zone. The villa, excluding the test zone, had airflow at 10 Pa, the Q10 was 592.45 m3/h and now dropped to 497.30 m3/h. Whereas, the kitchen slightly dropped from 179.41 m3/h to 178.65.
Table 6.
Air leakage test after applying the sealants.
5. Discussion
The results before and after applying the sealants indicate a satisfactory reduction of air leakage in the villa. Figure 3 illustrates the percentage of air leakage drop. This shows that the children’s room experienced the most significant drop of 70.15% in airflow at 10 Pa, Q10 (m3/h), and 67.95% in airflow at 50 Pa, Q10 (m3/h). The smallest drop was in the home office with a fall of 0.16% in airflow at 10 Pa, Q10 (m3/h), and 1.04% in airflow at 50 Pa, Q10 (m3/h). The master bedroom exhibited a significant discrepancy between 10 Pa and 50 Pa. For instance, at 10 Pa, Q10 (m3/h), the drop was 12.30%, while at airflow at 50 Pa, Q10 (m3/h), it was 5.54%. As indicated in Table 3, this suggests that the foam was an extremely efficient airtight strategy.
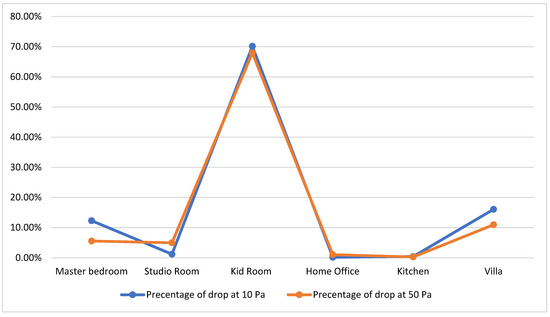
Figure 3.
Percentage of air leakage drop.
The energy consumption per year was detected and calibrated with the previous year (when the sealants were not applied). Figure 4 presents the results. This indicates that the base case energy consumption was 64,287 kWh per year. The energy consumption then decreased after applying the sealants to 62,341 kWh per year. This represents a fall of 3% from the base case due to airtightness. According to the passive Haus standards, house airtightness should be under 280 cfm 50. This was achieved in this research. Moreover, it complied with Building Regulations standards (Part L1A) on airtightness, which states that this leakage can be no more than 10 m3/h/m2@50 pa—or 10 m3/h. Additionally, in the UAE, the Dubai Green Building Regulation requires 10m3/h/m2 @50 Pa for a building with a cooling load of 1 MW or greater.
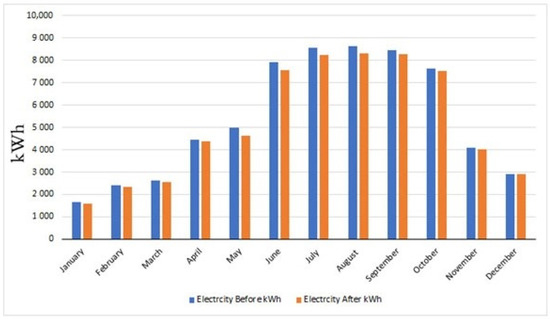
Figure 4.
Energy consumption before and after applying the sealants.
6. Conclusions
Air leakage is a major cause of energy loss. Improving airtightness is one of the most cost-effective strategies for decreasing energy loads due to the building envelope. Moreover, the longevity of the materials used to achieve airtightness is vital. The aim of this study was to apply and compare the performance of six different airtightness materials. A typical residential building in UAE was chosen as a case study. The infrared technique was used to indicate the airflow locations. The blower door technique was used before and after applying the sealants. The results demonstrated that the foam was the best sealant as it reduced the airflow at 10 Pa, Q10 (m3/h) by 70.15%, and airflow at 50 Pa, Q10 (m3/h) by 67.95%. The energy consumption therefore dropped by 3% over the course of a year. The findings of this research will inspire building stakeholders in hot regions to choose better and durable materials. For future research, the following suggestions are made: (1) carry out research in different locations with different climatic contexts; (2) test different sealant materials; (3) use a similar method for a case study building with a different function, for example, commercial buildings, and (4) test sealant durability for more than one year.
Funding
This research is funded by the Britih Univeristy in Dubia, Facluty of Engineering.
Informed Consent Statement
Informed consent was obtained from all subjects involved in the study.
Acknowledgments
The author would like to thank the BuildingDoctor company [19] in the UAE who dedicated their time and efforts to help the author and contributed to the accuracy of the experimental work. The author thanks the British University in Dubai for providing the funds to run this research.
Conflicts of Interest
The author declares no conflict of interest.
References
- IEA. Energy Efficiency: The Global Exchange for Energy Efficiency Policies, Data and Analysis. 2019. Available online: https://www.iea.org/topics/energyefficiency/buildings/ (accessed on 26 October 2019).
- 2017 EmiratesGBC Report. Defining Nearly Zero Energy Buildings in the UAE. 2017. Available online: https://emiratesgbc.org/wp-content/uploads/2017/03/defining-nzebs-in-the-uae-2017.pdf (accessed on 21 October 2018).
- Worldbank. CO2 Emissions. 2017. Available online: https://data.worldbank.org/indicator/en.atm.co2e.pc (accessed on 21 October 2018).
- Emmerich, S.J. Investigation of the Impact of Commercial Building Envelope Airtightness on HVAC Energy Use; Forgotten Books: Gaithersburg, MD, USA, 2018. [Google Scholar]
- Sinnott, D.; Dyer, M. Air-tightness field data for dwellings in Ireland. Build. Environ. 2012, 51, 269–275. [Google Scholar] [CrossRef]
- Bracke, W.; Laverge, J.; Bossche, N.V.D.; Janssens, A. Durability and Measurement Uncertainty of Airtightness in Extremely Airtight Dwellings. Int. J. Vent. 2016, 14, 383–393. [Google Scholar] [CrossRef]
- Bracke, W.; Bossche, N.V.D.; Janssens, A. Airtightness of Building Penetrations: Air Sealing Solutions, Durability Effects and Measurement Uncertainty. In Proceedings of the 35th Conference: Ventilation and Airtightness in Transforming the Building Stock to High Performance, Poznan, Poland, 24–25 September 2014; pp. 488–500. [Google Scholar]
- Sherman, M.; Chan, R. Building airtightness: Research and practice. Lawrence Berkeley National Laboratory Report No. LBNI-53356. In Building Ventilation; Routledge: London, UK, 2004. [Google Scholar]
- Clean Energy Business Council. Energy Efficiency in the GCC: Status and Outlook. 2019. Available online: http://cebcmena.com/wp-content/uploads/2018/03/CEBC-Energy-Efficiency-in-the-GCC-January-2018-REV2.pdf (accessed on 30 October 2019).
- Chan, W.; Joh, J.; Sherman, M.H. Analysis of air leakage measurements of US houses. Energy Build. 2013, 66, 616–625. [Google Scholar] [CrossRef]
- Giusti, L.; Almoosawi, M. Impact of building characteristics and occupants’ behavior on the electricity consumption of households in Abu Dhabi (UAE). Energy Build. 2017, 151, 534–547. [Google Scholar] [CrossRef]
- Energy-Efficient Florida Home Building Manual. Annual Cooling Load Components. Available online: http://www.fsec.ucf.edu/en/consumer/buildings/homes/priorities.htm (accessed on 21 October 2018).
- Tanyer, A.M.; Tavukçuoglu, A.; Bekboliev, M. Assessing the airtightness performance of container houses in relation to its effect on energy efficiency. Build. Environ. 2018, 134, 59–73. [Google Scholar] [CrossRef]
- Mohamadi, Y.; Mirnoori, S.V. The Impact of Airtightness on Energy Conservation of Conventional Cypriot Detached Houses. Int. J. Eng. Technol. 2012, 4, 705–712. [Google Scholar] [CrossRef][Green Version]
- Emmerich, S.J.; McDowell, T.P.; Anis, W. Investigation of the Impact of Commercial Building Envelope Airtightness on HVAC Energy Use; National Institute of Standards and Technology: Gaithersburg, MD, USA, 2009. [Google Scholar]
- World Data. Energy Consumption in the United Arab Emirates. 2018. Available online: https://www.worlddata.info/asia/arab-emirates/energy-consumption.php (accessed on 28 October 2018).
- Emirates Green Building Council. Airtightness of Buildings in the Middle East. 2019. Available online: https://emiratesgbc.org/wp-content/uploads/2015/08/EGBC-TW_Brief_Airtightness-of-buildings-in-the-Middle-East-FINAL.pdf (accessed on 10 December 2019).
- Fernández-Agüera, J.; Domínguez-Amarillo, S.; Alonso, C.; Martín-Consuegra, F. Thermal comfort and indoor air quality in low-income housing in Spain: The influence of airtightness and occupant behaviour. Energy Build. 2019, 199, 102–114. [Google Scholar] [CrossRef]
- Vinha, J.; Manelius, E.; Korpi, M.; Salminen, K.; Kurnitski, J.; Kiviste, M.; Laukkarinen, A. Airtightness of Residential Buildings in Finland. Build. Environ. 2015, 93, 128–140. [Google Scholar] [CrossRef]
- Fernández-Agüera, J.; Domínguez-Amarillo, S.; Sendra, J.J.; Suárez, R.; Oteiza, I. Social Housing Airtightness in Southern Europe. Energy Build. 2019, 183, 377–391. [Google Scholar] [CrossRef]
- Lee, D.-S.; Jeong, J.-W.; Jo, J.-H. Experimental Study on Airtightness Test Methods in Large Buildings; Proposal of Averaging Pressure Difference Method. Build. Environ. 2017, 122, 61–71. [Google Scholar] [CrossRef]
- Bossche, N.V.D.; Janssens, A. Airtightness and watertightness of window frames: Comparison of performance and requirements. Build. Environ. 2016, 110, 129–139. [Google Scholar] [CrossRef]
- Ji, Y.; Duanmu, L. Airtightness Field Tests of Residential Buildings in Dalian, China. Build. Environ. 2017, 119, 20–30. [Google Scholar] [CrossRef]
- Mortensen, L.H.; Bergsøe, N.C. Air tightness measurements in older Danish single-family houses. Energy Procedia 2017, 132, 825–830. [Google Scholar] [CrossRef]
- Colijn, M.; Entrop, A.; Toxopeus, M. Evaluating the effectiveness of improved workmanship quality on the airtightness of Dutch detached houses. Energy Procedia 2017, 132, 843–848. [Google Scholar] [CrossRef]
- Feijó-Muñoz, J.; González-Lezcano, R.A.; Poza-Casado, I.; Padilla-Marcos, M.Á.; Meiss, A. Airtightness of Residential Buildings in the Continental Area of Spain. Build. Environ. 2019, 148, 299–308. [Google Scholar] [CrossRef]
- Alev, U.; Uus, A.; Kalamees, T. Airtightness improvement solutions for log wall joints. Energy Procedia 2017, 132, 861–866. [Google Scholar] [CrossRef]
- Cuce, E. Role of airtightness in energy loss from windows: Experimental results from in-situ tests. Energy Build. 2017, 139, 449–455. [Google Scholar] [CrossRef]
- Sinnott, D. Dwelling airtightness: A socio-technical evaluation in an Irish context. Build. Environ. 2016, 95, 264–271. [Google Scholar] [CrossRef]
- Liu, W.; Zhao, X.; Chen, Q. A novel method for measuring air infiltration rate in buildings. Energy Build. 2018, 168, 309–318. [Google Scholar] [CrossRef]
- Ambrose, M.; Syme, M. Air Tightness of New Australian Residential Buildings. Procedia Eng. 2017, 180, 33–40. [Google Scholar] [CrossRef]
- Ng, L.C.; Persily, A.K.; Emmerich, S.J. Improving infiltration modeling in commercial building energy models. Energy Build. 2015, 88, 316–323. [Google Scholar] [CrossRef]
- Hassan, O.A. An alternative method for evaluating the air tightness of building components. Build. Environ. 2013, 67, 82–86. [Google Scholar] [CrossRef]
- European Commission. Directive 2002/91/EC of the European Parliament and of Council of 16 December 2002 on Energy Performance of Buildings. 2003. Available online: https://eur-lex.europa.eu/legal-content/en/ALL/?uri=CELEX%3A32002L0091 (accessed on 17 May 2022).
- American Society of Testing & Materials. Annual Book of ASTM Standards, 1st ed.; Astm International: West Conshohocken, PA, USA, 2006; Available online: https://infostore.saiglobal.com/en-us/american-society-for-testing-and-materials-astm-standards/?gclid=CjwKCAjwzY2bBhB6EiwAPpUpZsrGn9Z5DblsBtZIwR9XfYm-T9bkzjzKYx9NjRfqlr8-x9bKpyvqfRoC_j4QAvD_BwE&gclsrc=aw.ds (accessed on 12 September 2021).
- Lanzoni, D. Building Thermography: Including Blower Door and Heat Flux Meter (Infrared Thermography); CreateSpace Independent Publishing Platform: Charleston, SC, USA, 2015; Volume 1. [Google Scholar]
- Sherman, M. A Power-Law Formulation of Laminar Flow in Short Pipes. J. Fluids Eng. 1992, 114, 601–605. [Google Scholar] [CrossRef]
- Airtightness Testing & Measurement Association. Technical Standards L1: Measuring Air Permeability of Building Envelopes (Deswellings). 2010. Available online: www.bindt.org (accessed on 30 January 2020).
- Geleziunas, V.; Banioois, K.; Paukstys, V.; Kumziene, J. Development of Air Tightness Prediction Method of Masonry Walls. 2020. Available online: https://www.e3s-conferences.org/articles/e3sconf/pdf/2020/32/e3sconf_nsb2020_05009.pdf (accessed on 20 September 2020).


Publisher’s Note: MDPI stays neutral with regard to jurisdictional claims in published maps and institutional affiliations. |
© 2022 by the author. Licensee MDPI, Basel, Switzerland. This article is an open access article distributed under the terms and conditions of the Creative Commons Attribution (CC BY) license (https://creativecommons.org/licenses/by/4.0/).