1. Introduction
Different degrees of initial fissures render discrete strength distributions in engineering rock masses. The conventional method for obtaining the strength of a rock mass is to average the test results. However, the accuracy of the results depends on the sample size [
1,
2]. For convenient engineering geology application, the methods for strength prediction of rock masses, e.g., the constitutive model method [
3,
4,
5], the nonlinear regression method [
6], and the multi-factor neural network prediction [
7,
8,
9,
10], have gained significant attention. Previous studies have investigated the empirical formula method based on P-wave velocity and rock strength [
11,
12,
13,
14]. Although the empirical formula method has a simple operation procedure and low computational time when using intact rocks during laboratory tests, it is unclear if the applicability of the method can be extrapolated to engineering rock masses.
Typically, a rock is a nonlinear and heterogeneous material. Rock failure is a process involving the occurrence and development of microcracks and formation of connected macro fissures and failure surfaces. In this process, a rock where only microscopic damage has occurred is considered an intact rock [
15,
16]. The initial damage to a fissured rock mass, without a fractured surface, is assumed macroscopically continuous. Rock masses with various fissure developments can be regarded as damaged rocks with multiscale initial damage [
17,
18,
19,
20]. According to damage mechanics and elastic wave theory [
21,
22,
23], it is feasible to characterize the damage to a rock mass through P-wave velocity. Therefore, identifying the impact of multiscale initial damage on the strength of a rock, based on the P-wave velocity, is the key to strength estimation of rock masses.
The conventional method for setting the initial damage to rocks is to prefabricate the fractures. It is difficult to collect natural rock specimens with comparable and controllable initial damages. However, prefabricated fissures with parallel open crack surfaces are significantly different from real cracks and fissures in rock masses [
24,
25]. Considering the process and occurrence conditions of rock failure in deep rock masses, the multiscale crack propagation state of a rock during vertical compressive loading is consistent with the real initial crack development in the rock masses.
This study aims to experimentally investigate the strength prediction model for brittle damaged rock with multiscale initial damage based on P-wave velocity. Five groups of dolomitic limestone rock specimens, which were collected from a deep metal mine in southern China, were pre-damaged under different uniaxial compressive stresses. Both intact and damaged rock specimens were tested for P-wave velocity. The damaged rock specimens were prepared for uniaxial compressive strength (UCS) tests. A strength prediction model for rock masses, with P-wave velocity and strength, was established and verified with the results from previous studies.
2. Materials and Methods
2.1. Test Instruments and Intact Rock Specimens
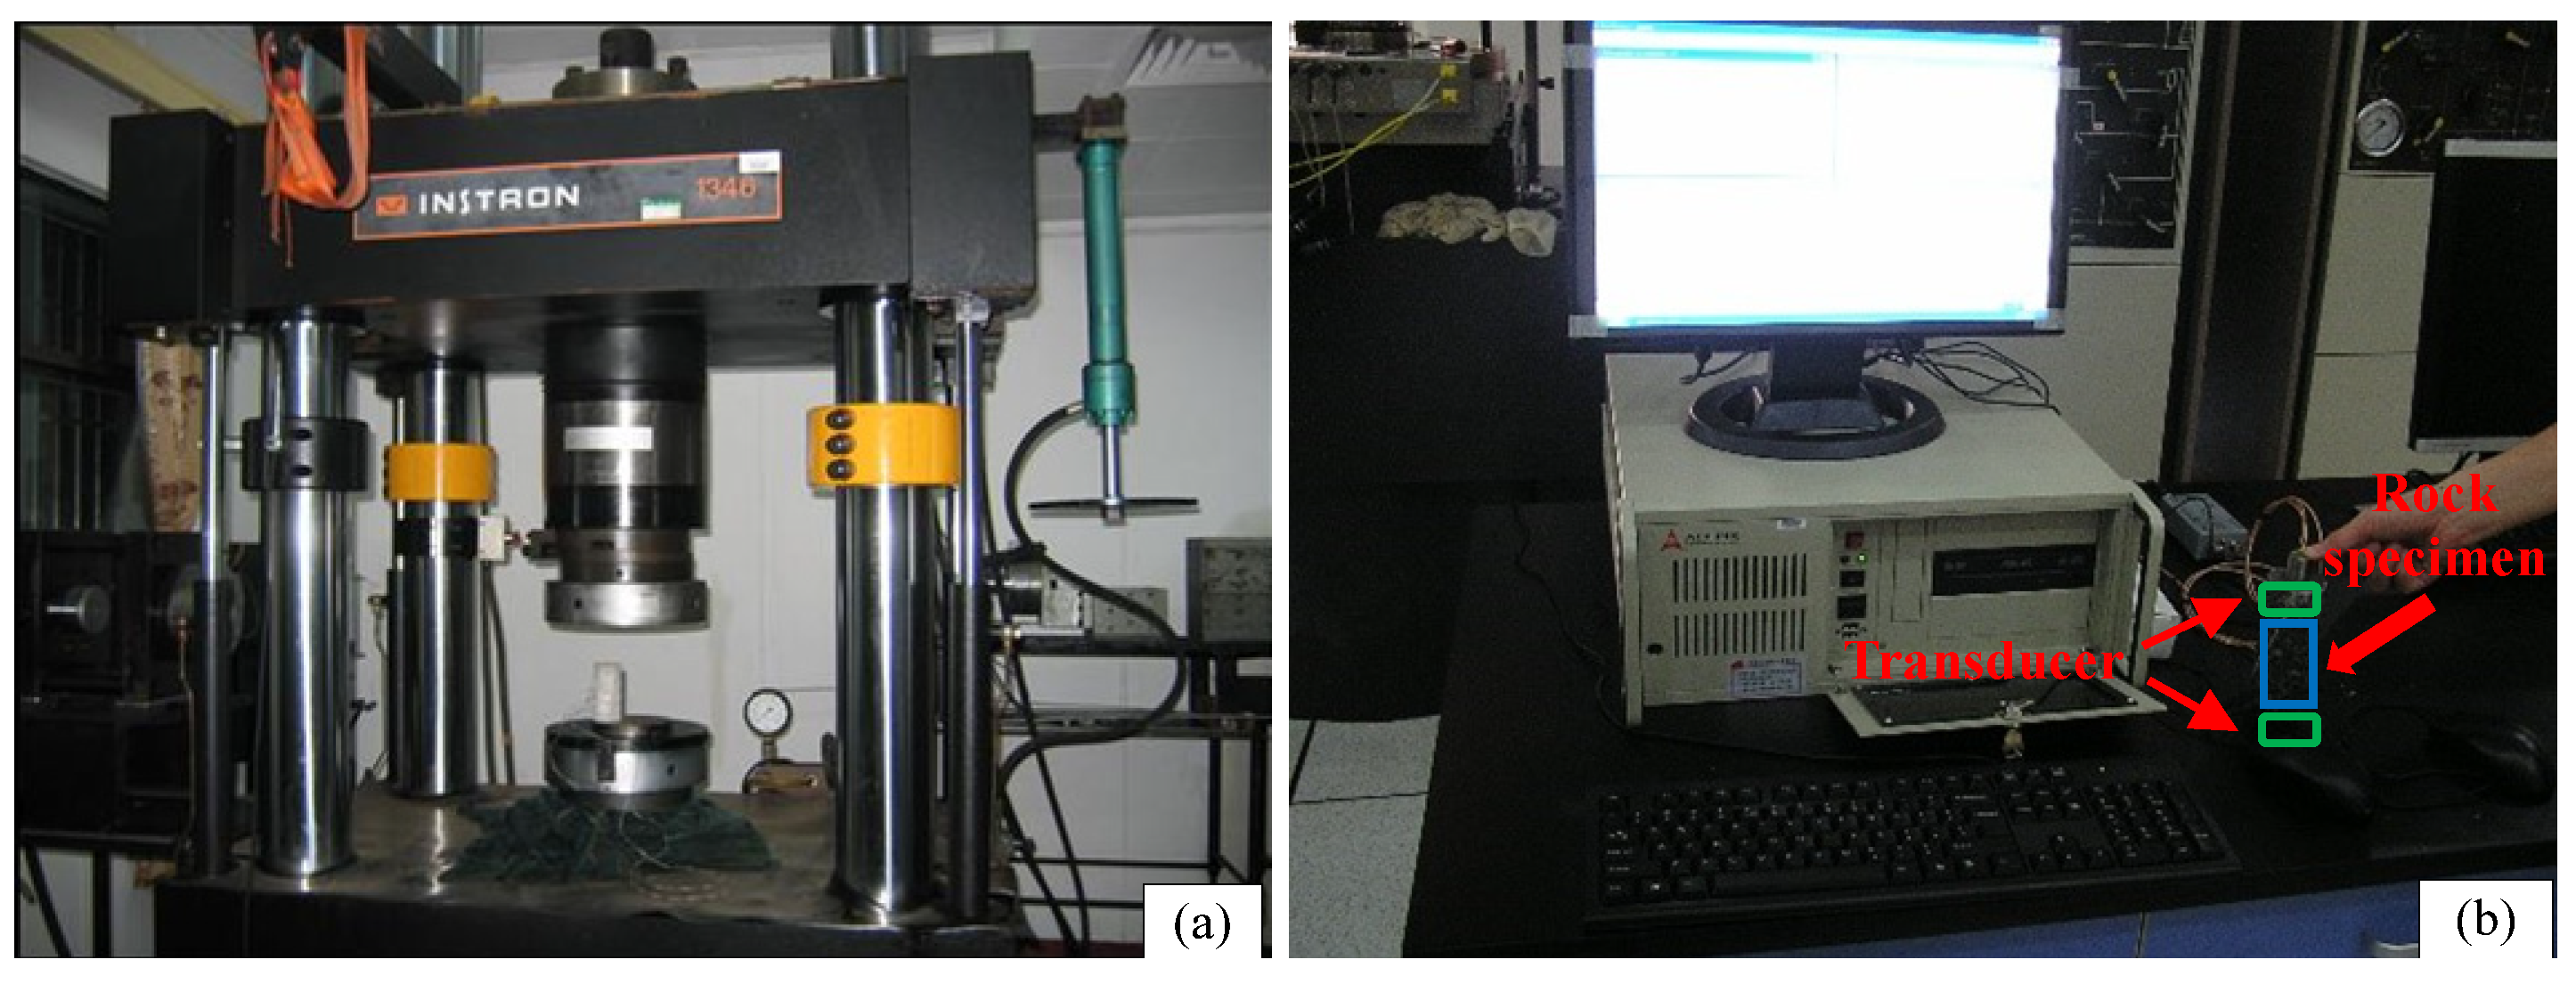
UCS tests with a loading control mode were performed in an INSTRON-1346 universal material testing machine, and the P-wave velocity tests were conducted on the ADLINK acoustic wave sensor apparatus, as shown in
Figure 1. The instruments were calibrated according to the verification and calibration standard, and the tests were carried out after calibration was qualified.
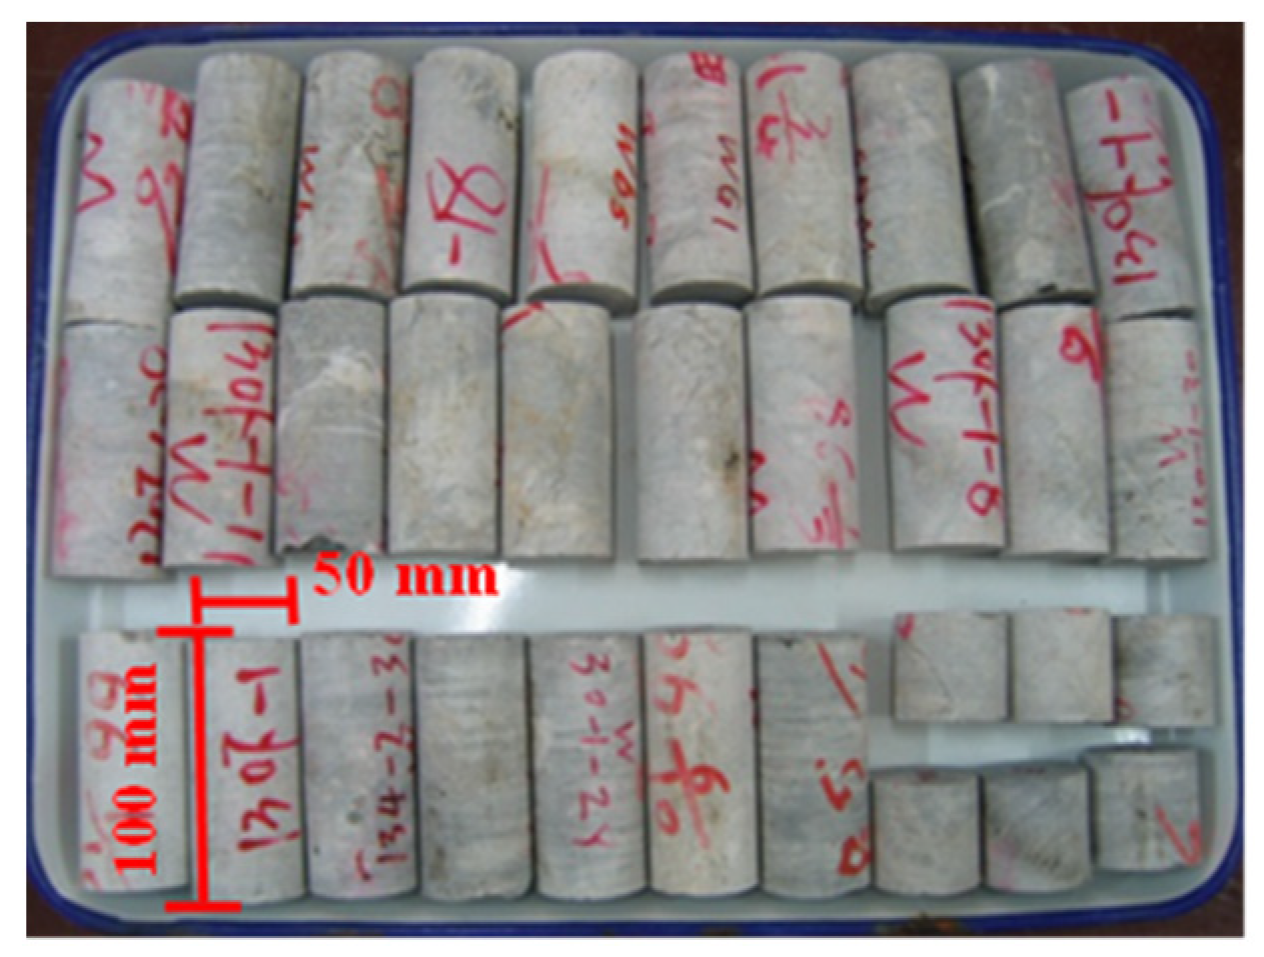
Intact rock specimens (dolomitic limestone) were collected from a deep metal mine in Southern China. The specimens were cylindrical with dimensions of ϕ50 × 100 mm, as shown in
Figure 2. The density (
ρ) was 2704 kg/m
3, the P-wave velocity (
vp) was 5737 m/s, the elastic modulus (
E) was 33.701 GPa, the Poisson’s ratio (
μ) was 0.253, and the
UCS was 88.139 MPa.
2.2. Test Procedure
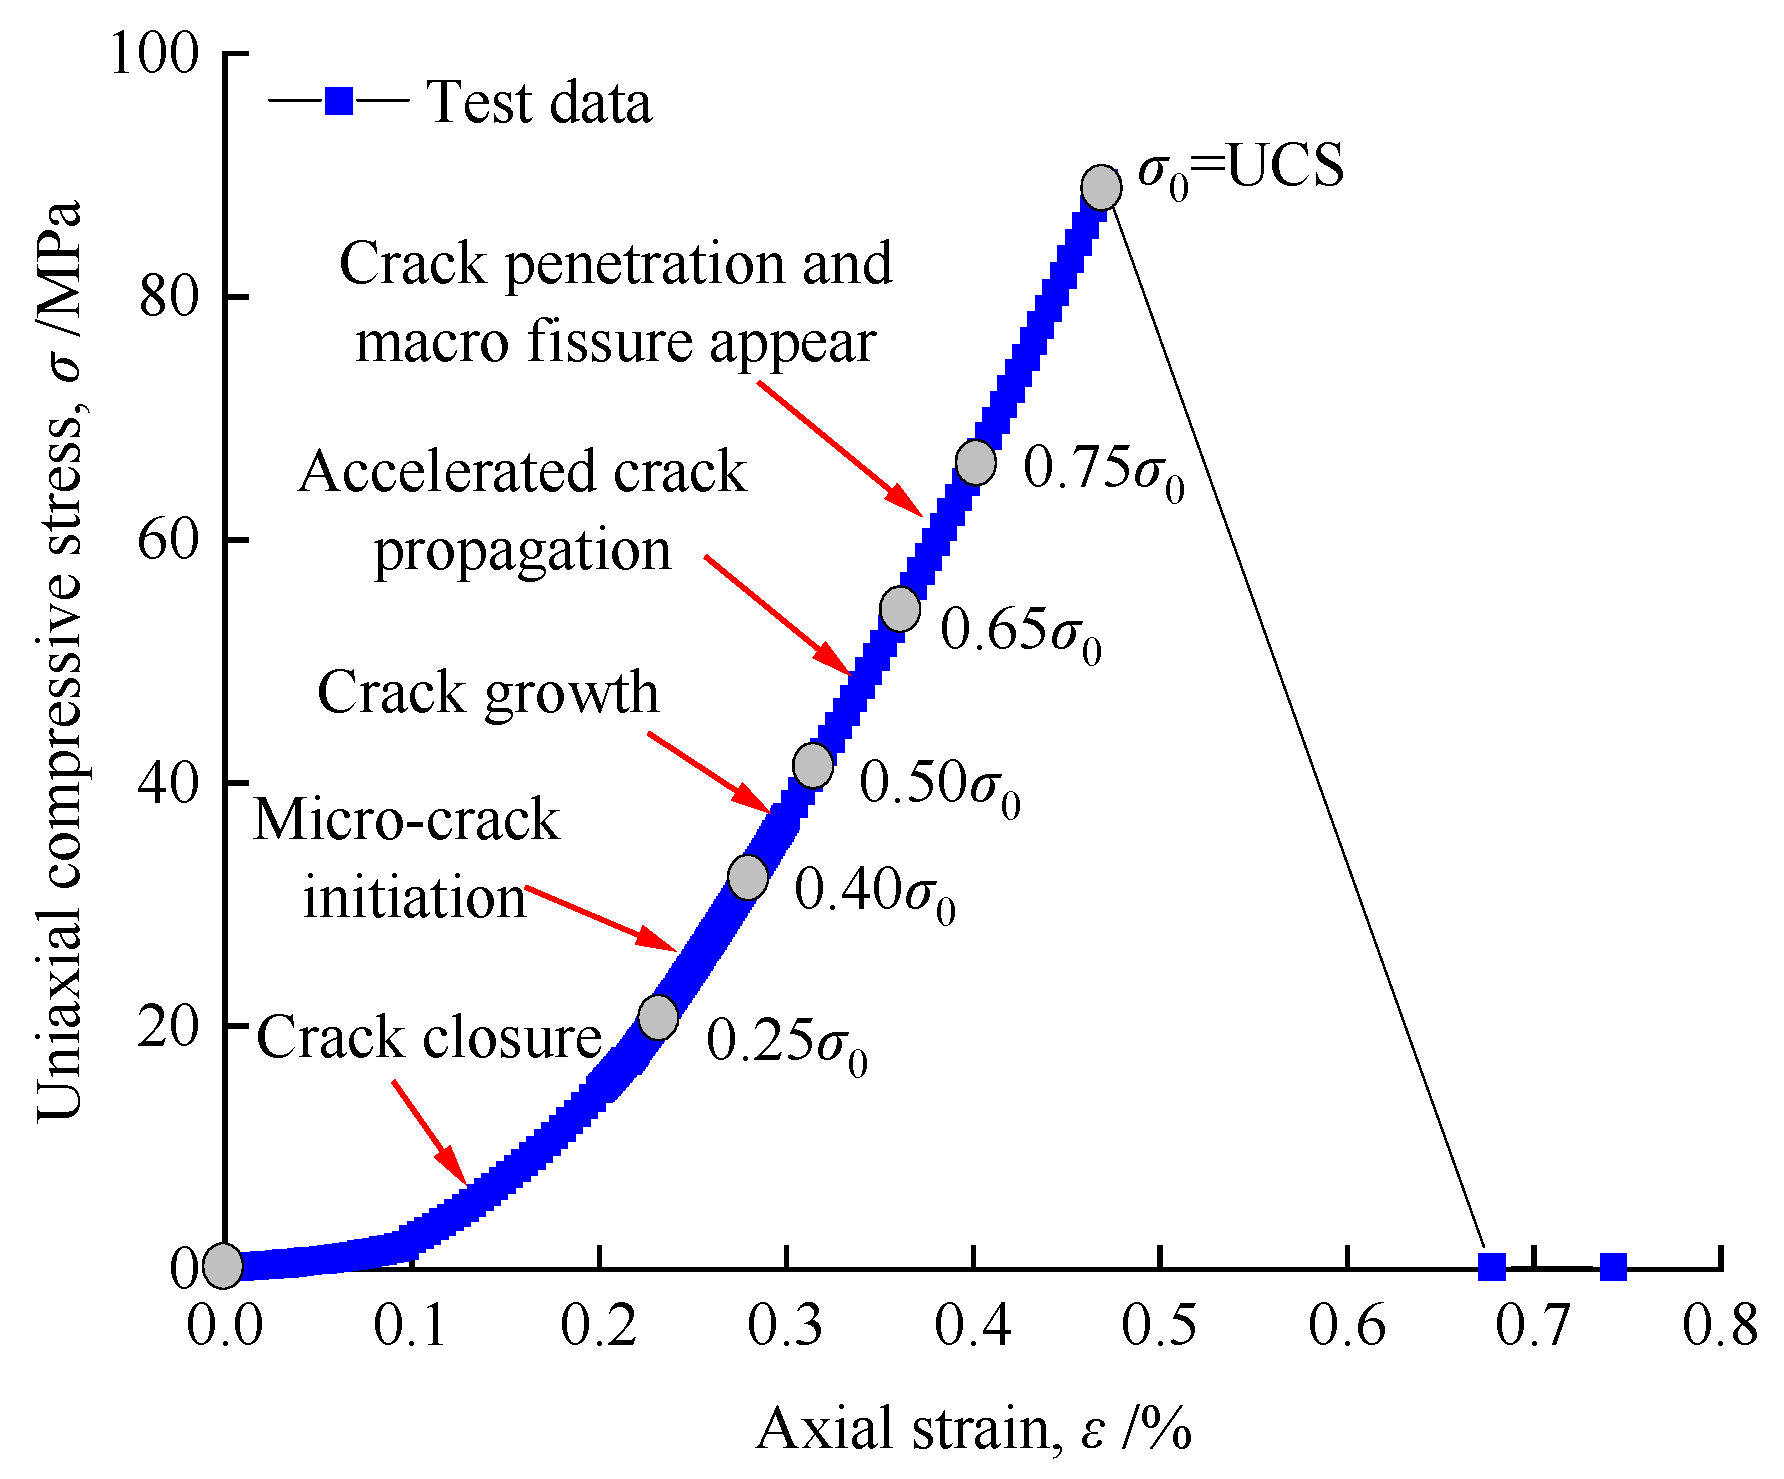
Considering the multiscale crack propagation states of the intact rock during uniaxial compressive loading [
26], different uniaxial compressive stresses (0.25
σ0, 0.40
σ0, 0.50
σ0, 0.65
σ0, and 0.75
σ0) were applied for initial damage to the damaged rock specimens, as shown in
Figure 3.
The brittle failure threshold of the rock is 0.75
σ0. When the uniaxial compressive stress exceeds 0.75
σ0, the rock specimen will quickly reach the uniaxial compressive peak strength and lose its bearing capacity [
26].
When the uniaxial compressive stress exceeds 0.75
σ0 (the brittle failure threshold of the rock), the rock specimen quickly reaches the uniaxial compressive peak strength and loses its bearing capacity [
26].
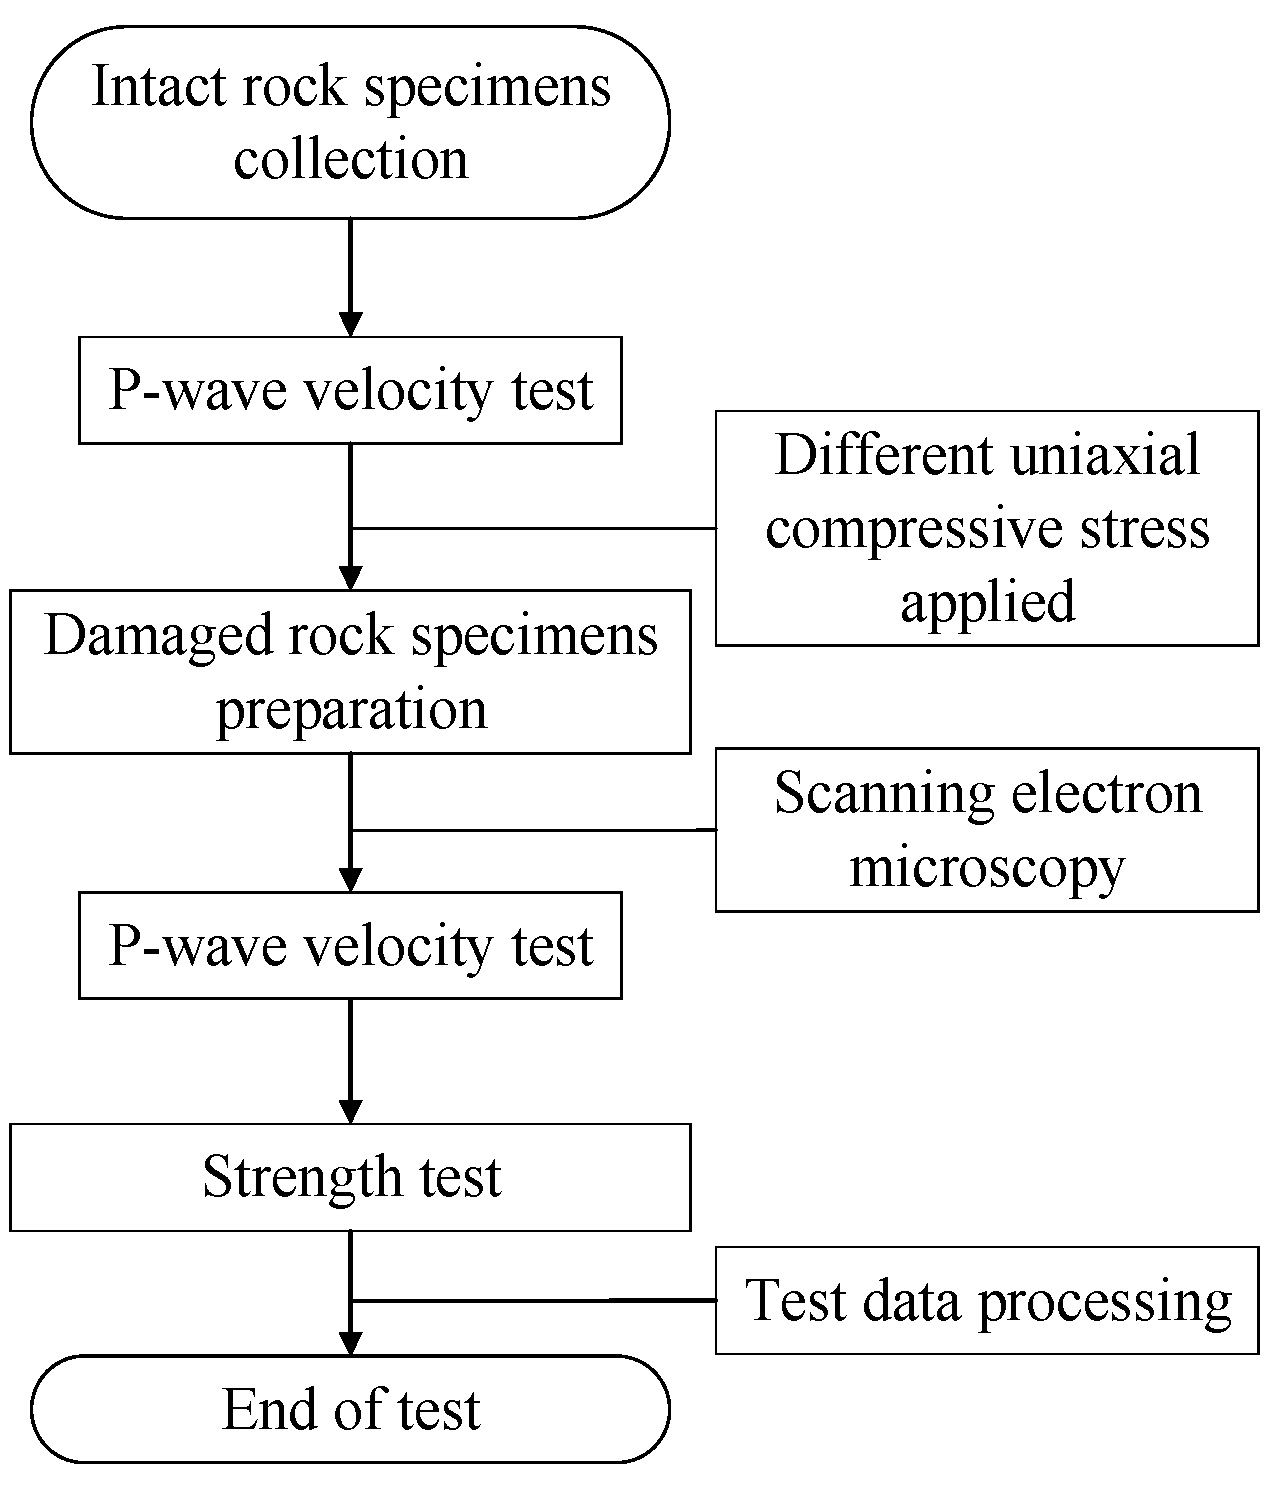
For each group of damaged rock specimens with different multiscale initial damage degrees (0.25
σ0, 0.40
σ0, 0.50
σ0, 0.65
σ0, and 0.75
σ0) and the intact rock, a series of UCS tests were conducted on sixty (ten for each group) specimens. The P-wave velocity tests were performed prior to the UCS tests. The test procedure is illustrated in
Figure 4.
3. Results
3.1. Analysis of the Typical Stress–Strain Curves
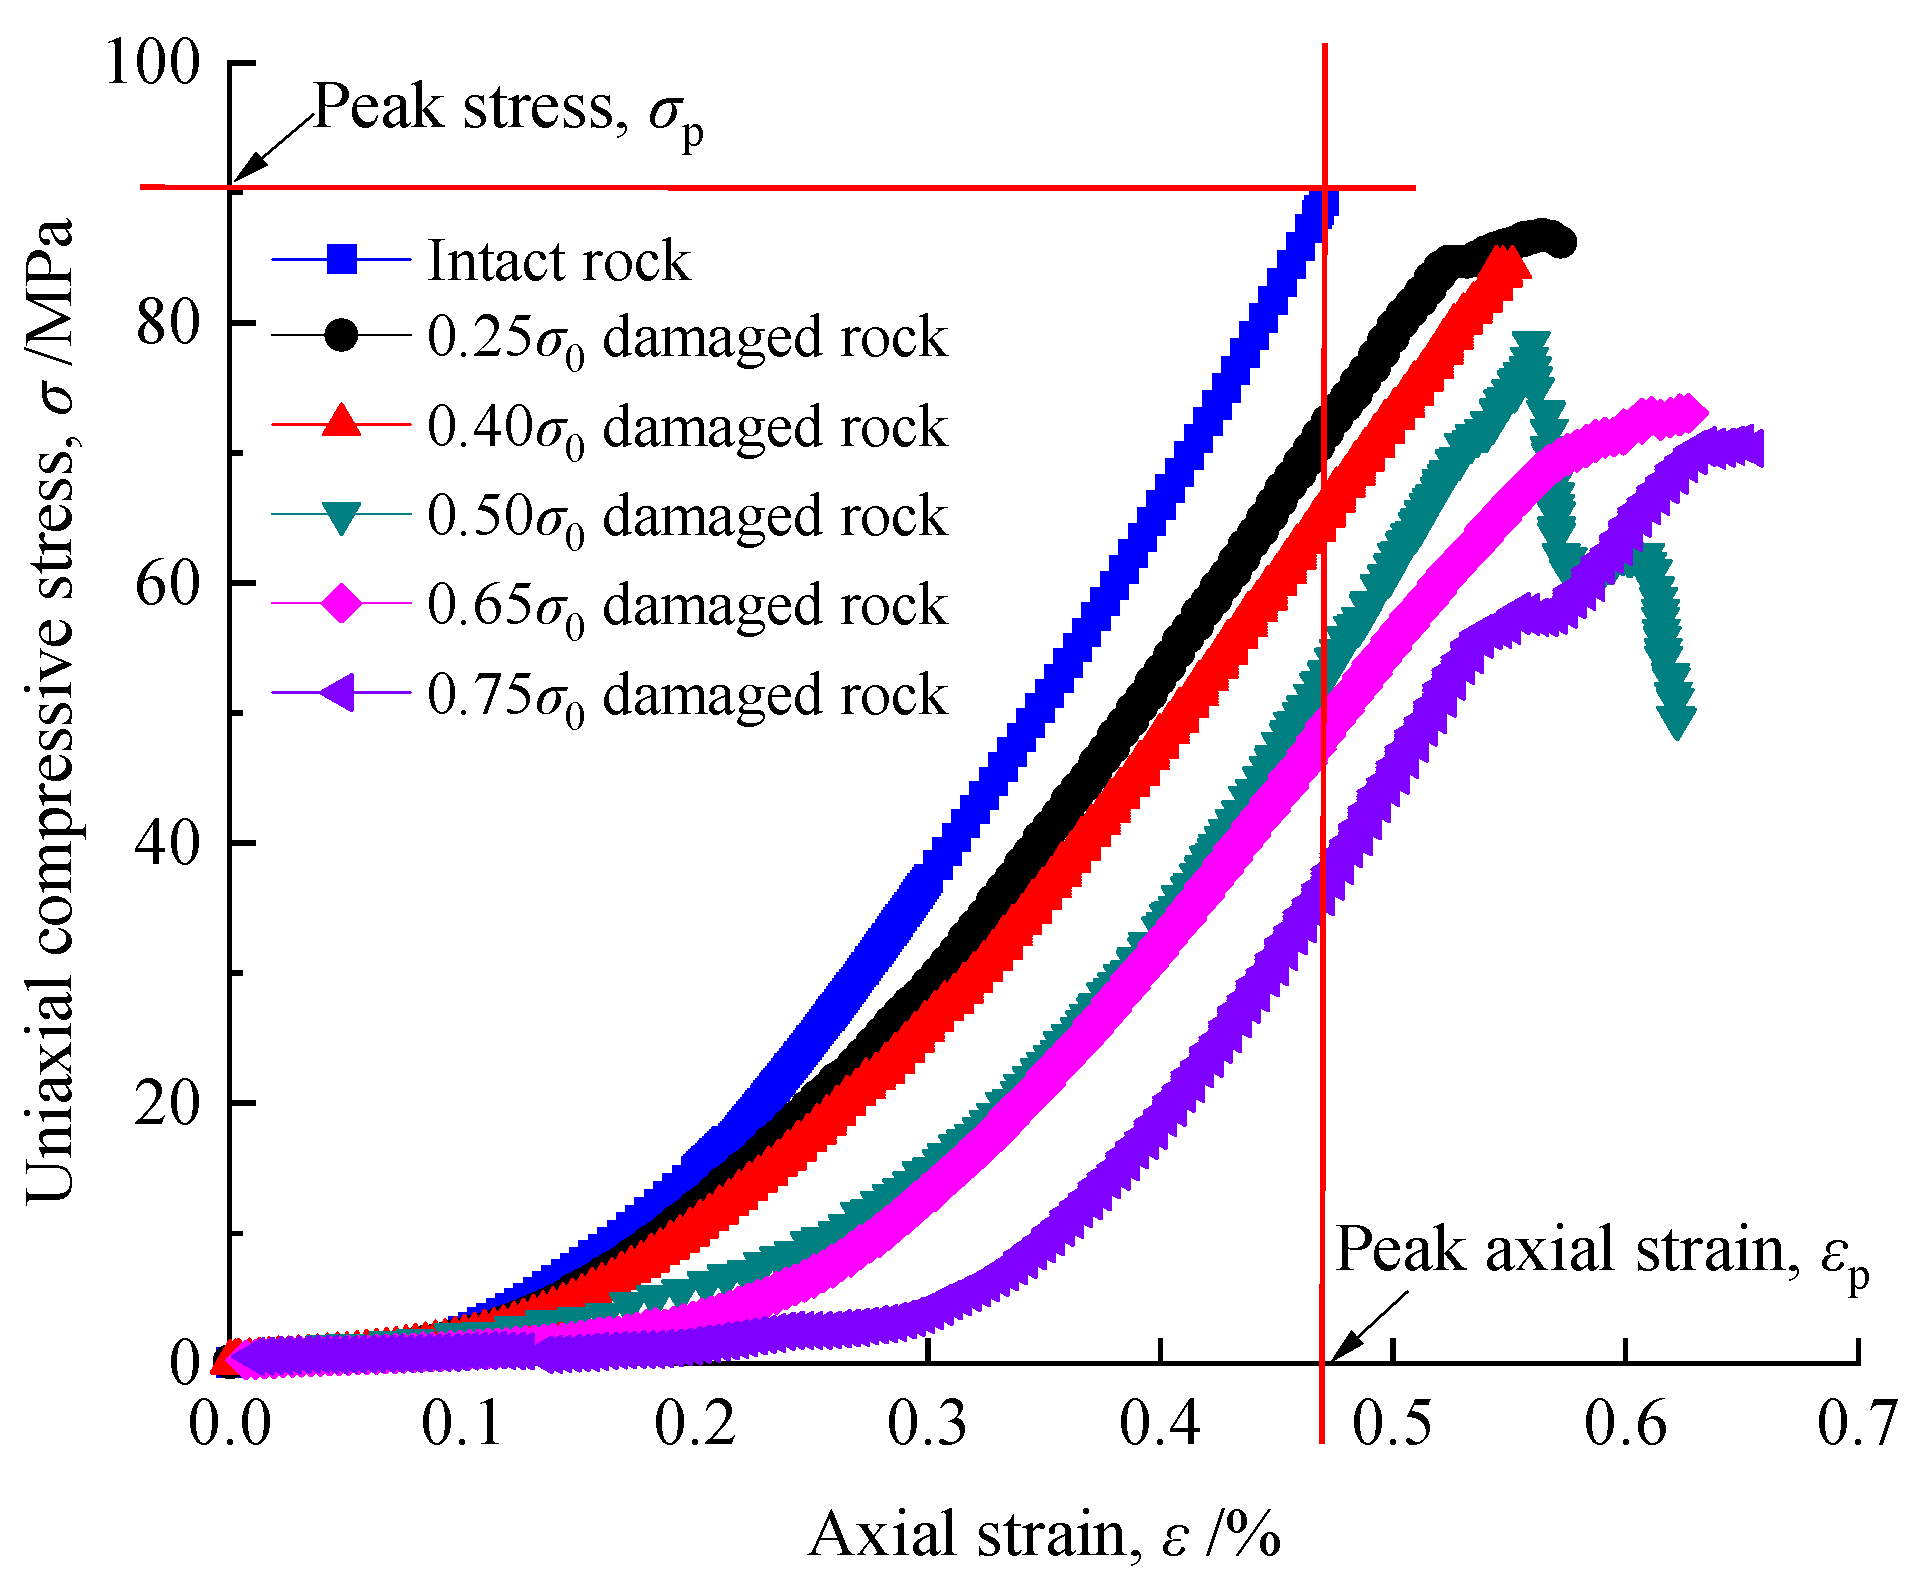
Figure 5 shows the typical stress–strain curves of the intact and damaged rock specimens.
Figure 5 indicates that all the damaged rock specimens sustained brittle failure, which is consistent with the failure mode of the intact rock. No post-peak strengths were detected. As the degree of the initial damage increased, the peak stress (
σp) decreased monotonically, and the peak axial strain (
εp) increased significantly. These results are consistent with the results demonstrated by [
27].
3.2. Multiscale Initial Damage Investigation
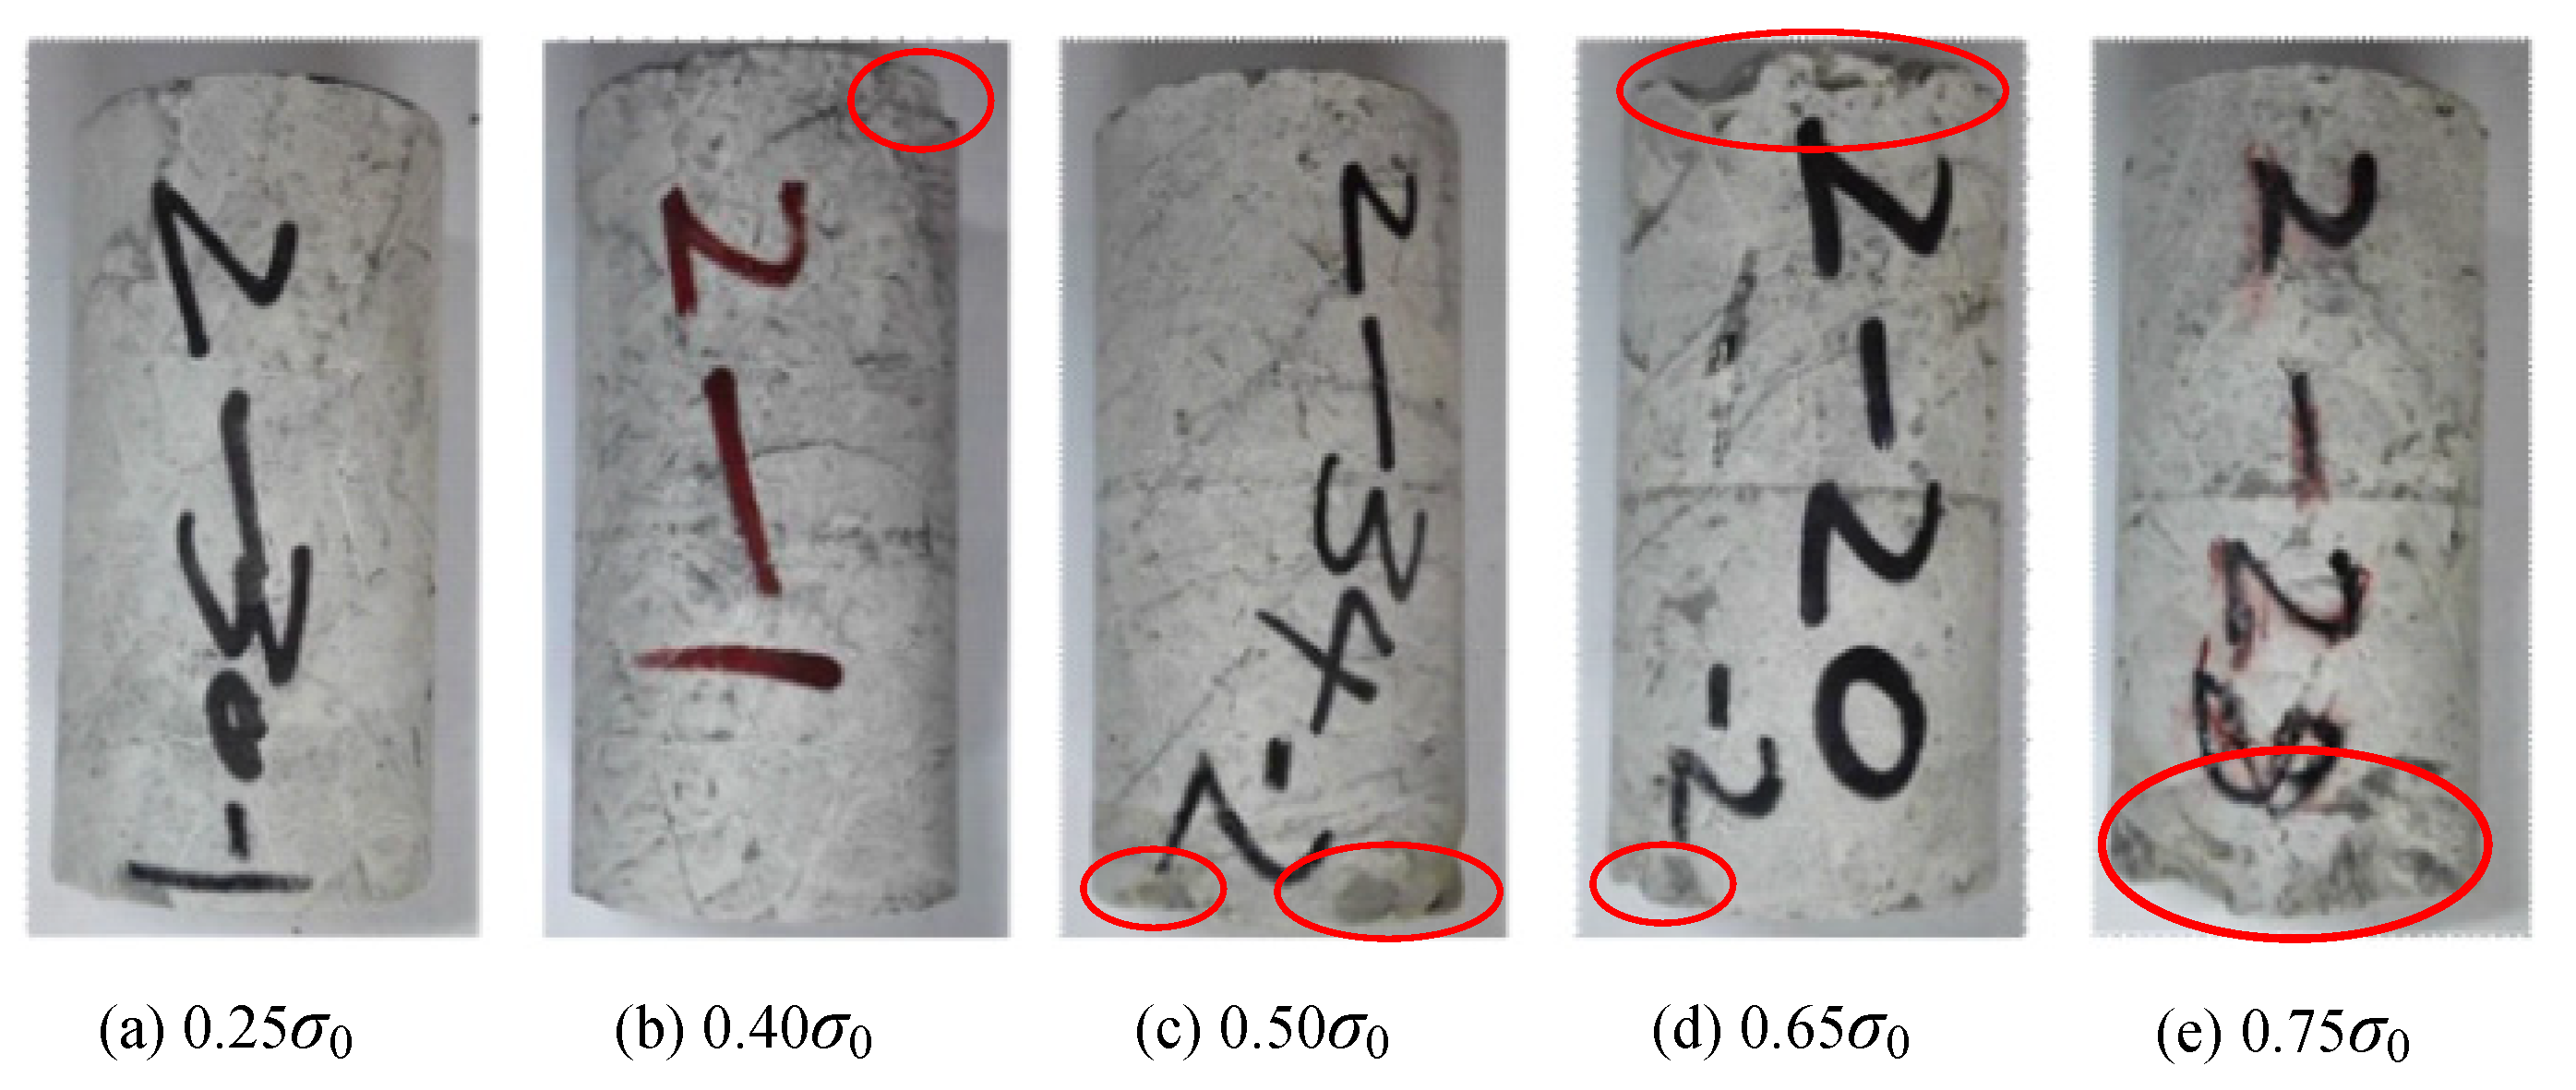
The damaged rock specimens with different initial damage degrees are shown in
Figure 6.
Figure 6 shows that there were distinct macro breakages in the corners of the damaged rock specimens with initial damage degrees of 0.40
σ0, 0.50
σ0, 0.65
σ0, and 0.75
σ0. The greater the initial damage degree, the more small areas of macrodamage on the end surfaces of the damaged rock specimens.
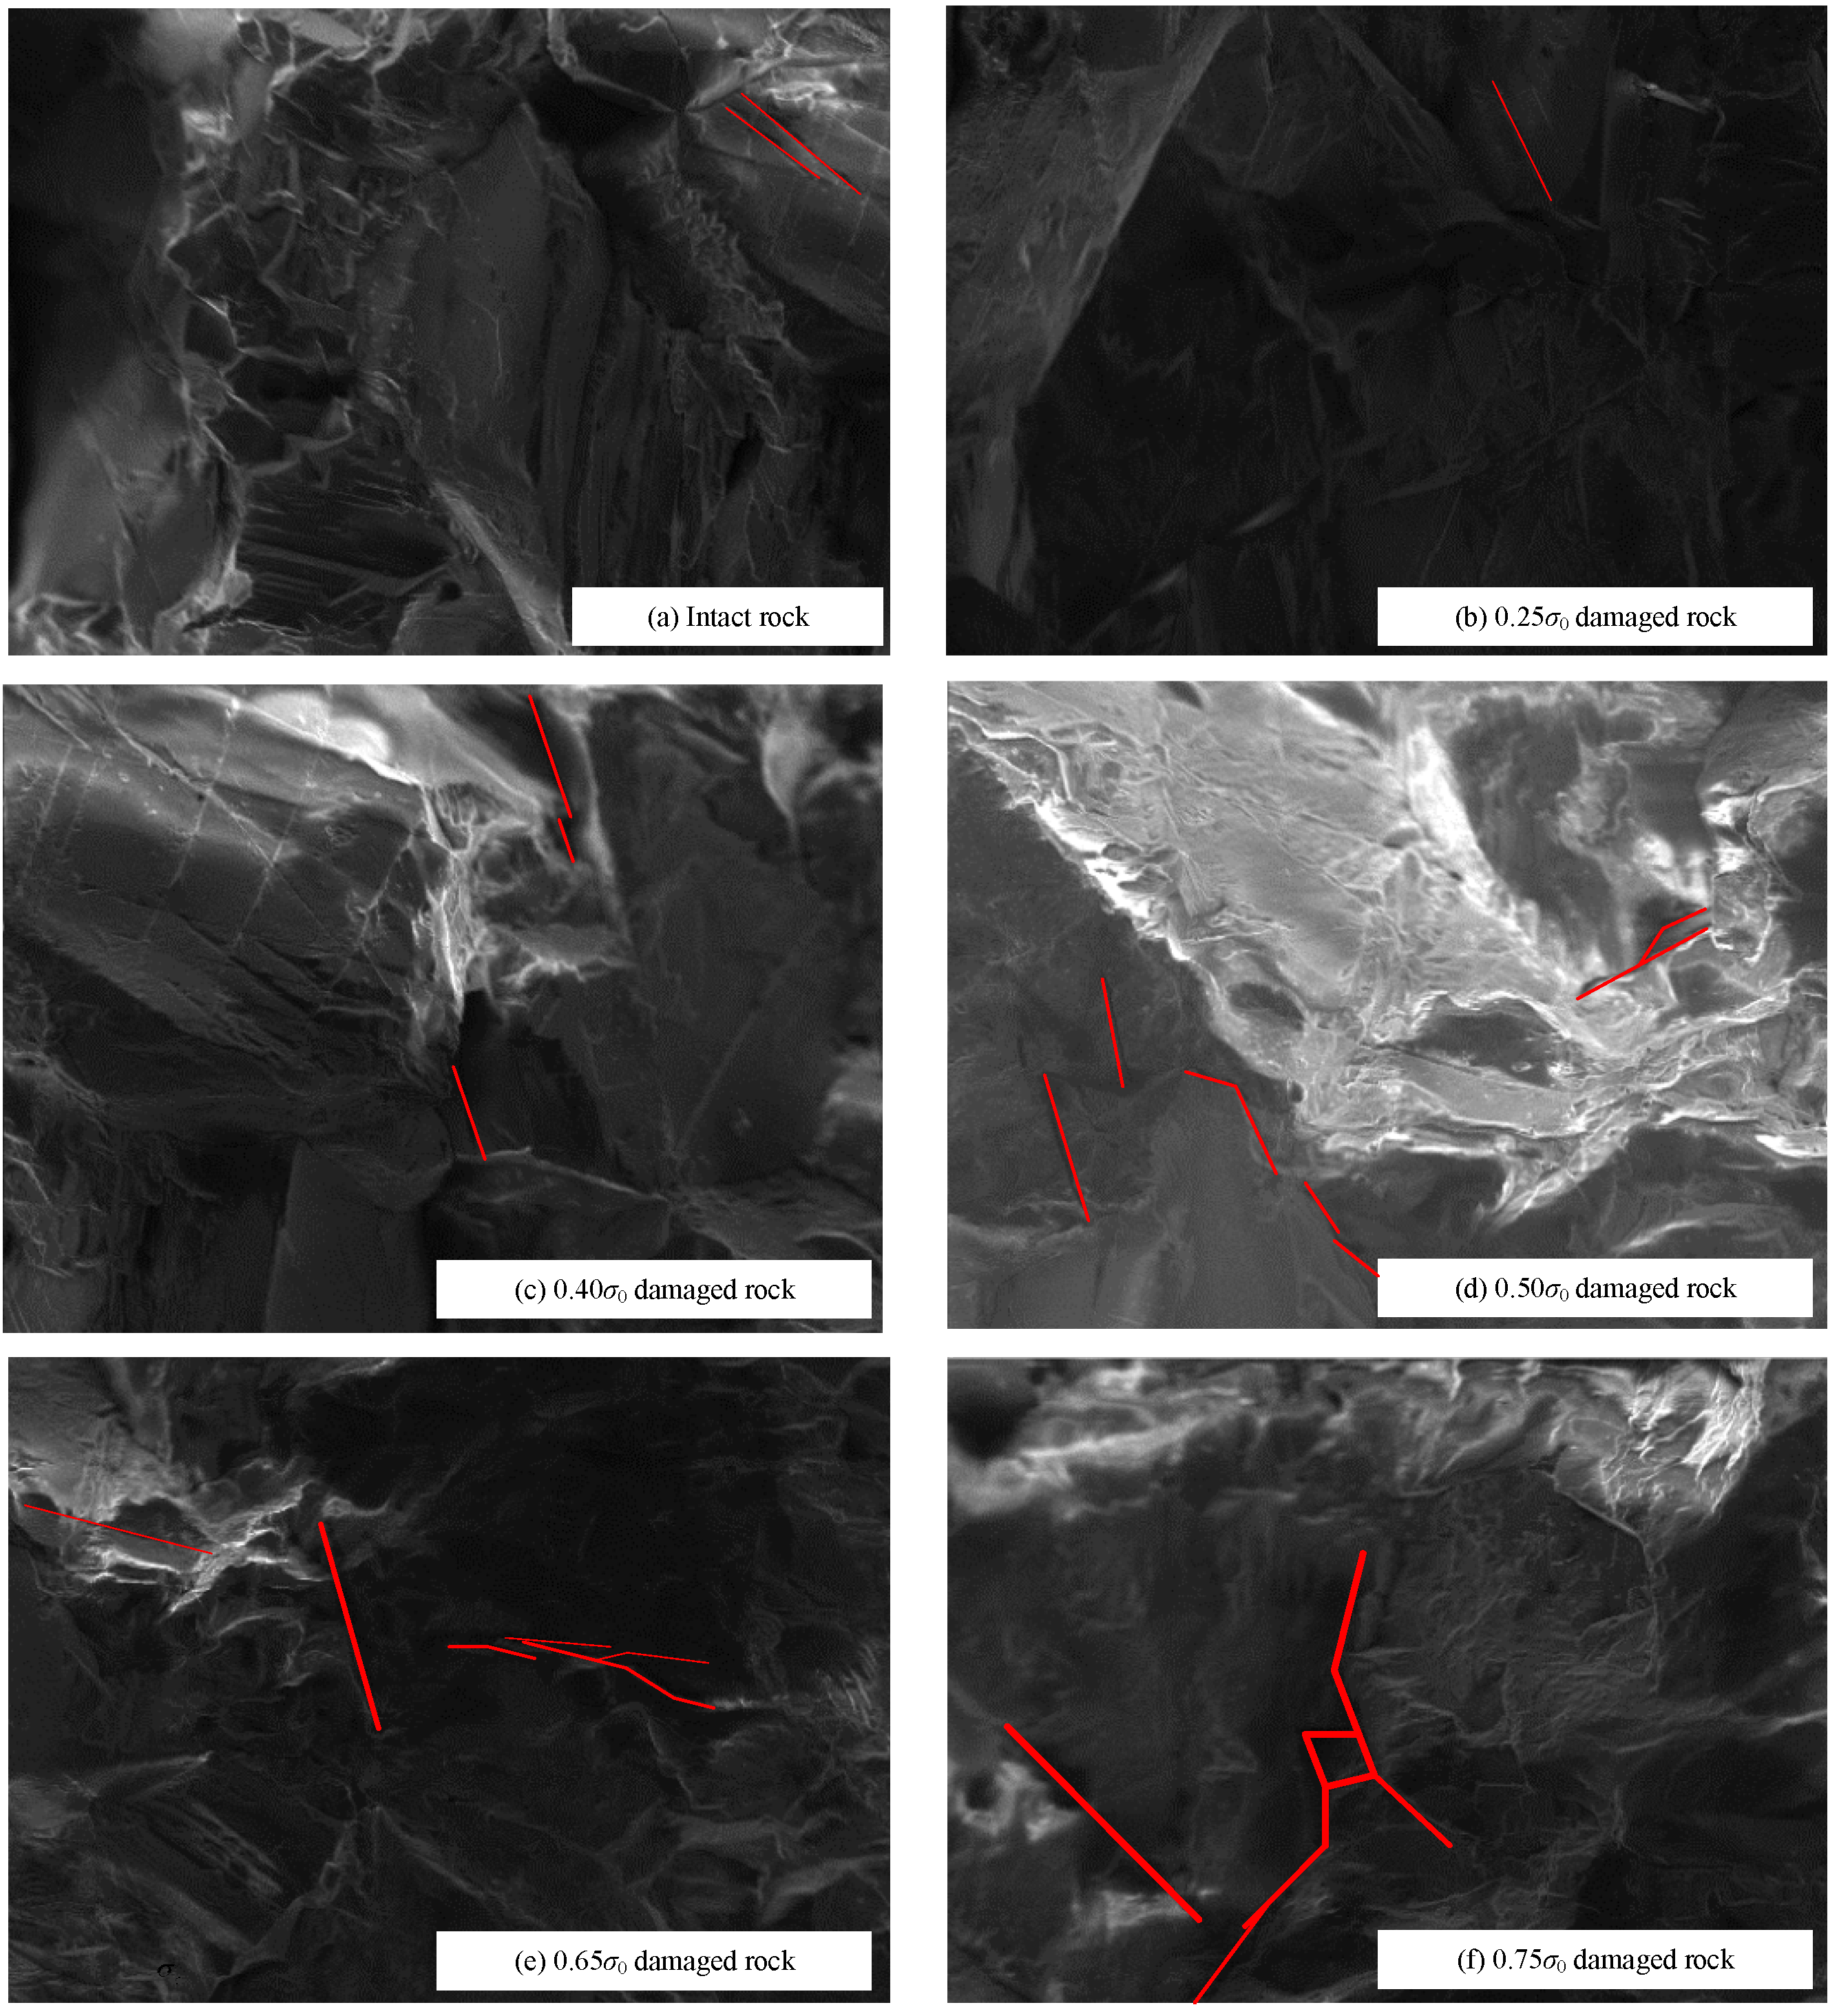
The microcracks inside the damaged rock specimens were observed through scanning electron microscopy (SEM), as shown in
Figure 7.
Figure 7 shows that there were extremely few thin microcracks inside the intact rock and the damaged rock specimens at an initial damage degree of 0.25
σ0. Microcracks started to develop from an initial damage degree of 0.40
σ0, and the initial growth and increase was observed at an initial damage degree of 0.50
σ0. The open crack surfaces at the initial damage degrees of 0.65
σ0 and 0.75
σ0 increased significantly. The multiscale crack morphology is consistent with the findings for a real rock mass reported by [
16].
Therefore, it is feasible to prepare the damaged rock specimens with multiscale initial cracks under various uniaxial compressive stresses. The multiscale initial damage to the damaged rock specimens under different uniaxial compressive stresses included microcracks (micron dimension), macro fissures, and small areas of outside breakage (millimeter-scale).
3.3. Multiscale Initial Damage Characterization Based on P-Wave Velocity
According to the elastic wave theory [
21], the P-wave velocity in a continuous medium is:
where
vp is the P-wave velocity (m/s),
E is the elastic modulus (GPa),
ρ is density (kg/m
3), and
μ is the Poisson’s ratio.
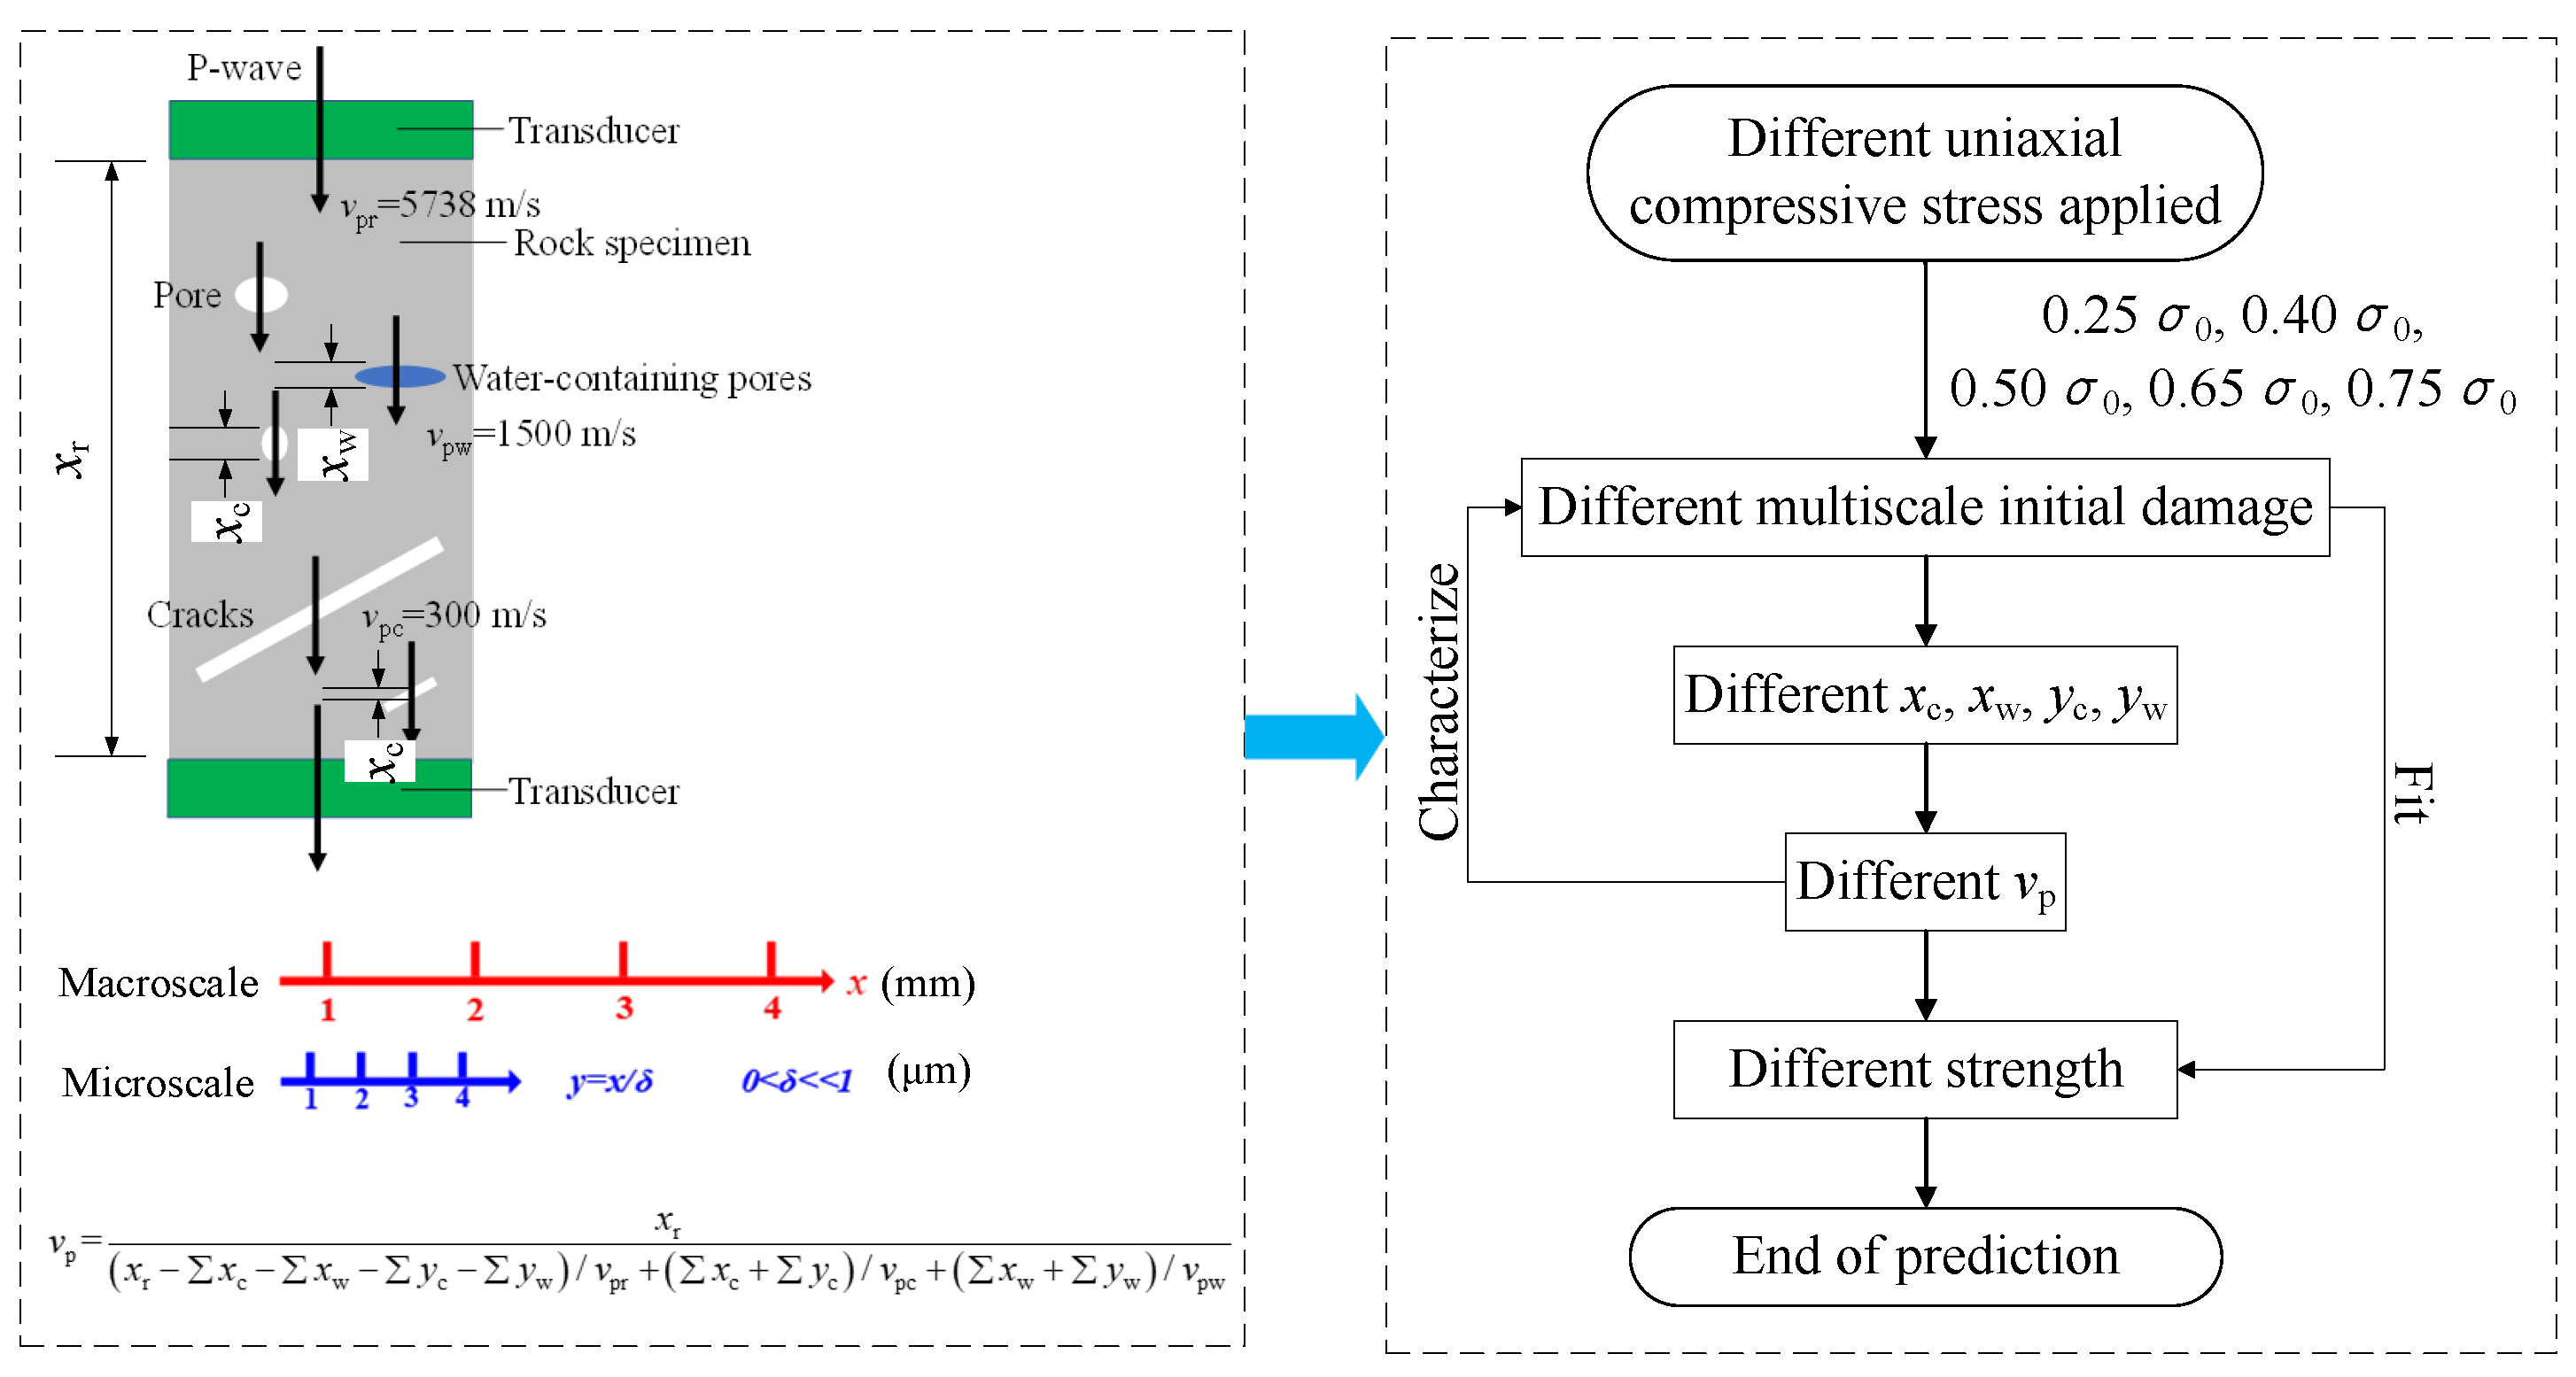
It was assumed that the multiscale crack propagation process in the rock (as shown in
Figure 3) was macroscopically continuous. Therefore, the multiscale initial damage to the rock was macroscopically continuous. Here, multiscale referred to the macroscopic and microscopic physical dimensions. The principle diagram of the P-wave propagation is shown in
Figure 8.
Theoretically, the
E and
μ of a rock change dynamically during loading, as shown in
Figure 3 [
22]. Therefore, the
vp,
E, and
μ of the damaged rock specimens with different initial damage degrees were different from each other. It is theoretically feasible to pre-damage an intact rock under a uniaxial compressive stress and then predict the strength of the damaged rock specimens according to the P-wave velocity. The expected values of
vp and
E of the intact rock and damaged rock specimens are listed in
Table 1.
Table 1 shows that the
vp and
E of the damaged rock specimens with an initial damage degree of 0.25
σ0 approached the results of the intact rock. This is because an initial damage degree of 0.25
σ0 corresponded to the crack closure stage in an intact rock (
Figure 3); the damage has not yet occurred, and the
E and
μ of the rock have not changed substantially.
Rock damage was characterized with the P-wave velocity as follows [
28]:
where
D0 is the initial damage in the rock,
E is the elastic modulus of the damaged rock specimen,
E0 is the elastic modulus of the intact rock,
vp is the P-wave velocity of the damaged rock specimen,
v0 is the P-wave velocity of the intact rock,
, and
η is the
vp decay rate (%),
.
Figure 9 shows the initial damage to the damaged rock specimens.
As shown in
Figure 9, the actual initial damage to the damaged rock specimens was significantly less than the set initial damage degree values. Nonetheless, as the set initial damage degree value increased, the initial rock damage
D0 linearly increased, as did
vp and the decay rate
η. Therefore, it is reasonable to characterize the rock damage by
η.
3.4. UCS and the 95% Confidence Interval
It was assumed that the
UCS test values of the rock specimens conformed to a normal distribution. The sample size for each rock specimen group was 10. When the confidence level (1 −
α) was 95%, the result of the Student’s
t test was
tα/2(
n − 1) = 2.262 [
29]. The
UCS of the rock specimens and the 95% confidence intervals are listed in
Table 2.
Xi is the test sample of
UCS,
i = 1, 2, 3, …, 10,
is the mean value of
Xi, and
s2 is the quadratic mean deviation of
Xi. The confidence interval is
.
Table 2 shows that
of the
UCS values of the rock specimens is significantly negatively correlated with the initial damage degree. Thus, it is feasible to predict the UCS of a rock mass based on its initial damage.
4. Strength Prediction Model
4.1. Model Fit and Parameter Analysis
The relationship between the
UCS and
D0 of the rock specimens is shown in
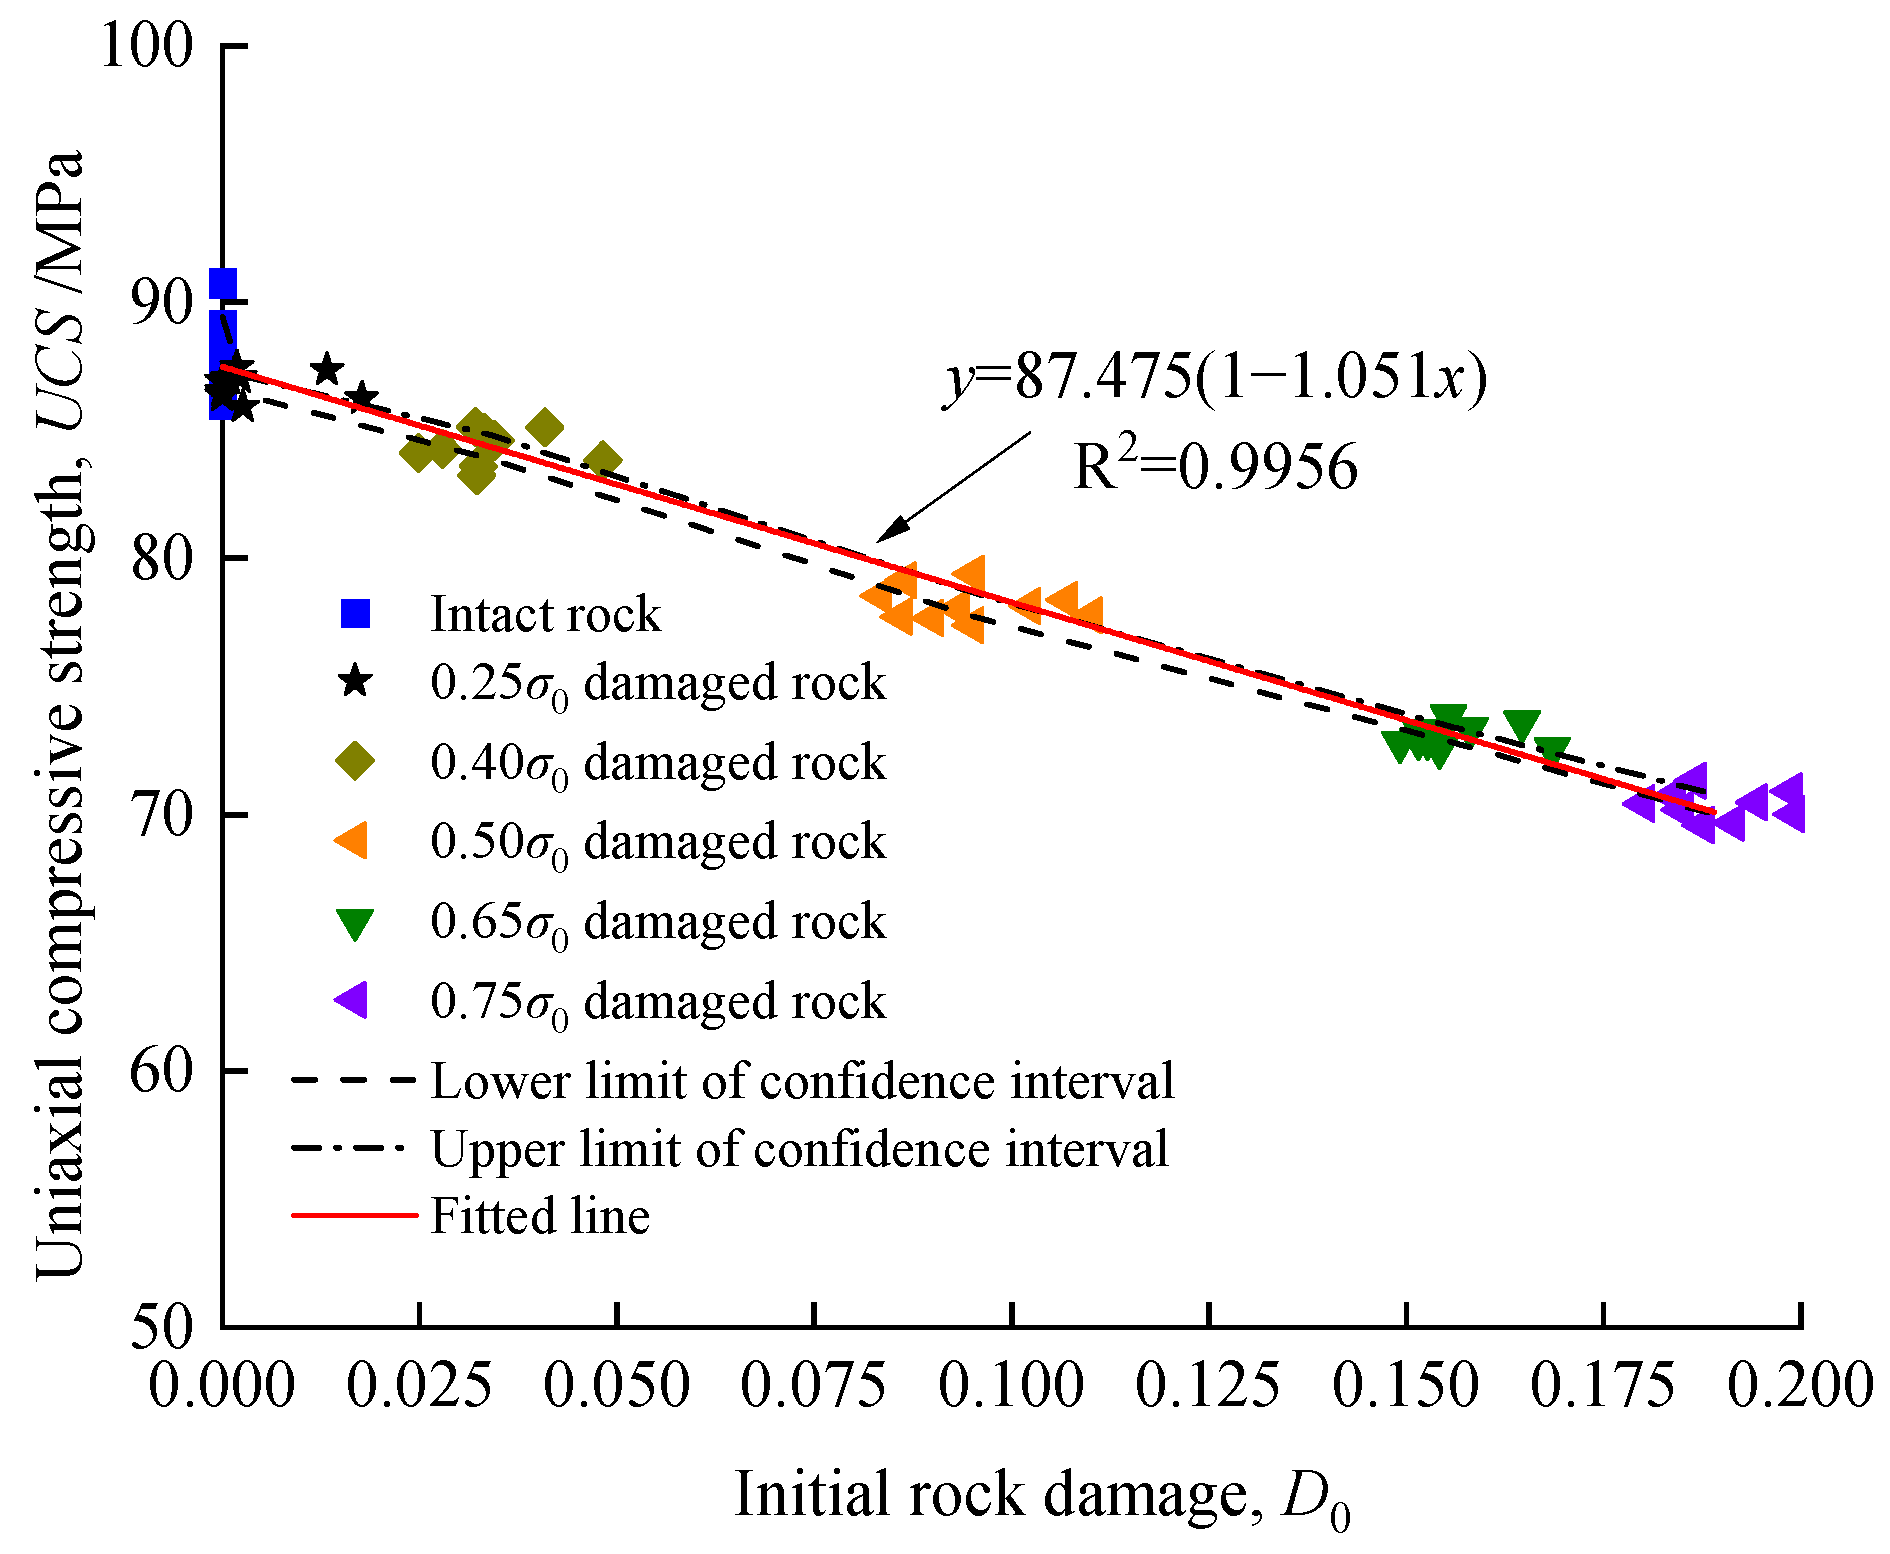
Figure 10.
Figure 10 demonstrates that the
UCS values of the rock specimens is linearly negatively correlated with
D0, giving the fitted relationship as:
where
UCS0 is the theoretical
UCS value of the intact rock (MPa), and
δ is the correction factor related to the material properties.
Based on Equation (2), the boundary condition of Equation (3) is .
As shown in
Figure 10, the reference values of the strength prediction model parameters of dolomitic limestone were
UCS0 = 87.475 MPa and
δ = 1.051. The fitted results from Equation (3) were within the upper and lower limits of the 95% confidence interval of the
UCS. R
2 was higher than 0.99, which means that Equation (3) is accurate.
Substituting Equation (2) into Equation (3) yields:
Equation (4) shows the strength prediction model of the rock mass, considering the multiscale initial damage based on the P-wave velocity, as shown in
Figure 11.
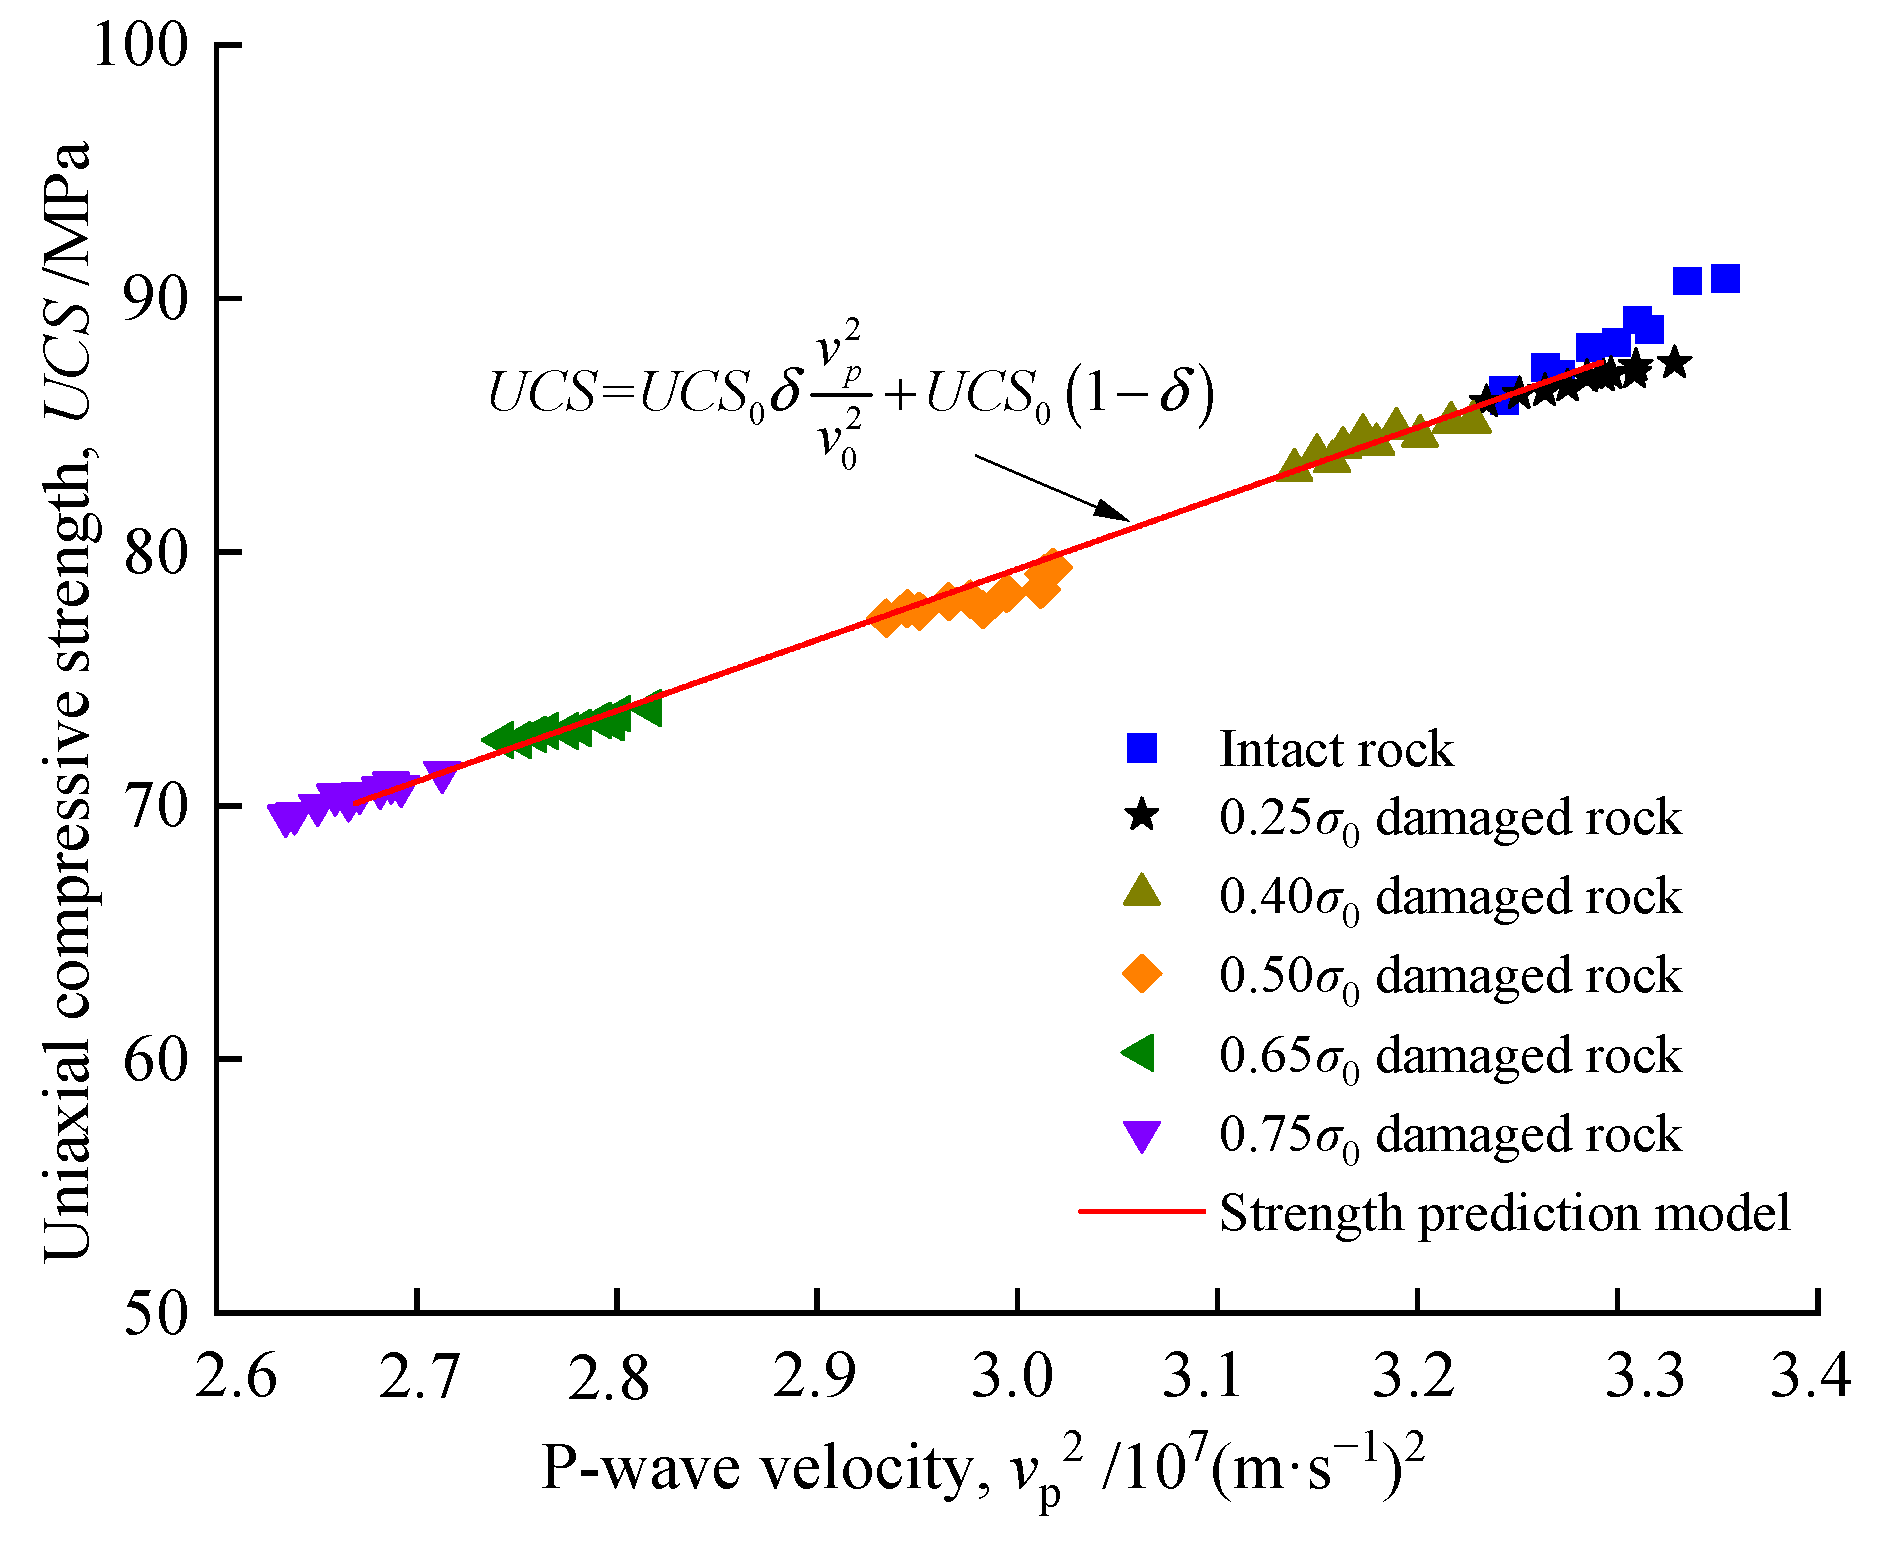
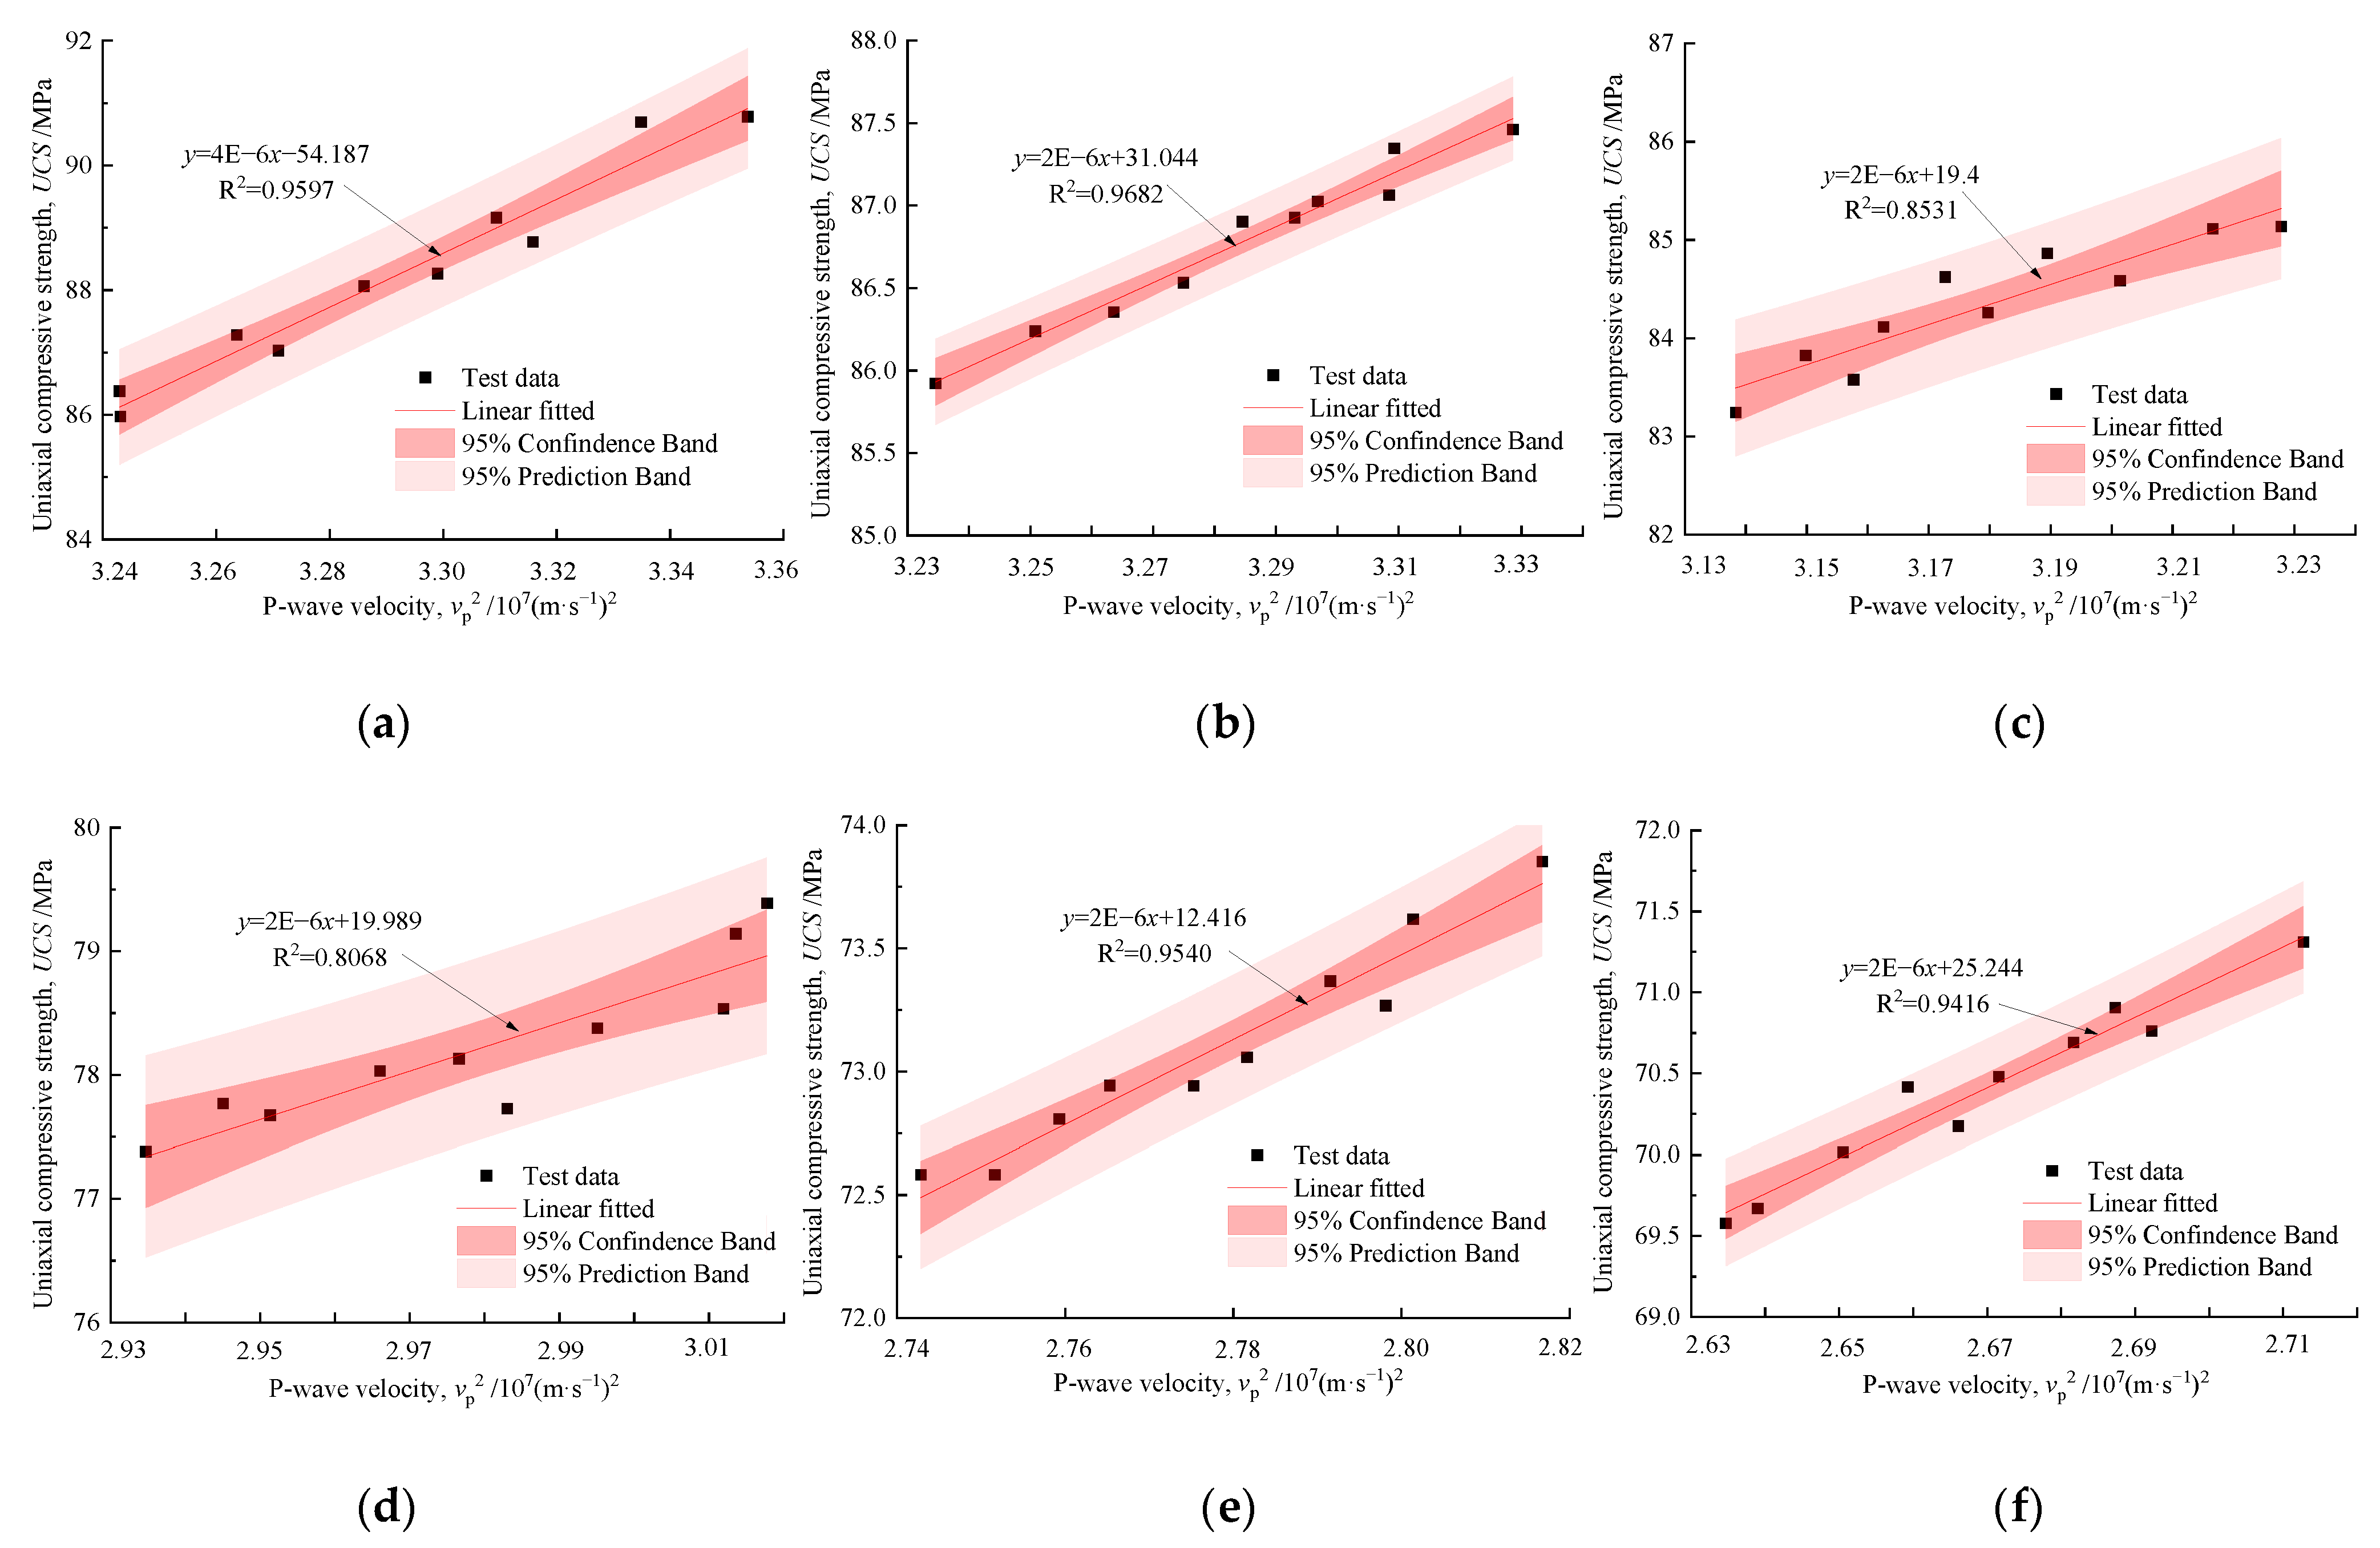
The relationship between the
UCS and
vp of the rock specimens with different initial damage degrees is shown in
Figure 12.
Figure 11 and
Figure 12 show that all the
UCS values of the rock masses are linearly positively correlated with the square of
vp.
- (1)
Without considering the initial damage degree, the fitting curve slopes of the relationships between UCS and vp are essentially the same, but the intercepts are different. This means that the rock mass needs to be identified and classified in the field applications of engineering geology. The corresponding empirical formula can then be used for strength estimation.
- (2)
The parameters of the empirical formulas, as shown in
Figure 12, do not have any physical significance. Different empirical formulas can lead to prediction results with slightly different R
2 values. It is particularly subjective and is similar to the direct empirical fitting of the strength and
vp obtained in previous studies [
11,
12,
13,
14].
Therefore, as shown in
Figure 11, the strength prediction model of the rock mass considering multiscale initial damage based on P-wave velocity (Equation (4)) is more reasonable.
4.2. Adaptability Analysis of the Strength Prediction Model
4.2.1. Adaptability of the Prediction Model to Splitting Tensile Strength
Although rock masses are more damaged owing to compression loading in engineering geology projects, the splitting tensile strength (
TS) is an important index of rock mass strength considering the impact of mining disturbances [
30]. A series of splitting tensile strength tests were carried out in an INSTRON-1346 universal material testing machine (
Figure 1) on damaged rock specimens with different initial damage degrees (
Figure 6). The test procedure was the same as that of the UCS tests (
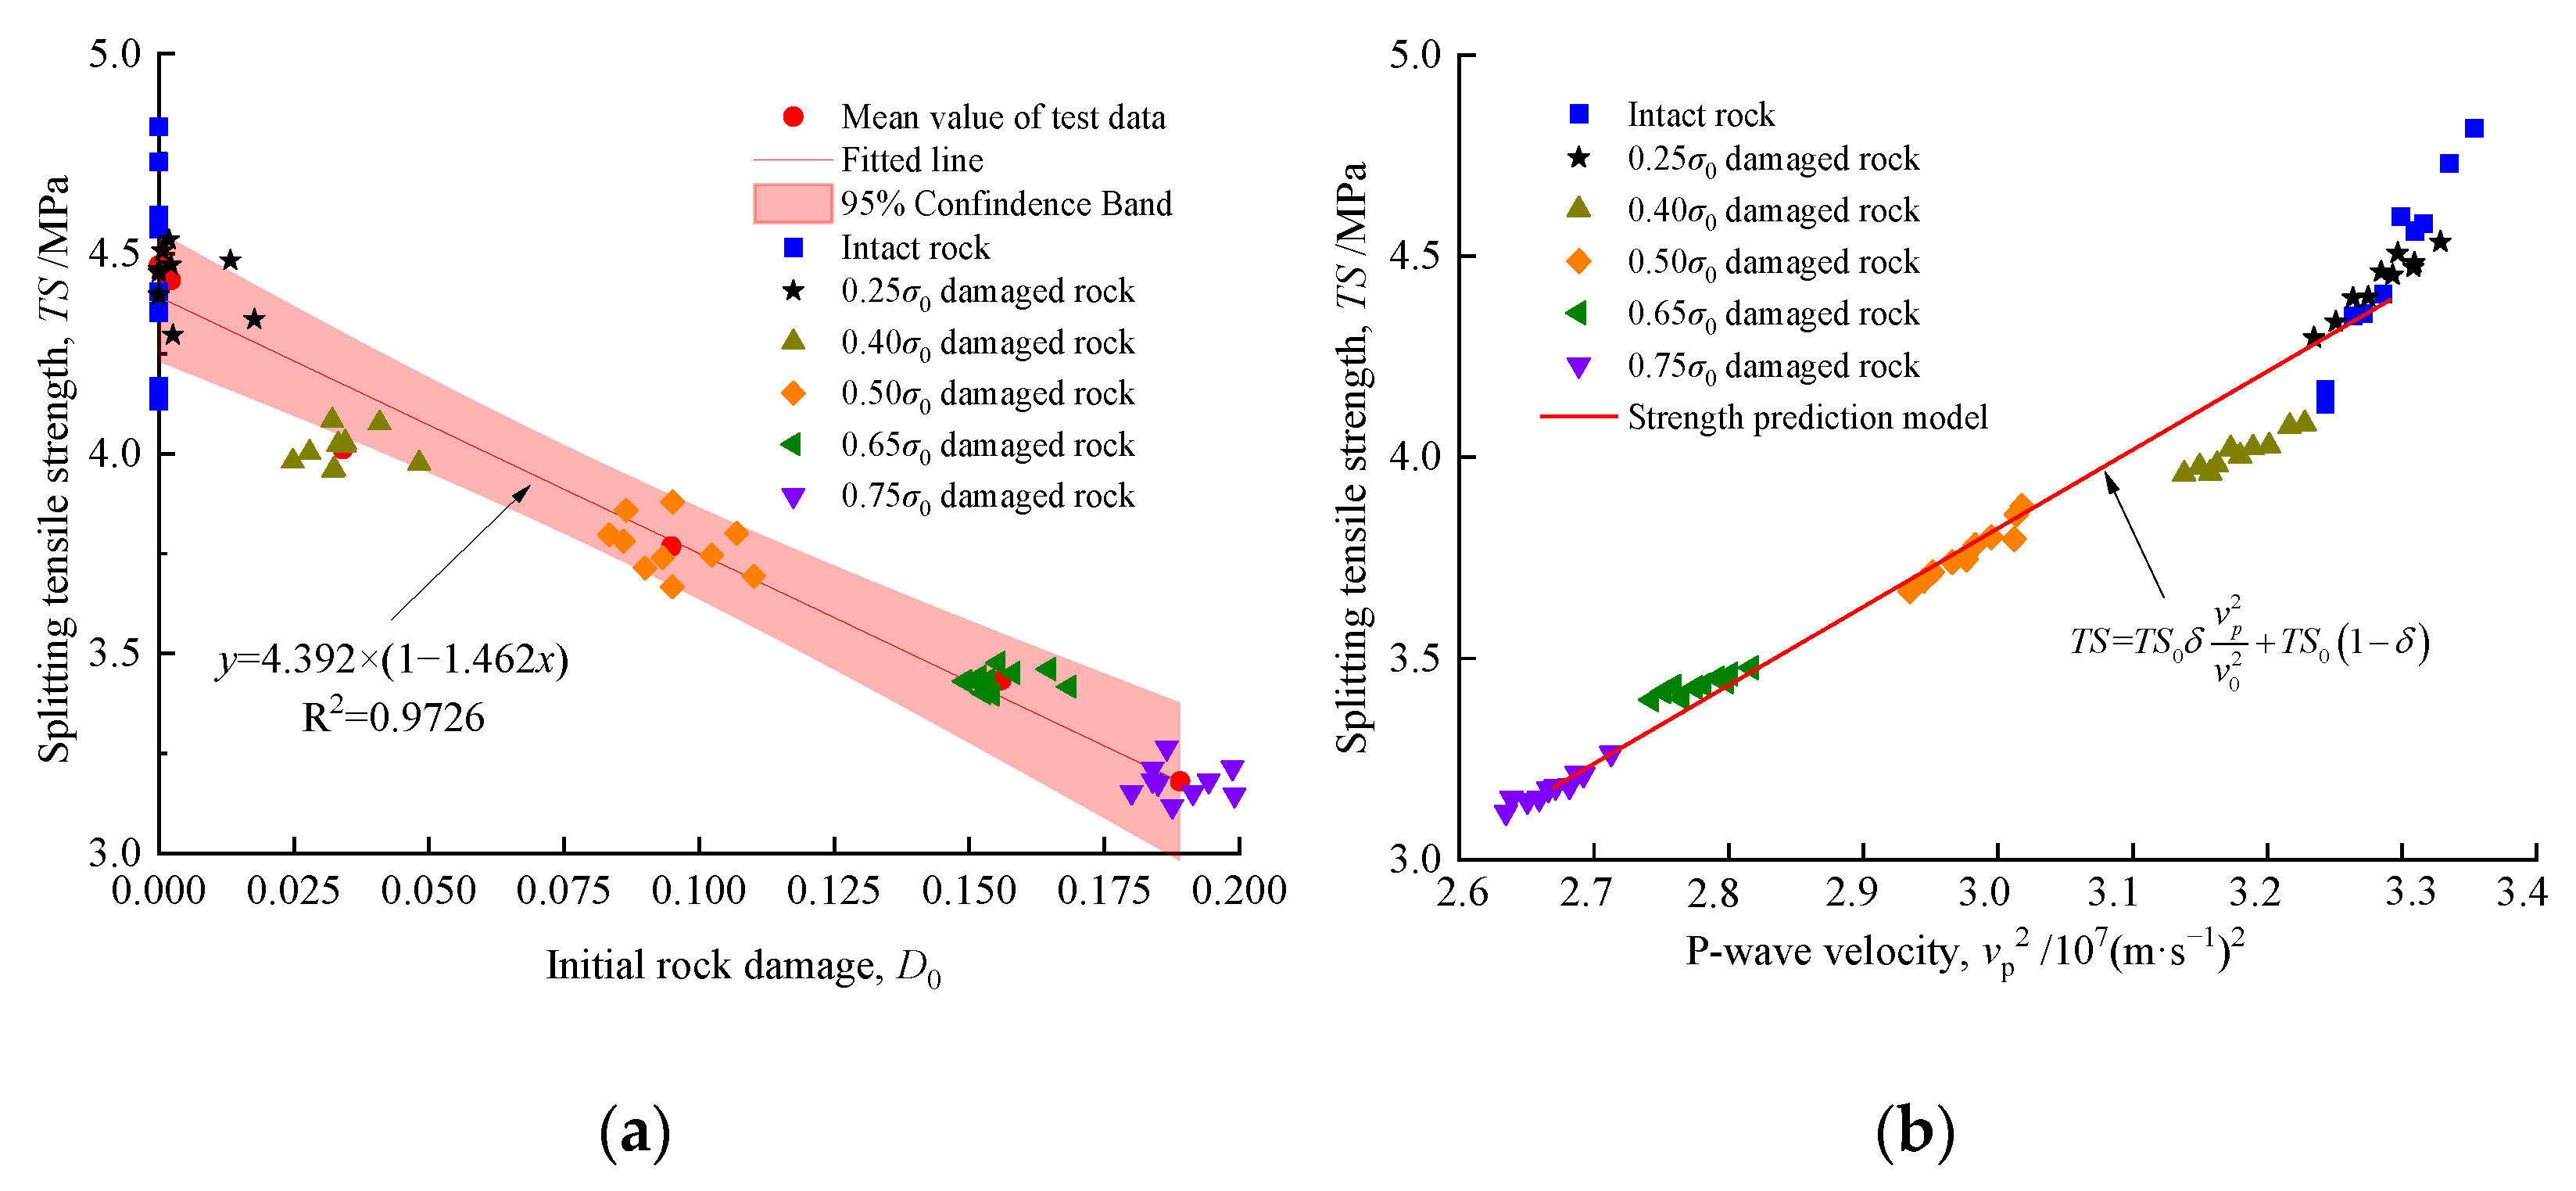
Figure 4). The results of the splitting tensile strength tests on the damaged rock specimens with different initial damage degrees are shown in
Figure 13.
As shown in
Figure 13, the splitting tensile strength prediction model of the rock mass considering multiscale initial damage based on the P-wave velocity can be expressed as
where
TS0 is the theoretical
TS value of the intact rock (MPa).
The reference values of the splitting tensile strength prediction model parameters for the dolomitic limestone were TS0 = 4.392 MPa and δ = 1.462. Equations (5) and (4) have the same form, and R2 in Equation (5) was higher than 0.97, indicating a good fit.
The strength prediction model of a rock mass considering multiscale initial damage based on the P-wave velocity can predict both UCS and splitting tensile strength, which can be rewritten as follows:
where
SR denotes the strength of the rock mass (MPa) and
S0 is the theoretical value of
SR of the intact rock (MPa).
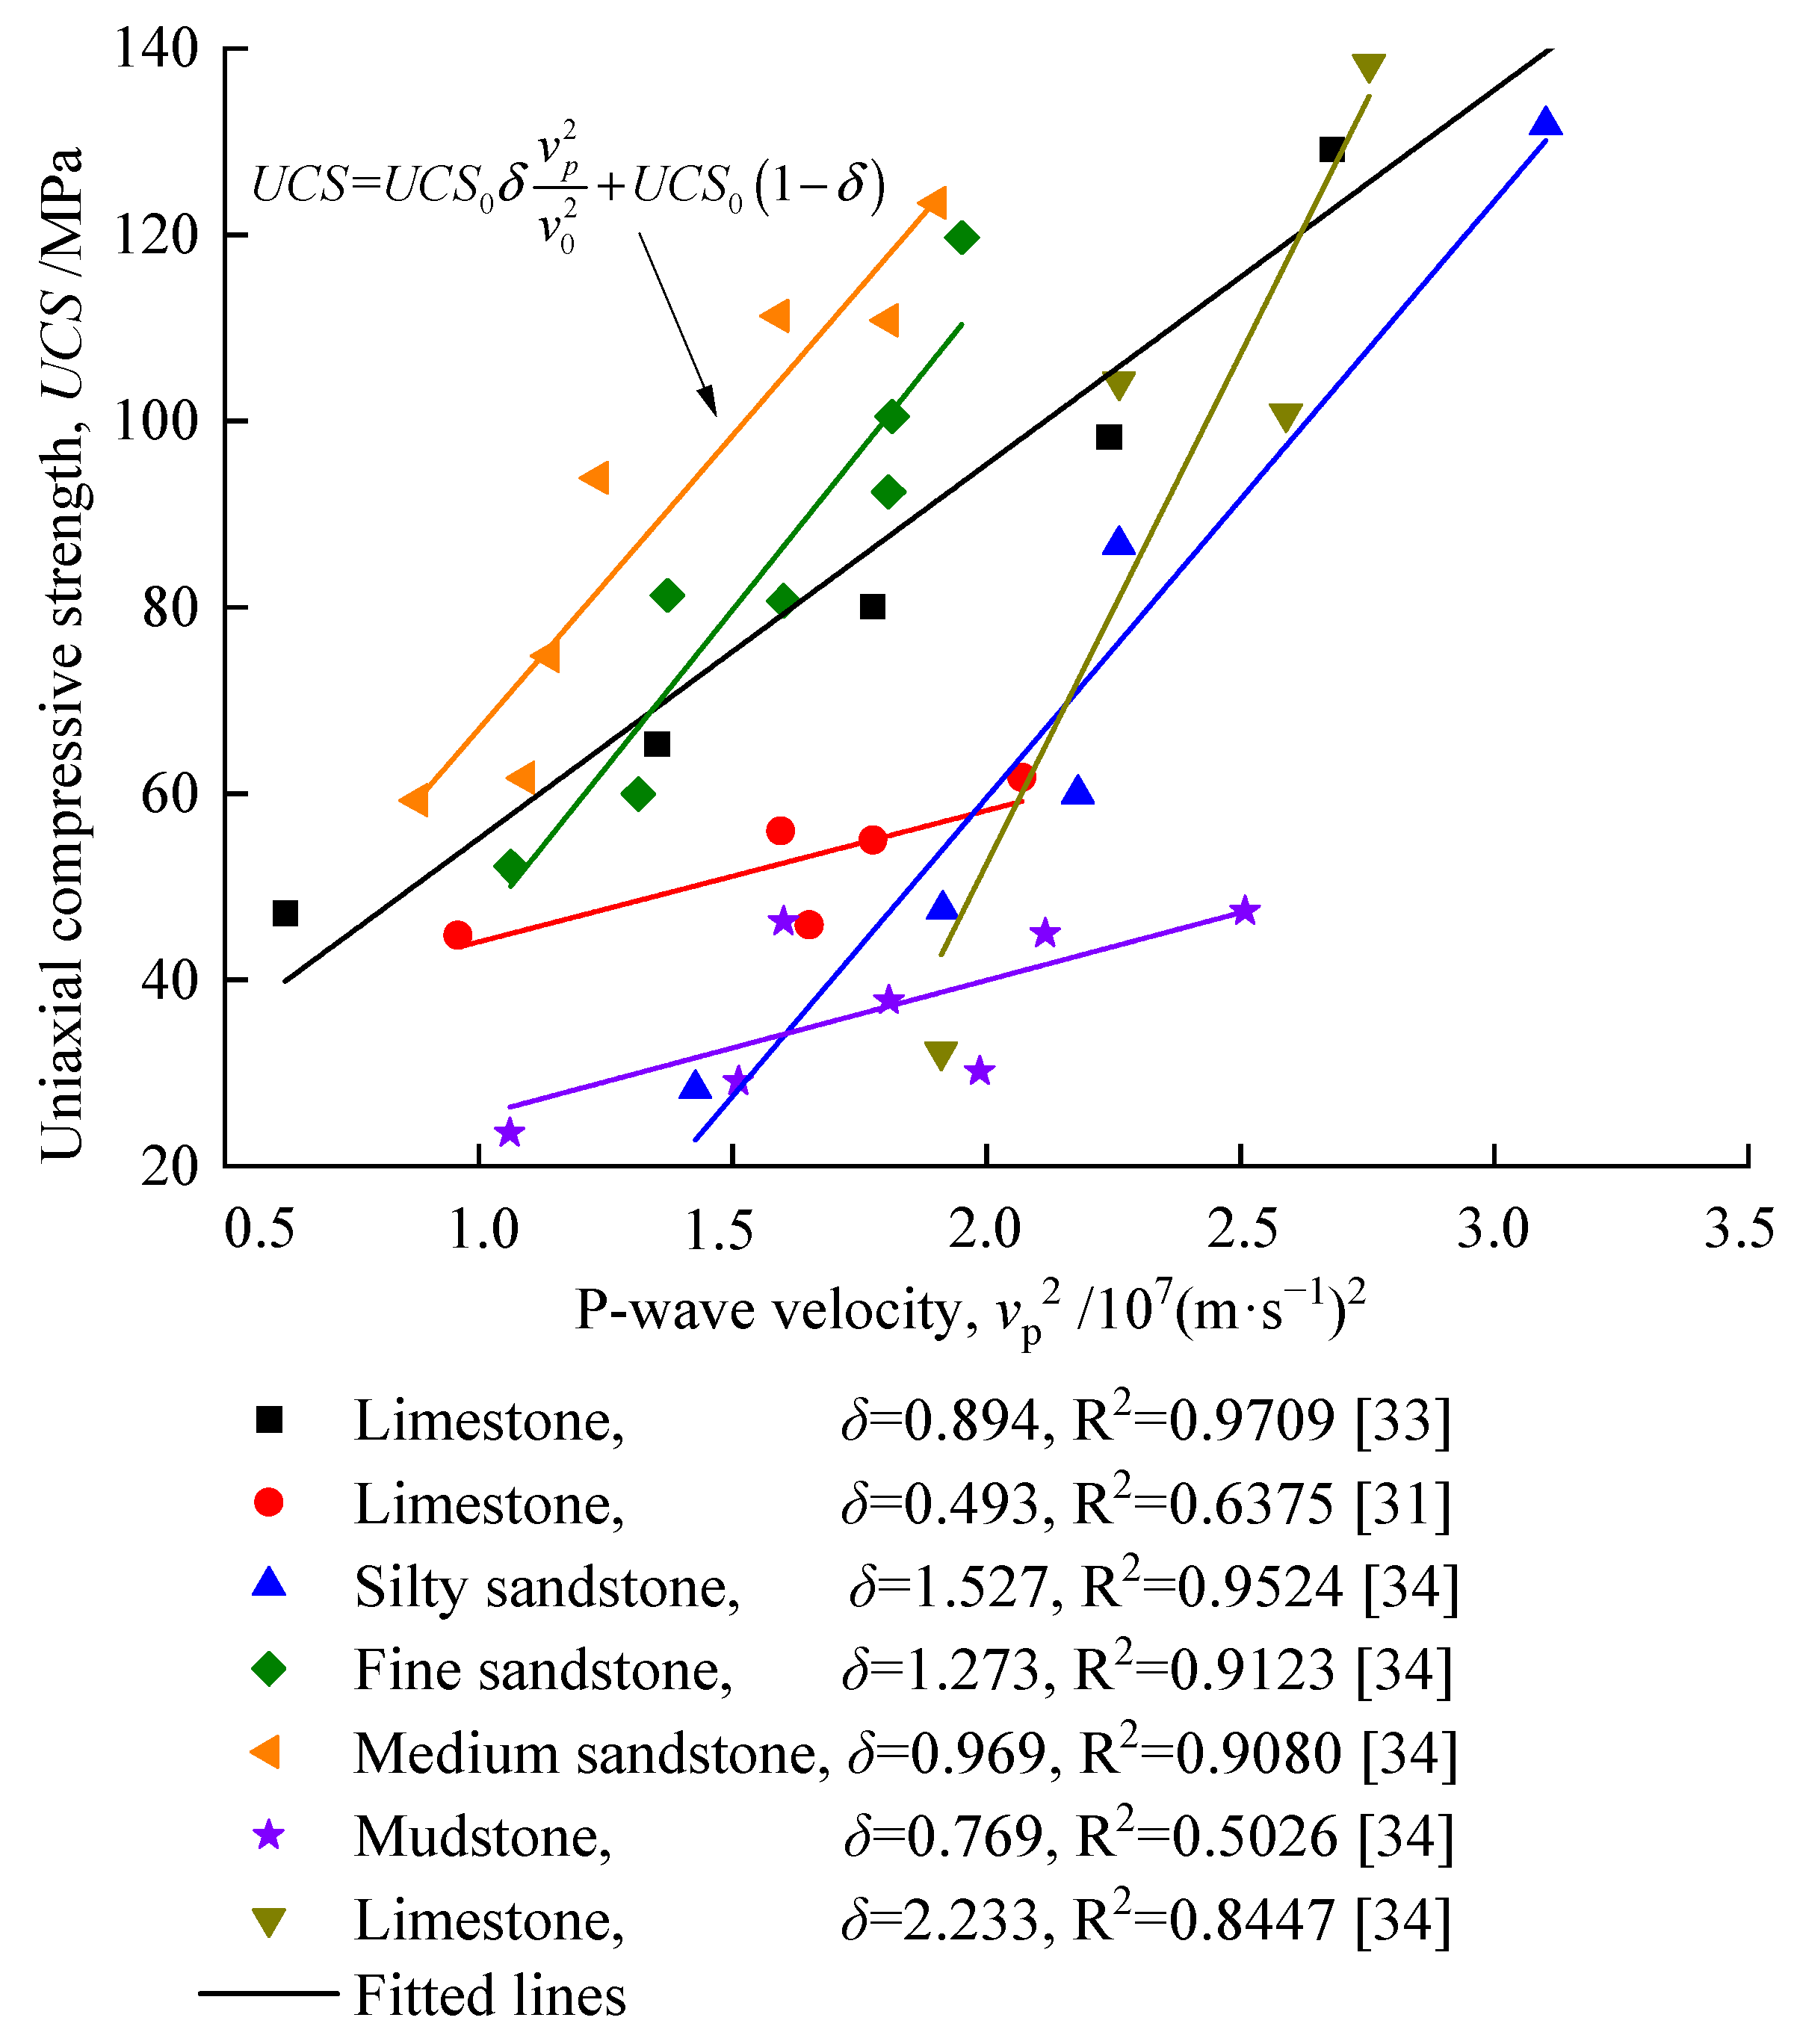
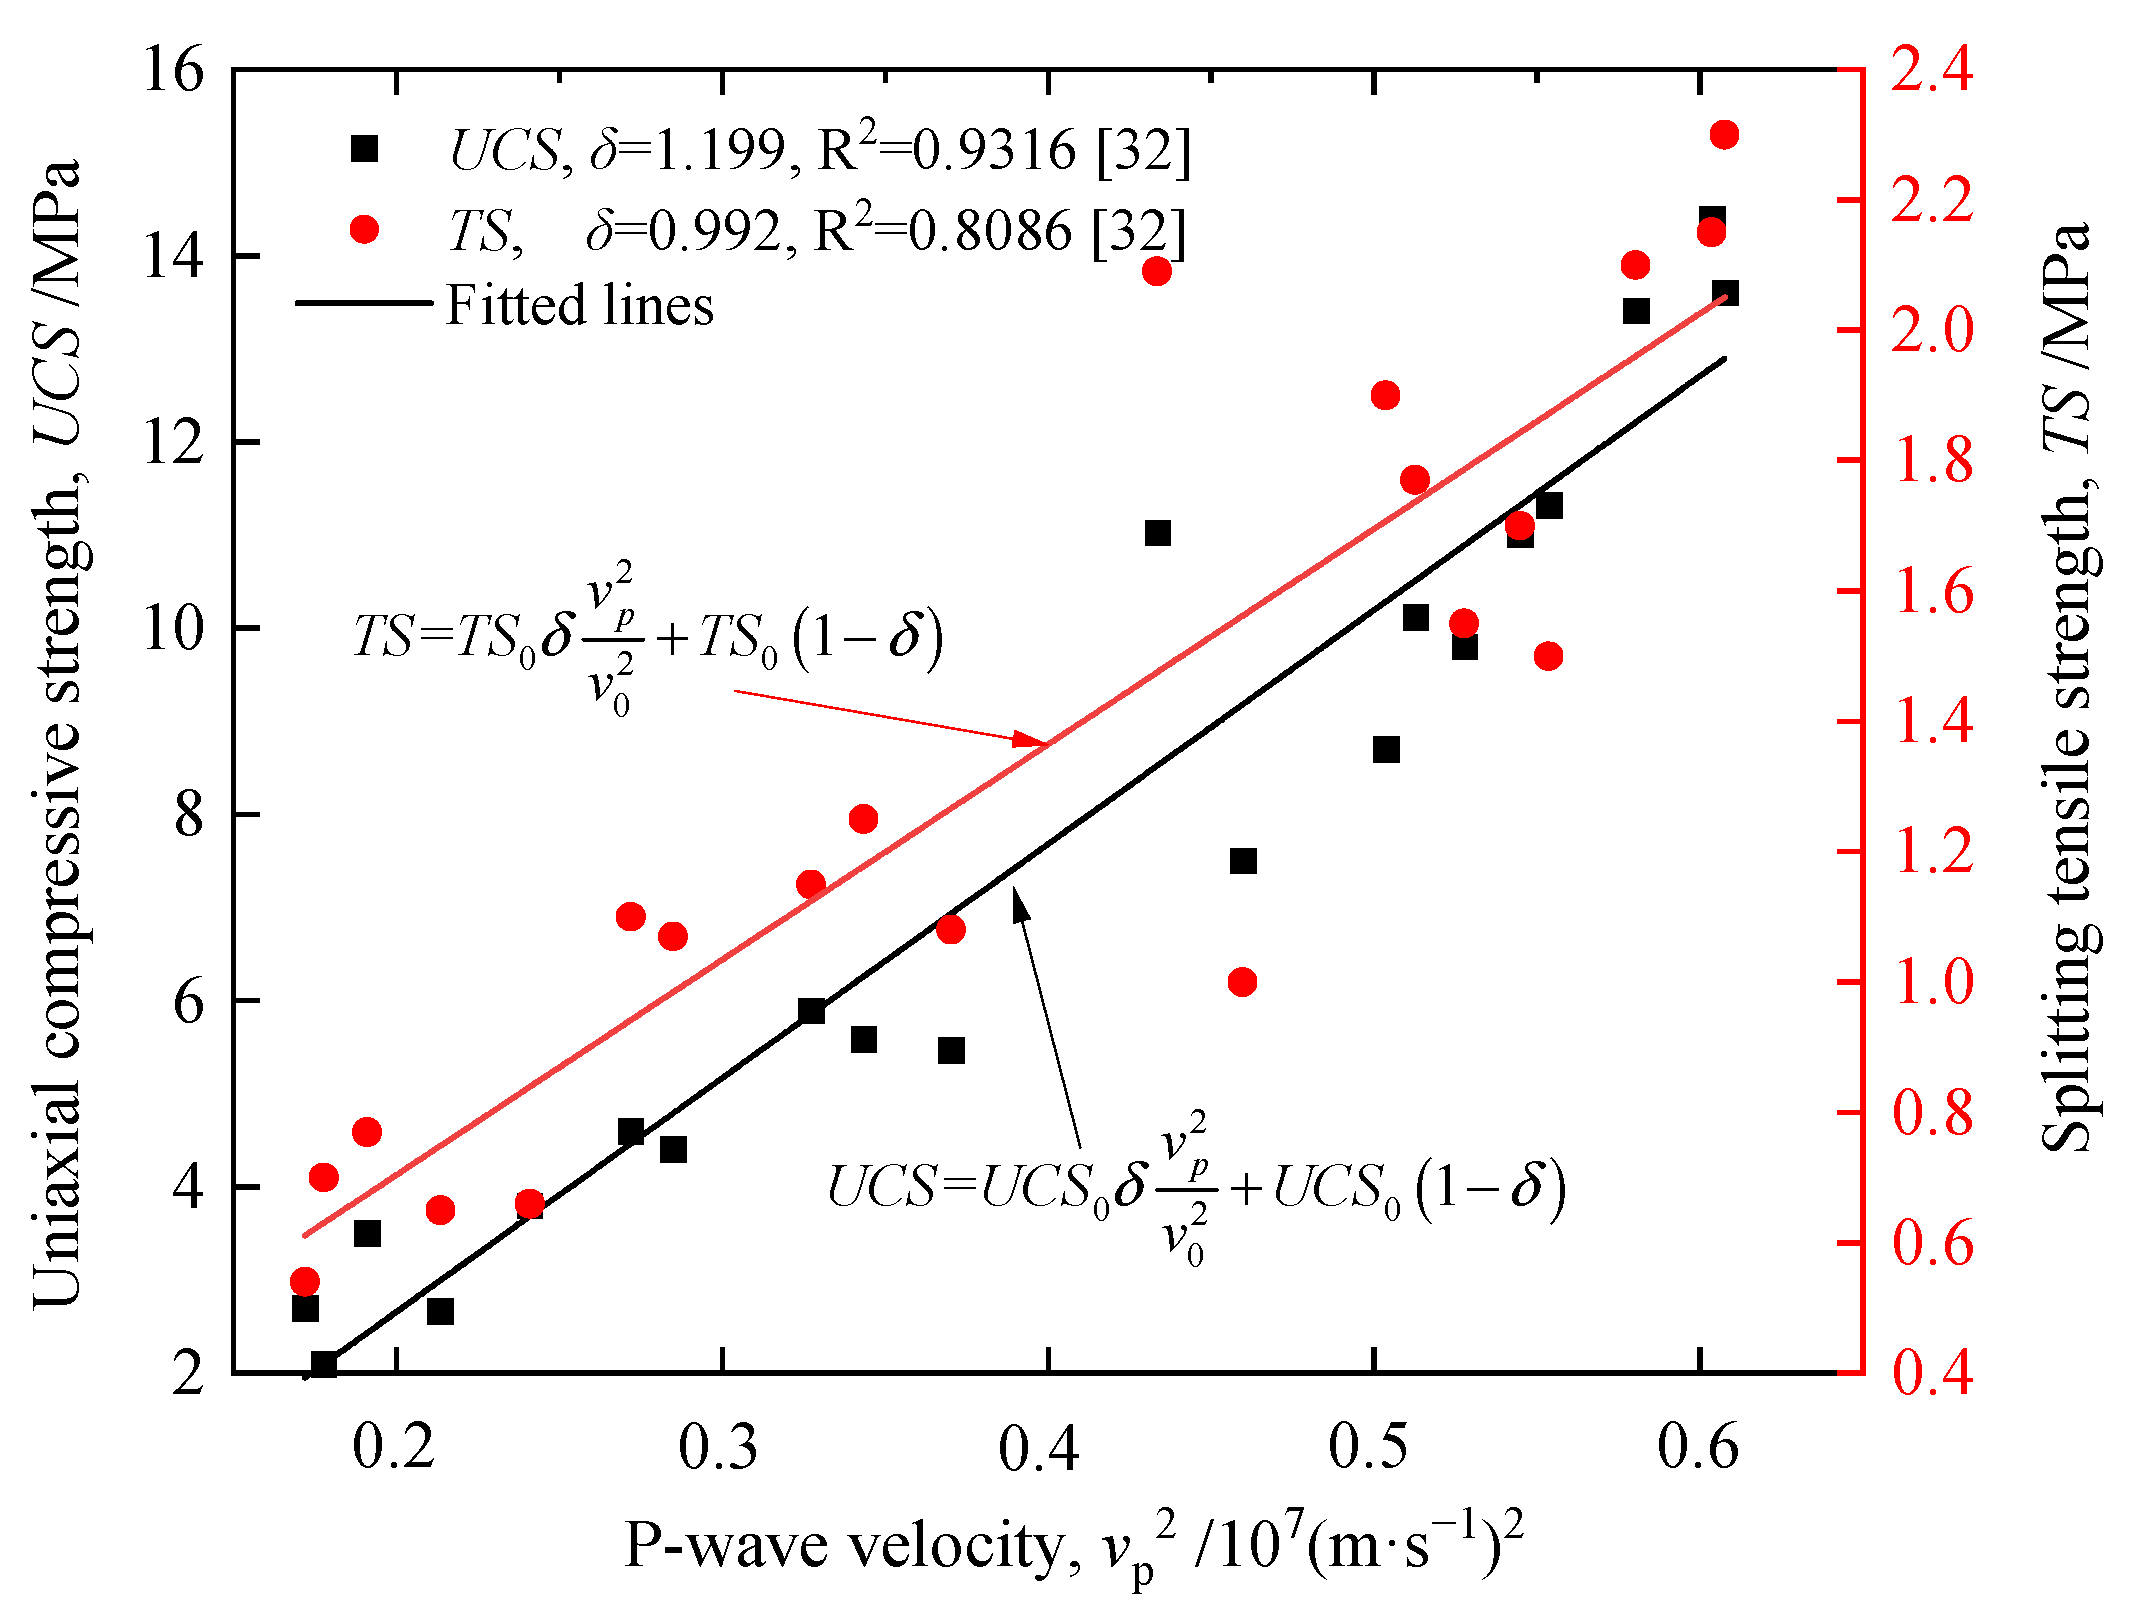
4.2.2. Adaptability of the Prediction Model to Other Rocks
The strength prediction model (Equation (6)) was used to fit the relationships between the
SR and
vp of different rock specimens, as demonstrated in previous studies [
22,
31,
32,
33,
34], as shown in
Figure 14,
Figure 15 and
Figure 16.
- (1)
The fitting lines of the strength prediction model were highly consistent with the test data points of limestone, silty sandstone, fine sandstone, medium sandstone, mudstone, material similar to limestone, and intermittent jointed rock mass. More than 73% of the R2 values were greater than 0.80, indicating that the strength prediction model could offer good adaptability to other rocks.
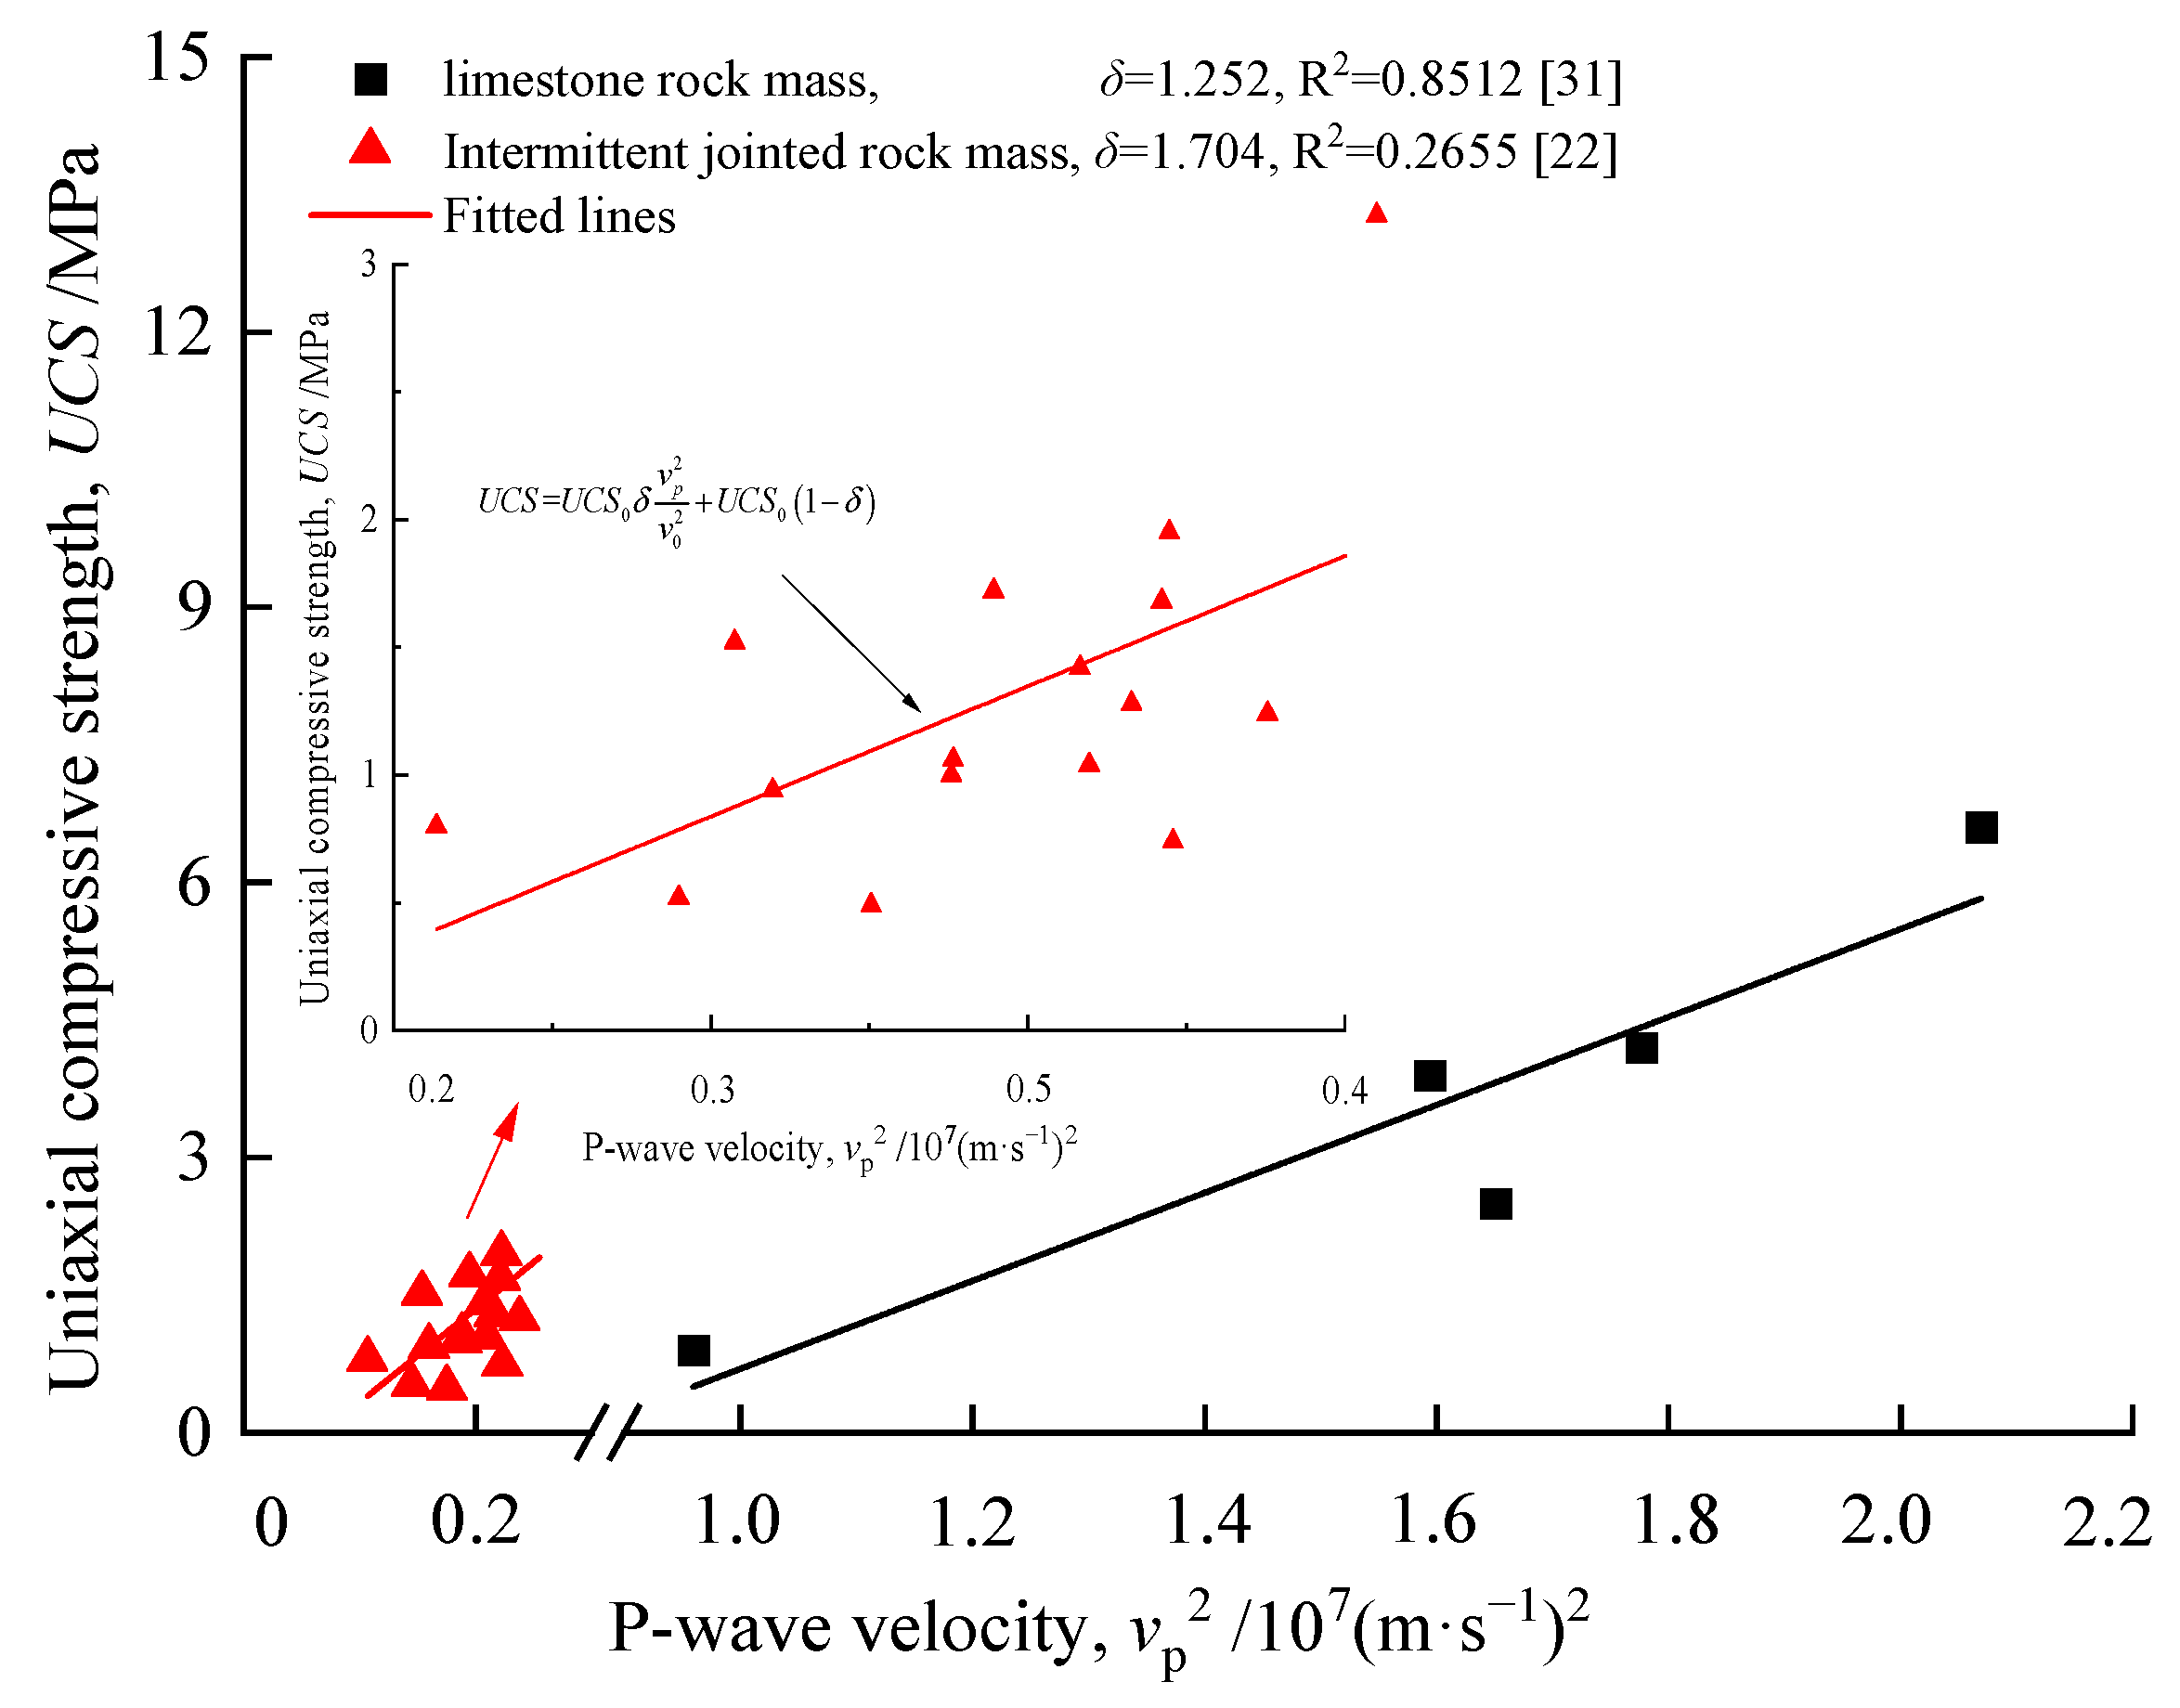
- (2)
Limited strength data for limestone and limestone rock masses were available in [
31] (
Figure 14), and the influence of data discreteness cannot be ruled out. The strength failure mode of mudstone in [
34] was plastic failure, which differed from that of the brittle rock masses (
Figure 15). The R
2 value of the intermittent jointed rock mass reported by [
22] was the lowest at 0.2655 (
Figure 16). This is because Equation (6) was established on the assumption that the initial damage to the rock mass was macroscopically continuous. However, the initial damage to the intermittent jointed rock mass was macroscopically discontinuous. Therefore, the strength of mudstone and intermittently jointed rock mass cannot be predicted using the strength prediction model for brittle rock masses (Equation (6)).
- (3)
Based on the comparability of the test results, only the three groups of rock specimens (silty sandstone, fine sandstone, and medium sandstone) in
Figure 14 are compared. The larger the rock particle size, the smaller the correction parameter
δ of the model (Equation (6)).
Conclusively, the strength prediction model of the rock mass considering the multiscale initial damage based on the P-wave velocity (Equation (6)) can be used to obtain the strengths of brittle rock masses directly in engineering geology projects.
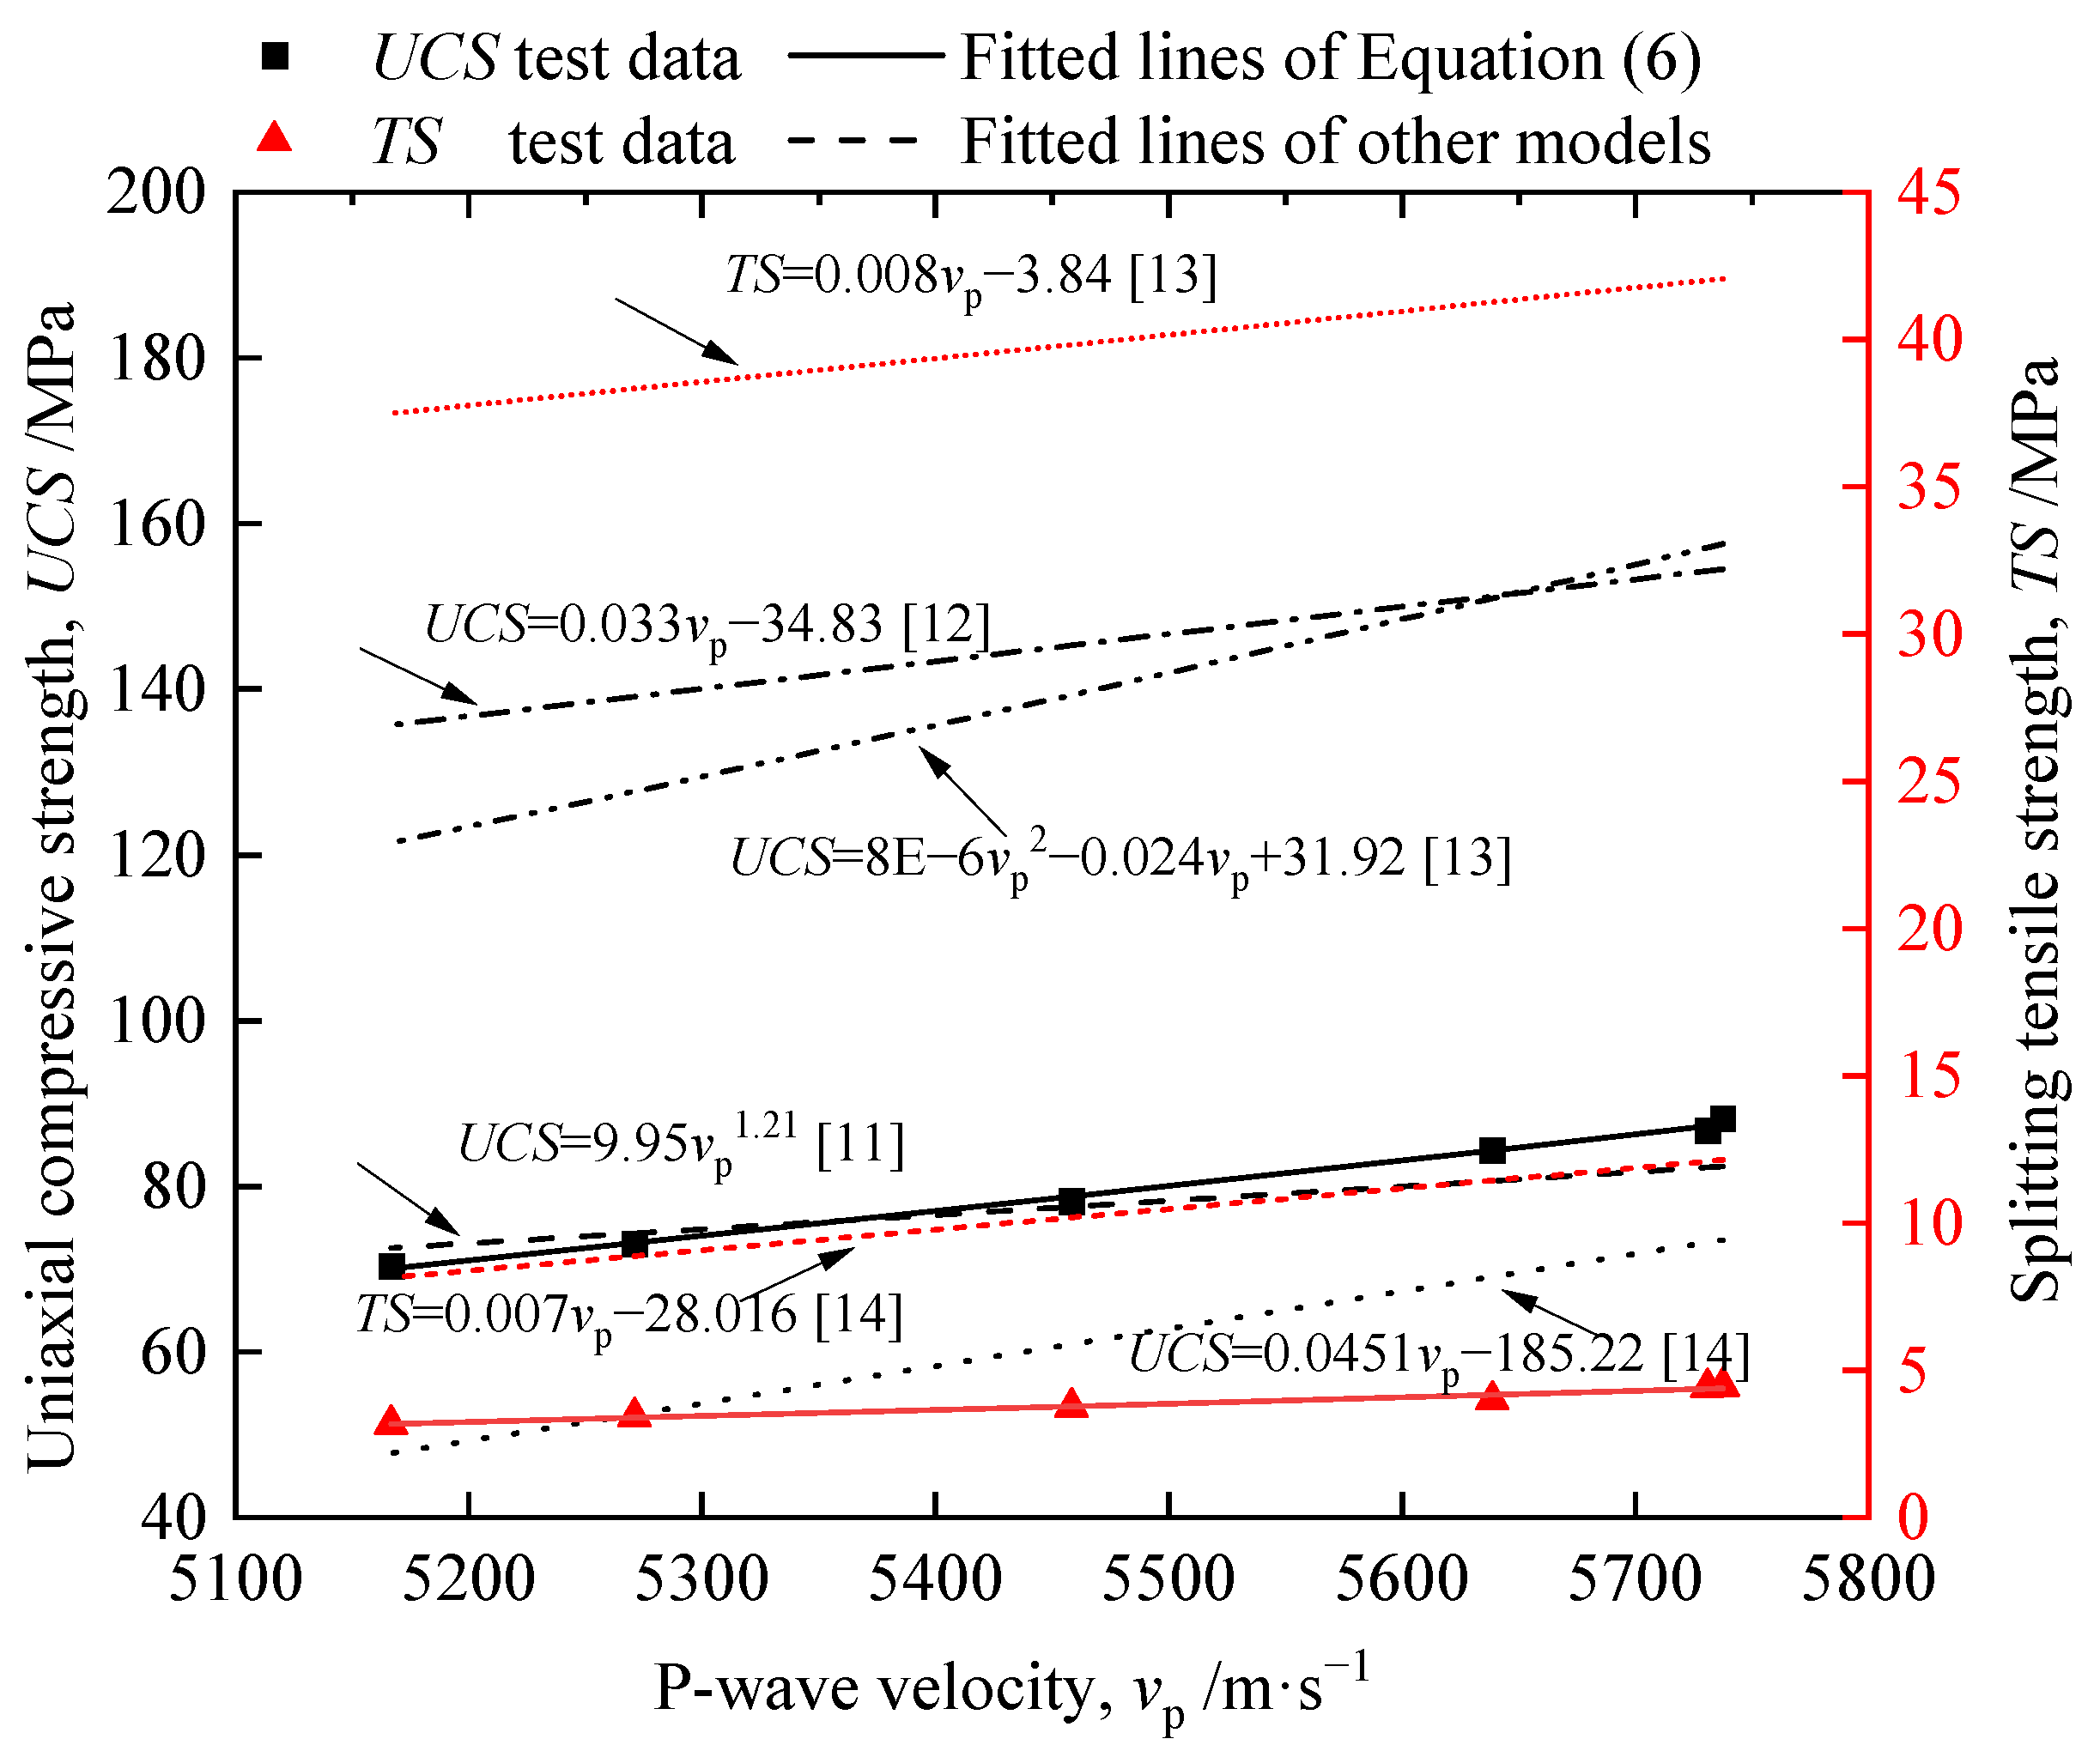
4.2.3. Comparison with Other Strength Prediction Models
Many previous studies have provided empirical formulas for the relationships between the
SR and
vp of rock masses [
11,
12,
13,
14]. Comparisons between the theoretical results and test data of the strength prediction model (Equation (6)) and other empirical formula models are shown in
Figure 17.
Figure 17 shows that only the results by [
11] are relatively close to the test data. However, they did not consider the impact of the initial damage degree of the rock mass on the prediction results. In addition, the fitting of the empirical formula requires a large amount of rock strength data. All the coefficients of the empirical formula are fitting parameters, which have no practical significance. The empirical formula used in previous studies cannot be widely used in the strength estimation of other engineering rock masses.
Therefore, the strength prediction model for brittle rock masses considering the multiscale initial damage based on the P-wave velocity (Equation (6)) is more reasonable and its application is more convenient. There is only one unknown parameter δ in the model (Equation (6)), which is closely related to the material properties of rocks, considering the initial damage characteristics.
5. Discussion
Theoretically, the strength of a rock mass with a fractured surface and joint structure can be obtained using the new strength prediction model established in this study. However, as shown in
Figure 16, the R
2 value of the intermittent jointed rock mass reported by [
22] was 0.2655, indicating a poor fit. This study limits the assumption that the initial damage to the rock mass is regarded as macroscopically continuous. On the contrary, a rock mass with a fractured surface has a greater variability in strength. A larger sample size is required to obtain predictions that are more accurate. Conclusively, the data distribution of the intermittent jointed rock mass, shown in
Figure 16, exhibits a linear growth trend.
Simultaneously, the axial strain generated in the crack-closure stage was higher than that in the intact rock (
Figure 5). As the initial damage degree increased, the strain generated in the crack-closure stage increased. This was because there were distinct fractures at the corners of the damaged rock specimens (
Figure 6). The interface of the axial actuator of the apparatus (
Figure 1) took a long time to fully contact the end faces of the damaged rock specimens. The greater the initial damage degree, the more fractures on the damaged rock specimens, and the larger the strains generated in the crack-closure stage.
In general, the strength prediction model for brittle rock masses established in this study, considering the multiscale initial damage based on the P-wave velocity, is relatively reliable, and its application is more convenient than that of previous models.
6. Conclusions
Based on the results of the uniaxial compressive strength tests and P-wave velocity tests, a new strength prediction model for brittle rock masses, considering multiscale initial damage based on P-wave velocity, was established. The following conclusions can be drawn:
- (1)
The strength prediction model for brittle rock masses considering multiscale initial damage based on P-wave velocity was proved to be reasonably practical, and its parameters had physical significance. The larger the rock particle size, the smaller the correction parameter of the strength prediction model.
- (2)
The uniaxial compressive strength of the rock mass was linearly positively correlated with the square of the P-wave velocity and linearly inversely correlated with the initial damage. The line-fitted results were within the upper and lower limits of the 95% confidence interval of the UCS.
- (3)
As the initial damage degree increased, the initial rock damage increased linearly, the P-wave velocity decay rate increased, the strength decreased monotonically, and the peak axial strain increased significantly. It was proved to be feasible to prepare damaged rock specimens with multiscale initial cracks under various uniaxial compressive stresses.
- (4)
The strength prediction model, e.g., the uniaxial compressive strength prediction model and the splitting tensile strength prediction model, could offer good adaptability to other rocks, which can be used to obtain the strength of brittle rock masses directly in engineering geology projects.
Author Contributions
Methodology: X.X., J.H.; Investigation: X.X., S.M., Y.L., G.W.; Writing—Original Draft: X.X., J.H.; Writing—Review and Editing: X.X., C.X., J.H., S.M., Y.L., L.W., G.W.; Project administration: X.X., C.X., J.H., S.M.; Conceptualization: C.X.; Resources: C.X.; Supervision: C.X.; Funding acquisition: C.X.; Formal analysis: J.H.; Validation: S.M., L.W. All authors have read and agreed to the published version of the manuscript.
Funding
This research was funded by National Natural Science Foundation of China with Grant no. 41672298 and the Scientific Research Innovation Project of Postgraduate in Hunan Province of China with Grant no. QL20210068.
Institutional Review Board Statement
Not applicable.
Informed Consent Statement
Not applicable.
Data Availability Statement
Data available on request from the authors. The data that support the findings of this study are available from the corresponding author [Shaowei Ma], upon reasonable request.
Conflicts of Interest
The authors declare no conflict of interest.
References
- Mishra, D.; Basu, A. Estimation of uniaxial compressive strength of rock materials by index tests using regression analysis and fuzzy inference system. Eng. Geol. 2013, 160, 54–68. [Google Scholar] [CrossRef]
- Li, W.; Tan, Z.Y. Research on rock strength prediction based on least squares support vector machine. Geotech. Geol. Eng. 2017, 35, 385–393. [Google Scholar] [CrossRef]
- Yin, P.; Ma, J.; Yan, C.; Huang, L. Estimation of the shear strength of fractured Gosford sandstone based on fractal theory and numerical modelling. J. Pet. Sci. Eng. 2019, 182, 106278. [Google Scholar] [CrossRef]
- Chen, S.; Cao, X.; Yang, Z. Three Dimensional Statistical Damage Constitutive Model of Rock Based on Griffith Strength Criterion. Geotech. Geol. Eng. 2021, 39, 5549–5557. [Google Scholar] [CrossRef]
- Shen, J.; Wan, L.; Zuo, J. Non-linear Shear Strength Model for Coal Rocks. Rock Mech. Rock Eng. 2019, 52, 4123–4132. [Google Scholar] [CrossRef]
- Diamantis, K.; Gartzos, E.; Migiros, G. Study on uniaxial compressive strength, point load strength index, dynamic and physical properties of serpentinites from Central Greece: Test results and empirical relations. Eng. Geol. 2009, 108, 199–207. [Google Scholar] [CrossRef]
- Tiryaki, B. Predicting intact rock strength for mechanical excavation using multivariate statistics, artificial neural networks, and regression trees. Eng. Geol. 2008, 99, 51–60. [Google Scholar] [CrossRef]
- Öge, I.F. Prediction of cementitious grout take for a mine shaft permeation by adaptive neuro-fuzzy inference system and multiple regression. Eng. Geol. 2017, 228, 238–248. [Google Scholar] [CrossRef]
- Xie, C.; Nguyen, H.; Bui, X.-N.; Nguyen, V.-T.; Zhou, J. Predicting roof displacement of roadways in underground coal mines using adaptive neuro-fuzzy inference system optimized by various physics-based optimization algorithms. J. Rock Mech. Geotech. Eng. 2021, 13, 1452–1465. [Google Scholar] [CrossRef]
- Xie, C.; Nguyen, H.; Choi, Y.; Armaghani, D.J. Optimized functional linked neural network for predicting diaphragm wall deflection induced by braced excavations in clays. Geosci. Front. 2022, 13, 101313. [Google Scholar] [CrossRef]
- Kahraman, S. Evaluation of simple methods for assessing the uniaxial compressive strength of rock. Int. J. Rock Mech. Min. Sci. 2001, 38, 981–994. [Google Scholar] [CrossRef]
- Khandelwal, M. Correlating P-wave Velocity with the Physico-Mechanical Properties of Different Rocks. Pure Appl. Geophys. 2013, 170, 507–514. [Google Scholar] [CrossRef]
- Kurtuluş, C.; Sertçelik, I. Correlating physico-mechanical properties of intact rocks with P-wave velocity. Acta Geod. Geophys. 2016, 51, 571–582. [Google Scholar] [CrossRef] [Green Version]
- Khajevand, R.; Fereidooni, D. Assessing the empirical correlations between engineering properties and P wave velocity of some sedimentary rock samples from Damghan, northern Iran. Arab. J. Geosci. 2018, 11, 528. [Google Scholar] [CrossRef]
- Li, X.; Konietzky, H.; Li, X.; Wang, Y. Failure pattern of brittle rock governed by initial microcrack characteristics. Acta Geotech. 2019, 14, 1437–1457. [Google Scholar] [CrossRef]
- Zhang, Y.; Xu, Y.; Liu, X.; Yao, X.; Wang, S.; Liang, P.; Sun, L.B. Quantitative characterization and mesoscopic study of propagation and evo-lution of three-dimensional rock fractures based on CT. Rock. Soil Mech. 2021, 42, 2659–2671. [Google Scholar] [CrossRef]
- Ma, J.; Zhao, G.; Khalili, N. An elastoplastic damage model for fractured porous media. Mech. Mater. 2016, 100, 41–54. [Google Scholar] [CrossRef] [Green Version]
- Xu, X.; Gao, F.; Zhang, Z. Thermo-mechanical coupling damage constitutive model of rock based on the Hoek–Brown strength criterion. Int. J. Damage Mech. 2018, 27, 1213–1230. [Google Scholar] [CrossRef]
- Ma, J.; Chen, J.; Chen, W.; Huang, L. A coupled thermal-elastic-plastic-damage model for concrete subjected to dynamic loading. Int. J. Plast. 2022, 153, 103279. [Google Scholar] [CrossRef]
- Zhang, H.; Guo, P.; Wang, Y.; Zhao, Y.; Lin, H.; Liu, Y.; Shao, Y. Fracture Behavior of Rock with Initial Damage: Theoretical, Experimental, and Numerical Investigations. Geofluids 2020, 2020, 1–9. [Google Scholar] [CrossRef]
- Tang, X. A unified theory for elastic wave propagation through porous media containing cracks—An extension of Biot’s poroelastic wave theory. Sci. China Earth Sci. 2011, 54, 1441–1452. [Google Scholar] [CrossRef]
- Zhao, X.C.; Zhao, X.Y.; Guo, J.Q. Experimental study on acoustic and mechanical properties of intermittent jointed rock mass. Chin. J. Rock. Mech. Eng. 2020, 39, 1409–1419. [Google Scholar] [CrossRef]
- Huang, L.; Liang, J.; Ma, J.; Chen, W. A dynamic bounding surface plasticity damage model for rocks subjected to high strain rates and confinements. Int. J. Impact Eng. 2022, 168, 104306. [Google Scholar] [CrossRef]
- Fuqi, C.; Zhonghui, L.; Guoai, L.; Yang, W.; Shan, Y.; Shuaijie, L.; Yanhui, K. Influence of prefabricated fissure angle on sandstone damage and infrared radiation temperature characteristics. J. Geophys. Eng. 2018, 15, 1187–1196. [Google Scholar] [CrossRef] [Green Version]
- Hu, J.; Wen, G.; Lin, Q.; Cao, P.; Li, S. Mechanical properties and crack evolution of double-layer composite rock-like specimens with two parallel fissures under uniaxial compression. Theor. Appl. Fract. Mech. 2020, 108, 102610. [Google Scholar] [CrossRef]
- Cai, M.; Kaiser, P.K.; Tasaka, Y.; Maejima, T.; Morioka, H.; Minami, M. Generalized crack initiation and crack damage stress thresholds of brittle rock masses near underground excavations. Int. J. Rock Mech. Min. Sci. 2004, 41, 833–847. [Google Scholar] [CrossRef]
- Hou, R.B.; Zhang, K.; Tao, J. Effects of initial damage on time-dependent behavior of sandstone in uniaxial compressive creep test. Arch. Min. Sci. 2019, 64, 687–707. [Google Scholar] [CrossRef]
- Yan, C.B.; Li, G.Q.; Chen, D.L. Amended expressions of Hoek-Brown criterion based on blasting cumulative damage effects of rock mass. Chin. Rock Soil Mech. 2011, 32, 2951–2964. [Google Scholar] [CrossRef]
- Tarasińska, J. Confidence intervals for the power of Student’s t-test. Stat. Probab. Lett. 2005, 73, 125–130. [Google Scholar] [CrossRef]
- Liu, B.; Sang, H.; Wang, Z.; Kang, Y. Experimental Study on the Mechanical Properties of Rock Fracture after Grouting Reinforcement. Energies 2020, 13, 4814. [Google Scholar] [CrossRef]
- Xia, K.Z.; Chen, C.X.; Liu, X.M.; Zheng, Y.; Zhou, Y.C. Estimation of rock mass mechanical parameters based on ultrasonic velocity of rock mass and hoek-brown criterion and its application to engineering. Chin. J. Rock. Mech. Eng. 2013, 32, 1458–1466. [Google Scholar]
- Liu, T.X.; Long, W.; Hu, L.Y. Application of ultrasonicwave in strength measurement of similar materials of lime-stone. Chin. J. Transp. Sci. Eng. 2013, 29, 27–31. [Google Scholar] [CrossRef]
- Xie, J. Study on relations between acoustic wave velocity and mechanical parameters for limestone. Chin. J. Hunan Inst. Sci. Tech. (Nat. Sci.) 2020, 33, 34–37. [Google Scholar] [CrossRef]
- Wang, R.J.L.; Ren, M.; Liu, J.S.; Lipeng, Z.; Shengnan, X.; Ting, S. Study on correlation between rock wave velocity and strength parameters. Chin. Min. Res. Dev. 2021, 41, 87–91. [Google Scholar] [CrossRef]
| Publisher’s Note: MDPI stays neutral with regard to jurisdictional claims in published maps and institutional affiliations. |
© 2022 by the authors. Licensee MDPI, Basel, Switzerland. This article is an open access article distributed under the terms and conditions of the Creative Commons Attribution (CC BY) license (https://creativecommons.org/licenses/by/4.0/).


