Article

Identifying and Characterizing Critical Source Areas of Organic and Inorganic Pollutants in Urban Agglomeration in Lake Baikal Watershed

1
Limnological Institute of Siberian Branch of Russian Academy of Sciences, Ulan-Batorskaya St. 3, 664033 Irkutsk, Russia
2
V.B. Sochava Institute of Geography of Siberian Branch of Russian Academy of Sciences, Ulan-Batorskaya St. 1, 664033 Irkutsk, Russia
3
Department of Chemistry and Food Technology, Institute of High Technologies, Irkutsk National Research Technical University, Lermontov St. 83, 664074 Irkutsk, Russia
4
Faculty of Preventive Medicine, I.M. Sechenov First Moscow State Medical University of the Ministry of Health of the Russian Federation (Sechenov University), Trubetskaya St. 8-2, 119991 Moscow, Russia
*
Author to whom correspondence should be addressed.
Sustainability 2022, 14(22), 14827; https://doi.org/10.3390/su142214827
Submission received: 18 October 2022 / Revised: 5 November 2022 / Accepted: 8 November 2022 / Published: 10 November 2022
(This article belongs to the Special Issue Environmental Water, Air, and Soil Pollution)

Abstract

:
Critical source areas (CSAs) are the areas prone to generating runoff and are characterized by a high level of soil pollution. CSAs may accumulate and release soil pollutants emitted by primary emission sources (industrial and municipal enterprises) into the surface water during storm events. The aim of this study was to identify CSAs and their pollution sources and to assess the level of soil pollution in CSAs with polycyclic aromatic hydrocarbons (PAH) and trace metals (TM). CSAs were identified using a geospatial data model (GIS), and primary emission sources were identified using a positive matrix factorization (PMF) model. It was found that the soils of CSAs were characterized by higher pollution levels than soils outside the CSAs. Pollution levels were highly variable among the identified CSAs due to the different capacities of the plants located in those areas. Due to high variability of TM concentrations in preindustrial soils, the pollution level of PAHs and the pollution level of TMs in CSA soils did not correlate with each other. The PAH composition of bottom sediments was different from that of soils, whereas the TM compositions of the soils and bottom sediments were similar. It was proved that the main sources of PAHs and TMs in CSA soils were traffic emissions and central heating boilers.

1. Introduction

Due to the increasing human economic activity, the problem of water pollution has become increasingly important all over the world [1,2]. This is particularly important for the Lake Baikal area, which has faced increasing anthropogenic pressure during the last decade [3,4]. The most dramatic example of environmental disaster during that time was the nearshore benthic blooms of the filamentous green algae Spirogyra in Lake Baikal [5,6]. The Ulan-Ude city located 140 km upstream of the Selenga River mouth (Figure 1) is the main polluter of the waters of Lake Baikal and its largest tributary—the Selenga River [7,8,9]. Pollutants may enter surface waters directly as treated and untreated industrial and municipal waste discharges; however, the pollution of surface waters is to a much greater extent linked to soil pollution [10,11]. In urban areas, soil contamination is caused by primary pollution sources such as central heating boilers, municipal trash heaps, food processing wastes, industry, traffic emissions, concrete block and brick factories, oil refineries and many others. The locations of such sources are no a secret. Polluted soils represent secondary emission sources of contaminants to water [12] and the locations of such sources are unknown. In the last four decades, water quality models such as SWAT [13], AGNPS [14] and GWLF [15] were used to identify the watershed areas responsible for stream water pollution. These models are based on estimating the direct runoff from rainfall using the SCS curve number rainfall–runoff equation derived from the water balance equation [16]. Unfortunately, these models are mainly focused on predicting storm flow hydrographs rather than on identifying the locations of runoff-producing areas, which is crucial for identifying pollution source areas [17]. Moreover, these models can hardly be applied to poorly studied areas such as Ulan-Ude city because the detailed digital input data on weather conditions, land use, land management, soil properties, hydrology, etc., are necessary to run these models.
In the last two decades, the new topography-based hydrological water quality concept has become popular. According to this concept, a large amount of water is sourced from small hydrologically sensitive areas (HSAs) that are especially prone to generating runoff [17,18]. When the HSA is characterized by a high level of soil pollution, this area is also called a critical source area (CSA) [19]. In urban agglomerations, CSAs are usually located near the primary emission sources. A CSA may release large amount of soil pollutants into the surface water. The release of soil pollutants into the surface water can occur through surface runoff when the soil is saturated by water to its full capacity during a storm event [20]. Soil saturation is possible in two cases: (1) when the precipitation intensity is greater than the infiltration capacity of the soil and (2) when the soil’s capacity to store water is exceeded. The first mechanism is characteristic for mountainous areas and areas characterized by a wide distribution of impervious surfaces [21], whereas the second mechanism is typical for undisturbed areas with a shallow bedding of groundwater [17,22,23]. Areas of both types occur in the territory of the Ulan-Ude urban agglomeration. To identify them, a detailed digital landscape analysis such as the one that was implemented in the hydrological model TOPMODEL [24,25] is necessary. The key landscape parameters calculated by the model for HSA and CSA identification are the topographic wetness index (TWI) and the saturated hydraulic conductivity (SHC) of the soil. The TWI is a function of both the slope and the upstream contributing area per unit width orthogonal to the flow direction [25] that can be calculated using the data derived from a topographic map. SHC is a quantitative measure of a saturated soil’s ability to transmit water when subjected to a hydraulic gradient [26]. Unlike the TWI, SHC is calculated using the data on weather conditions, physical soil properties, hydrology, etc., which are not available in the right amount for the territory of Ulan-Ude city.
The absence of databases of the hydraulic properties of soils and the hydrological parameters of the stream segments of the Lake Baikal tributaries was the reason why studies devoted to the identification of HSAs and CSAs were never carried out in Lake Baikal watershed as a whole and in Ulan-Ude city in particular. Instead of studying the link between primary and secondary emission sources as well as between secondary sources and aquatic ecosystems, the pollution levels of particular ecosystem compartments such as soil [27,28], bottom sediments [29,30] and riverine water [7,8,9] were studied. The aim of this study was to identify the primary and secondary emission sources in Ulan-Ude city and to assess the level of soil pollution in critical source areas for the improvement of the water quality of the Selenga River. To achieve this aim, a fast and cost-effective technique was proposed.

2. Materials and Methods

2.1. Study Area

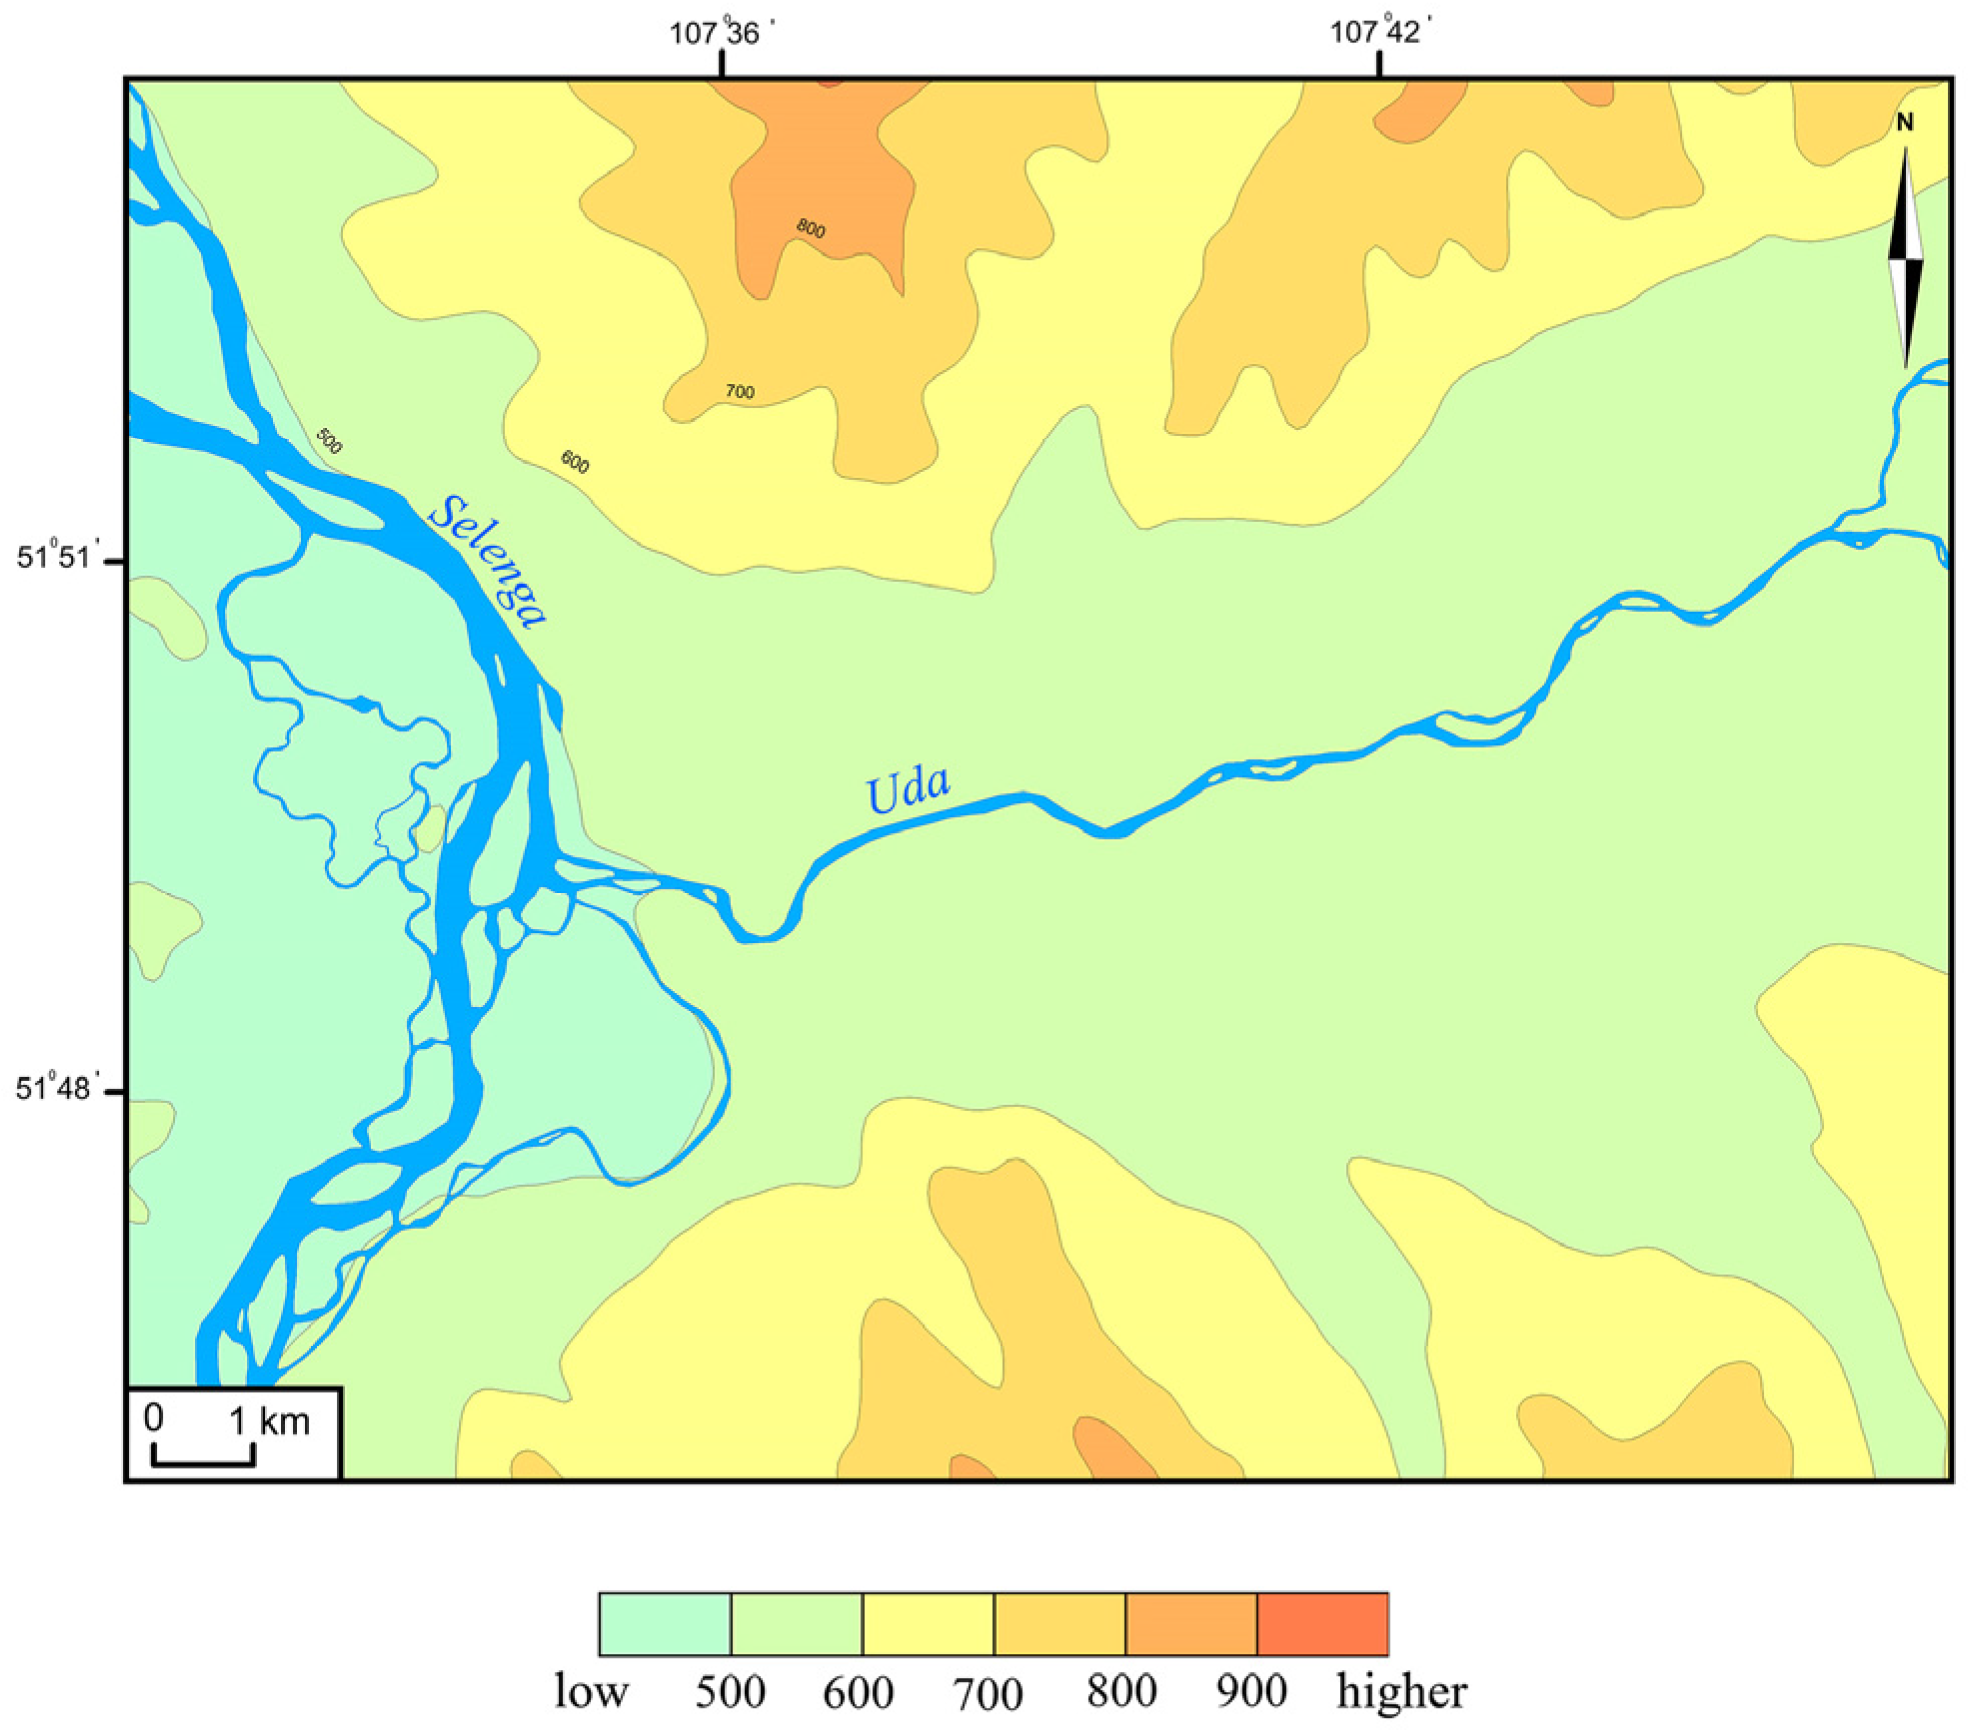
Ulan-Ude city is situated at the confluence of the rivers Selenga and Uda on the bottom of the Ivolgino-Udinskaya intermountain hollow (Figure 1). The hollow is a flat terraced surface extended in the latitudinal direction. The maximum difference in the relative elevations of terrain points in the study territory exceeds 400 m (Figure 2). The climate in Ulan-Ude city is characterized by long, cold winters lasting from November to March and short hot summers lasting from June to August. Most of the precipitation falls during the period of positive air temperatures. The mean winter air temperatures are about −15 to −25 degrees Celsius (°C), and the mean summer air temperatures are about 20 °C to 25 °C. In summer, the wind is most often from the south, whereas in winter, the wind is most often from the west.
Ulan-Ude is an administrative center of the Buryatia Republic, a federal subject of the Russian Federation and home to almost 500,000 people. There are numerous small anthropogenic sources, such as vehicle emissions, oil-fired and coal-fired residential heating boilers, wood stoves, cement and asphalt plants, woodworking plants, etc., located in Ulan-Ude city. Large industrial emission sources such as oil tank farms, metalworking plants, central heating boilers, food processing plants, etc., are also located in Ulan-Ude.

2.2. Digital Mapping

To identify the HSAs and CSAs, digital mapping techniques were used. All the techniques were based on the digital elevation model (DEM) of the study territory that represents the bare-Earth surface. The DEM was generated from advanced land observing satellite (ALOS) data with a 30 m horizontal resolution (ALOS World 3D-30 m (AW3D30) dataset). To create the DEM, the SAGA GIS software [31] was used. After generating the DEM model, the incorrect elevation values were filtered using Simple Filter and Fill Sinks tools. To minimize the remaining elevation errors, the DEM of the study area was converted into a WGS 84 UTM Zone 48N projection. On the base of the corrected DEM, a map of the spatial distribution of the topographic wetness index (TWI) [25,32] values was created. The TWI values were calculated using SAGA GIS according to the formula:
TWI = ln (α/tan β),
where α is the upslope contributing area per unit contour length (m) and β is the local surface topographic slope.
The obtained TWI map was generalized to filter excessive information: polygons with an area of less than 0.05 km2 were combined with large nearby polygons, and single unreadable polygons were deleted. After that, the obtained vector TWI image was transformed into a linear one and was smoothed using the Smooth tool in QGIS software. The DEM map was also used to compute the map of the flow accumulation (FA). The flow accumulation map represents the directions and the magnitude of water flows in the watershed. The flow accumulation was calculated as the accumulated weight of all the cells flowing into each downslope cell in the output raster. Cells with high FA values represented stream channels, lakes and wetlands. Cells with low FA values represented mountain tops. To analyze the data on the spatial distribution of pollution sources in the study area, the map of industrial zones (IZ) was generated on the base of the DEM. The open data on the industry of the Republic of Buryatia, topographic maps and Sentinel-2 satellite synthetic images [33] were used as reference materials for generating the IZ map. The obtained TWI, FA and IZ maps were then used to identify the HSAs and CSAs.

2.3. Soil Sampling and Chemical Determinations

To determine the levels of soil pollution in the city as whole and in particular in CSAs, fieldwork has been conducted. To assess the pollution level of Ulan-Ude soils and to check the correctness of the CSA identification, the topsoil was sampled from the depth 0–10 cm. Seventy three soil samples were collected in total, including those collected in CSAs. In soil samples, the concentrations of polycyclic aromatic hydrocarbons (PAHs) and trace metals (TM) were determined. Samples were air-dried at room temperature. After that, the moisture content in air-dry samples was evaluated, and the moisture correction factor was calculated to express the measurement results on an air-dry weight basis.
In this study, the literature data on the PAH [34] and TM [30] composition of riverine sediment samples collected in Selenga River within Ulan-Ude city were also used. Sediments in both studies were collected from the deep, central parts of river using a dredge. The upper part (0–10) of the sediment samples was used for chemical analyses.

2.3.1. Polycyclic Aromatic Hydrocarbons

The PAHs were extracted from dry samples with hexane, and the extracts were filtered through 0.45-µm Advantec (Tokyo, Japan) membrane filters. The samples were concentrated using a rotary evaporator and were adjusted to a volume of 0.1–0.2 mL. Sixteen PAHs were analyzed, including naphthalene (NAP), acenaphtene (ACE), fluorene (FLU), phenanthrene (PHE), anthracene (ANT), fluoranthene (FLA), pyrene (PYR), benzo[a]anthracene (BaA), chrysene (CHR), benzo[b]fluoranthene (BbF), benzo[k]fluoranthene (BkF), benzo[a]pyrene (BaP), benzo[e]pyrene (BeP), perylene (PER), benzo[g,h,i]perylene (BghiP) and indeno [1,2,3-c,d]pyrene (IcdP). The samples before extraction were spiked with PAH standard solutions.
The samples were analyzed using an Agilent GC/MSD system equipped with a DB-5 MS column. GC/MSD was calibrated prior to analysis to control the linearity of the responses. The selected ion monitoring mode was used for the maximum sensitivity of MSD. PAHs were identified on the base of the retention times of ion peaks. The quantification of the identified PAHs was based on an internal standard method. The precision and the accuracy were good enough and ranged from 2% to 15%. The chemical determination of PAHs is described in more detail in Semenov et al., 2017 [35].
As mentioned above, literature data on the PAH composition of riverine bottom sediment samples collected in Selenga River [34] were used in this study. The procedures of sediment samples treatment and PAH extraction used by Batoev et al. were identical to those used in the present study. Unlike the present study, the Hewlett Packard HP 5890 gas chromatograph equipped with the HP 5971 mass spectrometer was used for PAH analysis with the riverine sediments [34].

2.3.2. Trace Metals

Air-dry soil samples were sieved through a 0.25 mm sieve and then grinded to approximately 0.15 mm using agate mortar and pestle. After grinding, soil samples (0.1 g) were placed in Teflon vessels. After that, seven milliliters of concentrated HNO3, 2 mL of concentrated HCl and 1 mL of concentrated HF were added to each vessel [36]. The digestion vessels were heated in the microwave oven according to the selected digestion procedure. The digestate was diluted after digestion with deionized water before analysis.
The concentrations of Al, Si, Ba, V, Ti, Cr, Mn, Fe, Ni, Cu, Zn, Sr and Pb in digestate were measured using an Agilent 7500 ICP-MS. The samples were spiked with internal standard solutions. The ICP-MS was calibrated prior to analysis to control the linearity of the responses. The multielement standard solutions were used for calibration. The detection limits (DL) varied from 0.03 to 0.2 µg/L, depending on the element measured. The precision and the accuracy ranged from 2 to 13%. The chemical determination of the trace metals is described in more detail in Semenov et al., 2020 [37].
The procedure of the samples’ pretreatment for TM analysis in bottom sediments used by Kasimov et al. [30] was identical to that used in present study. Unlike the present study, the Perkin Elmer Sciex ELAN 6100 inductively coupled plasma mass spectrometer was used to measure trace metals in sediments [30].

2.4. Chemical Data Processing

To prevent HSAs from becoming CSAs, the emission sources should be identified and the source contributions to soil pollution should be evaluated. The source apportionment was performed using the positive matrix factorization (PMF) model (EPA PMF 5 software package) based on the data on soil chemistry. PMF decomposes the initial data matrix into a source profiles matrix and a source contributions matrix [38]:
X = G · F + E,
where X is the matrix of the input data, G is a matrix of the source contributions, F is a matrix of the source profiles, and E is the matrix of residuals.
The relationship between the species concentrations in soil and source emissions may also be expressed in index form:
  χ i j = k = 1 p g i k f k j + e i j   ,
where Xij is the concentration of species j in sample i, p is the number of factors contributing to the samples, fkj is the concentration of species j in factor profile k, gik is the contribution of factor k to sample i and eij is the error of the PMF model for the species j measured in sample i.
The PMF reduces the squared standardized residuals (Q). The lower the Q, the smaller the difference between the measured and calculated species concentrations. The uncertainty of the measured data was also used as input data for the PMF. The uncertainty associated with chemical determinations was calculated by adding the one-third of DL to the measurement error [39]. The calculated uncertainty was then increased by 10% to take into account the sample treatment errors [40]. Two to ten factors were run to identify the sources. The final number of factors was decided on the base of their physical interpretability [41] because there are no rules to determine the number of factors that should be retained, and there is no possibility to compare the PMF-derived source profiles with the compositions of real source emissions. To sharpen the results of the PMF analysis, the program parameter called Fpeak was used. Fpeak controls the rotation in PMF by adding and/or subtracting the rows and columns of the F and G matrices from each other.
The PAH and TM datasets were analyzed independently, as the sources of organic and inorganic pollutants were expected to be different.

3. Results and Discussion

3.1. Identification of HSAs and CSAs Using Digital Mapping Techniques

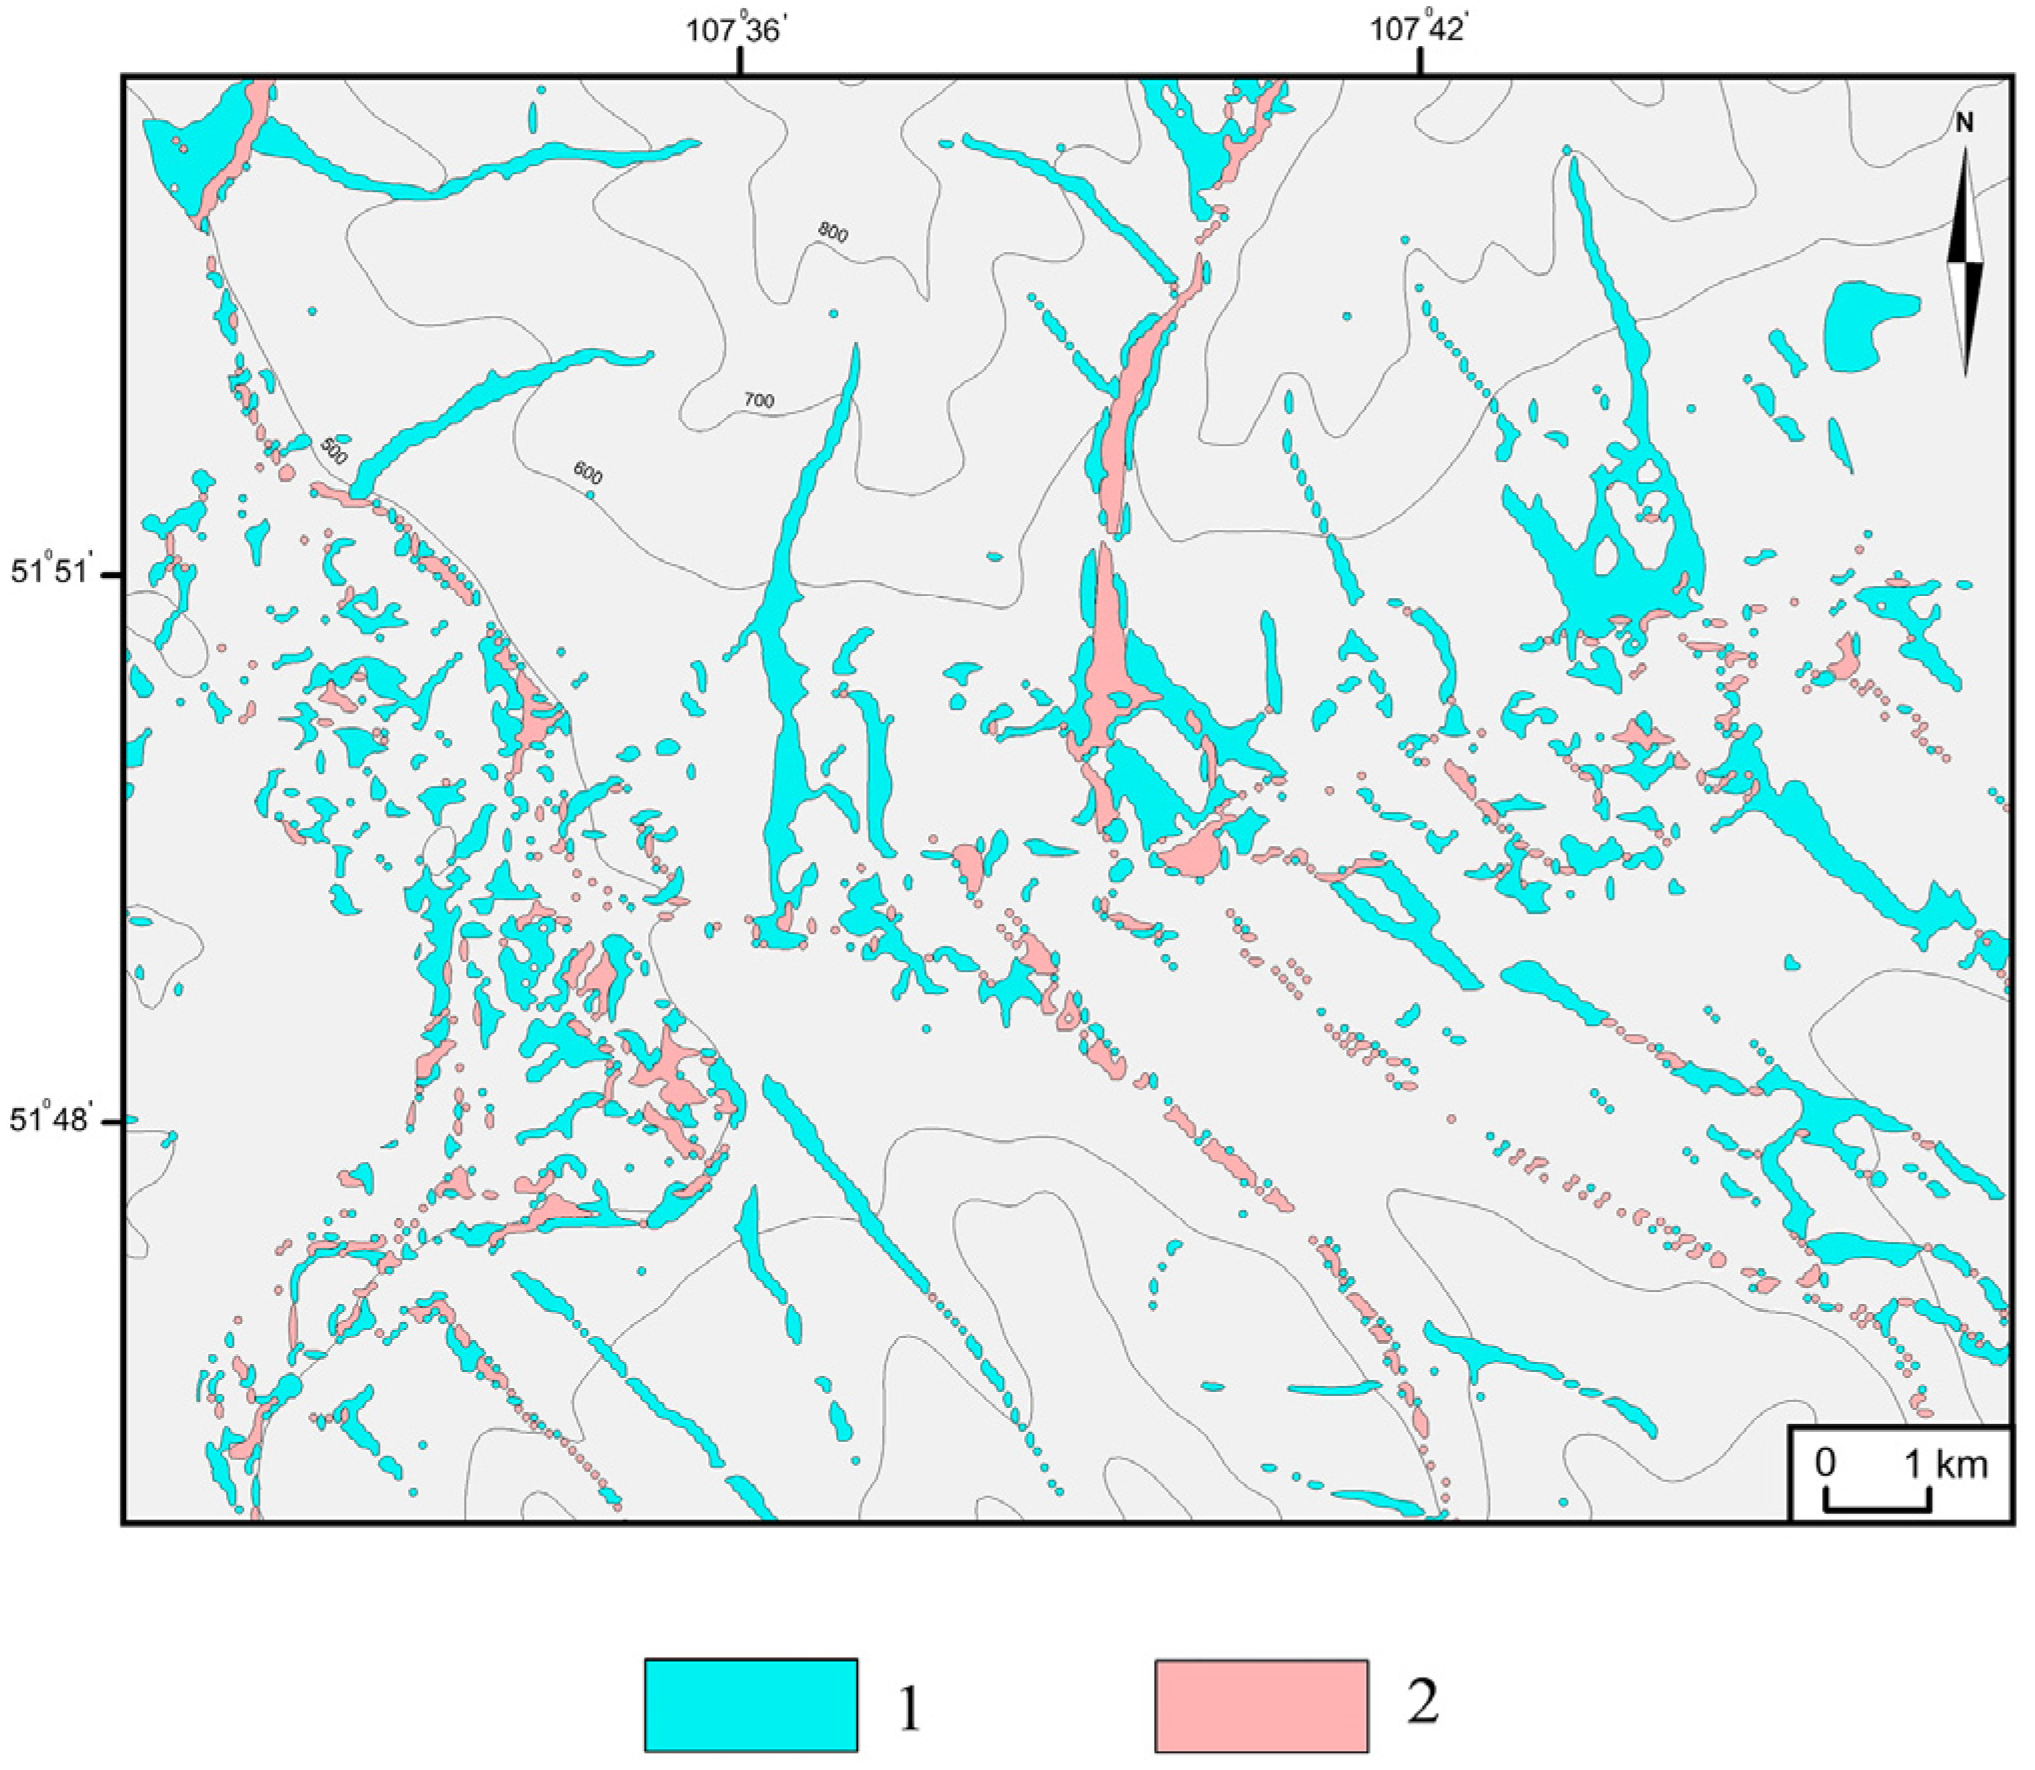
Hydrologically sensitive areas can be mapped as areas in a landscape with a topographic index (TI) greater than a threshold level [42]. In the study region, the TWI changed from 0 to 30. Areas with TWI values less than 12 were removed from the maps because they coincided with the upper parts of hillslopes. Areas with TWI values greater than 18 were also removed because they coincided with river channels and temporary water streams. Thus, the identified HSAs were characterized by TWI values that ranged from 12 to 18 (Figure 3).
The HSAs with TWI values in the range 15–18 represent mostly the areas of infiltration excess runoff generation because they are situated high above the base level of erosion (in the valleys of tributaries of the Uda and Selenga Rivers). The low infiltration capacity of soils in such areas is conditioned by low solum thickness. The HSAs with TWI values in the range 12–15 represent mostly the areas of saturation excess overland flow generation because they are located mostly in the wide intermountain hollows such as the Uda and Selenga River valleys. In such areas, soils are deep; however, the groundwater level is near the soil surface, and thus the soils are saturated with water.
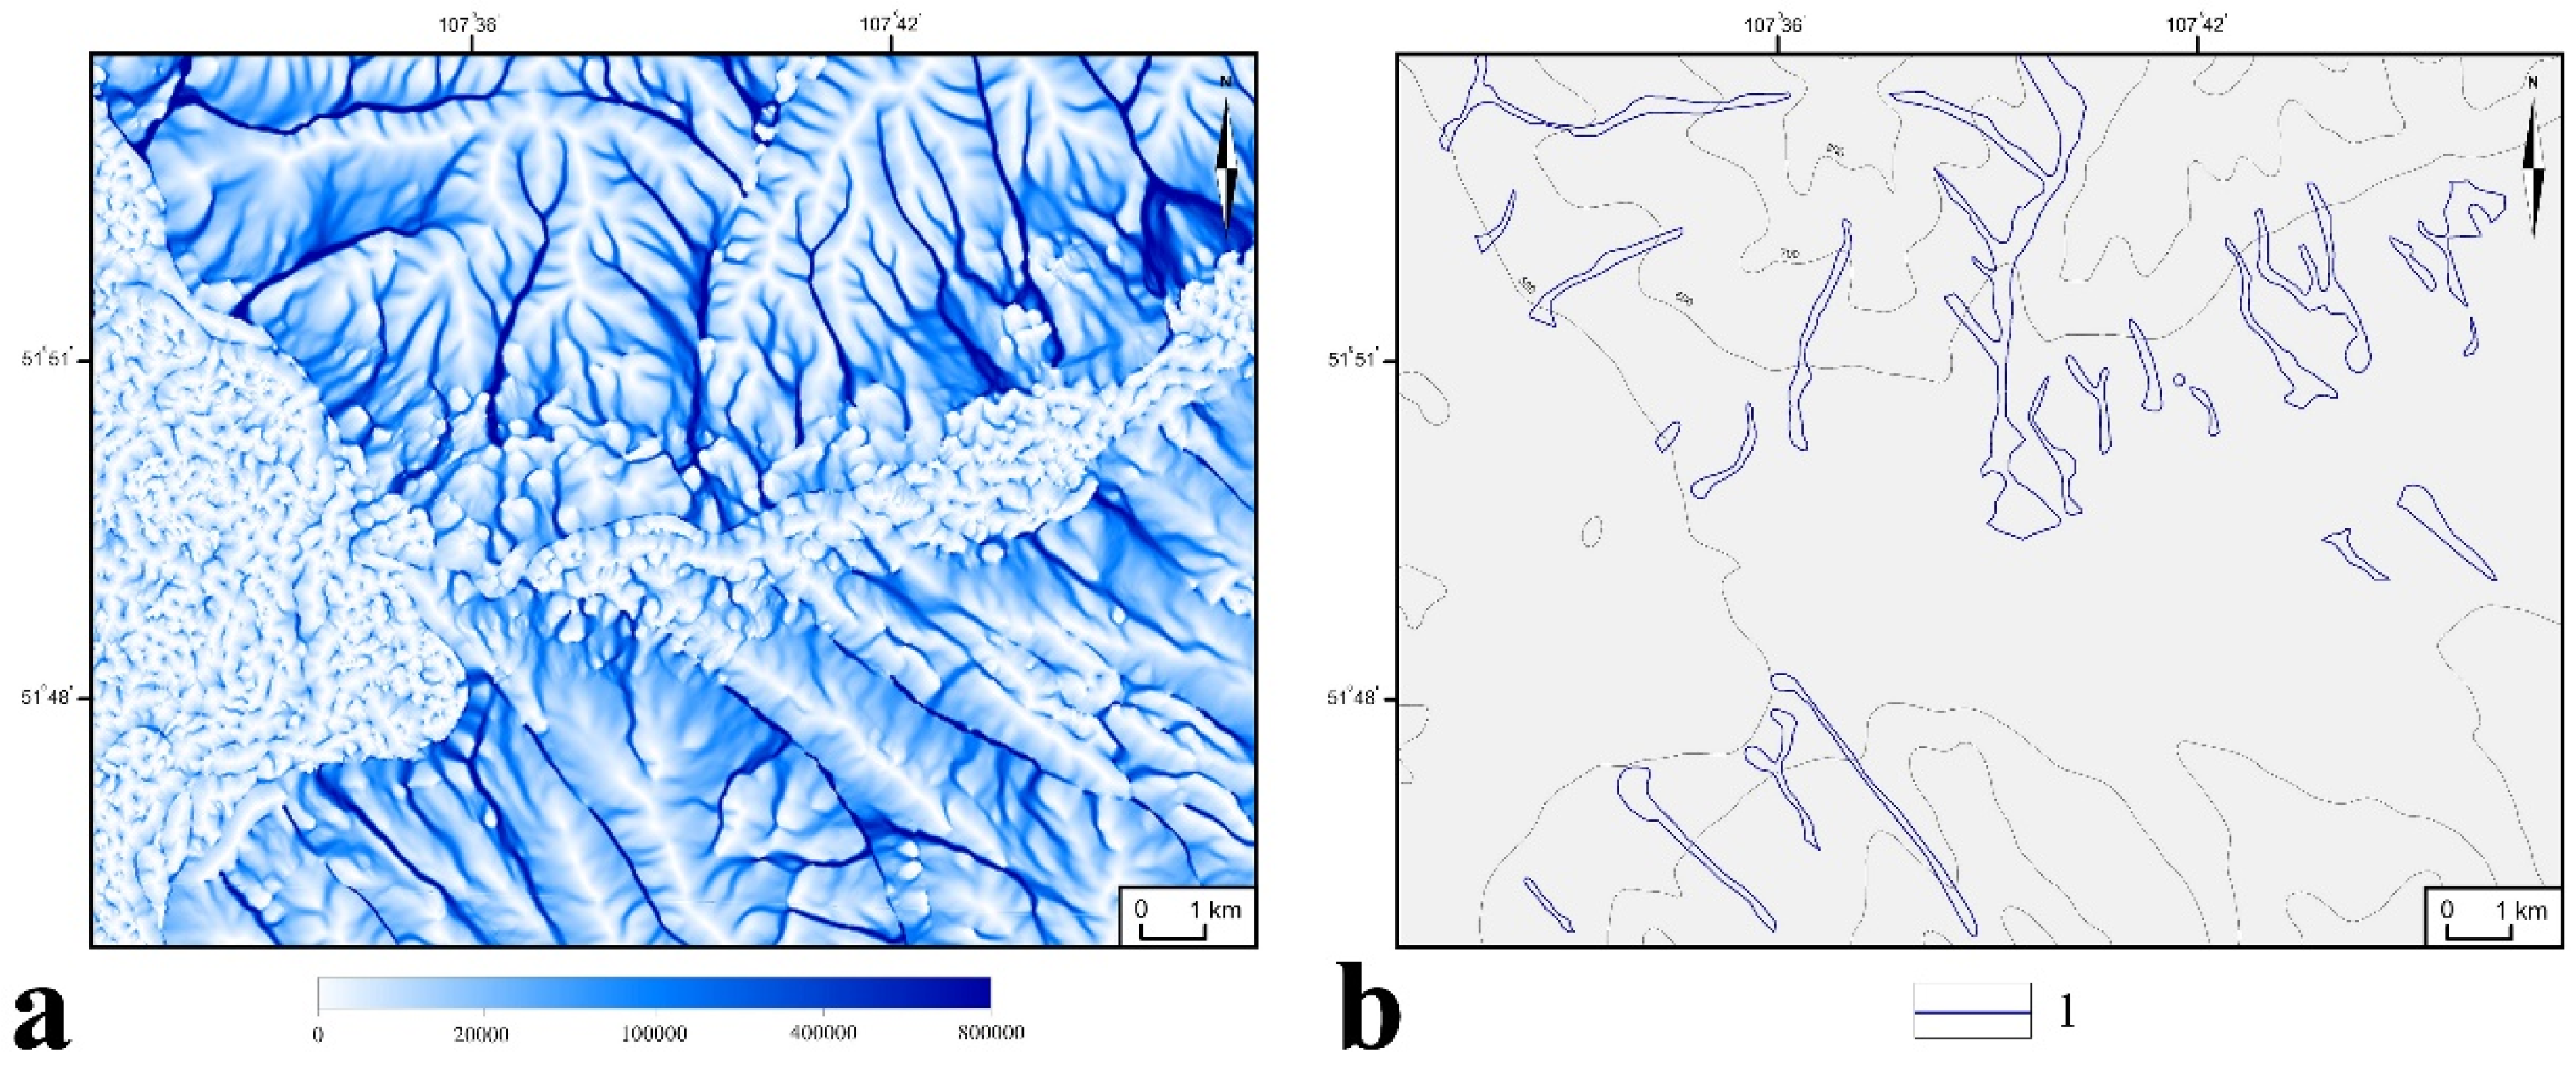
Some HSAs characterized by low TWI values may be closed depressions located away from the dominant water flow direction. To remove the false HSAs located away from zones of runoff generation and maximum soil saturation, the SAGA GIS tool called flow accumulation (FA) was used [25,43]. The flow accumulation value (Figure 4a) represents the amount of upstream area (in number of cells) draining into each cell. The higher the FA value, the larger area of land drains rainfall (or snowmelt) into the stream, the higher the soil saturation with water and, finally, the higher the water discharge of a stream during the storm event. To adjust the HSA boundaries according to the spatial FA distribution data, the areas characterized by the highest FA values were delineated (Figure 4b).
After that, the map of the highest flow accumulation areas (Figure 4b) and the map of the HSAs (Figure 3) were superimposed on each other. The parts of the previously delineated HSAs that were bounded by the areas characterized by the highest FA values were than considered as adjusted HSAs (Figure 5).
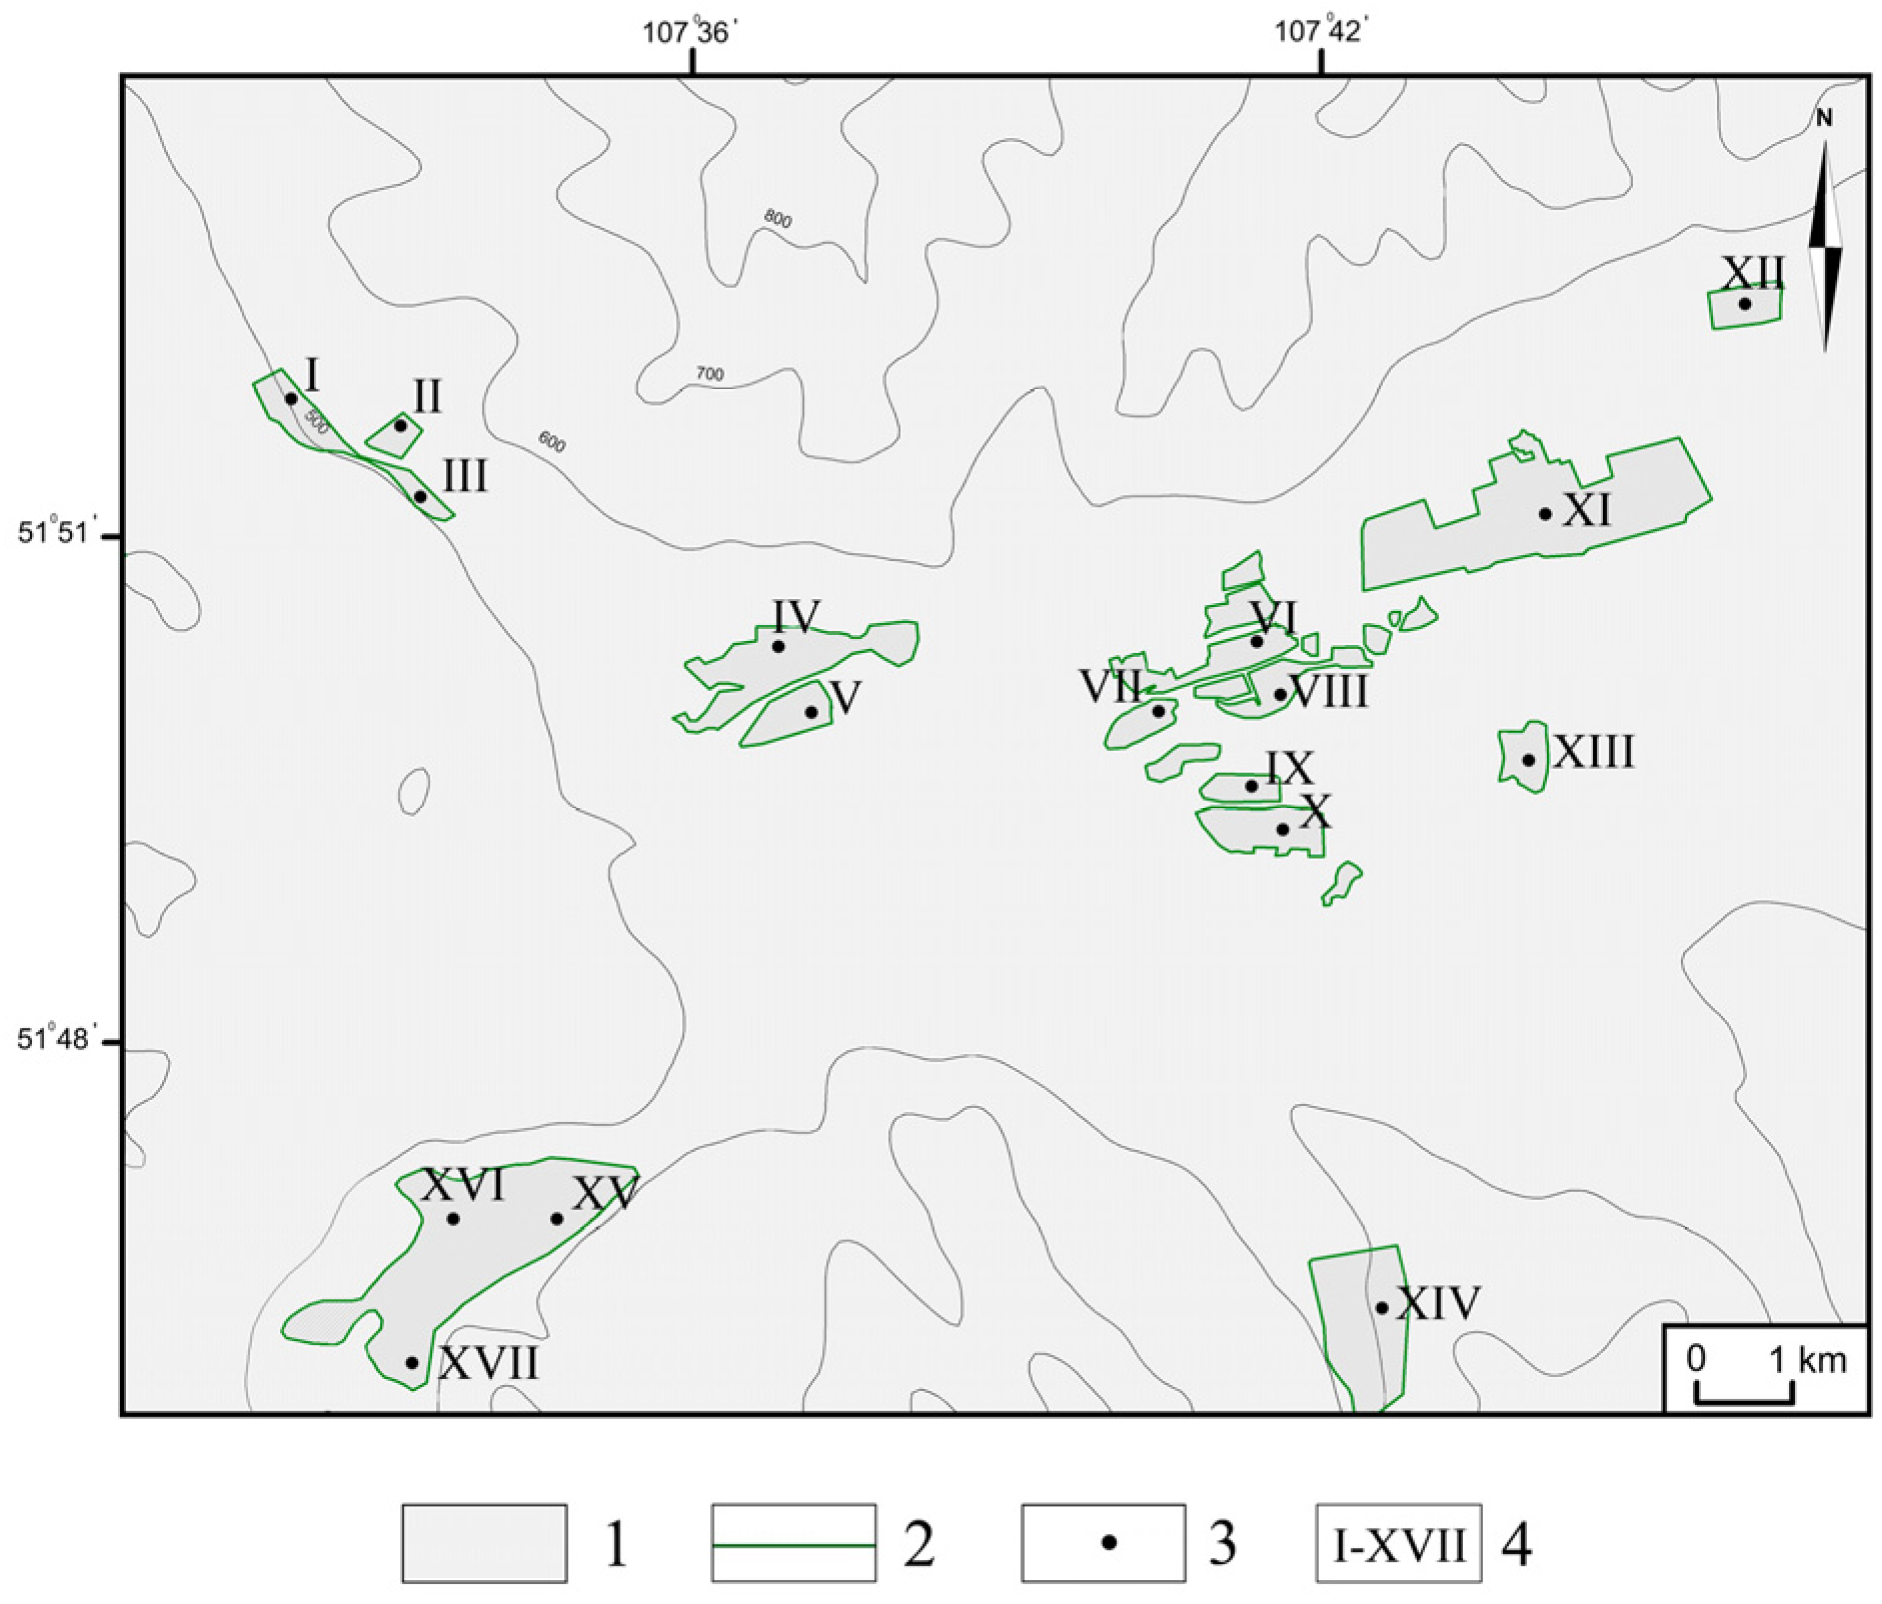
Since the CSA is an area where pollutant loading coincides with an HSA [17], to identify CSAs, the industrial and municipal enterprises located in the study territory were mapped (Figure 6).
The obtained industry map was superimposed onto the map of the adjusted HSAs. The parts of the adjusted HSAs that were bounded by the borders of industrial and municipal enterprises were than considered as CSAs (Figure 7).
As a result, eleven CSAs were identified in Ulan-Ude city. Three CSAs (Nos. 1, 10, 11) located close to the Selenga River and four CSAs (Nos. 3, 4, 7, 8) located close to the Uda River may cause surface water pollution.

3.2. Assessing the Level of Soil Pollution in Identified CSAs

3.2.1. Polycyclic Aromatic Hydrocarbons

The average concentrations of PAHs measured in CSA soils (Table 1) were close to those obtained earlier for Ulan-Ude soils and ten times higher than PAH concentrations in background soils [27]. It was found that identified CSAs were characterized by distinctly different levels of PAH pollution. Different levels of pollution were probably due to the fact that not all enterprises situated in Ulan-Ude city emit PAHs. Moreover, enterprises that emit PAHs are characterized by different operating modes and different capacities that result in different PAH emission rates. The highest pollution level was observed for CSAs 2 and 9. The main pollution source located in CSA 2 was operating a coal-fired central heating boiler, whereas the most probable pollution source in CSA 9 was the brick plant that had not been in operation for several years. The lowest pollution level was observed for CSAs 3, 4, 5 and 6. That was due to the fact that the enterprises situated in these areas such as the reinforced concrete plant (CSAs No. 3 and No. 4), bridge structures plant (CSA No. 5) and metal structures plant (CSA No. 6) are characterized by a low intensity of production or do not work periodically. Furthermore, the above-mentioned enterprises use electricity to carry out production processes. The low pollution level was also characteristic for CSA 11, which is situated to the windward of the aircraft plant. An intermediate pollution level was characteristic of CSAs 7, 8 and 10. The enterprises situated in these areas such as the aircraft plant (CSAs No. 7 and No. 8) and warehousing facility (CSA No. 10) use electricity to carry out production processes; however, fossil fuels are also burned at those enterprises for some production purposes.
It was found that concentration of particular PAH in the topsoil of CSAs was proportional to solubility of that PAH in water. That was strange because highly soluble PAHs should have been leached out from the soils into the surface water [35]. The highest concentrations and lowest STD values were characteristic for low molecular weight (LMW) PAHs such as FLA and PYR (Table 1 and Table 2), whereas the lowest concentrations and highest STD values were characteristic for high molecular weight (HMW) PAHs such as IcdP and BghiP. The low variability of the concentrations of the LMW PAHs suggested that they originated from some diffuse source, and the high variability of the HMW PAHs suggested that they originated from local point sources.

3.2.2. Trace Metals

In contrast to PAHs, the levels of soil pollution by TMs varied insignificantly (Table 3). The concentrations of the total TMs observed in the soil sampled in the heavily polluted CSAs 2 and 9 were about 500 mg/kg, whereas the concentration of the total TMs in the soil sampled in slightly polluted CSA 8 was equal to 200 mg/kg.
For comparison, the highest PAH concentration in soil exceeded by up to forty times the lowest PAH concentration (Table 2). The little difference in the maximum and minimum TM concentrations in the soil was probably due to the high concentrations of specified metals in native preindustrial soils. The total TM concentrations in the soils of the CSAs 1, 3, 4, 5, 6, 7, 10 and 11 were close to the average values obtained earlier for the Ulan-Ude soils [29]. The average pollution level of the TMs in the soils of all the CSAs was approximately three to five times higher than the background level of the TMs in soils [29].
The variability of concentrations of individual metals in the soil assessed on the basis of STD values was also much lower than the variability of the concentrations of individual PAHs. The highest concentrations and lowest STD values (Table 3 and Table 4) were characteristic for Zn, V, Cr, Ni and Pb, whereas the lowest concentrations and highest STD values were characteristic for Hg and Bi. The metals characterized by a high variability of concentrations probably came from multiple sources whereas the elements characterized by low STD values came from a single source.

3.3. Source Apportionment of Soil Pollutants in Identified CSAs

3.3.1. Polycyclic Aromatic Hydrocarbons

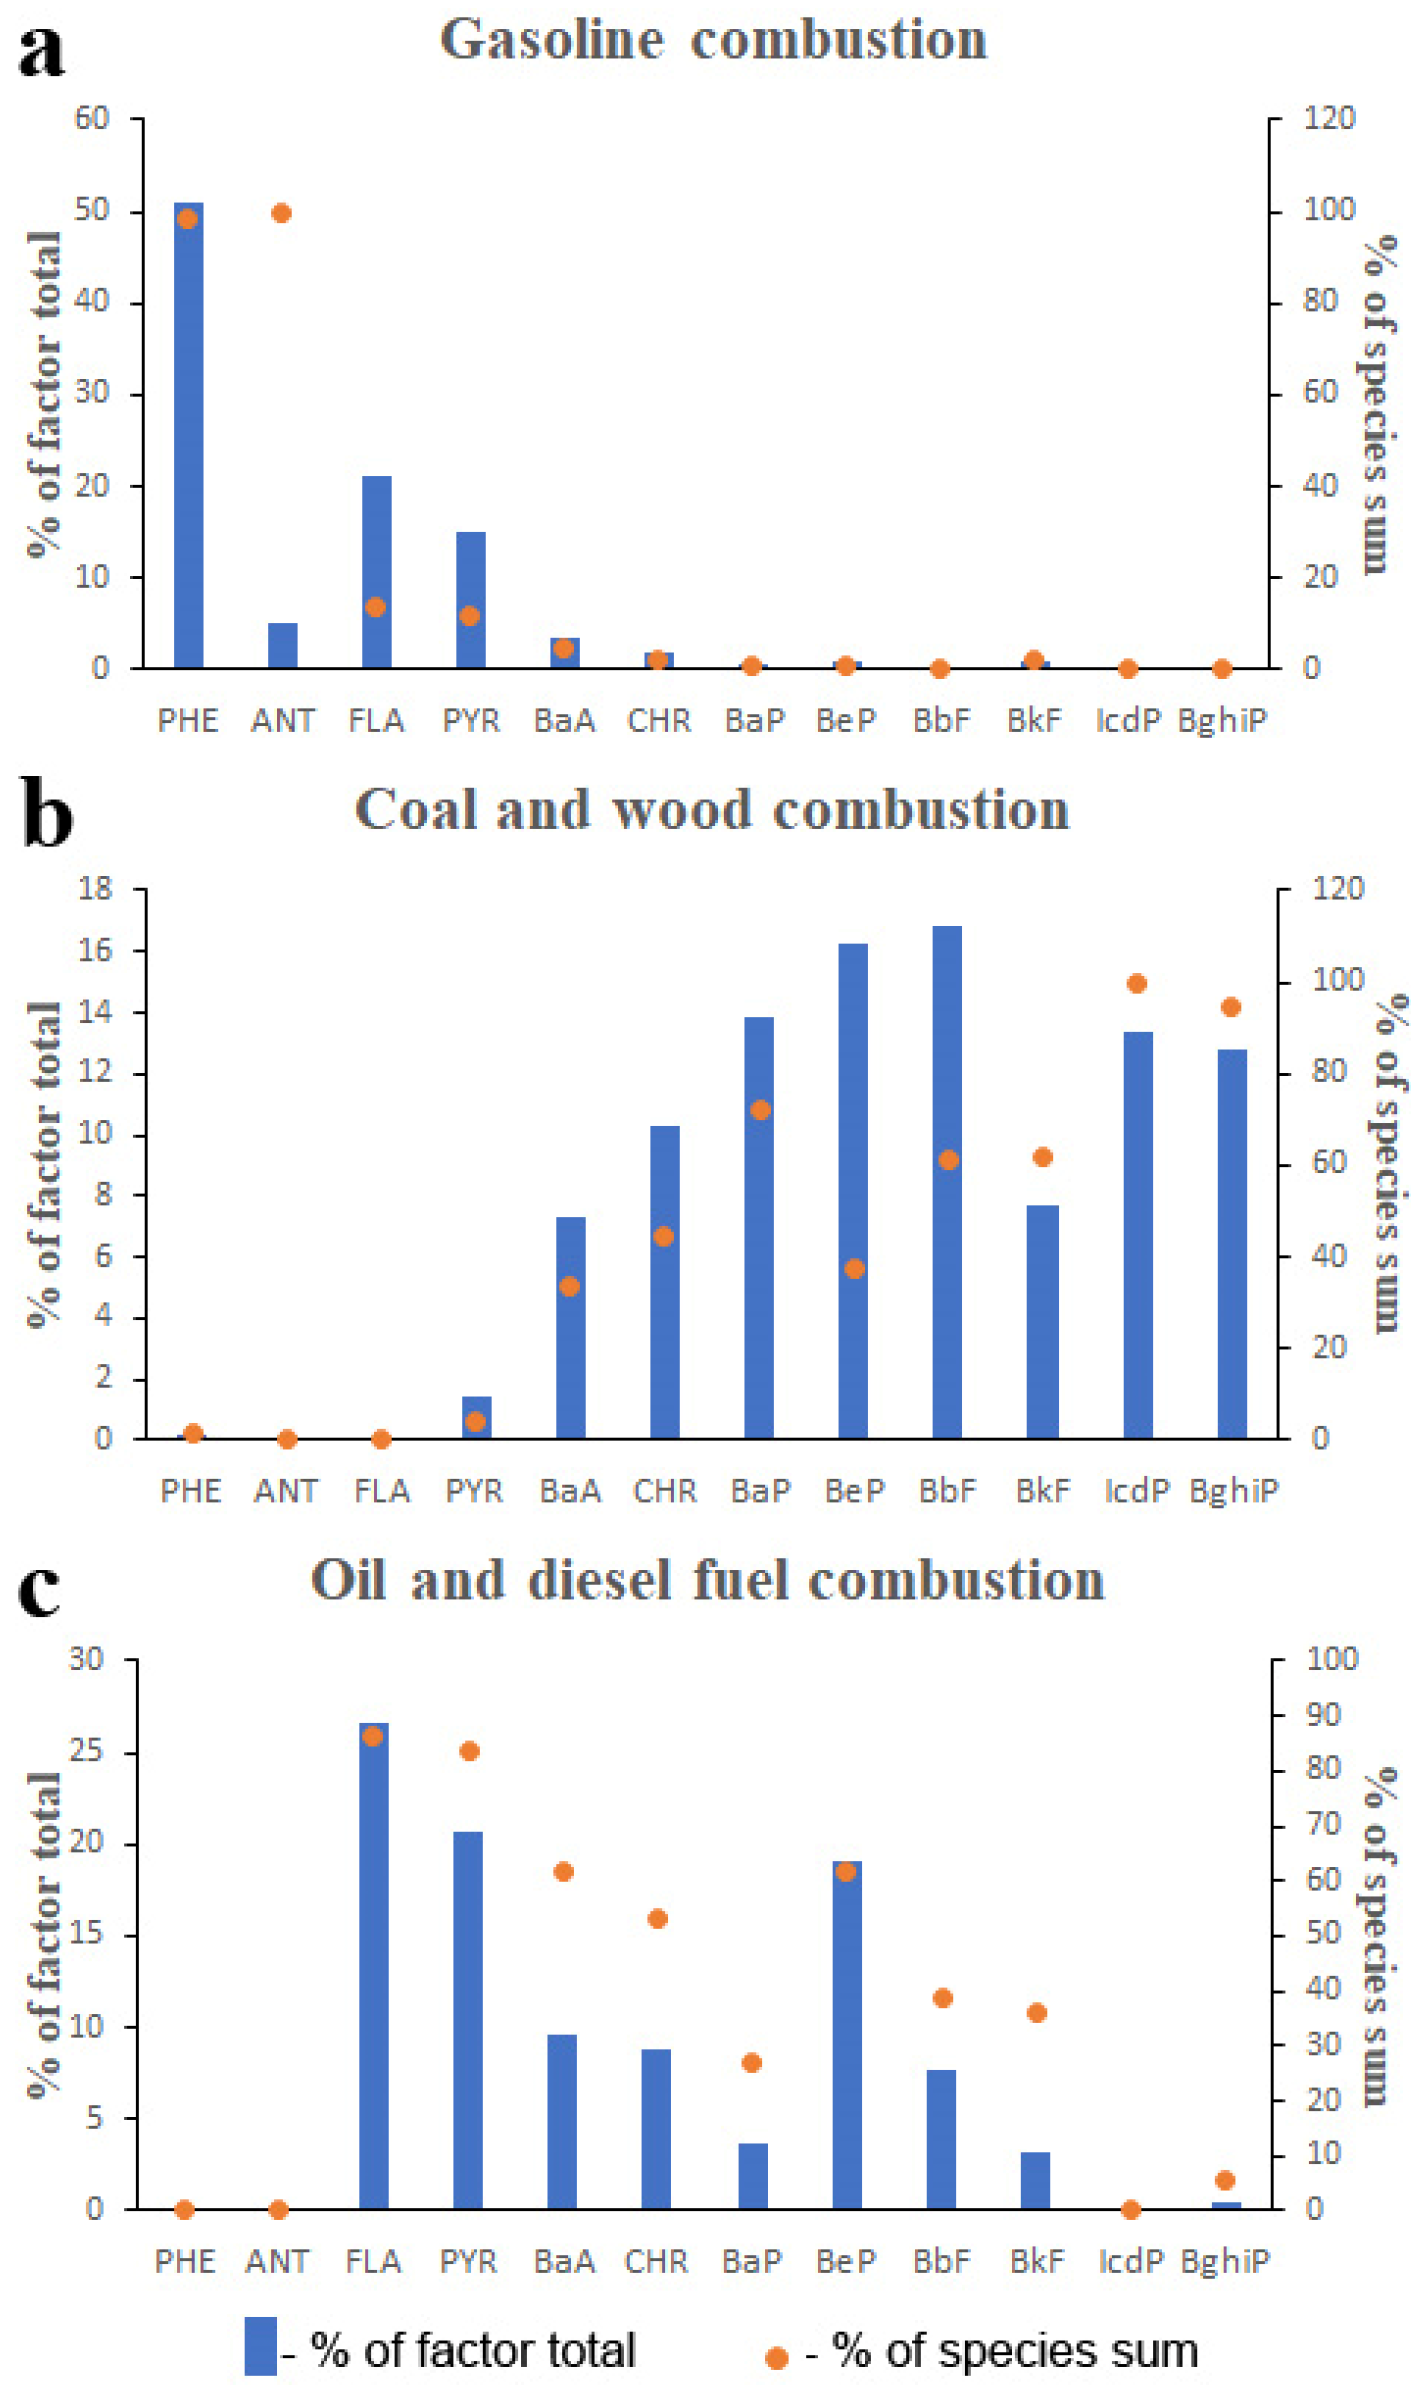
To identify PAH sources, the data on the PAH composition of soil were processed with the PMF model. The rotated (Fpeak = 0.5) three-factor solution was the most interpretable result obtained for PAH sources in the soil. Those factors contributed 45%, 28% and 27% of the PAHs to the soil (Figure 8).
Factor 1 (Figure 8a) was characterized by the high concentration of phenanthrene. The factor’s contributions to concentrations of PHE and ANT were equal to 50% and 50%, respectively. The predominance of low-molecular weight (LMW) PAHs such as PHE, ANT, FLA and PYR is typical for emissions of gasoline engines [44,45]; thus, it was supposed that Factor 1 represented gasoline combustion.
Factor 2 (Figure 8b) was characterized by the absolute prevalence of high-molecular weight (HMW) PAHs (BaA, CHR, BbF, BkF, BaP, BeP, IcdP and BghiP) over LMW PAHs that probably indicated the burning of some solid fuels. The contribution of Factor 2 to concentrations of HMW PAHs was also high enough: factor contributions to IcdP and BghiP were close to 100%; factor contributions to BaP, BbF and BkF were higher than 50%; and the factor contribution to BaA, CHR and BeP were about 40% of the species sum. Taking into account the fact that abnormally high concentrations of IcdP and BghiP were observed besides the operational coal-fired heating boiler (CSA No. 2) and nonoperational brick kiln (CSA No. 9) that used coal as the fuel, Factor 2 was supposed to represent coal combustion. Since the products of wood combustion are also characterized by a high portion of HMW PAHs [34,43], Factor 2 was finally identified as coal and wood combustion.
The PAH composition of Factor 3 (Figure 8c) was somewhere between compositions of Factor 1 and Factor 2. Factor 3 was characterized by the prevalence of LMW PAHs over HMW PAHs; however, unlike Factor 1, the most lightweight PAHs such as PHE and ANT were absent in Factor’s 3 profile. Unlike Factor 2, Factor 3 was also characterized by the absence of heavyweight PAHs such as IcdP and BhgiP. Thus, Factor 3 was attributed to the combustion of liquid fossil fuels, such as oil and diesel fuel.
The highest contributions of gasoline combustion (Factor 1) to the PAH composition of soil were observed for CSAs 3, 10 and 11 (Table 5).
That seems puzzling because only CSA 3 located near the traffic interchange must be highly affected by vehicle exhaust emissions. Probably the high contributions of gasoline combustion to soils of CSAs 10 and 11 were due to the high activity of trucks transporting building materials from the silicate building materials plant (Figure 6). The highest contributions of coal and wood combustion (Factor 2) were observed for CSAs 2, 4, 6 and 10. That seems quite probable because all the industrial objects located in these areas have coal-fired heating boilers on their territories. Nevertheless, the contributions of coal combustion in these areas seem underestimated. This is especially true for CSA 2. The highest contributions of oil and diesel fuel combustion (Factor 3) to soil PAHs were observed for CSAs 1, 5, 7 and 9. There is no doubt that Factor 3’s contribution to the PAHs in the soil of a tank farm (CSA 1) must be high; however, Factor 3’s contributions to PAHs in the soils of CSAs 5, 7 and 9 seem overestimated.

3.3.2. Trace Metals

The two-factor PMF solution was obtained for TM sources in Ulan-Ude soils. The solution was stable (Qtrue/Qexpected = 1.2) and the factor mass fractions did not change with a varying Fpeak. The obtained factors contributed 46% and 54% of the trace metals to the soil.
Factor 1 (Figure 9a) was characterized by the high concentration of Zn, Pb and Cu and by the extremely high contribution to Hg and Pb concentrations (up to 100%) in CSA soils. This factor was attributed to nonexhaust traffic emissions because particulate matter enriched with Zn, Cu and Pb is probably the result of friction, releasing the material of the friction surfaces such as brake pads and brake discs to the atmosphere [46,47,48]. The abrasion of wheel weights may also contribute to the nonexhaust traffic emissions of Pb [49,50].
Factor 2 (Figure 9b) was characterized by the high concentration of V, Cr, Ni and Zn and by extremely high contributions to concentrations of V, Cr, Co and Ni in soils. Since the chemical compositions of mineral soil and parent materials were not studied, it is quite probable that these elements were inherited from preindustrial soil conditions. However, those elements may have also originated from fossil fuel combustion. It is known that V is the one of the major constituents of oil ash [51,52] and coal ash [53,54,55]. Chromium is also present in significant amounts in coal ash [56,57]. The Ni and Zn may originate from both fossil fuel combustion and industrial emissions.
The highest contributions of Factor 1 to the TM composition of soil were observed for CSAs 2, 8 and 10 (Table 6). The contributions of nonexhaust traffic emission to PAHs in the soil in those areas seem overestimated because only CSA 2 is located close to high-traffic thoroughfares. Taking into account the presence of coal-fired central heating boilers in this area, the closeness of CSA 2 to traffic thoroughfares still cannot provide the predominance of the contribution of traffic emissions over the contribution of fossil fuel combustion. The lowest contributions of Factor 1 to the TM composition of the soil were observed for CSAs 5 and 11. That was probably due to the high contribution of coal-fired heating boilers located in these areas.
The highest contributions of Factor 2 to the TM composition of soil were observed for CSAs 5 and 11. The high contributions of fossil fuel combustion in these areas were conditioned by the presence of coal-fired heating boilers. In this connection, the low contribution of fossil fuel combustion to PAHs in the soils of CSAs 2 and 9 seems incomprehensible.

3.4. Revealing the Link between Pollution of Soils and Aquatic Environment

3.4.1. Polycyclic Aromatic Hydrocarbons

It is known that bottom sediments consist of soil particles that have been transported by water from the sites of their origin in a terrestrial environment and have been deposited on the stream bed. Therefore, to reveal the sources of Selenga River pollution, the PAH composition of Selenga bottom sediments (Figure 10a) was compared to that of studied soils (Figure 10b). The literature data on the PAH composition of two sediment samples collected in Selenga River upstream of Ulan-Ude city and two sediment samples collected downstream of Ulan-Ude city [34] were used for analysis. It was observed that the PAH composition of the bottom sediments is distinctly different from that of soils. The LMW PAHs in the sediments absolutely dominated over the HMW PAHs, whereas in the soil, HMW PAHs dominated over LMW PAHs. There are two possible causes of this difference. Perhaps the reason is that the main source of water pollution by PAHs is gasoline combustion [34,43]. Gasoline combustion products are characterized by a high proportion of water-soluble PAHs such as PHE and FLA. However, the most probable reason for the high proportion of LMW PAHs in the sediments is fractionation of PAHs during the water (lateral and vertical) movement through the soil [35]. The most insoluble HMW PAHs remain in soil, whereas the soluble PAHs are leached from the soil to the river and accumulate in bottom sediments. Thus, HMW-rich soil particulate matter delivered to the river by surface flow is enriched by LMW PAHs dissolved in riverine water.
It was also found that the concentrations of most of the PAHs in the sediments downstream of the city were higher than in the sediments upstream of the city. This fact indicates the anthropogenic pollution of riverine ecosystems by PAHs.

3.4.2. Trace Metals

As in the case of PAHs to reveal the sources of Selenga River pollution, the TM composition of Selenga bottom sediments (Figure 11a) derived from the literature [29] was compared to that of the studied soils (Figure 11b). As is clear from the figures, the TM compositions of the soils and bottom sediments are similar. The identical TM composition of soils and sediments probably means that the TMs in soil and sediment particles are embedded within water-insoluble compounds that do not undergo any changes neither in soil nor in sediments. The TM compositions of soils and bottom sediments are also similar to that of fossil fuel combustion residues [9,58]. That probably means that a significant proportion of the TMs in soil and sediments is of anthropogenic origin. The fact that the concentrations of most of the TMs in sediments downstream of the city are higher than those in sediments upstream of the city also speaks in favor of the anthropogenic origin of the TMs in sediments. However, the TM compositions of sediments upstream and downstream of Ulan-Ude are similar. This may indicate either the natural origin of the TMs upstream and downstream of the city, or (which is more likely) the same pollution source such as fossil fuel combustion in both locations.

4. Conclusions

This study was the first attempt to combine the critical source areas approach and multivariate source apportionment technique to identify both primary and secondary emission sources in the Lake Baikal watershed. The main conclusions reached in this study are as follows:
  • Due to different operating modes and different production capacities of the enterprises, the soil pollution levels were highly variable among critical source areas. The average pollution level of the PAHs and TMs in the soils of CSAs was approximately two times higher than those outside the CSAs.
  • Due to high concentrations of specified metals in native preindustrial soils, the pollution levels of the PAHs and TMs in CSA soils do not correlate with each other. In contrast to PAHs that are mostly of anthropogenic origin, the trace metals are ubiquitous and may occur in high concentrations in both natural and anthropogenic soils.
  • The major sources of both PAHs and TMs in soils of critical source areas were traffic emissions and coal-fired thermal power stations.
  • Due to PAH fractionation during the water movement through the soil, the PAH composition of riverine bottom sediments is distinctly different from that of soils. The similar TM composition in soils and sediments was due to the fact that TMs in mineral particles are embedded within water-insoluble compounds that do not undergo any changes neither in soil nor in sediments.

Author Contributions

Research design, data analysis and writing, M.Y.S.; digital mapping, A.V.S.; project administration, Y.M.S. (Yuri M. Semenov 1); chemical analyses, L.A.B.; epidemiological analysis and supervision, Y.M.S. (Yuri M. Semenov 2). All authors have read and agreed to the published version of the manuscript.

Funding

This work has been supported by the grant of the Russian Science Foundation, RSF 22-27-00132.

Institutional Review Board Statement

Not applicable.

Informed Consent Statement

Not applicable.

Data Availability Statement

Data available on request from the authors.

Conflicts of Interest

The authors declare no conflict of interest.

References

  1. Peters, N.E.; Meybeck, M. Water quality degradation effects on freshwater availability: Impacts of human activities. Water Int. 2000, 25, 185–193. [Google Scholar] [CrossRef]
  2. Wan, L.; Wang, X.H.; Peirson, W. Impacts of climate change and non-point-source pollution on water quality and algal blooms in the Shoalhaven River estuary, NSW, Australia. Water 2022, 14, 1914. [Google Scholar] [CrossRef]
  3. Khodzher, T.V.; Domysheva, V.M.; Sorokovikova, L.M.; Sakirko, M.V.; Tomberg, I.V. Current chemical composition of Lake Baikal water. Inland Waters 2017, 7, 250–258. [Google Scholar] [CrossRef]
  4. Semenov, M.Y.; Semenov, Y.M.; Silaev, A.V.; Begunova, L.A. Source apportionment of inorganic solutes in surface waters of Lake Baikal watershed. Sustainability 2021, 13, 5389. [Google Scholar] [CrossRef]
  5. Kravtsova, L.S.; Izhboldina, L.A.; Khanaev, I.V.; Pomazkina, G.V.; Rodionova, E.V.; Domysheva, V.M.; Sakirko, M.V.; Tomberg, I.V.; Kostornova, T.Y.; Kravchenko, O.S.; et al. Nearshore benthic blooms of filamentous green algae in Lake Baikal. J. Great Lakes Res. 2014, 40, 441–448. [Google Scholar] [CrossRef]
  6. Timoshkin, O.A.; Moore, M.V.; Kulikova, N.N.; Tomberg, I.V.; Malnik, V.V.; Shimaraev, M.N.; Troitskaya, E.S.; Shirokaya, A.A.; Sinyukovich, V.N.; Zaitseva, E.P.; et al. Groundwater contamination by sewage causes benthic algal outbreaks in the littoral zone of Lake Baikal (East Siberia). J. Great Lakes Res. 2018, 44, 230–244. [Google Scholar] [CrossRef]
  7. Chebykin, E.P.; Sorokovikova, L.M.; Tomberg, I.V.; Rasskazov, S.V.; Khodzher, T.V.; Grachev, M.A. Current state of the Selenga River waters in the Russian territory concerning major components and trace elements. Chem. Sustain. Dev. 2012, 20, 561–580. [Google Scholar]
  8. Khazheeva, Z.I.; Plyusnin, A.M. The regime of dissolved gases and organic matter in Selenga basin rivers. Water Resour. 2013, 40, 61–73. [Google Scholar] [CrossRef]
  9. Semenov, M.Y.; Semenov, Y.M.; Silaev, A.V.; Begunova, L.A. Assessing the self-purification capacity of surface waters in Lake Baikal watershed. Water 2019, 11, 1505. [Google Scholar] [CrossRef] [Green Version]
  10. Sasakova, N.; Gregova, G.; Takacova, D.; Mojzisova, J.; Papajova, I.; Venglovsky, J.; Szaboova, T.; Kovacova, S. Pollution of surface and ground water by sources related to agricultural activities. Front. Sustain. Food Syst. 2018, 2, 42. [Google Scholar] [CrossRef] [Green Version]
  11. Pérez-Lucas, G.; Vela, N.; Aatik, A.E.; Navarro, S. Environmental risk of groundwater pollution by pesticide leaching through the soil profile. In Pesticides—Use and Misuse and Their Impact in the Environment; Larramendy, M., Soloneski, S., Eds.; Intech Open: London, UK, 2018. [Google Scholar] [CrossRef]
  12. Sweetman, A.J.; Valle, M.D.; Prevedouros, K.; Jones, K.C. The role of soil organic carbon in the global cycling of persistent organic pollutants (POPs): Interpreting and modelling field data. Chemosphere 2005, 60, 959–972. [Google Scholar] [CrossRef] [PubMed]
  13. Arnold, J.G.; Srinivasan, R.; Muttiah, R.S.; Williams, J.R. Large area hydrologic modeling and assessment part I: Model development. J. Am. Water Resour. Assoc. 1998, 34, 73–89. [Google Scholar] [CrossRef]
  14. Young, R.A.; Onstad, C.A.; Boesch, D.D.; Anderson, W.P. AGNPS—A nonpoint source pollution model for evaluating agricultural watersheds. J. Soil Water Conserv. 1989, 44, 168–173. [Google Scholar]
  15. Haith, D.A.; Shoemaker, L.L. Generalized watershed loading functions for stream-flow nutrients. Water Resour. Res. 1987, 23, 471–478. [Google Scholar] [CrossRef]
  16. Mockus, V. National Engineering Handbook, Section 4: Hydrology; US Soil Conservation Service, Department of Agriculture: Washington DC, USA, 1972; 762p. [Google Scholar]
  17. Agnew, L.J.; Lyon, S.; Gérard-Marchan, T.P.; Collins, V.B.; Lembo, A.J.; Steenhuis, T.S.; Walter, M.T. Identifying hydrologically sensitive areas: Bridging the gap between science and application. J. Environ. Manag. 2006, 78, 63–76. [Google Scholar] [CrossRef] [PubMed]
  18. Walter, M.T.; Walter, M.F.; Brooks, E.S.; Steenhuis, T.S.; Boll, J.; Weiler, K. Hydrologically sensitive areas: Variable source area hydrology implications for water quality risk assessment. J. Soil Water Conserv. 2000, 55, 277–284. [Google Scholar]
  19. Sharpley, A.N.; Daniel, T.C.; Edwards, D.R. Phosphorus movement in the landscape. J. Prod. Agric. 1993, 6, 492–500. [Google Scholar] [CrossRef]
  20. Patterson, C.L.; Haught, R.C. Regulatory considerations to ensure clean and safe drinking water. In Handbook of Water Purity and Quality, 2nd ed.; Ahuja, S., Ed.; Academic Press: Cambridge, MA, USA, 2021; Volume 6, pp. 93–135. [Google Scholar] [CrossRef]
  21. Horton, R.E. An approach toward a physical interpretation of infiltration capacity. Soil Sci. Soc. Am. Proc. 1940, 4, 399–417. [Google Scholar] [CrossRef]
  22. Hewlett, J.D.; Hibbert, A.R. Factors affecting the response of small watersheds to precipitation in humid regions. For. Hydrol. 1967, 1, 275–290. [Google Scholar]
  23. Dunne, T.; Black, R.D. Partial area contributions to storm runoff in a small New England watershed. Water Resour. Res. 1970, 6, 1296–1311. [Google Scholar] [CrossRef] [Green Version]
  24. Beven, K. TOPMODEL: A critique. Hydrol. Process. 1997, 11, 1069–1085. [Google Scholar] [CrossRef]
  25. Beven, K.J.; Kirkby, M.J. A physically based, variable contributing area model of basin hydrology. Hydrol. Sci. Bull. 1979, 24, 43–69. [Google Scholar] [CrossRef]
  26. Hillel, D. Fundamentals of Soil Physics; Academic Press: New York, NY, USA, 1980. [Google Scholar] [CrossRef]
  27. Khalikov, I.S.; Luk’yanova, N.N.; Makarenko, A.A. Analysis of soil pollution by polyarenes based on the results of the reconnaissance survey of Buryatia in 2014. Sci. Alm. 2016, 4-3, 434–438. (In Russian) [Google Scholar]
  28. Korlyakov, I.; Kasimov, N.; Kosheleva, N. Heavy metals and metalloids in the soil cover of the city of Ulan-Ude. PNRPU. Applied Ecology. Urban Dev. 2019, 3, 120–137. (In Russian) [Google Scholar] [CrossRef]
  29. Kasimov, N.; Kosheleva, N.; Gunin, P.; Korlyakov, I.; Sorokina, O.; Timofeev, I. State of the environment of urban and mining areas in the Selenga Transboundary River Basin (Mongolia Russia). Environ. Earth Sci. 2016, 75, 1283. [Google Scholar] [CrossRef]
  30. Kasimov, N.S.; Korlyakov, I.D.; Kosheleva, N.E. Distribution and factors of accumulation of heavy metals and metalloids in river bottom sediments in the territory of the Ulan-Ude city. RUDN J. Ecol. Life Saf. 2017, 25, 380–395. (In Russian) [Google Scholar] [CrossRef]
  31. Conrad, O.; Bechtel, B.; Bock, M.; Dietrich, H.; Fischer, E.; Gerlitz, L.; Wehberg, J.; Wichmann, V.; Böhner, J. System for automated geoscientific analyses (SAGA) v.2.1.4. Geosci. Model Dev. 2015, 8, 107–122. [Google Scholar] [CrossRef] [Green Version]
  32. Gallant, J.C.; Hutchinson, M.F. A Differential equation for specific catchment area. Water Resour. Res. 2011, 47, 28–33. [Google Scholar] [CrossRef] [Green Version]
  33. Drusch, M.; Del Bello, U.; Carlier, S.; Colin, O.; Fernandez, V.; Gascon, F.; Hoersch, B.; Isola, C.; Laberinti, P.; Martimort, P.; et al. Sentinel-2: ESA’s optical high-resolution mission for GMES operational services. Remote Sens. Environ. 2012, 20, 25–36. [Google Scholar] [CrossRef]
  34. Batoev, V.B.; Vaisflot, L.; Ventsel, K.D.; Tsydenova, O.V.; Palitsyna, S.S. Pollution of the basin of the Lake Baikal: Polyaromatic hydrocarbons. Khimiya v Interesakh Ustoichivogo Razvitiya. Chem. Sustain. Dev. 2003, 11, 829–834. (In Russian) [Google Scholar]
  35. Semenov, M.Y.; Marinaite, I.I.; Golobokova, L.P.; Khuriganova, O.I.; Khodzher, T.V.; Semenov, Y.M. Source apportionment of polycyclic aromatic hydrocarbons in Lake Baikal water and adjacent air layer. Chem. Ecol. 2017, 33, 977–990. [Google Scholar] [CrossRef]
  36. Liang, S.X.; Wu, H.; Sun, H.W. Determination of trace elements in airborne PM10 by inductively coupled plasma mass spectrometry. Int. J. Environ. Sci. Technol. 2015, 12, 1373–1378. [Google Scholar] [CrossRef] [Green Version]
  37. Semenov, M.Y.; Silaev, A.V.; Semenov, Y.M.; Begunova, L.A. Using Si, Al and Fe as tracers for source apportionment of air pollutants in Lake Baikal snowpack. Sustainability 2020, 12, 3392. [Google Scholar] [CrossRef]
  38. Lucarelli, F.; Calzolai, G.; Chiari, M.; Giardi, F.; Czelusniak, C.; Nava, S. Hourly elemental composition and source identification by positive matrix factorization (PMF) of fine and coarse particulate matter in the high polluted industrial area of Taranto (Italy). Atmosphere 2020, 11, 419. [Google Scholar] [CrossRef] [Green Version]
  39. Belis, C.A.; Favez, O.; Mircea, M.; Diapouli, E.; Manousakas, M.-I.; Vratolis, S.; Gilardoni, S.; Paglione, M.; Decesari, S.; Mocnik, G.; et al. European Guide on Air Pollution Source Apportionment with Receptor Models—Revised Version 2019, EUR 29816 EN; Publications office of the European Union: Luxembourg, 2019; ISBN 978-92-76-09001-4. [Google Scholar]
  40. Javed, W.; Guo, B. Chemical characterization and source apportionment of fine and coarse atmospheric particulate matter in Doha, Qatar. Atmos. Pollut. Res. 2020, 12, 122–136. [Google Scholar] [CrossRef]
  41. Zhou, X.; Li, Z.; Zhang, T.; Wang, F.; Tao, Y.; Zhang, X.; Wang, F.; Huang, J.; Cheng, T.; Jiang, H.; et al. Chemical nature and predominant sources of PM10 and PM2.5 from multiple sites on the Silk Road, Northwest China. Atmos. Pollut. Res. 2020, 12, 425–436. [Google Scholar] [CrossRef]
  42. Qiu, Z.; Lyon, S.W.; Creveling, E. Defining a topographic index threshold to delineate hydrologically sensitive areas for water resources planning and management. Water Resour. Manag. 2020, 34, 3675–3688. [Google Scholar] [CrossRef]
  43. Arnold, N. A New approach for dealing with depressions in digital elevation models when calculating flow accumulation values. Prog. Phys. Geogr. 2010, 34, 781–809. [Google Scholar] [CrossRef]
  44. Semenov, M.Y.; Marinaite, I.I.; Golobokova, L.P.; Semenov, Y.M.; Khodzher, T.V. Revealing the chemical profiles of airborne particulate matter sources in Lake Baikal area: A Combination of Three Techniques. Sustainability 2022, 14, 6170. [Google Scholar] [CrossRef]
  45. Mi, H.H.; Lee, W.J.; Tsai, P.J.; Chen, C.B. A comparison on the emission of polycyclic aromatic hydrocarbons and their corresponding carcinogenic potencies from a vehicle engine using leaded and lead-free gasoline. Environ. Health Perspect. 2001, 109, 1285–1290. [Google Scholar] [CrossRef]
  46. Dao, L.; Morrison, L.; Zhang, H.; Zhang, C. Influences of traffic on Pb, Cu and Zn concentrations in roadside soils of an urban park in Dublin, Ireland. Environ. Geochem. Health 2014, 36, 333–343. [Google Scholar] [CrossRef] [PubMed]
  47. Bartkowiak, A.; Lemanowicz, J.; Breza-Boruta, B. Evaluation of the content of Zn, Cu, Ni and Pb as well as the enzymatic activity of forest soils exposed to the effect of road traffic pollution. Environ. Sci. Pollut. Res. 2017, 24, 23893–23902. [Google Scholar] [CrossRef] [PubMed] [Green Version]
  48. Jeong, H. Toxic metal concentrations and Cu–Zn–Pb isotopic compositions in tires. J. Anal. Sci. Technol. 2022, 13, 1–10. [Google Scholar] [CrossRef]
  49. Root, R.A. Analysis of a study of lead wheel weight deposition and abrasion in New Jersey. Water Air Soil Pollut. 2015, 226, 381. [Google Scholar] [CrossRef] [Green Version]
  50. Taylor, M.; Kruger, N. Tyre weights an overlooked diffuse source of lead and antimony to road runoff. Sustainability 2020, 12, 6790. [Google Scholar] [CrossRef]
  51. Navarro, R.; Guzman, J.; Saucedo, I.; Revilla, J.; Guibal, E. Vanadium recovery from oil fly ash by leaching, precipitation and solvent extraction processes. Waste Manag. 2007, 27, 425–438. [Google Scholar] [CrossRef]
  52. Jung, M.; Mishra, B. Vanadium recovery from oil fly ash by carbon removal and roast-leach process. JOM 2018, 70, 168–172. [Google Scholar] [CrossRef]
  53. Bhattacharyya, S.S.; Dan, S.R.; Das, A.K. Determination of vanadium in coal fly ash by electrothermal atomic absorption spectrometry. Anal. Lett. 1993, 26, 295–308. [Google Scholar] [CrossRef]
  54. Aydin, F.; Saydut, A.; Gunduz, B.; Aydin, I.; Hamamci, C. Chemical speciation of vanadium in coal bottom ash. Clean—Soil Air Water 2012, 40, 444–448. [Google Scholar] [CrossRef]
  55. Al-Ghouti, M.A.; Al-Degs, Y.S.; Ghrair, A.; Khoury, H.; Ziedan, M. Extraction and separation of vanadium and nickel from fly ash produced in heavy fuel power plants. Chem. Eng. J. 2011, 173, 191–197. [Google Scholar] [CrossRef]
  56. Li, Z.; Wang, Q.; Xiao, Z.; Fan, L.; Wang, D.; Li, X.; Du, J.; Cheng, J. Behaviors of chromium in coal-fired power plants and associated atmospheric emissions in Guizhou, Southwest China. Atmosphere 2020, 11, 951. [Google Scholar] [CrossRef]
  57. Tang, Q.; Chang, L.; He, F.; Miao, C.; Zheng, L.; Ma, D.; Wang, R.; Fu, B. Impact of ultra-low emission retrofitting on partitioning and emission behavior of chromium in a Chinese coal-fired power plant. Chemosphere 2022, 302, 134859. [Google Scholar] [CrossRef] [PubMed]
  58. Semenov, M.Y.; Onishchuk, N.A.; Netsvetaeva, O.G.; Khodzher, T.V. Source apportionment of particulate matter in urban snowpack using end-member mixing analysis and positive matrix factorization model. Sustainability 2021, 13, 13584. [Google Scholar] [CrossRef]
Figure 1. Study area: (a) location of Lake Baikal in Central Asia, (b) location of Selenga River basin in Baikal region, (c) location of Ulan-Ude city in Lake Baikal basin, (d) locations of sampling points (red dots) in Ulan-Ude city.
Sustainability 14 14827 g001
Figure 2. Elevation map of the study area.
Sustainability 14 14827 g002
Figure 3. Spatial distribution of topographic wetness index (TWI) values: 1—12–15, 2—15–18.
Sustainability 14 14827 g003
Figure 4. (a) Spatial distribution of FA values in study territory and (b) areas characterized by highest FA values; 1—border of areas characterized by highest FA values.
Sustainability 14 14827 g004
Figure 5. Spatial distribution of hydrologically sensitive areas in the study territory; 1—HSAs.
Sustainability 14 14827 g005
Figure 6. Spatial distribution of industrial and municipal enterprises in the study territory; 1—industrial zones, 2—industrial zone boundaries, 3—industrial enterprise locations, 4—industrial enterprise numbers: I—glass factory, II—oil terminal, III—electric motor factory, IV—railroad car repair plant, V—coal-fired central heating boiler, VI—bridge structures plant, VII—reinforced concrete plant, VIII—metal structures plant, IX—meat-packing plant, X—warehousing facility, XI—aircraft plant, XII—brick factory, XII—poultry farm, XIV—coal-fired central heating boiler, XV—silicate building materials plant, XVI—reinforced concrete plant, XVII—boiler house.
Sustainability 14 14827 g006
Figure 7. Spatial distribution of critical source areas (CSA) in the study territory; 1—critical source areas, 2—critical source area numbers.
Sustainability 14 14827 g007
Figure 8. (a) PAH profile of gasoline combustion, (b) PAH profile of coal and wood combustion and (c) PAH profile of oil and diesel fuel combustion obtained by PMF analysis of PAH composition of Ulan-Ude soils.
Sustainability 14 14827 g008
Figure 9. (a) TM profile of traffic emissions and (b) TM profile of fossil fuel combustion obtained by PMF analysis of PAH composition of Ulan-Ude soils.
Sustainability 14 14827 g009
Figure 10. (a) PAH composition of bottom sediments of Selenga River and (b) PAH composition of soils sampled in Ulan-Ude city.
Sustainability 14 14827 g010
Figure 11. (a) TM composition of bottom sediments of Selenga River and (b) TM composition of soils sampled in Ulan-Ude city.
Sustainability 14 14827 g011
Table 1. PAH composition of topsoil of CSAs, µg/kg.
CSAPHEANTFLAPYRBaACHRBaPBePBbFBkFIcdPBghiPSum
142.42.0410979.938.643.328.886.044.618.614.418.1526
217324.36345254123603527014171982241834201
320.92.7622.316.08.528.886.9614.910.85.525.525.16128
48.641.0834.026.018.517.816.637.821.69.710.910.6213
510.70.4826.419.19.6010.75.4020.510.04.322.162.76122
622.61.9245.135.022.922.919.842.727.212.715.815.1284
714.21.2064.847.420.923.615.752.127.210.97.808.16294
830.52.7610373.934.629.023.968.435.913.915.416.7448
931.67.2014110747.475.832.614185.933.819.318.0741
1048.54.3270.155.845.839.235.877.446.221.830.831.4507
1124.12.6437.628.715.618.213.333.522.09.247.808.16221
Average38.84.6117.092.261.359.150.011668.030.732.228.8699
STD *46.16.7917614611710210019711856.064.1651.61177
* Standard deviation.
Table 2. Basic statistical parameters of PAH composition of topsoil of study territory, µg/kg.
PHEANTFLAPYRBaACHRBaPBePBbFBkFIcdPBghiP
Min0.070.030.891.210.590.460.320.610.490.210.390.45
25th *4.870.384.863.772.693.152.673.412.791.322.141.42
Med10.31.2717.416.79.098.8710.114.211.34.335.517.33
75th *22.62.9767.556.928.231.821.447.029.913.716.313.1
Max18934.1811716535388501798489205301252
Mean27.44.0183.956.437.939.531.982.458.630.422.319.6
STD **41.54.8812799.878.791.276.313298.742.945.434.6
* Percentile, ** standard deviation.
Table 3. TM composition of topsoil of CSAs, mg/kg.
CSAVCrCoNiCuZnMoHgPbBiSum
154.742.68.0922.018.570.81.540.0222.80.12244
264.883.39.6728.855.42102.380.0761.20.25522
390.047.48.4728.317.51332.510.0424.70.13358
448.858.48.2123.017.879.62.070.0324.00.10266
571.446.76.2823.813.776.21.650.0122.60.11267
646.643.05.2924.413.766.61.520.0324.00.08229
750.041.28.0318.822.393.71.830.0323.40.18265
840.131.97.1617.913.657.62.830.0318.80.10196
973.384.432.637.735.61762.090.0757.10.84506
1051.636.26.1121.114.41371.400.0627.00.18298
1169.566.69.9126.916.675.81.460.0215.70.14287
Average60.152.910.024.821.71071.930.0429.20.20313
STD *14.918.17.645.5612.850.20.480.0215.10.22108
* Standard deviation.
Table 4. Basic statistical parameters of TM composition of topsoil, mg/kg.
VCrCoNiCuZnMoHgPbBi
Min29.324.33.1212.26.7525.81.750.0047.610.03
25th *38.429.54.9316.410.546.71.900.0110.50.06
Median 45.137.06.1719.713.866.32.440.0214.70.09
75th *57.546.97.7823.918.21033.430.0419.70.18
Max91.185.233.639.956.12206.700.1588.90.92
Mean49.643.87.3821.816.486.32.720.0318.60.16
STD **8.7411.92.876.078.1534.21.140.0213.10.09
* Percentile, ** standard deviation.
Table 5. Contributions of PAH sources obtained using PMF model.
CSAGasoline CombustionCoal and Wood CombustionOil and Diesel Fuel Combustion
10.330.210.46
20.280.330.39
30.700.170.13
40.290.350.35
50.330.140.53
60.420.320.27
70.310.190.49
80.420.210.37
90.350.190.47
100.470.320.21
110.550.200.25
Mean0.400.240.36
Table 6. Contributions of TM sources obtained using PMF model.
CSANonexhaust Traffic EmissionsFossil Fuel Combustion
14654
26931
35050
44852
53664
65248
75644
86337
95347
106535
113268
Mean5248
Publisher’s Note: MDPI stays neutral with regard to jurisdictional claims in published maps and institutional affiliations.