Article

Efficiency Assessment of New Signal Timing in Saudi Arabia Implementing Flashing Green Interval Complimented with Law Enforcement Cameras

by
Mohammed Saleh Alfawzan
1 and
Ahmad Aftab
2,*
1
Department of Civil Engineering, Qassim University, P.O. BOX 6640, Buraydah 51452, Saudi Arabia
2
Traffic and Transportation Engineering Department, Imam Abdulrahman Bin Faisal University, Dammam 34212, Saudi Arabia
*
Author to whom correspondence should be addressed.
Sustainability 2022, 14(22), 14879; https://doi.org/10.3390/su142214879
Submission received: 6 October 2022 / Revised: 6 November 2022 / Accepted: 7 November 2022 / Published: 10 November 2022
(This article belongs to the Special Issue Control System for Sustainable Urban Mobility)

Abstract

:
Traffic congestion at intersection is one of the significant socioeconomic concerns worldwide. To tackle this challenge, researchers and practitioners are researching and executing different plans to control and manage long queues and delays. The general department of traffic in Saudi Arabia has implemented a new signal timing pattern in a number of signalized intersections that were designed with an additional flashing green phase complemented with law enforcement cameras (SAHER) to improve the capacity and safety of signalized intersections. This research aims to evaluate the impact of flashing green intervals on driver behavior and traffic efficiency of five signalized urban intersections equipped with SAHER in the Al-Qassim region, Saudi Arabia. Analyses for the current situation (base scenario) and proposed scenarios (without SAHER) are performed and validated using the microsimulation model (VISSIM) with field collected data at the selected intersections. The results showed that, despite fewer improvements in vehicle delays, the intersections without SAHER and flashing green intervals yield shorter queue lengths than the intersections with SAHER and flashing green intervals. Further, it was also revealed that drivers tend to stop early and start late in the case of SAHER due to fear of red light fines, thus not utilizing the full green split and yellow time. Analysis for the average vehicle delay and queue lengths is also conducted to assess the efficacy of implemented green light flashing with SAHER on driver behavior and operational efficiency of the selected intersections.

1. Introduction

Analyses of driver behavior have remained the subject of widespread research during the past few decades. Drivers’ characteristics are frequently determined for the design of roadway features, both for free-flow and interrupted facilities. Driver aggression and perception–reaction time are crucial factors in signal timing design for evaluating the performance of signalized intersections in urban areas [1]. Such driver characteristics affect traffic flow properties such as headways, loss times, cycle time, saturation flow etc. Drivers’ stop/go decisions at traffic signals may be influenced by pre-warning signs such as flashing green and countdown timers that alert them to the onset of yellow [2,3,4]. A consensus is yet to be achieved if such devices promote or forbid red light running (RLR) behavior. The flashing green signal warns the drivers about the end of the green phase for specific movements; hence, it provides the drivers with a few extra seconds to make a timely and suitable decision for the next phase change. It is generally agreed that these new traffic light control strategies are expected to lessen accident frequencies and improve highway safety; however, their impact on traffic efficiency is not very promising. Mahalel et al. (1985) discovered that the flashing green phase could lead to increased rear-end crashes at intersections and an increased number of improper stopping decisions [5]. One of the most frequent offenses committed by drivers at signalized intersections is red light running (RLR). Some motorists may stop abruptly to avoid RLR violations, even though they had the chance to cross the stop line before the start of the red light indication. Such incidents happen more frequently at highway intersections equipped with RLR. Consequently, this can affect the drivers’ stopping behavior and potential reduction of usable clearance interval and, thus, restrain the full intersection capacity.
For a queue of approaching vehicles at an intersection, the cycle-to-cycle sequence of a signalized intersection involves stop-and-go conditions [6]. It normally takes the first waiting driver a little extra time to respond to the red-to-green transition before releasing the brake and accelerating. Consequently, the following driver will also incur some reaction time, ultimately becoming shorter for every subsequent driver. A relatively constant or average headway, properly known as the saturation headway (h), is achieved after there is no further implicit in the reaction time provided that the vehicle’s queue is large enough to utilize the allotted signal green timing allocated to a specific movement. Understanding the behavior of other micro-mobility modes riders, such as e-scooters and e-bikers at signalized junctions and networks, is also an important research problem [7]. Further, drivers yielding behavior to pedestrians at conflict points influences their safety [8,9].
The application of computational tools by traffic engineers for network performance evaluations is a crucial component of traffic analyses. It resolves the physical interactions between the driver, the car, and the road system using various models. These models are crucial for researching and evaluating transportation systems and their components. The validation and calibration of the models for local conditions have the utmost importance for accurate results and analyses [10,11]. As driver behavior at intersections varies over different locations and countries, it is imperative to adopt specific values of traffic flow parameters (headway loss times, etc.) using adjustment factors. The role of driving behavior in model calculations is essential, especially from the point of view of validating local conditions. For example, a model in Saudi Arabia using traffic flow parameters of Europe could provide unsatisfactory results, as both the driving conditions and behavior differ from Europe.
Recently, the department of traffic operations in Saudi Arabia adopted a signal timing interval scheme that can alert users about the onset of the amber signal. The new signal timing interval scheme, Flashing Green Interval (FGI), was implemented in most signalized intersections across different regions in Saudi Arabia, including Qassim. The new signal timing scheme adoption is also usually supported with law enforcement cameras, i.e., red light running (RLR) violation enforcement cameras, which are locally known as SAHER. SAHER traffic monitoring, and control program is among the popular enforcement schemes lately proposed with the aim to optimize the existing traffic system’s efficiency and reduce road traffic accidents (RTAs) [12,13,14,15,16]. The vast majority of studies for understanding driver behavior in response to flashing green and red light running enforcement have been conducted in different countries for their traffic conditions [17]; however, it is worthwhile to determine these parameters for driving conditions in the Kingdom of Saudi Arabia (KSA). It is established that driver behavior tends to vary from one location to another [18,19,20,21]; it is imperative to a local investigation of driver behavior toward the installation of flashing green at signalized crossings. Most previous studies have investigated the traffic safety impacts of flashing green, and very few of them have evaluated their traffic operation implication. Further, a critical review of existing literature also revealed that other strategies, such as countdown timers and early warning, have received widespread attention compared to flashing green. The general hypothesis is that induction of flashing green will reduce the driver dilemma zone and shorten the utilization of yellow signals; however, these findings should be reinforced by sound and concrete research from different geographic locations. To the best of our knowledge, no prior research has investigated how the SAHER system and flashing green signals affect driver behavior and the operational effectiveness of signalized intersections in the local context. Consequently, the practitioners and scientific community in KSA still lack an understanding of drivers’ aptitudes toward flashing green. To fill this gap, this study aims to investigate the impact of flashing green signals complemented with and without SAHER on driver behavior and traffic operation through signalized intersections in the Al-Qassim region of Saudi Arabia. The specific contributions of this study are:
  • To understand and quantify the driver’s behavioral attributes and stop/go decisions when passing through flashing green lights at signalized intersections.
  • To investigate the impact of law enforcement red light cameras (SAHER) on driver behavior and operations signalized intersections.
  • Comparing the driver behavior and operational performance of flashing green and SAHER systems with regular traffic control (without the impact of the red light camera and flashing green).
The findings of this research are expected to provide better insights into understanding the impact of different signal control strategies on driver behavior and their operational consequences on signalized intersections in the realm of the smart real-time traffic control system.
The rest of this paper is structured as below. Section 2 contains brief overview of the literature regarding the impact of flashing green signals and RLC on driver behavior, safety, and traffic efficiency. Section 3 presents the description of the study area, intersections selected for analysis and detailed data collection procedures. Section 4 provides the methodology for the development and validation of the microsimulation (VISSIM) model. Section 5 contains the study results and related discussions. Finally, Section 5 presents the key findings and recommendations for forthcoming studies.

2. Related Works

A detailed literature review was conducted to highlight research studies that considered signal timing elements and signalized intersection control. In this regard, the impact of two main strategies (Flashing green and traffic enforcement) on driver behavior and traffic performance is reviewed.

2.1. Effect of Flashing Green

The flashing green light is a type of green control strategy that warns drivers that the green signal is about to end. The primary objective of the majority of previous scientific studies is to explore the traffic safety effects of flashing green signals. Studies generally agreed that the application of flashing green lowers the percentage of red light offenses and the number of right-angle crashes [22,23]. One of the main justifications for proving flashing green lights is that it increases the number of early stops, reducing the risk of right-angle crashes. However, many researchers have found that the flashing green phase generates a period of uncertainty and, therefore, could lead to rear-end collisions.
In literature, different studies have investigated the effects of flashing green on driver behavior, operational efficiency, and safety. For example, Köll et al., in their study, reported that the presence of flashing green lights at signalized intersections is expected to increase the number of stops as the drivers often tend to underestimate the duration of time allocated for permitted movement until the end of the amber signal [24]. In another similar study, the researchers examined the stop-and-go decisions of drivers in the presence of flashing green lights [25]. The study results revealed that, in general, the probability of stop-and-go movements is substantially higher at intersections with flashing green lights; however, the frequency of go decisions also tends to increase when the operating speeds are high, and the distance from the stop line is comparatively shorter. Recently, a study compared the traffic efficiency performance of flash green versus no flashing green on 34 signalized intersections in Jordan [26]. It was concluded that the parameters approaching speed and number of vehicles crossing the intersection for intersections operating with flashing green were higher than those without flashing green, while the proportion of vehicle jumps before green was lower for intersections with flashing green lights. According to research by Kocic et al. (2020), the flashing green phase results in a shorter effective green, which lowers capacity [27]. The study also showed that around 12% of drivers stopped before the flashing green end at the intersection, thus decreasing the traffic signal efficiency. Dong et al. investigated the influence of Flashing Green Lights on the decision behavior of E-bikers at two urban intersections [28]. Results suggested that intersections operating with a Flashing green signal offer more time for drivers to accelerate through intersections and can simulate earlier decisions. More recently, a team of researchers investigated the effects of flashing green on reaction times and safety at signalized intersections in Israel [29]. Results showed that flashing green induces greater variations in perception reaction times and also led to additional safety concerns for drivers. Haung et al. in their research, evaluated the effects of different time-reminders strategies before the onset of a yellow amber signal on driver’s decision-making while navigating through signalized intersections in China [30]. In this regard, three types of strategies were considered, i.e., standard signal, green countdown, and green flashing. It was found that intersections with countdown timers simulated the early decisions compared to those operated with flashing green and common traffic signals. In another similar study, Hussain et al. also compared the traffic flow efficiency of intersections operated with various signal control strategies, such as a green LED dynamic light (G-LED) system coupled with countdown timers, a flashing green signal, and default traffic signals on Corniche road in Doha city [31]. Results indicated that the probability of vehicle crossing significantly increased with G-LED lighting system compared to the default traffic signal, while it decreased with the installation of flashing green. Furthermore, from the speed and time-space analysis it was concluded that the majority of the drivers preferred to decelerate and decided to stop in the option at the intersection equipped with flashing green signal. Tang et al. also evaluated the impact of flashing green lights on the dilemma zone behavior at high-speed intersection which have relatively shorter amber duration [32]. It was noted that flashing green slightly encouraged the aggressive passes and overall increased the conservative stops by 30%.

2.2. Effect of Red Light Cameras (RLC)

Police enforcement or a red light camera may be used to identify motorists who breach the stop line and continue through the junction after the red light has started. Even though they could have lawfully crossed the line during the yellow change interval, some drivers abruptly halt to avoid breaking the law in the presence of RLCs, which reduces the entrance time during the clearance interval [33]. Few studies have looked into how drivers’ behavioral changes followed the installation of RLCs despite the fact that numerous studies have reported the safety benefits of putting RLCs.
Recently numerous studies have investigated the safety impacts of RLCs at intersections; however, only a few have attempted to evaluate their effectiveness on traffic flow and operational efficiency. Baratian-Ghorgh et al. examined the capacity of signalized intersections equipped with RLCs and found that clearance lost time due to such installations in approximately 2.7 s longer than those without RLCs [34]. A study by Sun et al. showed the presence of RLCs and reported that it can lead to unusual decision behaviors, higher speeds at intersection crossing, expansion of dilemma zone (type II), and deterioration of driving smoothness due to diverse driving habits [35]. Almutairi and Wei showed that the presence of RLCs is associated with significant shifts of dilemma zone downstream and reported that the probability of vehicle stopping is increased by 11% in the presence of RLCs [36]. In another study, the researchers evaluated the effects of RLCs on stop/go decisions and concluded that the stopping behavior was amplified following the installation of RLCs [37]. Baratian-Ghorghi and Zhou studied the impact of RLCs on driver behavior and intersection delay using field data collected at eight signalized intersections, including four with and four without RLCs installation. A total of 2391 drivers’ responses collected over 1613 traffic light cycles were recorded for estimating the amount of clearance time generally used by the drivers [38]. It was revealed that the tendency to stop increased with the installation of RLCs. Further, the clearance time utilized by the drivers at RLCs intersections was one-half compared to its counterparts. Concerning the delay between the two conditions (with and without RLCs), it was found that significantly greater delay is incurred by RLCs, particularly under highly saturated traffic conditions. Jha and Weldegiorgis, in their study, adopted a probabilistic approach to estimate the capacity of signalized intersections with and without RLCs using field data from Baltimore, Maryland [39]. The results revealed that the capacity of intersections equipped with RLCs is lower compared to those without such enforcement cameras. Furthermore, the authors also argued that although the capacity reduction at a single intersection may not be that significant, the cumulative effect across a network of heavily traveled network of intersections may be quite significant, resulting in a significant loss of time. Gates et al. (2014) investigated the effects of driver behavior when RLCs are present and offered recommendations for the yellow phase and all-red clearance timings [40]. The researchers used the data for 82 different signalized crossings across four different locations in the US, 10 of which were equipped with RLCs. Video cameras were employed to record the behavior of 7306 automobile drivers. The analysis revealed that drivers at RLC intersections tended to react to a change in the yellow light 5% (0.05 s) quicker when stopping. Further it was noted that RLCs have no effect on deceleration rates; and that the presence of an RLC increases the likelihood that a driver stops by 2.4%. Intersections with a yellow time interval of 4.5 s or more had double the rate of red light running (RLR) rates.

3. Study Area

Five signalized intersections were selected from the Qassim region for the data collection and their analysis for this study. According to Qassim Traffic Department, 2018, the region faces very high traffic flows during the weekends when families travel to different cities within and outside the Qassim region. The region lies almost at the center of Saudi Arabia and covers an area of around 73,000 km2 [14]. The region is divided into 13 governorates, including the study governorates of Buraydah and Unayzah. This centrality of the Qassim region makes it an important connector between different parts of the neighboring regions, such as Hail, Madinah, and Riyadh. All five were signalized intersections with RLC also known as SAHER, and flashing green in their signal phases. These models allow users to choose a range of values for the parameters for the default values for each variable. Table 1 shows the information about the signalized intersection selected for the data collection of headway and loss time.

4. Data Collection and Description

The data collection process was divided into two sub-tasks depending on the several types of data to be collected. The study team did surveillance surveys for all locations at various time frames to observe peak periods. After observations and surveys, PM peak period between 5:30 and 6:30 was selected for the data collection. The data collection process included the collection of data for the following:
As mentioned before, the recordings were performed using video cameras on weekends between 05:30 and 06:30 during PM peak traffic hours. The camera view at a typical location/installation is shown in Figure 1. Vehicle composition data were also collected from the recordings. Videos were slowed down to 0.5 times the real simulation, and time was analyzed till two decimal points for accuracy purposes. Placement for the typical camera position is shown in Figure 2 below. Video cameras were placed on sidewalks or nearby buildings to capture different important observations such as (a) The vehicle passing the stop line (reference line for headways), (b) The average driver response time for the first vehicle to start moving at the start of the displayed green periods, (c) Turning Movement counts and throughput volume, (d) Queue Length at least two approaches.
From the recorded videos, other observations such as headway, startup lost time, and turning movement counts (TMCs) were determined/calculated. Headway values from a total of 116 cycles were recorded by using video camera equipment from the 5th vehicle in the queue going straight as per the 2010 edition of the Highway Capacity Manual (HCM) [41]. The Saturated average headway for the intersections with SAHER was around 2.2 sec. Similarly, the response time of the first vehicle in the queue behind the stop line was observed as the signal turned green. Analysis indicated an average startup response time of 1.63 sec for intersection with SAHER or RLCs. Another critical aspect of evaluating the operational characteristics of a given traffic system is collecting the turning movement counts. Such evaluation may include issues related to project delays, level of service appraisals, travel time comparisons, queue length estimations, and more. TMCs were collected for all the intersections by carefully watching the recorded videos in slow mode. Finally, Queue lengths were observed each cycle through video recordings and were recorded in an excel sheet against each approach for the study locations. Maximum queue length in meters was observed among all cycle times for the validation of the model in later stages. Data on traffic signal timings were collected using manual observations. To prepare map road alignment in VISSIM software. Maps were captured from Google Earth for the selected intersections for building accurate base network geometries in the model.

5. Methodology

5.1. Development of Micro Simulation Model

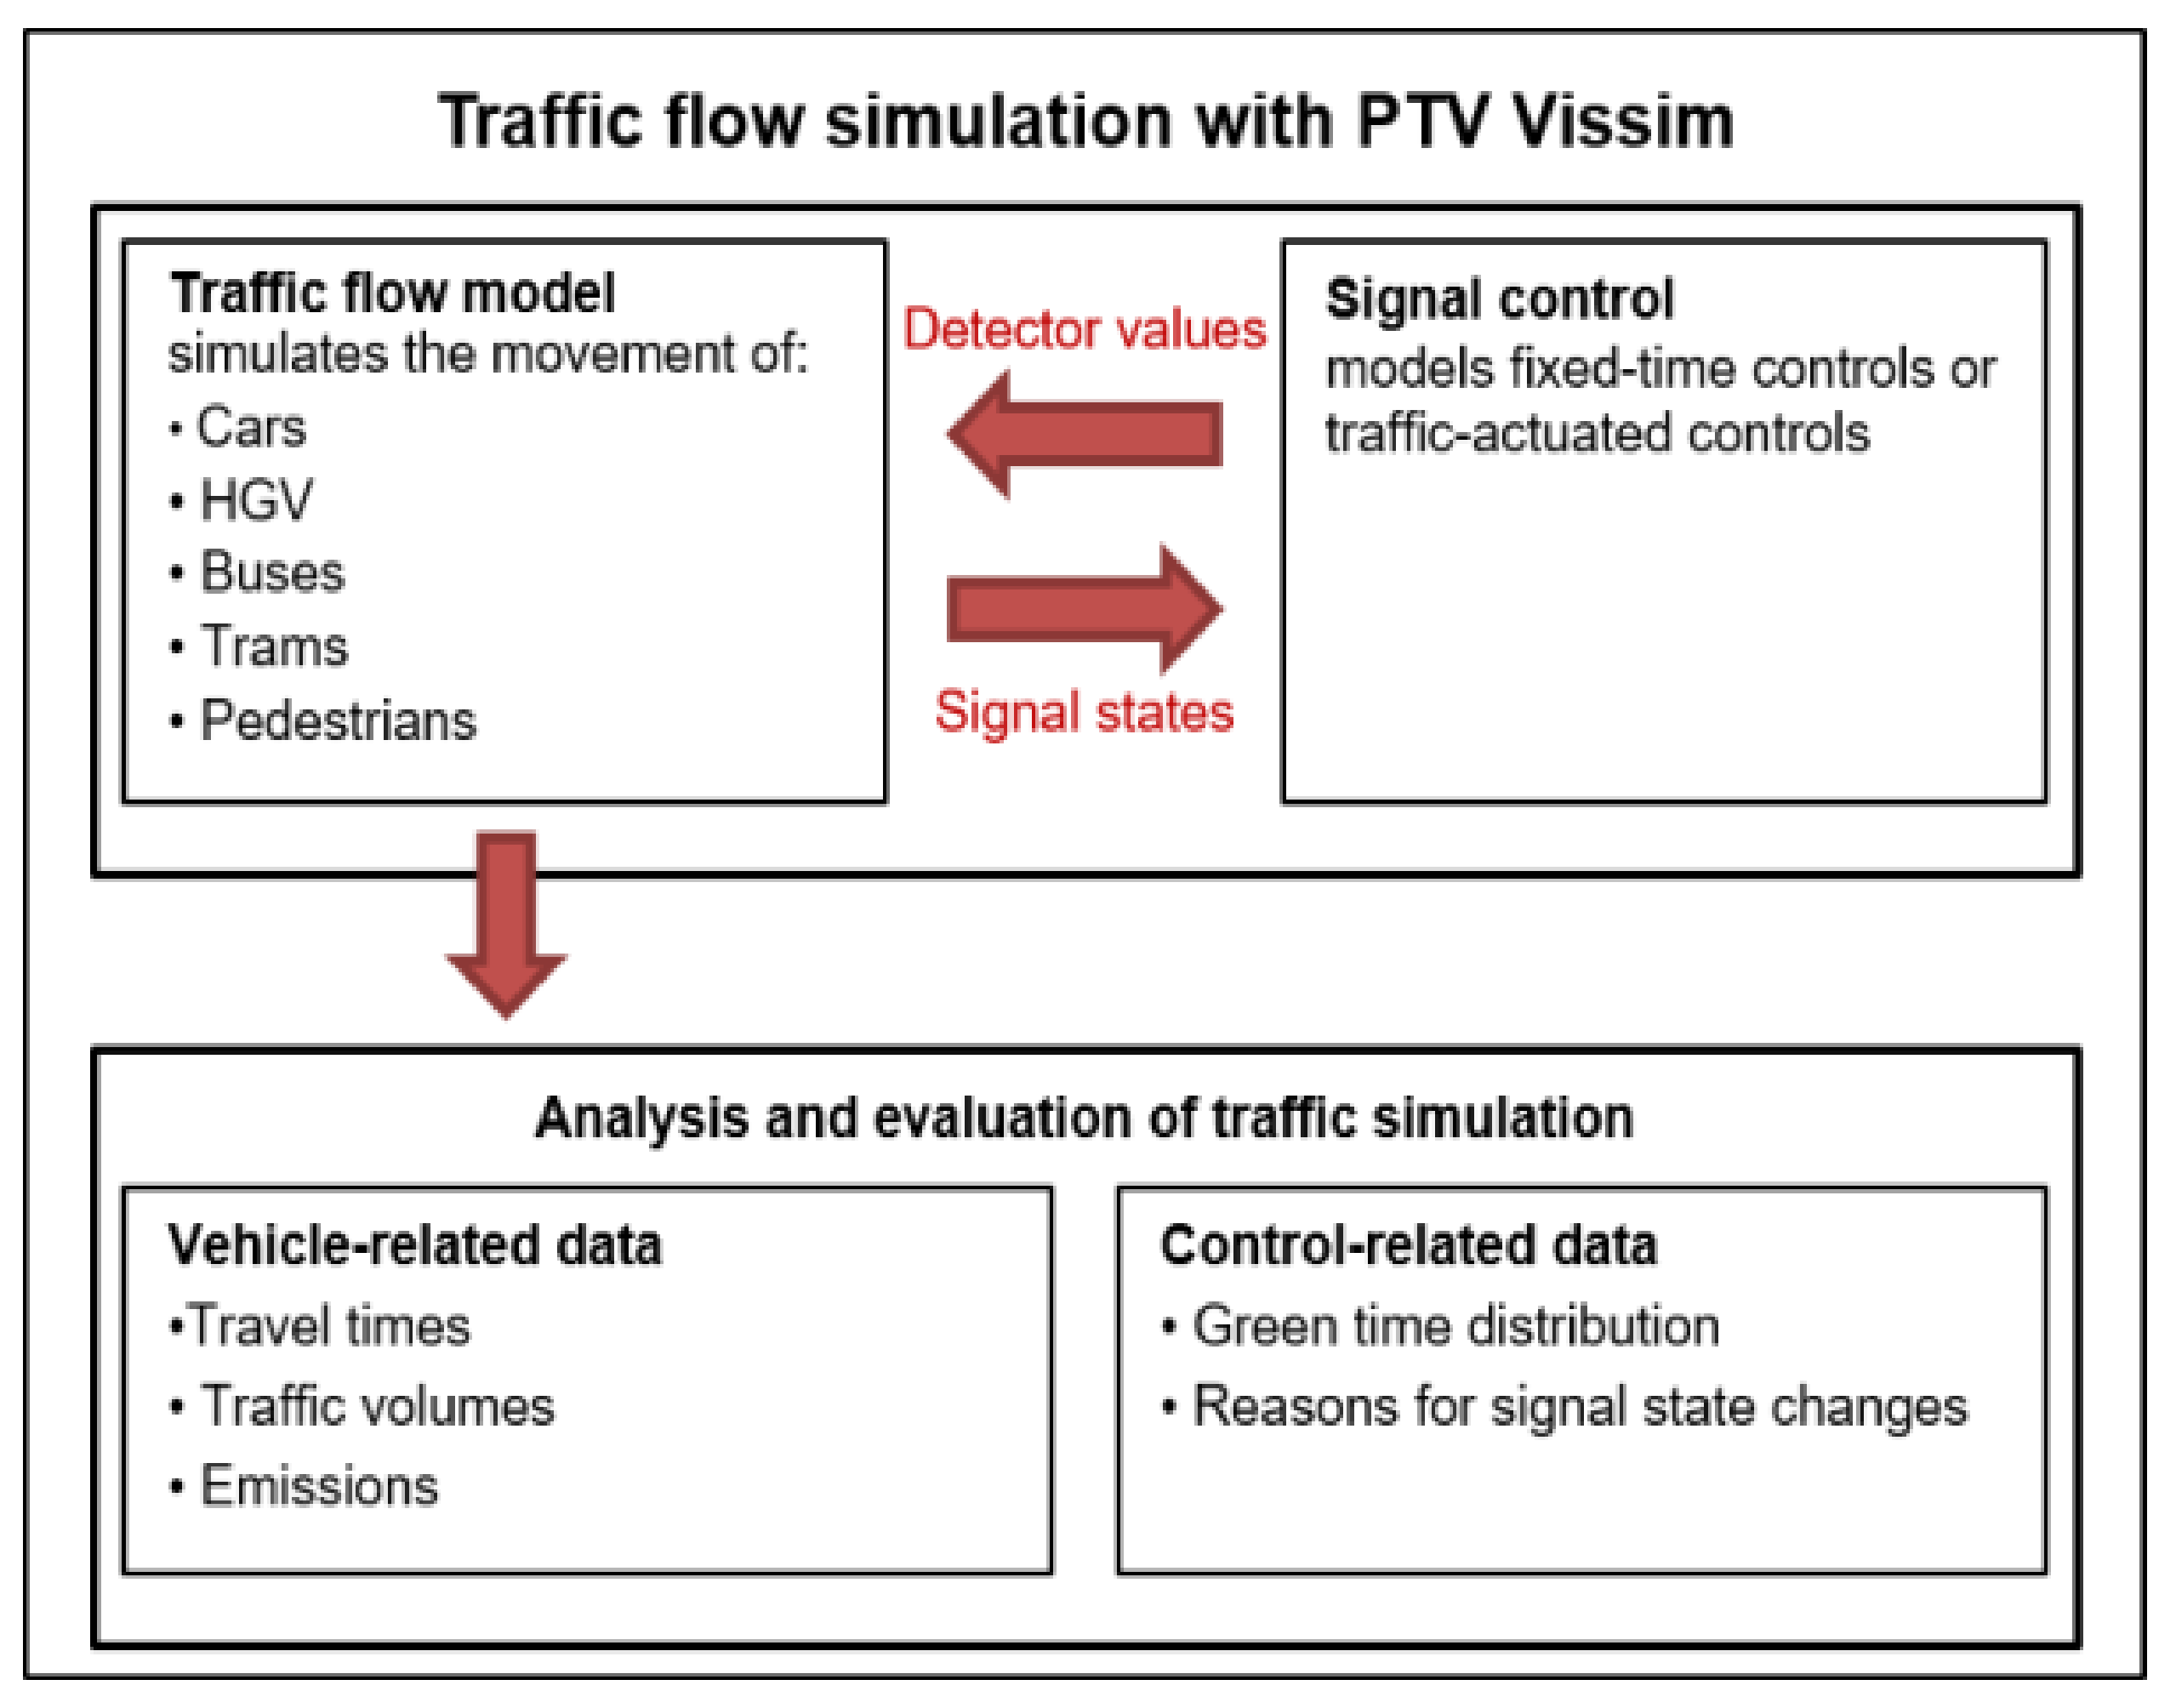
PTV VISSIM is the state-of-the-art microscopic simulation program widely used for modeling multimodal transport operations. Fixed Controls were used for the analysis of current conditions and scenarios of non-SAHER. Pre-timed controls often work with a repeated sequence of signal plans with fixed cycle lengths, offsets, and splits. For the analysis, the signal timing plans were developed offline and then optimized using traffic flow historical data. A combination of predetermined plans can accommodate the time of the day variations in the traffic volumes. However, when traffic volumes are predictable, fixed controls work much better. For each signalized intersection, the traffic flow simulation was carried out as shown in Figure 2 below:

5.2. Input VISSIM Parameters for SAHER and Non SAHER Intersections

The calibration for the base scenario of flashing green with RLC was accomplished in two important steps. The headway was initially adjusted for the vehicles on the front line. Second, for the following vehicles, the ideal mix of CC1 (headway in seconds) and CC0 (standstill distance) was identified. The vehicle in the front-line (first position) were treated differently because they respond immediately to the changed signal indication and not to with vehicles ahead of them. Under the option of “standstill distance for static obstacles,” VISSIM simulation enables users to choose a value for vehicles standing near the stop line. This parameter effect only those vehicles that are stopping due to a red signal. Startup loss time can be considered in VISSIM using ‘reaction time’ at signals. A red-amber signal in VISSIM can be read as either green or red. VISSIM’s default settings presuppose that when the light is red-amber, cars will begin to accelerate. The analysis of the measured data reveals that this setting gives the first car a headway that is too little. For red-amber signals, the behavior option wait (red) was therefore set. Simulating the network with VISSIM values for calibrating base conditions is presented in Table 2. The results from the base conditions would further be validated by comparing maximum queue lengths at the approaches.
After validating and calibrating the base conditions, no RLC without a flashing green scenario was tested to find the operational differences between two. Simulating the network with VISSIM values for no RLC and no flashing green is presented in Table 3.

5.3. Traffic Analysis

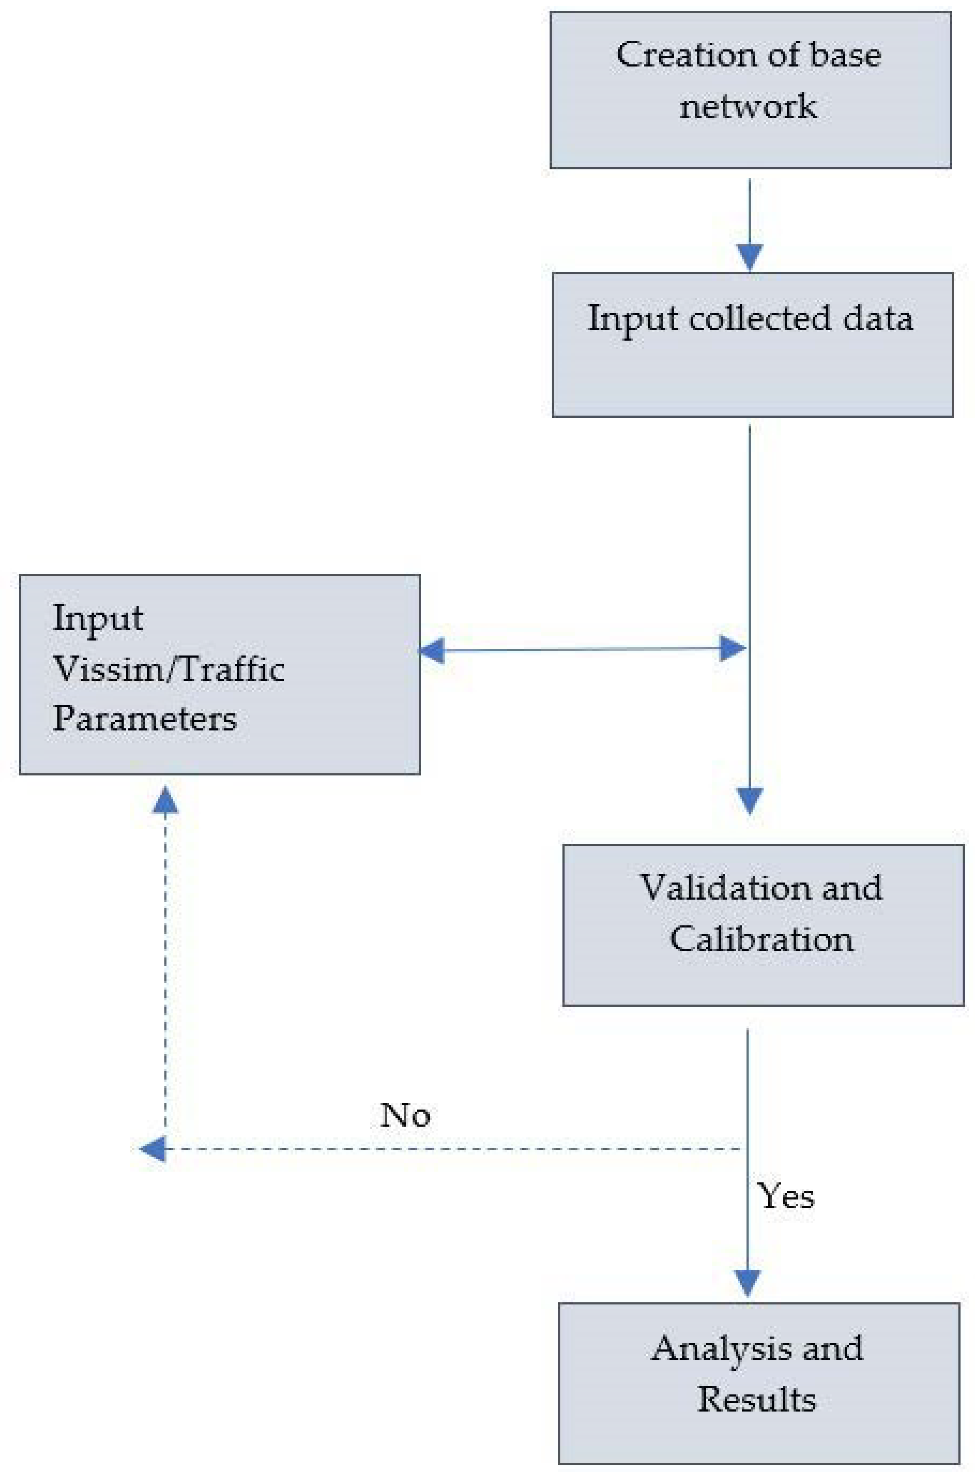
Microscopic software models have been widely used in analyzing transportation operations and management. Engineers may benefit from these models, but before they can be utilized to provide useful results, the models must be properly calibrated and validated. Mennini et al. (1997) validated the model in VISSIM using Weideman 99 coefficients. Similarly, Al Ahmadi (2019) used Weideman coefficients and queue lengths to validate the model network [11]. These models allow users to choose a range of values for each variable’s parameters for the default values. The traffic analysis methodology followed is presented in Figure 3 below.

6. Results and Discussion

6.1. Model Validation

An important aspect of a simulation-based study is to validate the results model results to determine if they replicate the field conditions. Since driving behavior and traffic conditions vary from one location to another, it is imperative to calibrate the model in the first place, as an uncalibrated model can easily provide biased results. For calibration, default model parameters are adjusted to reflect the local conditions [11,42]. The next step is to validate the model to ensure the efficacy of the developed model. The traffic simulation model can be validated by comparing the values of various performance measures (such as travel time, delay, queue lengths or turning movement counts at intersections) with the corresponding values recorded from field surveys. As a general rule of thumb, the performance of the simulation model may be considered acceptable if the difference between the model values and field observations is within 10% [11]. For the current study, two performance measures were selected for model validation. Based on the collected data, the validation process was performed to closely match validation to match traffic counts and queue length. Considering the TMCs, the validation yielded a 96 to 99% match to the turning movement counts captured in the field for various intersections. This represents an excellent model performance. Similarly, maximum queue lengths from the VISSIM model were validated against the collected maximum queue lengths, and results show encouraging percentage differences of less than 10%. Table 4 summarizes the validation results against queue lengths for all five intersections. Validation of queue lengths for various approaches on individual intersections as well as the average queue lengths, is shown. It is clear that the percentage deviation of the model’s queue is well within the 10% threshold, demonstrating the efficacy and robustness of the developed microsimulation model.

6.2. Effect of Flashing Green on Driver Behavior and Traffic for SAHER versus Non-SAHER Scenarios

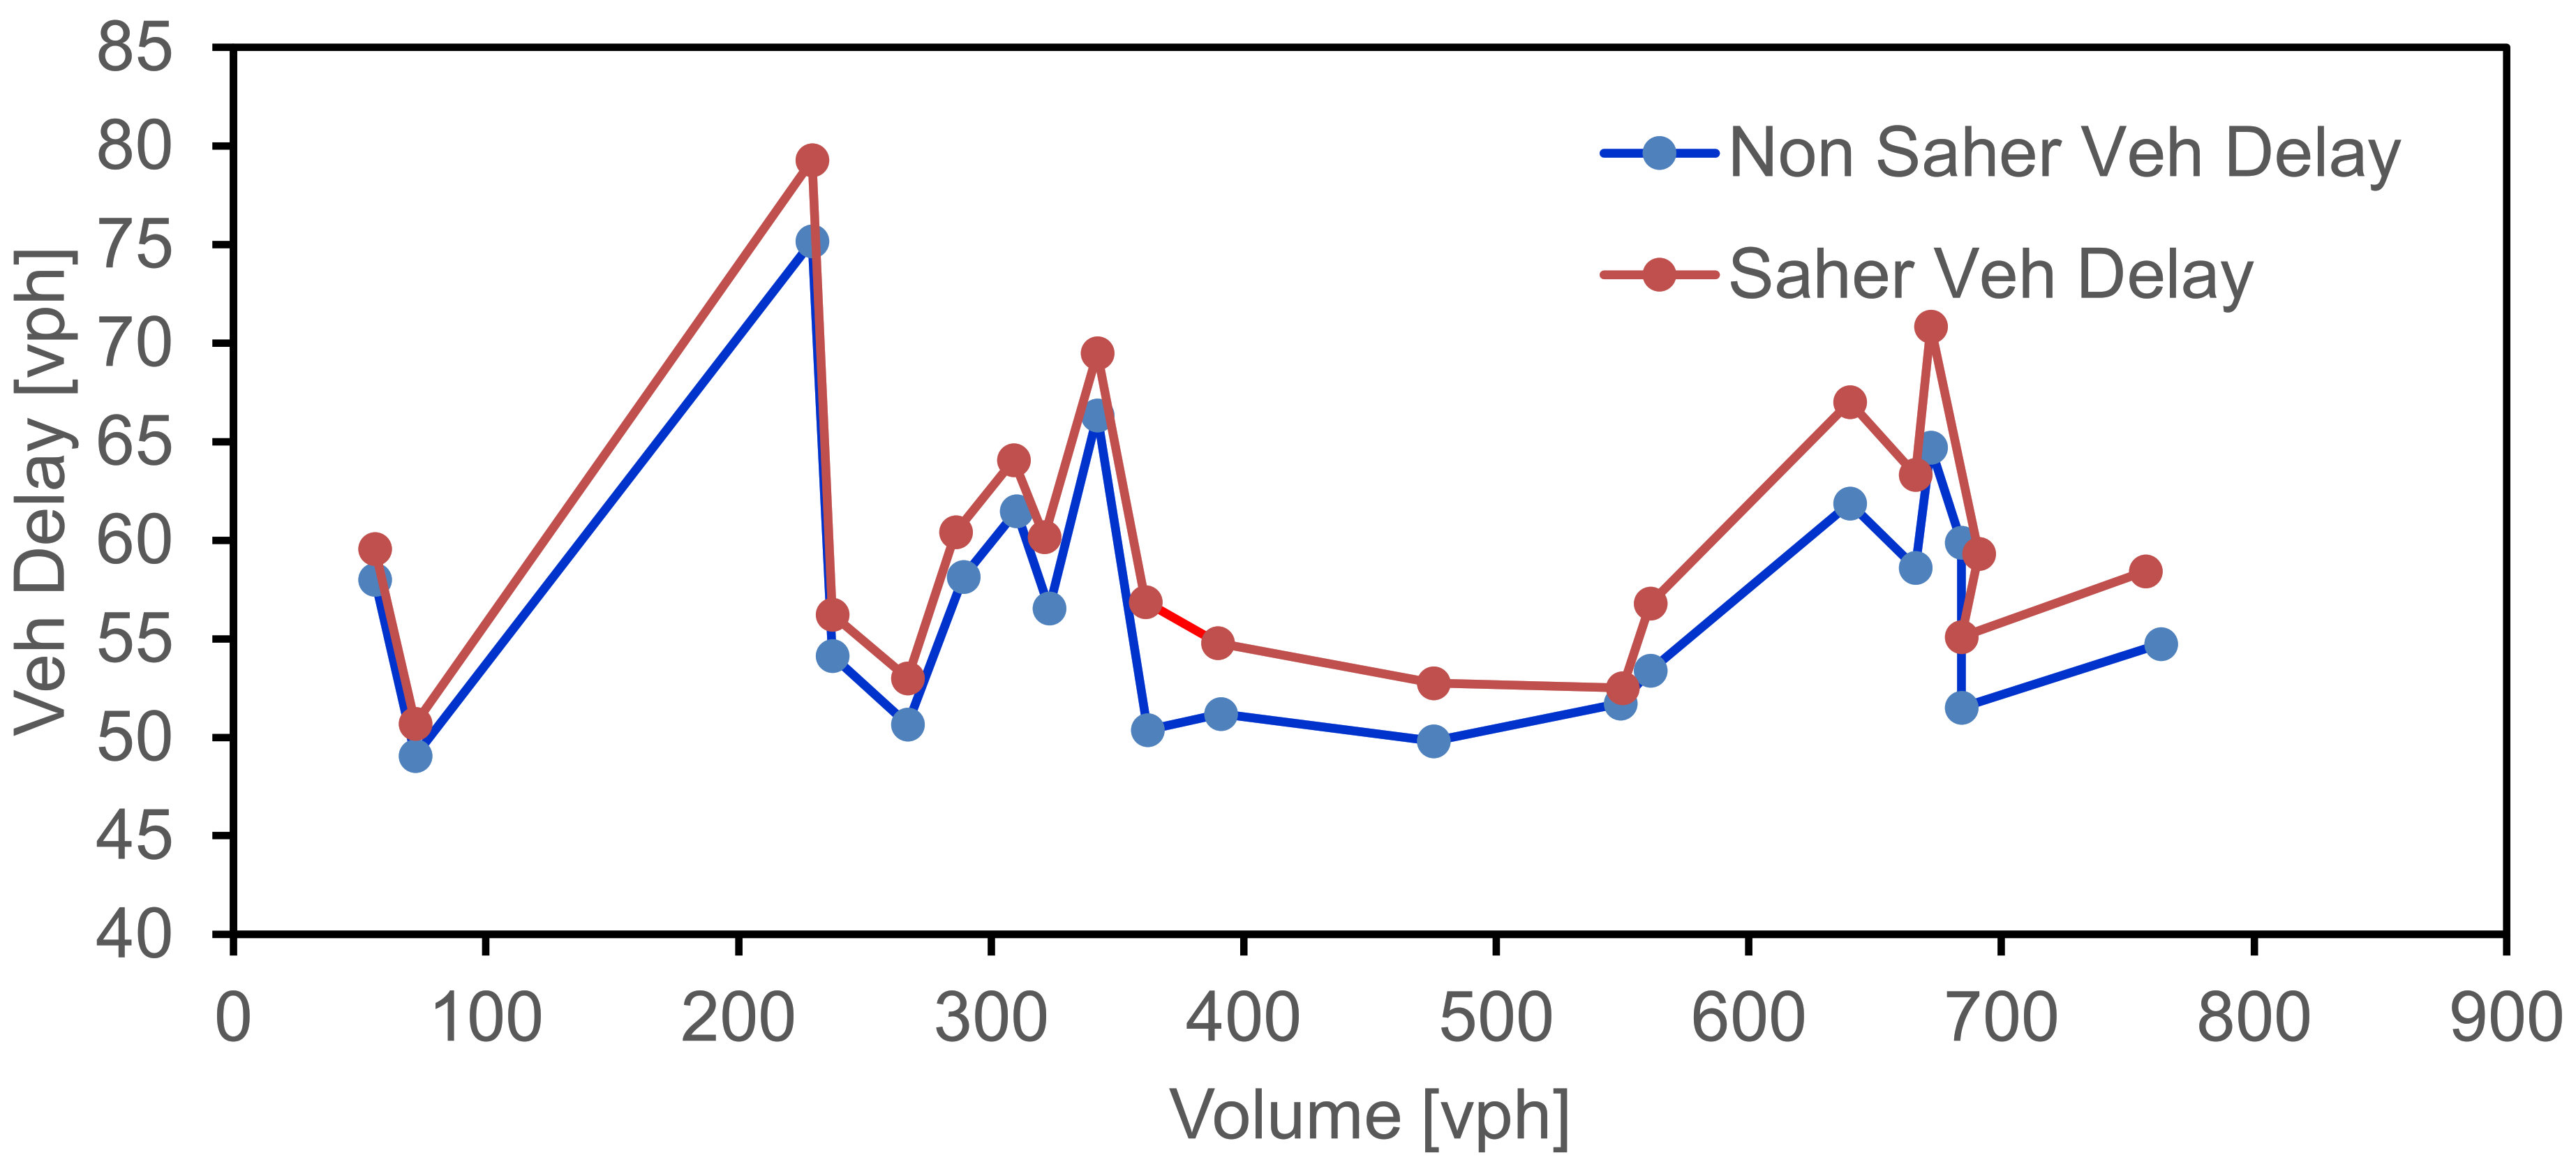
The impact of SAHER versus non-SAHER on intersections operating with flashing green was evaluated on driver behavior (perception reaction) and consequently the vehicle delays and queue lengths. It was observed that the current implemented signal timing complemented with flashing green and RLC, known as SAHER in KSA, institutively worsens the intersection operations. The flashing green interval was implemented on several signalized intersections in the Qassim region to significantly increase the drivers’ perception that the change interval was about to rise. The motorists who encounter a flashing green most probably decide to slow down or come to a sudden stop to avoid RLC fine, even if they can proceed safely before the end of the green interval. The research findings defend the hypothesis that the flashing green complimented with RLC might interrupt the total throughputs of an approach and increase the vehicle delay and the level of service of an intersection. The flashing green interval caused significant delay along the studied signalized intersections approaches during the evening peak period. The study was conducted to assess the signalized intersections operations before and after the implementation of flashing green interval complimented with RLC. The analysis was conducted using proper factors to evaluate each pattern of SAHER and Non SAHER scenarios. The calibrated microscopic simulation (VISSIM) model was used to study SAHER and Non-SAHER scenarios during PM peak periods, representing the critical flow conditions. The comparative results of average intersection delay for SAHER and non-SAHER scenarios are shown in Table 5 and Figure 4. It is evident from the results that average vehicle delay for intersections operating with SAHER have delay estimates slightly greater than those without SAHER installation. This observation is intuitive as the drivers are more cautious and afraid of getting RLC running ticket when passing through intersections with SAHER, leaving part of the green indication or amber light utilized and causing greater vehicle delays [34,39]. The largest deviation between the average delay measure (7%) for SAHER versus non-SAHER scenarios was observed at Herfy Intersection, while the lowest difference between the two scenarios was witnessed at Sa’a Intersection. Overall, the research outputs reflect an increase in the intersection vehicle delay that implements flashing green intervals complimented with SAHER cameras.
Similarly, analyses were performed for queue lengths for both SAHER and non-SAHER scenarios. However, dissimilar to the average delay, the maximum queue length measurement was observed to be significantly longer at signalized intersections implementing the flashing green interval and SAHER Cameras compared to their counterparts. The corresponding results are shown in Table 6 and Figure 5. The greatest deviation between the queue lengths for SAHER and non-SAHER intersections was witnessed at Khandak Intersection, which was around 22%, while Sa’a Intersection the difference between two scenarios was the lowest (12%). To sum up, a flashing green interval complimented with SAHER cameras fairly increased the vehicle delay and the maximum queue length measurements along the studied signalized intersections during the PM peak period. Since the drivers approaching the dilemma zones of flashing green lights with SAHER enforcement fail to completely use the time allocated for permitted movement, longer queues downstream of the intersections may be expected. Although the SAHER scenario may lead to longer queue lengths (as shown in Figure 5), they have positive implications and benefits for traffic safety improvement. Intersections without SAHER enforcement usually have more number of citations or ticket issues for speeding as well RLC compared to those with SAHER. Further, the installation of SAHER enforcement not only improves the drivers’ safety but also the safety of pedestrians crossing the signalized crossings. Frequently a reasonable trade-off between traffic safety and operational efficiency at signalized intersection junctions is established.

6.3. Statistical Analysis for Mean Differences of SAHER versus Non-SAHER Scenarios

The paired t-test is a hypothesis test based on mean differences. In this study, the authors conducted a statistical paired t-test on a sample of signal timing observations to investigate the mean differences for two scenarios (SAHER versus Non-SAHER) for the corresponding values of selected traffic performance measures (delay and queue lengths). The sample of observations was approximately considered normally distributed. The analysis was run to assess the mean difference between the non-SAHER scenario and SAHER Scenario implementing flashing Green interval complimented with RLC. The statistical analysis was developed with the hypothesis of no significant differences between the non-SAHER scenario and the SAHER Scenario. The following tables (Table 7 and Table 8) illustrate the summary of the paired t-test results and findings.
The paired t-test statistical analysis was conducted on the mean differences for four traffic measurement parameters of the two scenarios known as SAHER and Non-SAHER scenarios. The traffic measurement parameters were highlighted in Table 8 as Qlength Y 1, Qlength Y 1N, Veh delay Y3, and Veh delay Y3N. The paired t-test was run on a sample of almost 50 observations of queue length for SAHER and Non-SAHER scenarios to assess the mean differences between SAHER (Qlen Y 1) and Non-SAHER (Qlength Y 1N). The analysis was additionally run on a sample of almost 50 observations of vehicle delay (sec) of SAHER and Non-SAHER scenarios to assess the mean differences between SAHER (Veh delay Y3) and Non-SAHER (Veh delay Y3N). The paired t-test found a significant difference between the mean of the queue length parameters on SAHER and non-SAHER, (Qlen Y 1) versus (Qlength Y 1N) at 95% confidence. Furthermore, the paired t-test analysis represented a significant difference between the mean of the vehicle delay parameters on SAHER and non-SAHER, (Veh delay Y3) versus (Veh delay Y3N). In conclusion, the study found that the implementation of flashing green interval complimented with RLC, well known as SAHER in KSA has interrupted the overall throughputs of signalized intersections and increased the vehicle delay (sec) and queue length (m), but it might reduce the right angle and severe or fatal crashes rate.

7. Conclusions and Recommendations

Flashing green lights at signalized intersections were obtained interrupt the driving behavior in the dilemma zone and, consequently, the operational efficiency of the network. Provisions of flashing green lights provide drivers with a little extra time to stop or pass the intersection. Since the use of a flashing green signal at the end of the green indication is optional, it is up to traffic engineers to decide (based on criterion as traffic efficiency and safety) whether to provide it. Similarly, the presence of traffic enforcement (speed cameras or RLCs) at intersections also interferes with driver behavior since drivers tend to be more cautious when passing through such intersections. In literature, few studies have investigated the drivers’ perception to flashing green traffic signals worldwide; however, no previous study has evaluated the same for the KSA driving conditions.
The present research work was aimed to examine the impact of flashing green signals complemented with and without SAHER on driver behavior and traffic operation at five signalized intersections in the Al-Qassim province of KSA. Traffic analyses were performed using the microscopic traffic simulation tool VISSIM after thorough calibration of the model. The developed micro-simulation model was validated using two performance measures, including turning movements’ counts and queue lengths. The impact of traffic enforcement (SAHER) versus non-SAHER on intersections operating with and without flashing green was evaluated on driver behavior (perception reaction) and the corresponding average vehicle delays and vehicle queue lengths. Results showed that presence of flashing green complemented with SAHER deteriorated the traffic efficiencies at intersections. Further, current condition of all the intersections showed a congested situation with LOS E and queue lengths going as higher as 109 m, with an average queue length of over 90 m for all the intersections. It was observed when the signal turns blinking green, drivers react to it as a part of clearance interval time. Therefore, the majority of the drivers decelerate and stop as they approach the clearance interval phase which in actually starts from yellow time. Simulation results also indicated that all non-SAHER signalized intersections witnessed a reduction in the maximum queue lengths with no improvements in the level of services compared to flashing green and SAHER scenarios. Finally, paired t-tests were conducted to evaluate the mean differences of selected performance measures (delay and queue lengths) under different flashing green and SAHER scenarios. Results revealed that the differences between mean vehicle delay and queue length parameters for SAHER and non-SAHER scenarios were statistically significant. The results of the present studies reinforce the findings of several previous related studies. For example, previous studies also reported that intersections operated with flashing green would have longer queue lengths and greater number of stops compared to traditional signal control strategy without flashing green [24,25]. Similarly, studies also indicated that the installation of flashing green would reduce the dilemma zone and will shorten the utilization of amber signal indication [25,27]. These observations were also supported by the current study. Similarly, it was observed that installing traffic enforcement (SAHER) in conjunction with flashing green will make the driver overcautious, leading to further loss of useful time for permitted (green) phase movement. Previous research has also shown that presence of traffic enforcement at intersections was associated with a slight reduction in intersection throughput [34,39,43].
The outcome of this research study is expected to provide useful insights to traffic engineers and practitioners for effective control and management of traffic at signalized intersections. In the future, the study can be extended from different prospects. It is essential to highlight the fact that longer cycle times generally cause more delays and long queues due to more waiting time at each approach; therefore, it is important to investigate the performance of flashing green signals under the adaptive traffic control system. Further, studies should focus on safety impact and conflict analysis of intersections equipped with flashing green and complemented with traffic enforcement. Similarly, the findings of this study may be confirmed by larger-scale field studies in the future. Similarly, in the future, the investigation can be expanded to different aspects, including the energy consumption and emissions of vehicles [44,45].

Author Contributions

Conceptualization, M.S.A. and A.A.; methodology, A.A.; software, A.A.; validation, A.A.; formal analysis, M.S.A. and A.A.; investigation, M.S.A.; resources, M.S.A.; data curation, M.S.A.; writing—original draft preparation, A.A.; writing—review and editing, M.S.A.; visualization, M.S.A.; supervision, M.S.A.; project administration, M.S.A.; and funding acquisition, M.S.A. All authors have read and agreed to the published version of the manuscript.

Funding

The authors gratefully acknowledge Qassim University, represented by the Deanship of Scientific Research, on the financial support for this research under the number (10375-enuc-2020-1-1-W) during the academic year 1442AH/2020 AD.

Institutional Review Board Statement

Not applicable.

Informed Consent Statement

Not applicable.

Data Availability Statement

The supplementary data used in the work can be obtained from the corresponding author upon reasonable requests.

Acknowledgments

The authors appreciate and acknowledge the support of the Deanship of Scientific Research (DSR) for supporting this study.

Conflicts of Interest

The authors declare no conflict of interest.

References

  1. Jamal, A.; Rahman, M.T.; Al-Ahmadi, H.M.; Ullah, I.M.; Zahid, M. Intelligent Intersection Control for Delay Optimization: Using Meta-Heuristic Search Algorithms. Sustainability 2020, 12, 1896. [Google Scholar] [CrossRef] [Green Version]
  2. Long, K.; Han, L.D.; Yang, Q. Effects of Countdown Timers on Driver Behavior after the Yellow Onset at Chinese Intersections. Traffic Inj. Prev. 2011, 12, 538–544. [Google Scholar] [CrossRef] [PubMed]
  3. Huang, M.; Fujita, M.; Wisetjindawat, W. Countdown Timers, Video Surveillance and Drivers’ Stop/Go Behavior: Winter versus Summer. Accid. Anal. Prev. 2017, 98, 185–197. [Google Scholar] [CrossRef] [PubMed]
  4. Limanond, T.; Chookerd, S.; Roubtonglang, N. Effects of Countdown Timers on Queue Discharge Characteristics of through Movement at a Signalized Intersection. Transp. Res. Part Emerg. Technol. 2009, 17, 662–671. [Google Scholar] [CrossRef]
  5. Mahalel, D.; Zaidel, D.M. Safety Evaluation of a Flashing-Green Light in a Traffic Signal. Traffic Eng. Control. 1985, 26, 79–81. [Google Scholar]
  6. Al-Turki, M.; Jamal, A.; Al-Ahmadi, H.M.; Al-Sughaiyer, M.A.; Zahid, M. On the Potential Impacts of Smart Traffic Control for Delay, Fuel Energy Consumption, and Emissions: An NSGA-II-Based Optimization Case Study from Dhahran, Saudi Arabia. Sustainability 2020, 12, 7394. [Google Scholar] [CrossRef]
  7. Pazzini, M.; Cameli, L.; Lantieri, C.; Vignali, V.; Dondi, G.; Jonsson, T. New Micromobility Means of Transport: An Analysis of E-Scooter Users’ Behaviour in Trondheim. Int. J. Environ. Res. Public Health 2022, 19, 7374. [Google Scholar] [CrossRef]
  8. Zafri, N.M.; Tabassum, T.; Himal, M.R.H.; Sultana, R.; Debnath, A.K. Effect of Pedestrian Characteristics and Their Road Crossing Behaviors on Driver Yielding Behavior at Controlled Intersections. J. Saf. Res. 2022, 81, 1–8. [Google Scholar] [CrossRef]
  9. Ahmed, T.; Moeinaddini, M.; Almoshaogeh, M.; Jamal, A.; Nawaz, I.; Alharbi, F. A New Pedestrian Crossing Level of Service (PCLOS) Method for Promoting Safe Pedestrian Crossing in Urban Areas. Int. J. Environ. Res. Public Health 2021, 18, 8813. [Google Scholar] [CrossRef]
  10. Toledo, T.; Koutsopoulos, H.N.; Davol, A.; Ben-Akiva, M.E.; Burghout, W.; Andréasson, I.; Johansson, T.; Lundin, C. Calibration and Validation of Microscopic Traffic Simulation Tools: Stockholm Case Study. Transp. Res. Rec. 2003, 1831, 65–75. [Google Scholar] [CrossRef]
  11. Al-Ahmadi, H.M.; Jamal, A.; Reza, I.; Assi, K.J.; Ahmed, S.A. Using Microscopic Simulation-Based Analysis to Model Driving Behavior: A Case Study of Khobar-Dammam in Saudi Arabia. Sustainability 2019, 11, 3018. [Google Scholar] [CrossRef]
  12. Jamal, A.; Mahmood, T.; Riaz, M.; Al-Ahmadi, H.M. GLM-Based Flexible Monitoring Methods: An Application to Real-Time Highway Safety Surveillance. Symmetry 2021, 13, 362. [Google Scholar] [CrossRef]
  13. Al-Ahmadi, H.M.; Jamal, A.; Ahmed, T.; Rahman, M.T.; Reza, I.; Farooq, D. Calibrating the Highway Safety Manual Predictive Models for Multilane Rural Highway Segments in Saudi Arabia. Arab. J. Sci. Eng. 2021, 46, 11471–11485. [Google Scholar] [CrossRef]
  14. Almoshaogeh, M.; Abdulrehman, R.; Haider, H.; Alharbi, F.; Jamal, A.; Alarifi, S.; Shafiquzzaman, M. Traffic Accident Risk Assessment Framework for Qassim, Saudi Arabia: Evaluating the Impact of Speed Cameras. Appl. Sci. 2021, 11, 6682. [Google Scholar] [CrossRef]
  15. Jamal, A.; Zahid, M.; Tauhidur Rahman, M.; Al-Ahmadi, H.M.; Almoshaogeh, M.; Farooq, D.; Ahmad, M. Injury Severity Prediction of Traffic Crashes with Ensemble Machine Learning Techniques: A Comparative Study. Int. J. Inj. Control. Saf. Promot. 2021, 28, 408–427. [Google Scholar] [CrossRef] [PubMed]
  16. Jamal, A.; Rahman, M.T.; Al-Ahmadi, H.M.; Mansoor, U. The Dilemma of Road Safety in the Eastern Province of Saudi Arabia: Consequences and Prevention Strategies. Int. J. Environ. Res. Public Health 2020, 17, 157. [Google Scholar] [CrossRef] [Green Version]
  17. Zahid, M.; Jamal, A.; Chen, Y.; Ahmed, T.; Ijaz, M. Predicting Red Light Running Violation Using Machine Learning Classifiers. In Green Connected Automated Transportation and Safety; Springer: Berlin/Heidelberg, Germany, 2022; pp. 137–148. [Google Scholar]
  18. Almadi, A.I.M.; Al Mamlook, R.E.; Almarhabi, Y.; Ullah, I.; Jamal, A.; Bandara, N. A Fuzzy-Logic Approach Based on Driver Decision-Making Behavior Modeling and Simulation. Sustainability 2022, 14, 8874. [Google Scholar] [CrossRef]
  19. Moslem, S.; Farooq, D.; Jamal, A.; Almarhabi, Y.; Almoshaogeh, M.; Butt, F.M.; Tufail, R.F. An Integrated Fuzzy Analytic Hierarchy Process (AHP) Model for Studying Significant Factors Associated with Frequent Lane Changing. Entropy 2022, 24, 367. [Google Scholar] [CrossRef]
  20. Farooq, D.; Moslem, S.; Jamal, A.; Butt, F.M.; Almarhabi, Y.; Faisal Tufail, R.; Almoshaogeh, M. Assessment of Significant Factors Affecting Frequent Lane-Changing Related to Road Safety: An Integrated Approach of the AHP–BWM Model. Int. J. Environ. Res. Public Health 2021, 18, 10628. [Google Scholar] [CrossRef]
  21. Zahid, M.; Chen, Y.; Khan, S.; Jamal, A.; Ijaz, M.; Ahmed, T. Predicting Risky and Aggressive Driving Behavior among Taxi Drivers: Do Spatio-Temporal Attributes Matter? Int. J. Environ. Res. Public Health 2020, 17, 3937. [Google Scholar] [CrossRef]
  22. Becker, M. A Study of the Effect of a “Flashing Green” Phase in Traffic Signals at Urban Intersections; Technion Research and Development Foundation Ltd.: Haifa, Israel, 1971. [Google Scholar]
  23. Hakkert, A.-S.; Mahalel, D. Effect of Traffic Signals on Road Accidents–with Special Reference to the Introduction of a Blinking Green Phase. Traffic Eng. Control. 1978, 19, 212–215. [Google Scholar]
  24. Köll, H.; Bader, M.; Axhausen, K.W. Driver Behaviour during Flashing Green before Amber: A Comparative Study. Accid. Anal. Prev. 2004, 36, 273–280. [Google Scholar] [CrossRef]
  25. Shen, J.; Wang, W. Effects of Flashing Green on Driver’s Stop/Go Decision at Signalized Intersection. J. Cent. South Univ. 2015, 22, 771–778. [Google Scholar] [CrossRef]
  26. Awad, W. Drivers’ Behavior at Signalized Intersections Operating with Flashing Green: Comparative Study. Civ. Environ. Res. 2014, 36, 273–280. [Google Scholar]
  27. Kocić, A.; Čelar, N.; Kajalić, J.; Stanković, S. Flashing Green Effects on Traffic Efficiency. J. Road Traffic Eng. 2020, 66, 27–31. [Google Scholar] [CrossRef]
  28. Dong, S.; Shen, F.; Jiang, L.; Ye, K. Research on the Impact of Flashing Green Lights on E-Bike Drivers’ Behavior. In CICTP 2014: Safe, Smart, and Sustainable Multimodal Transportation Systems; ASCE: Reston, VA, USA, 2014; pp. 2185–2191. [Google Scholar]
  29. Factor, R.; Prashker, J.N.; Mahalel, D. The Flashing Green Light Paradox. Transp. Res. Part Traffic Psychol. Behav. 2012, 15, 279–288. [Google Scholar] [CrossRef]
  30. Huang, H.; Wang, D.; Zheng, L.; Li, X. Evaluating Time-Reminder Strategies before Amber: Common Signal, Green Flashing and Green Countdown. Accid. Anal. Prev. 2014, 71, 248–260. [Google Scholar] [CrossRef]
  31. Hussain, Q.; Alhajyaseen, W.; Brijs, K.; Pirdavani, A.; Brijs, T. Improved Traffic Flow Efficiency during Yellow Interval at Signalized Intersections Using a Smart Countdown System. IEEE Trans. Intell. Transp. Syst. 2020, 23, 1959–1968. [Google Scholar] [CrossRef]
  32. Tang, K.; Xu, Y.; Wang, P.; Wang, F. Impacts of Flashing Green on Dilemma Zone Behavior at High-Speed Intersections: Empirical Study in China. J. Transp. Eng. 2015, 141, 04015005. [Google Scholar] [CrossRef]
  33. Palat, B.; Delhomme, P. A Simulator Study of Factors Influencing Drivers’ Behavior at Traffic Lights. Transp. Res. Part Traffic Psychol. Behav. 2016, 37, 107–118. [Google Scholar] [CrossRef]
  34. Baratian-Ghorghi, F.; Zhou, H.; Wasilefsky, I. Effect of Red-Light Cameras on Capacity of Signalized Intersections. J. Transp. Eng. 2016, 142, 04015035. [Google Scholar] [CrossRef]
  35. Sun, J.; Dong, S.; Bing, X.; Ni, Y. Comparative Study of Impacts of Red Light Cameras in China. Transp. Res. Rec. 2012, 2317, 68–75. [Google Scholar] [CrossRef]
  36. Almutairi, O.; Wei, H. Effect of Speed/Red-Light Cameras and Traffic Signal Countdown Timers on Dilemma Zone Determination at Pre-Timed Signalized Intersections. Accid. Anal. Prev. 2021, 154, 106076. [Google Scholar] [CrossRef] [PubMed]
  37. Baratian-Ghorghi, F.; Zhou, H.; Franco-Watkins, A. Effects of Red Light Cameras on Driver’s Stop/Go Decision: Assessing the Green Extension Hypothesis. Transp. Res. Part Traffic Psychol. Behav. 2017, 46, 87–95. [Google Scholar] [CrossRef]
  38. Baratian-Ghorghi, F.; Zhou, H. Effects of Photo Enforcement Cameras on Intersection Delays and Driver Behavior. In Proceedings of the Transportation Research Board 95th Annual Meeting, Washington, DC, USA, 10–14 January 2016. [Google Scholar]
  39. Jha, M.K.; Weldegiorgis, Y. A Probabilistic Approach to Calculate Capacity of Signalized Intersections with a Red Light Camera. J. Adv. Transp. 2014, 48, 348–361. [Google Scholar] [CrossRef]
  40. Gates, T.; Savolainen, P.T.; Maria, H.-U. Impacts of Automated Red Light Running Enforcement Cameras on Driver Behavior. 2014. Available online: https://trid.trb.org/view/1287560 (accessed on 5 October 2022).
  41. Manual, H.C. HCM2010; Transportation Research Board; National Research Council: Washington, DC, USA, 2010; p. 1207. [Google Scholar]
  42. Al-Ahmadi, H.M.; Reza, I.; Jamal, A.; Alhalabi, W.S.; Assi, K.J. Preparedness for Mass Gatherings: A Simulation-Based Framework for Flow Control and Management Using Crowd Monitoring Data. Arab. J. Sci. Eng. 2021, 46, 4985–4997. [Google Scholar] [CrossRef]
  43. Marshall, R.L. An Empirical Assessment of the Impact of Red Light Cameras on the Capacity of Urban Signalized Intersections; Morgan State University: Baltimore, MD, USA, 2006. [Google Scholar]
  44. Nagy, J.; Lakatos, I. Possibilities of Using of Online Vehicle Diagnostics in the Future. In Vehicle and Automotive Engineering; Springer: Berlin/Heidelberg, Germany, 2023; pp. 71–83. [Google Scholar]
  45. Lakatos, I.; Szauter, F.; Pup, D.; Nagy, A. Alternative Propulsion Buses in the Metropolitan Public Transport. In Vehicle and Automotive Engineering; Springer: Berlin/Heidelberg, Germany, 2020; pp. 49–66. [Google Scholar]
Figure 1. Camera position during a typical data collection scenario.
Sustainability 14 14879 g001
Figure 2. Process of microsimulation inside PTV VISSIM.
Sustainability 14 14879 g002
Figure 3. Methodology for the traffic analysis.
Sustainability 14 14879 g003
Figure 4. Vehicle delay comparisons for SAHER and Non-SAHER scenarios.
Sustainability 14 14879 g004
Figure 5. Maximum queue length for SAHER and Non-SAHER scenarios.
Sustainability 14 14879 g005
Table 1. Signalized intersection with RLC and flashing green.
Sr. NoSignalized IntersectionsAreaRLC/SAHER
1Herfy Intersection–
Prince Sultan and Shabili road
UnayzahYes
2Sa’a Intersection–
King Abdulaziz and Shabili road
UnayzahYes
3Khandak Intersection–
Umar bin Khattab and West ring road
UnayzahYes
4Burj Intersection–
King Abdulaziz and Prince Faisal road
BuraydahYes
5Qanat Intersection–
King Faisal and Al Qanat road
BuraydahYes
Table 2. Input parameters for SAHER and flashing green (base conditions).
Sr No.Parameters within VISSIMSAHER or RLC with Flashing Green
1Standstill distance for first vehicle before Traffic Signal Selected value of 1 m
Video analysis of signals show cars standing well before the stopping line to avoid ticket
2Behavior at the red/amber state of the signalStop (same as red)
based on video analysis
3Reaction time distribution1.60–1.65 s
based on video analysis
4Reaction to amber signalDefault values in VISSIM
5CC0 (Standstill distance)
CC1 (Headway time)
CC0 = 2.5 m
CC1 = 2.2 s
based on video analysis
Table 3. Input parameters for the Non-SAHER and no flashing green scenario.
Sr No.Parameters within VISSIMNo SAHER or RLC without Flashing Green
1Standstill distance for first vehicle before Traffic Signal Not selected
If this option is not selected, the vehicles use a normally distributed random value
2Behavior at red/amber state of signalGo (Same as green)
based on video analysis
3Reaction time distributionNo time distribution selected the vehicles use a normally distributed random value
4Reaction to amber signalDefault values for a state where cars continue driving for longer when there is an amber light VISSIM
5CC0 (Standstill distance)
CC1 (Headway)
Default values of VISSIM
Table 4. Validation based on the maximum queue length.
Sr NoMovements/ApproachesMaximum Queue Model
Result
Maximum Queue Data ResultPercentage Difference
Herfy IntersectionPrince Sultan NB94940.00%
Prince Sultan SB77761.32%
Ash Shabili WB1231220.82%
Ash Shabili EB1401307.69%
Average Queue Lengths108.5105.52.8%
Sa’a Intersection King Abdulaziz NB67628.06%
King Abdulaziz SB68629.68%
Ash Shabili WB83769.21%
Ash Shabili EB90882.27%
Average Queue Lengths77726.9%
Burj IntersectionKing Abdulaziz NB1091209.17%
King Abdulaziz SB1081008.00%
Prince Faisal WB53506.00%
Prince Faisal EB42405.00%
Average Queue Lengths7877.50.6%
Khandak IntersectionAbubakr Street NB96932.95%
Abubakr Street SB81774.83%
Umar Street WB81801.66%
Umar Street EB54550.95%
Average Queue Lengths7876.252.3%
Qanat IntersectionQanat Street NB102957.45%
Qanat Street SB76782.60%
King Faisal Street WB81821.29%
King Faisal Street EB961025.43%
Average Queue Lengths88.789.20.6%
Table 5. Average vehicle delay between SAHER and Non-SAHER scenarios.
IntersectionsSAHER/RLCNon-SAHER/NO RLCPercentage Difference in Delay
Average Vehicle Delay (sec)Average Vehicle Delay (sec)
Herfy Intersection71.9067.31−7%
Sa’a Intersection55.8754.70−2%
Burj Intersection60.9257.53−6%
Khandak Intersection62.3559.82−4%
Qanat Intersection57.4454.57−5%
Table 6. Maximum queue length for SAHER and Non-SAHER scenarios.
IntersectionsSAHER/RLCNon SAHER/NO RLCPercentage Difference in Queue Length
Qlen Max (m)Qlen Max (m)
Herfy Intersection10990−21%
Sa’a Intersection7768−12%
Burj Intersection7869−13%
Khandak Intersection7864−22%
Qanat Intersection8976−17%
Table 7. Vehicle delay and Q-length paired t-test of SAHER and NON-SAHER.
Parameters MeanStd. DeviationStd. Error Mean95% Confidence Interval of the Difference
LowerUpper
Qlen (m) Y1Y1 Y1N12.874507.104371.1233010.6024115.14659
Veh delay (s) Y3Y3 Y3N2.902501.658210.262192.372183.43282
Table 8. t-values for differences in Vehicle delay and Q-length for both Scenarios.
Parameters in Question tSig. (2-Tailed)
Qlen (m) Y1Y1 Y1N11.4614.69 × 10−14
Veh delay (s) Y3Y3 Y3N11.0701.33 × 10−13
Publisher’s Note: MDPI stays neutral with regard to jurisdictional claims in published maps and institutional affiliations.