Abstract
Edaphic properties have been widely shown to influence community composition and distribution. However, the degree to which edaphic factors can affect grasses in semi-arid lowlands is still little researched. We assessed the significance of nine edaphic factors to explain the distributions of 65 grass species with various ecological traits (i.e., the ecological indicator values for their preferred habitat) in the semi-arid lowlands of Pakistan. To record information on species composition and related ecological conditions, we selected 10 random sampling locations between 2020 and 2021. For each species, we determined the important value index (IVI) and looked at the primary indicator species that were identified using the indicator species analysis approach. The major genera were Setaria, Brachiaria, and Cenchrus with 6.15% species in each followed by Aristida, Panicum, and Eragrostis with 4.61% wild grass species, Bothriochloa, Bromus, Phragmites, Polypogon, Saccharum, Poa, Echinochloa, and Dactyloctenium with 3.07% species, whereas other genera had a single species each. In total, 80% of the species were native, while only 20% were introduced species. Microphylls accounted for 49.23% of the leaf size spectra of the grass flora in the study area. The other frequent traits included macrophylls (21.53%), nanophylls (20%), and leptophylls (9.23%). The major life forms were therophytes (56.92%) followed by hemicryptophytes (38.46%) and geophytes (4.61%). The results of an ordination analysis indicated that the distribution of grasses was significantly (p ≤ 0.002) influenced by several edaphic parameters, with pH having the greatest impact on species distribution. The analyses of indicator species showed that pH and EC were the most powerful and important edaphic factors for determining the composition of plant communities and indicator species. The significant indicator species in various ecosystems were Cynodon dactylon (L.) Pers. rainer.bussmann@smnk.de and Leptochloa chinensis (L.) Nees (agroecosystem), Brachiaria reptans (L.) C.A. Gardner and C.E. Hubb, Dichanthium annulatum (Forssk.) Stapf, and Saccharum spontaneum L. (forest ecosystem), Cenchrus biflorus Roxb., Cenchrus ciliaris L., and Desmostachya bipinnata (L.) Stapf (urban ecosystem), Arundo donax L., Echinochloa crus-galli, and Phragmites australis (wetland ecosystem), and Saccharum spontaneum and Echinochloa crus-galli (L.) P. Beauv. (riparian ecosystem). We discovered that different species groupings had different habitat preferences and that soil pH had a significant beneficial effect on plant variety. These results provide a scientific roadmap for soil and plant restoration in semi-arid lowland habitats.
1. Introduction
The composition of plant communities and the functional traits of the plants that are associated with them are influenced by the diversity of habitat that is made possible by the local environmental conditions [1]. On a range of parent materials and soil types in combination with regional diversity in environmental conditions, floristic communities with diverse functional features may grow as a result of changes in resource availability [2,3]. These filters search for particular features or feature anomalies in a methodical manner. While more fruitful and disturbed habitats favor species with an “opportunistic growth strategy”, nutrient-poor and stable conditions, for instance, tend to favor species with a “stress-tolerant development strategy” [4]. Consequently, topographic environmental gradients and disturbance regimes may alter the functional traits of the locally established plant community, such as the longevity, mean growth rate, etc., which would impact the species composition and spatial dynamics in the area [5]. In any location, environmental conditions impact the composition of the vegetation, distribution, the coexistence of species, and the adaption of species in a given area with regard to climate, edaphic, and anthropogenic effects.
Numerous studies have demonstrated that edaphic characteristics affect the location and composition of communities [6,7]. To predict how plants will react to impending environmental changes, the relationship between edaphic variation and plant diversity must be quantified [8]. The development and heterogeneity of habitats are significantly impacted by edaphic conditions, which also change the structure of communities and the dynamics of space [8,9]. In addition to encouraging functional diversity in areas with more diverse environments, such regional variance in edaphic features also selects for unique traits in local habitats within a region [10]. The effects of several connected factors can thus be separated using edaphic variation, which also provides a great environment for assessing the relative importance of the assembly mechanisms that drive diversification patterns [11,12,13].
Poaceae, the largest flowering plant family, with great environmental adaptability, dominate around 20% of all land areas in any habitat and phytogeographical zone on earth [14]. Because grasses are important for the diet of many species, including humans, Poaceae have ecological dominance in terms of nutrition. Poaceae make up about 15% of monocots [15]. Poaceae provide the bulk of human food and a variety of livestock feed and forage [16,17]. The indigenous Poaceae flora in Pakistan maintains soil integration, moisture retention, and porosity for air infiltration while also serving as a substantial source of nutrition for animals [18]. Wild Poaceae species are the main source of income, particularly for rural areas [19]. Grass plays a critical role in ecosystem formation and conservation in many types of climates, from alpine to xeric situations, by routinely enhancing primary production, meeting nutrient needs, and supplying humus to the soil [20].
Little is known about the ecological factors affecting Poaceae in Pakistan, particularly in the semi-arid lowland region of Punjab. However, the relationship between edaphic variables and plant diversity in semi-arid lowland habitats is still poorly understood [21]. Numerous quantitative factors can be used to explain the structure of vegetation. Given that it accurately analyses vegetation structure, quantitative analysis is needed for long-term ecological study planning and interpretation [22], including information on life forms and leaf size spectrum [23,24]. Few attempts have been made to study the life forms of plants in Pakistan [25,26]. The Kasur district’s distinctive geography and climate support a great variety of plant species. However, it has not received much scientific attention.
Wide-ranging categorization and ordination are useful methods for understanding the relationships and dynamics in wild grass conservation, planning, and usage [27]. Keeping these facts in mind, the current research hypothesis was designed to accomplish the following objectives: (a) to investigate the floristic diversity of the local wild grasses, and (b) to identify the edaphic factors affecting the composition and structure of wild grasses in this region. The results of this study will enable us to develop sustainable management plans and habitat restoration techniques for wild grasses, primarily in this natural environment, with ramifications for the entire planet.
2. Materials and Methods
2.1. Study Area
The Kasur district is situated 150 to 240 m above sea level (masl) and located southeast of Lahore (31°12′ N and 74°44′ E). The total area of district Kasur is 3995 km2 and it is bordered by the River Satluj in the south and the Ravi in the north. Its northern boundary is toward the Lahore District, its eastern and southern borders are toward India, its western border is toward the Okara District, and its northern border is formed by Nankana Sahib District. Topographically, the Kasur district is a semi-arid plain and basin area of the Sutlej riverine. The Kasur district is famous for Changa Manga National Forest, Balloki Headworks, and the Ganda Singh border (Figure 1). The Kasur district has a moderate climate. During summer, the climate is hot, and the temperature rises above 40 °C. The maximum temperature is recorded during the month of June and the minimum temperature in January. The highest rainfall is recorded during July with more than 120 mm. The winter season extends from December to February. The temperature fluctuates between 6 and 20 °C. The average annual rainfall is 500 mm. The climate data (precipitation, wind speed, humidity, and temperature) of the Kasur district were acquired from the Pakistan Meterological Department (PMD) (Figure 2). Floristically, it falls in the Sahara Sindian region and hosts a significant number of plant species. The vegetation includes xerophytic and thermophilic species in the open and arid area, but riverine belts host several macrophytes. The agricultural lands host weeds and ruderal species, for instance Ageratum conyzoides L., Amaranthus viridis L., Lepidium didymum L., Chenopodium album L., Convolvulus arvensis L, Cyperus rotundus L. rainer.bussmann@smnk.de, Cynodon dactylon (L.) Pers., Oxalis corniculata L., Rumex dentatus L., Melilotus indicus (L.) All. and Eragrostis poaeoides P. Beauv. [28].
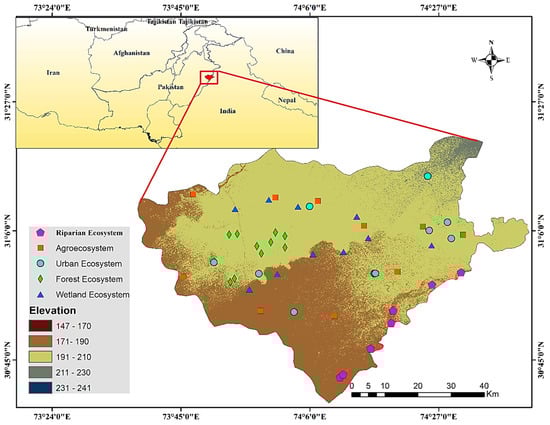
Figure 1.
Study area with elevations and sampling locations in the various ecosystems (riparian ecosystem, wetland ecosystem, urban ecosystem, forest ecosystem, and agroecosystem).
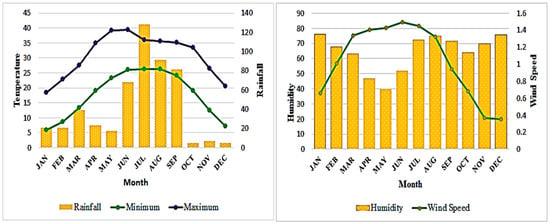
Figure 2.
Climograph showing average temperature, rainfall, humidity, and wind speed in the Kasur district.
2.2. Field Sampling
A detailed field investigation was conducted to investigate the botanical diversity in the Kasur district (Punjab) during 2020–2022. Samples were collected from the forest ecosystem (natural or planted woodland area that is suitable for the survival of both biotic and abiotic components), riparian ecosystem (floodplain areas, lands that occur along the edges of rivers, streams, lakes), agroecosystem (land managed for agricultural activities, including crop fields, farmland, and nurseries), wetland ecosystem (extensions of land that are continuously or intermittently saturated or covered with fresh, salty, brackish, or briny water), and urban ecosystem (densely settled areas including parks, roads, home gardens). On the basis of topography and vegetation richness [29], 10 sites were selected from each ecosystem. At each sampling site, 20 transects of 100 m2 in size were placed randomly at each ecosystem. On each 100 m2 transect, 20 quadrats of 5 m2 were placed systematically. From each ecosystem, 200 quadrats were sampled for exploring the ecological diversity of wild grasses. In the examined plots, the density, frequency, and cover values of each plant species were recorded, and the average values for each of the sample quadrates were computed [30,31]. Important phyto-ecological data, such as biological spectrum (life form, leaf size) and blooming seasons, were recorded for each plant. A Garmin eTrex Global Positioning System was used to determine the geographic elements of each site, such as altitude, latitude, and longitude (GPS) [2].
Grass specimens were collected during field surveys, photographed, pressed, dried, and eventually mounted as international standard-sized herbarium sheets. Using the online Flora of Pakistan (http://www.efloras.org/ accessed on 20 March 2021), all samples were identified and then cross-referenced with the floristic literature [32,33]. The taxonomy follows The Plant List ver. 1.1 (URL: http://www.theplantlist.org/ (accessed on 10 March 2021)).
2.3. Soil Sampling
The physicochemical characteristics of the soil have an impact on the dispersion of plant communities [34]. At a depth of 9 to 12 cm, soil samples were taken from each sampling site and put in a polythene bag. Rock, garbage, and gravel particles larger than 2 mm in size were removed by sifting the soil samples after the sample had been completely mixed and air-dried. The soil samples were tested for soil moisture, pH, electrical conductivity, organic carbon, and macronutrients (K, P, N, and CaCO3). A conductivity meter and a pH meter were used to determine the electrical conductivity and pH of the soil samples, respectively. The Kjeldahl method was used to get the total nitrogen (N) [35], and the Walkley–Black method was used to calculate the organic matter (OM) [36]. Calculations were made for the levels of phosphorus (P), and potassium (K), and CaCO3 was measured using the acid–base neutralization method. The moisture content (MC) of a soil sample was determined using the ScalTec moisture analyzer, which was adjusted to 110 °C [37]. The saturation percentage was calculated using the formula:
2.4. Indicator Species Analysis
To identify indicator species for each ecosystem in the semi-arid lowland region, indicator species analysis was conducted. After determining Indicator Values of each species following [38], a Monte Carlo assessment was performed to test for statistical significance. During indicator species analysis, the Relative abundance of a species in different ecosystems was calculated using the following formula:
where RAjk means Relative abundance, xkj is the abundance of species j in group k, and g means the total number of groups.
RFkj is the Relative frequency of plant j in group k, bijk is the presence or absence of plant j in group k sample I and I is the sample unit.
As a cutoff value for determining indicator species, a threshold level of 25% indication and 95% significance (p ≤ 0.05) was employed. Furthermore, the indicator species with (p ≤ 0.05) value were represented graphically with the help of PAST software (version 4.10).
2.5. Data Analysis
Microsoft Excel 2016 was used to arrange and further process the gathered phytosociological data for plants and environmental factors in preparation for analysis using the CANOCO and PAST software [26]. The diversity indices for each ecosystem were calculated using PAST software (version 4.10). CANOCO software (version 4.5) was applied to perform CCA. Using the package “factoextra” in the R 4.0.0 software, Principal Component Analysis (PCA) was carried out to illustrate the associations between various ecosystems and wild grasses [39]. Pearson correlation is a linear correlation in which a positive correlation indicates that two grass species that exhibit mutualism and have comparable environmental component needs are likely to arise concurrently, whereas a negative correlation implies the exclusive presence of two grass species in the plots due to specific ecological needs, interaction, and rivalry between them.
3. Results
3.1. Diversity and Ecological Traits
Overall, 65 wild members of Poaceae family from 40 genera were documented from the semi-arid lowlands of the Kasur district. The major genera were Setaria, Brachiaria, and Cenchrus with 6.15% species each, followed by Aristida, Panicum, and Eragrostis with 4.61% species, and Dactyloctenium, Bromus, Bothriochloa, Saccharum, Phragmites, Poa, Echinochloa, and Polypogon with 3.07% species. Other genera only included single species. In total, 80% of the species were native, while only 20% were introduced species. The dominant leaf size spectrum was microphyll (49.23%) followed by nanophyll (20%), macrophyll (21.53%), and leptophyll (9.23%). The major life form was therophyte (56.92% species) followed by hemicryptophyte (38.46%), and geophyte (4.61%) (Figure 3) (Table 1). The highest species richness was recorded in the forest ecosystem with 48 species, followed by the riparian ecosystem with 28 species, the wetland ecosystem with 25 species, the agroecosystem with 22 species, and the urban ecosystem with 18 species (Figure 4). Cynodon dactylon (L.) Pers and Echinochloa colona (L.) Link occurred in all study ecosystems. The other most frequent species recorded in different ecosystems were Chrysopogon aucheri (Boiss.) Stapf, Dichanthium annulatum (Forssk.) Stapf, Echinochloa crus-galli (L.) P. Beauv. and Phragmites karka (Retz.) Trin. ex Steud.
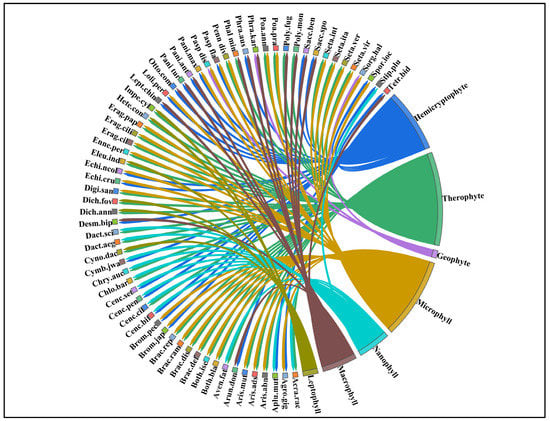
Figure 3.
Chord diagram showing the different ecological traits of wild grasses in semi-arid lowland of Punjab Pakistan.

Table 1.
List of grasses with ecological traits and p-value of indicator species analysis in different ecosystems of semi-arid lowland of Punjab, Pakistan. Legend: Nap, Nanophyll; Mip, Microphyll; Map, Macrophyll; Lep, Leptophyll; Th, Therophyte; Hc, Hemicryptophyte; Ge, Geophyte; AE, Agroecosystem; FE, Forest ecosystem; UE, Urban ecosystem; WE, Wetland ecosystem; RE, Riparian ecosystem.
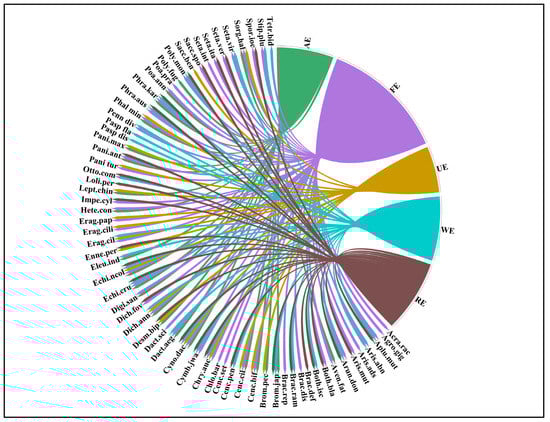
Figure 4.
Chord diagram representing the distribution of grasses in different ecosystems, i.e., RE (riverine ecosystem), WE (wetland ecosystem), FE (forest ecosystem), UE (urban ecosystem), and AE (agroecosystem) of semi-arid lowland of Punjab, Pakistan.
3.2. Species Similarities in Different Ecosystem
The studied ecosystems showed a different composition of Poaceae, and only two species, Cynodon dactylon (L.) Pers and Echinochloa colona (L.) Link occurred in all ecosystems. Dichanthium annulatum (Forssk.) Stapf were recorded from four ecosystems excepting the riparian ecosystem while Echinochloa crus-galli (L.) P.Beauv and Phragmites karka (Retz.) Trin. ex Steud were absent in the urban ecosystem. The highest number of species was recorded in (FE-RE) with eight common species followed by (FE-AE), (FE-WE) and (RE-WE) with four common species in each. Fewer similar species were recorded between (AE-WE) and (RE-UE), with only a single common species in each. The forest ecosystem harbored 11 unique species not recorded from any other ecosystem followed by the wetland and riparian ecosystems with 2 unique species in each. The urban ecosystem and agroecosystem included only a single unique grass species each (Figure 5).
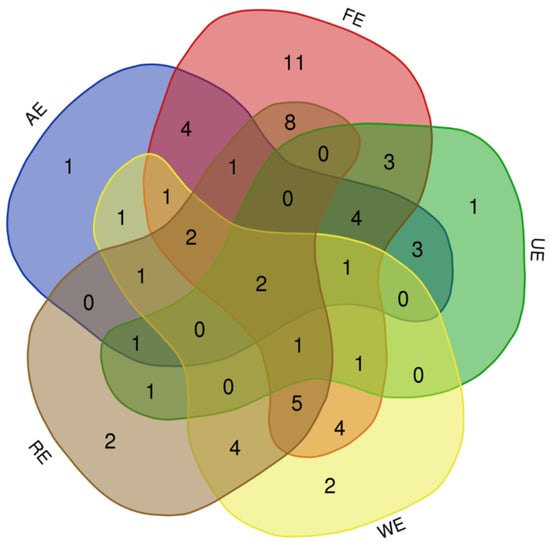
Figure 5.
Venn diagram depicting the similarities of grass species in different ecosystems of semi-arid lowland of Punjab, Pakistan.
3.3. Principal Component Analysis
Principal component analysis was applied to elucidate the species distribution and abundance patterns of the grasses to find significant connections among the species with the sampling locations of the various ecosystems. The first principal component (PC1) of a PCA based on the grasses’ importance value index accounted for 16% of explained variations, with the riparian ecosystem and wetland ecosystem clearly differentiated from the forest ecosystem, agroecosystem, and urban ecosystem (Figure 6). The second component (PC2), which primarily influenced the forest ecosystem, urban ecosystem, and agroecosystem, accounted for 9.6% of the explained variation. The riparian ecosystem shows the highest value in PC1 while forest ecosystem shows the highest value in PC2.
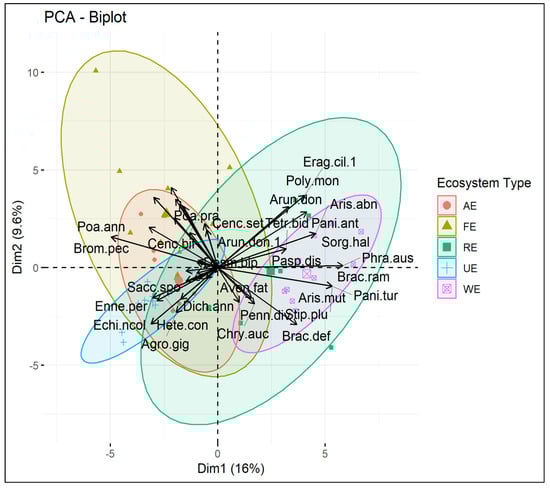
Figure 6.
Principal component analysis based on importance value index of sampling sites in different ecosystems. The wetland ecosystem (WE) and riparian ecosystem (RE) are similar in species composition while the urban ecosystem (UE) and agroecosystem (AE) are more similar to the forest ecosystem (FE).
The PCA biplot indicated that the grass species were considerably more prevalent in the wetland and riparian ecosystems. Polypogon monosplensis (Linn.) Desf, Panicum antidotale Retz, Sorghum halepense (L.) Pers, Brachiaria ramosa (L.) Stapf, Brachiaria deflexa (Schumach.) C.E.Hubb. ex Robyns, Aristida mutabilis Trin. and Rupr, and Arundo donax L. were most frequent species in the wetland and riparian ecosystems (Figure 5). In urban and agroecosystems, the most frequent species were Agrostis gigantean Roth, Cymbopogon jwarancusa (Jones) Schult, Echinochloa colona (L.) Link, Enneapogon persicus Boiss, Cenchrus setiger Vahl, Cenchrus ciliaris L., Dactyloctenium aegyptium (L.) Willd, and Avena fatua L. while in the forest ecosystem Aristida adscensionis L, Aristida mutabilis Trin. and Rupr, Bothriochloa bladhii (Retz.) S.T.Blake, Bromus japonicas Thunb, Desmostachya bipinnata (L.) Stapf, Dichanthium annulatum (Forssk.) Stapf, and Lolium persicum Boiss. and hohen. ex Boiss were frequent species.
3.4. Canonical Correspondence Analysis
The CCA ordination confirmed that environmental factors such as pH, moisture, organic matter, N, P, K, and CaCO3 had a significant impact on species distribution. Each triangle represents a distinct species of grass, with the distance between them showing how similar they are to one another. The species in the first quadrat were under the influence of soil moisture and CaCO3, while the species in the second quadrat were influenced by nitrogen and potassium. The distribution of the wild grasses in the third quadrat was impacted by organic soil matter and electrical conductance. The distribution of wild grasses found in the fourth quadrat of the CCA diagram was controlled by the pH and phosphorus concentration in the soil (Figure 7). The first axis identified 4.7 variations, the second, 7.8, and the third and fourth, 10.1–11.7 of the total variation, indicating that organic soil matter, electrical conductance, pH, and phosphorus have a strong relationship with the third and fourth axes and have a significant impact on the species richness patterns of grasses (Table 2).
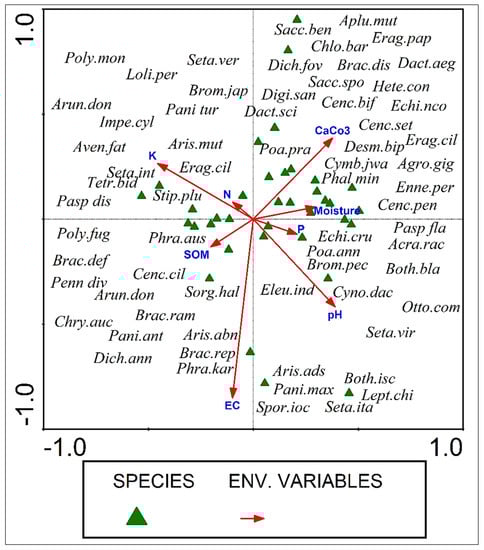
Figure 7.
CCA analysis of wild grasses in semi-arid region of Punjab, Pakistan.
Table 2.
Summary of CCA analysis of wild grasses in semi-arid lowland of Punjab, Pakistan.
3.5. Indicator Species Analysis
The results of the indicator species analysis showed a clear distinction of key species in different ecosystems. In the agroecosystem, Cynodon dactylon (L.) Pers and Leptochloa chinensis (L.) Nees had significant indicator value (p ≤ 0.05), while in the forest ecosystem Brachiaria reptans (L.) C.A.Gardner and C.E.Hubb, Dichanthium annulatum (Forssk.) Stapf, and Saccharum spontaneum L. had significant p-values. Cenchrus biflorus Roxb, Cenchrus ciliaris L., and Desmostachya bipinnata (L.) Stapf were indicator species of urban ecosystems. In wetland ecosystems, indicator species were Arundo donax L., Echinochloa crus-galli (L.) P.Beauv, and Phragmites australis (Cav.) Trin. ex Steud while in riparian ecosystems Saccharum spontaneum L and Echinochloa crus-galli (L.) P.Beauv were indicator species (Figure 8).
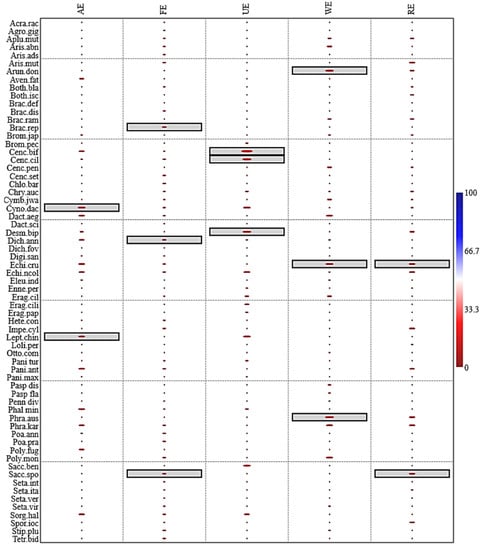
Figure 8.
Indicator species analysis of wild grasses in various ecosystems of semi-arid lowland region of Punjab. The species with significant (p ≤ 0.05) are highlighted in box in each ecosystem type.
4. Discussion
The spatial variability of soil characteristics is especially essential for ecosystem function in semi-arid habitats, where the heterogeneous distributions of nutrients boost the formation and maintenance of resources beneath the plant canopy [21]. Particularly for semi-arid grassland ecosystems, the spatial heterogeneity of soil nutrient pools at scales ranging from the sizes of individual plants to vast fields, as well as the fact that individual plants and plant community composition influence the distribution of soil nutrients at a variety of spatial scales [40]. We identified 65 different species of grasses in the semi-arid ecosystems of the Kasur district of the Pakistan Himalayas. The floral composition was consistent with Shaheen et al. [41], and Majeed et al. [42], who reported 61 and 52 Poaceae from Pakistan. The most important genera were Cenchrus, Brachiaria, Setaria, Aristida, Panicum, and Eragrostis. Similar findings were previously reported by Roy et al. [43] for tropical Indian range grasses. These genera, i.e., Cenchrus, Brachiaria, Setaria, exhibit endurance to biotic and abiotic stimuli while being more resilient to climate change under unfavorable climatic conditions [44]. The maintenance of grasslands, prevention of erosion, and, most importantly, uses by people and livestock (e.g., fodder and forage) are all aspects of the relevance of the Poaceae species in semi-arid ecosystems.
Ecological traits are viewed as a potential predictor of current environmental circumstances. The study region had a higher percentage (56.92%) of therophytes than hemicryptophytes (38.46%); this typically indicates adverse arid environmental conditions and is a sign of an anthropogenic effect [45]. Therophytes are frequently associated with low precipitation and short vegetative growth seasons, which are common on disturbed habitats and the percentage of therophytes often increases when introducing alien weedy forbs such as Bromus pectinatus Thunb, Dichanthim fovelatum (Del.) Roberty, Imperata cylindrica L.) Raeusch, and Polypogon monspeliensis (Linn.) Desf. Aliens made up about 20% of the total species recorded, and thrived especially in anthropogenic settings rather than slightly fragmented habitats [2]. Regardless of their life cycle approach, alien plant species are usually more fit than native plants in many ways and have more phenotypic plasticity. As a result, they more successfully colonize disturbed areas than native species [46]. The main leaf-size types of grasses in the studied area were microphyll species, followed by nanophylls and macrophylls. The abundance of microphylls is a sign of the moderate environment. Microphyll and nanophyll species from other areas of Pakistan were reported by Khan et al. [24]. Microphyll was also described as having important leaf size in the Indian Himalaya by [47]. Small leaves have been associated with cold or hot desert settings, as an adaptation mechanism for conserving soil moisture. The results of this study are comparable to those of Majeed et al. [42], Zeb et al. [48], and Ali et al. [49], who indicated that similar leaf size spectra predominated in their study locations. The root system can be impacted by temperature changes, which leads to less effective water and nutrient uptake from the soil, favoring the growth of simple leaves. Therefore, maintaining moisture is essential and has an impact on how quickly leaves grow. In order to categorize plants into different associations and to comprehend the physiological processes of both individual plants and plant communities, it is crucial to consider the habit and persistence of a plant’s leaves [50,51].
In various semi-arid ecological conditions, the variety and composition of grasses are known to be influenced by edaphic variables and biological interactions between species rainer.bussmann@smnk.de. While a number of edaphic factors (soil moisture contents, K, P, N, pH, CaCO3, and organic matter) were most strongly connected with the distributions of specific species, pH and electrical conductivity seemed to be the main determinants of the overall composition of plants and plot-level richness [52,53,54,55]. Similar results are reported by Ahmad et al. [56] from the temperate grass land of the Himalayas. The pH was the dominant environmental driver for species we tested, including Cynodon dactylon (L.) Pers, Setaria viridis (L.) P.Beauv, Aristida adscensionis L., Bothriochloa bladhii (Retz.) S.T.Blake, Leptochloa chinensis (L.) Nees. Filibeck et al. reported similar results [57]. Different species react differently to pH, and in grassland areas, moisture content and precipitation are two factors that are thought to influence the distribution of plants. The protoplasm of the root cells is extended by the pH of the soil, which also directly affects the nutrient availability, toxicity, and microbial activity [58].
The relative significance of electrical conductivity influences the distribution of species such as Phragmites karka (Retz.) Trin. ex Steud., Dichanthium annulatum (Forssk.) Stapf, Brachiaria reptans (L.) C.A. Gardner and C.E. Hubb, and Aristida abnormis Chiov. Similar relationships between edaphic characteristics and grass species composition have been proposed by other studies. These relationships can be explained by the fact that local edaphic characteristics influence the availability of water and nutrients in various soil types, selecting plant communities with a variety of ecological functions [56,59,60].
Our results further showed that grass species composition and distribution responded to the soil parameters in the particular habitats. This was further supported by multivariate analyses (PCA, indicator species analysis) that showed the strong influences of soil factors on the assemblage of grass species. Similar multivariate analyses were also carried out by previous researchers such as Majeed et al. [42]; Gupta et al. [61]; Wei et al. [62]; and Soulodre et al. [63]. The PCA and indicator species analysis diagram showed that variety, distribution, and communities of grass species reflected the differences in the edaphic factors. Grasses’ community composition in semi-arid lowlands was more frequently influenced by ecosystem type. Our research shows that the forest ecosystem and agroecosystem have different species compositions, which is supported by diagnostic species analysis. Species with specific ecological requirements are frequently restricted to a small number of habitat types and are thus more likely to be rare [64]. In our study, Acrachne racemosa (Heyne ex Roem. and Schult.) Ohwi, Agrostis gigantean Roth, Aristida adscensionis L., Brachiaria distachya (L.) Stapf, Brachiaria reptans (L.) C.A. Gardner and C.E. Hubb, Chloris barbata Sw, and Dactyloctenium scindicum Boiss were restricted only to the forest ecosystem while Lolium persicum Boiss. and Hohen. ex Bois and Brachiaria deflexa (Schumach.) C.E. Hubb. ex Robyns were found only in the riparian ecosystem. The results of the indicator species analysis of grasses highlighted key species in different ecosystems. Cynodon dactylon (L.) Pers. and Leptochloa chinensis (L.) Nees were indicator species in the agroecosystem, Brachiaria reptans (L.) C.A.Gardner and C.E. Hubb., Dichanthium annulatum (Forssk.) Stapf, and Saccharum spontaneum L. in the forest ecosystem. Similarly, Saccharum spontaneum L. and Echinochloa crus-galli (L.) P. Beauv. were indicator species in riparian ecosystems. The distribution of species within any ecosystem is determined by a variety of biotic and abiotic factors, making determining the impact of a single environmental factor difficult [65]. Grass-species richness was considerably lower in the urban ecosystem compared to the forest ecosystem, while in other ecosystems the species richness was relatively similar (Table 1). This might be because the forest habitat provides optimum temperature, moderate amounts of rainfall, and rich nutrient supplies, thus supporting the greatest diversity of species [47,66].
The indicator species analysis separated the five habitat types, which was supported by high and significant indicator values for a number of species. It is interesting to note that a Venn diagram of the habitats revealed a similar pattern, with the forest ecosystem having 11 unique species not found in other habitats. A similar indicator species analysis was carried out by Rasheed et al. [36], Hussain et al. [67], and Ahmad et al. [56]. A species will evolve to function better in one habitat than in others when conditions are favorable for a long time [47]. In conclusion, preserving and/or restoring natural habitats (forest, riverine, wetlands) would be a crucial first step in maintaining or increasing species richness.
5. Conclusions
In the current study, we investigated the wild grass composition and distribution patterns with regard to edaphic properties in various ecosystem types of semi-arid lowland of the Kasur district, Punjab, Pakistan. We collected 65 wild Poaceae members from the study region, with Cenchrus, Brachiaria, and Setaria as the dominant genera. Therophyte was the most common life form, followed by hemicryptophyte and geophyte. Through indicator species analyses, each community’s distinctive species was verified. The significant indicator species in various ecosystems were Cynodon dactylon (L.) Pers and Leptochloa chinensis (L.) Nees (AE), Brachiaria reptans (L.) C.A.Gardner and C.E.Hubb, Dichanthium annulatum (Forssk.) Stapf, and Saccharum spontaneum L. (FE), Cenchrus biflorus Roxb, Cenchrus ciliaris L., and Desmostachya bipinnata (L.) Stapf (UE), Arundo donax L., Echinochloa crus-galli (L.) P.Beauv, and Phragmites australis (Cav.) Trin. ex Steud (WE), and Saccharum spontaneum L., and Echinochloa crus-galli (L.) P.Beauv (RE). The analyses of indicator species showed that pH and EC were the most powerful and important edaphic factors for determining the composition of plant communities and indicator species. The identified indicator species may be an adequate choice for the restoration of degraded ecosystems in this area, as well as generating scientifically informed management solutions.
Author Contributions
Conceptualization, M.W. and S.M.H.; methodology, M.W. and F.A.; software, M.W., S.M.H. and F.A.; validation, R.W.B. and F.A.; formal analysis, M.W., S.M.H. and F.A.; investigation, M.W., S.M.H. and F.A.; resources, N.A.B. and A.A.H. ; data curation, M.W., F.A., M.I. and R.W.B. writing—original draft preparation, M.W.,S.M.H., F.A. and R.W.B.; writing—review and editing, R.W.B., N.A.B., A.A.H. and F.A. visualization, M.W., S.M.H., supervision, F.A. and N.A.B.; project administration, A.A.H. All authors have read and agreed to the published version of the manuscript.
Funding
The authors extend their appreciation to the Researchers supporting project number (RSP-2021/229) King Saud University, Riyadh, Saudi Arabia.
Institutional Review Board Statement
Not applicable.
Informed Consent Statement
Not applicable.
Data Availability Statement
Species occurrence data are available on request to first author.
Conflicts of Interest
The authors declare no conflict of interest.
References
- Li, T.; Xiong, Q.; Luo, P.; Zhang, Y.; Gu, X.; Lin, B. Direct and indirect effects of environmental factors, spatial constraints, and functional traits on shaping the plant diversity of montane forests. Ecol. Evol. 2020, 10, 557–568. [Google Scholar] [CrossRef] [PubMed]
- Haq, S.M.; Malik, A.H.; Khuroo, A.A.; Rashid, I. Floristic composition and biological spectrum of keran-a remote valley of Northwestern Himalaya. Acta Ecol. Sin. 2019, 39, 372–379. [Google Scholar] [CrossRef]
- Báez, S.; Fadrique, B.; Feeley, K.; Homeier, J. Changes in tree functional composition across topographic gradients and through time in a tropical montane forest. PLoS ONE 2022, 17, e0263508. [Google Scholar] [CrossRef] [PubMed]
- Hofhansl, F.; Chacón-Madrigal, E.; Fuchslueger, L.; Jenking, D.; Morera-Beita, A.; Plutzar, C.; Silla, F.; Andersen, K.M.; Buchs, D.M.; Dullinger, S. Climatic and edaphic controls over tropical forest diversity and vegetation carbon storage. Sci. Rep. 2020, 10, 1–11. [Google Scholar] [CrossRef] [PubMed]
- Reich, P.B.; Wright, I.J.; Cavender-Bares, J.; Craine, J.; Oleksyn, J.; Westoby, M.; Walters, M. The evolution of plant functional variation: Traits, spectra, and strategies. Int. J. Plant Sci. 2003, 164, S143–S164. [Google Scholar] [CrossRef]
- Haq, S.M.; Tariq, A.; Li, Q.; Yaqoob, U.; Majeed, M.; Hassan, M.; Fatima, S.; Kumar, M.; Bussmann, R.W.; Moazzam, M.F.U.; et al. Influence of Edaphic Properties in Determining Forest Community Patterns of the Zabarwan Mountain Range in the Kashmir Himalayas. Forests 2022, 13, 1214. [Google Scholar] [CrossRef]
- Rahman, I.U.; Hart, R.E.; Ijaz, F.; Afzal, A.; Iqbal, Z.; Calixto, E.S.; Abd_Allah, E.F.; Alqarawi, A.A.; Hashem, A.; Al Arjani, A.B.F.; et al. Environmental variables drive plant species composition and distribution in the moist temperate forests of Northwestern Himalaya, Pakistan. PLoS ONE 2022, 17, e0260687. [Google Scholar] [CrossRef]
- Hulshof, C.M.; Spasojevic, M.J. The edaphic control of plant diversity. Glob. Ecol. Biogeogr. 2020, 29, 1634–1650. [Google Scholar] [CrossRef]
- Getzin, S.; Wiegand, T.; Wiegand, K.; He, F. Heterogeneity influences spatial patterns and demographics in forest stands. J. Ecol. 2008, 96, 807–820. [Google Scholar] [CrossRef]
- Concostrina-Zubiri, L.; Prieto, M.; Hurtado, P.; Escudero, A.; Martínez, I. Functional diversity regulates the effects of habitat degradation on biocrust phylogenetic and taxonomic diversities. Ecol. Appl. 2022, 22, e2599. [Google Scholar] [CrossRef]
- Vanneste, T.; Govaert, S.; De Kesel, W.; Van Den Berge, S.; Vangansbeke, P.; Meeussen, C.; Brunet, J.; Cousins, S.A.O.; Decocq, G.; Diekmann, M.; et al. Plant diversity in hedgerows and road verges across Europe. J. Appl. Ecol. 2020, 57, 1244–1257. [Google Scholar] [CrossRef]
- Eiserhardt, W.L.; Svenning, J.-C.; Kissling, W.D.; Balslev, H. Geographical ecology of the palms (Arecaceae): Determinants of diversity and distributions across spatial scales. Ann. Bot. 2011, 108, 1391–1416. [Google Scholar] [CrossRef] [PubMed]
- Jactel, H.; Bauhus, J.; Boberg, J.; Bonal, D.; Castagneyrol, B.; Gardiner, B.; Gonzalez-Olabarria, J.R.; Koricheva, J.; Meurisse, N.; Brockerhoff, E.G. Tree diversity drives forest stand resistance to natural disturbances. Curr. For. Rep. 2017, 3, 223–243. [Google Scholar] [CrossRef]
- Bouchenak-Khelladi, Y.; Verboom, G.A.; Savolainen, V.; Hodkinson, T.R. Biogeography of the grasses (Poaceae): A phylogenetic approach to reveal evolutionary history in geographical space and geological time. Bot. J. Linn. Soc. 2010, 162, 543–557. [Google Scholar] [CrossRef]
- Abbas, Z.; Khan, S.M.; Alam, J.; Abideen, Z.; Ullah, Z. Plant communities and anthropo-natural threats in the Shigar Valley, (Central Karakorum) Baltistan-Pakistan. Pak. J. Bot. 2020, 52, 987–994. [Google Scholar] [CrossRef]
- Slewinski, T.L. Non-structural carbohydrate partitioning in grass stems: A target to increase yield stability, stress tolerance, and biofuel production. J. Exp. Bot. 2012, 63, 4647–4670. [Google Scholar] [CrossRef] [PubMed]
- Moretto, A.S.; Distel, R.A.; Didone, N.G. Decomposition and nutrient dynamic of leaf litter and roots from palatable and unpalatable grasses in a semi-arid grassland. Appl. Soil Ecol. 2001, 18, 31–37. [Google Scholar] [CrossRef]
- Sarwar, M.; Khan, M.A.; Iqbal, Z. Status paper feed resources for livestock in Pakistan. Int. J. Agric. Biol. 2002, 4, 186–192. [Google Scholar]
- Godfray, H.C.J.; Beddington, J.R.; Crute, I.R.; Haddad, L.; Lawrence, D.; Muir, J.F.; Pretty, J.; Robinson, S.; Thomas, S.M.; Toulmin, C. Food security: The challenge of feeding 9 billion people. J. Sci. 2010, 327, 812–818. [Google Scholar] [CrossRef]
- Porqueddu, C.; Ates, S.; Louhaichi, M.; Kyriazopoulos, A.; Moreno, G.; Del Pozo, A.; Ovalle, C.; Ewing, M.; Nichols, P. Grasslands in ‘old world’and ‘new world’mediterranean-climate zones: Past trends, current status and future research priorities. Grass Forage Sci. 2016, 71, 1–35. [Google Scholar] [CrossRef]
- Moro, M.F.; Silva, I.A.; Araújo FSd Nic Lughadha, E.; Meagher, T.R.; Martins, F.R. The role of edaphic environment and climate in structuring phylogenetic pattern in seasonally dry tropical plant communities. PLoS ONE 2015, 10, e0119166. [Google Scholar] [CrossRef] [PubMed]
- Andrade, B.O.; Boldrini, I.I.; Cadenazzi, M.; Pillar, V.D.; Overbeck, G.E. Grassland vegetation sampling-a practical guide for sampling and data analysis. Acta Bot. Croat. 2019, 33, 786–795. [Google Scholar] [CrossRef]
- Haq, S.M.; Singh, B.; Bashir, F.; Farooq, A.J.; Singh, B.; Calixto, E.S. Exploring and understanding the floristic richness, life-form, leaf-size spectra and phenology of plants in protected forests: A case study of Dachigam National Park in Himalaya, Asia. Acta Ecol. Sin. 2021, 41, 479–490. [Google Scholar] [CrossRef]
- Khan, W.; Khan, S.M.; Ahmad, H.; Alqarawi, A.A.; Shah, G.M.; Hussain, M.; Abd_Allah, E. Life forms, leaf size spectra, regeneration capacity and diversity of plant species grown in the Thandiani Forests, district Abbottabad, Khyber Pakhtunkhwa, Pakistan. Saudi J. Biol. Sci. 2018, 25, 94–100. [Google Scholar] [CrossRef]
- Afzal, R.; Ahmad, H.; Saqib, Z.; Marwat, K.B.; Khan, J. Spatial analysis of vascular flora of Ayubia National Park, Kpk, Pakistan: A classical example of moist temperate himalaya. Pak. J. Bot. 2018, 50, 1499–1508. [Google Scholar]
- Khan, A.M.; Qureshi, R.; Saqib, Z. Multivariate analyses of the vegetation of the Western Himalayan Forests of Muzaffarabad District, Azad Jammu and Kashmir, Pakistan. Ecol. Indic. 2019, 104, 723–736. [Google Scholar] [CrossRef]
- Iqbal, M.; Khan, S.M.; Ahmad, Z.; Hussain, M.; Shah, S.N.; Kamran, S.; Manan, F.; Haq, Z.; Ullah, S. Vegetation classification of the Margalla Foothills, Islamabad under the influence of edaphic factors and anthropogenic activities using modern ecological tools. Pak. J. Bot. 2021, 53, 1831–1843. [Google Scholar] [CrossRef]
- Arshad, F.; Waheed, M.; Iqbal, M.; Fatima, K.; Fatima, K. Ethnobotanical assessment of woody flora of district Kasur (Punjab), Pakistan. Ethnobot. Res. Appl. 2020, 20, 1–13. [Google Scholar]
- Rahman, A.U.; Khan, S.M.; Saqib, Z.; Ullah, Z.; Ahmad, Z.; Ekercin, S.; Mumtaz, A.S.; Ahmad, H. Diversity and abundance of climbers in relation to their hosts and elevation in the monsoon forests of Murree in the Himalayas. Pak. J. Bot. 2020, 52, 601–612. [Google Scholar] [CrossRef]
- Arshad, F.; Waheed, M.; Harun, N.; Fatima, K.; Khan, B.A.; Fatima, K.; Abbas, Z.; Jabeen, S.; Majeed, M. Indigenous farmer’s perception about fodder and foraging species of Semi-arid lowlands of Pakistan: A case study of District Kasur, Pakistan. Taiwania 2022, 67, 510–523. [Google Scholar]
- Adnan, M.; Hölscher, D. Medicinal plants in old-growth, degraded and re-growth forests of NW Pakistan. For. Ecol. Manag. 2011, 261, 2105–2114. [Google Scholar] [CrossRef]
- Rahman, I.U.; Khan, N.; Ali, K. Classification and ordination of understory vegetation using multivariate techniques in the Pinus wallichiana forests of Swat Valley, northern Pakistan. Sci. Nat. 2017, 104, 1–10. [Google Scholar] [CrossRef] [PubMed]
- Majeed, M.; Bhatti, K.; Amjad, M. Impact of climatic variations on the flowering phenology of plant species in Jhelum district, Punjab, Pakistan. Appl. Ecol. Environ. Res 2021, 19, 3343–3376. [Google Scholar] [CrossRef]
- Khan, M.; Khan, S.M.; Ilyas, M.; Alqarawi, A.A.; Ahmad, Z.; Abd_Allah, E.F. Plant species and communities assessment in interaction with edaphic and topographic factors; an ecological study of the Mount Eelum District Swat, Pakistan. Saudi J. Biol. Sci. 2017, 24, 778–786. [Google Scholar] [CrossRef] [PubMed]
- Lu, X.T.; Hu, Y.Y.; Wolf, A.A.; Han, X.G. Species richness mediates within-species nutrient resorption: Implications for the biodiversity–productivity relationship. J. Ecol. 2019, 107, 2346–2352. [Google Scholar] [CrossRef]
- Rasheed, S.; Khan, S.M.; Ahmad, Z.; Mustafa, G.; Haq, Z.; Shah, H.; Ansari, L.; Jatt, T. Ecological assessment and indicator species analyses of the Cholistan Desert using multivariate statistical tools. Pak. J. Bot. 2022, 54, 683–694. [Google Scholar] [CrossRef]
- Abdullah, M.; Khan, R.A.; Yaqoob, S.; Ahmad, M. Community structure of browse vegetation in Cholistan rangelands of Pakistan. Pak. J. Agri. Sci. 2013, 50, 237–247. [Google Scholar]
- Dufrêne, M.; Legendre, P. Species assemblages and indicator species: The need for a flexible asymmetrical approach. Ecol. Monogr. 1997, 67, 345–366. [Google Scholar] [CrossRef]
- Kassambara, A.; Mundt, F. Package ‘factoextra’. Extract and visualize the results of multivariate data analyses. R Package Version 1.0. 5. R package version. 2020; 2020. [Google Scholar]
- Morris, K.A.; Saetre, P.; Norton, U.; Stark, J.M. Plant community effects on soil moisture and nitrogen cycling in a semi-arid ecosystem. Biogeochemistry 2022, 159, 215–232. [Google Scholar] [CrossRef]
- Shaheen, H.; Qureshi, R.; Qaseem, M.F.; Bruschi, P. The fodder grass resources for ruminants: A indigenous treasure of local communities of Thal Desert, Punjab, Pakistan. PLoS ONE 2020, 15, e0224061. [Google Scholar] [CrossRef]
- Majeed, M.; Tariq, A.; Haq, S.M.; Waheed, M.; Anwar, M.M.; Li, Q.; Aslam, M.; Abbasi, S.; Mousa, B.; Jamil, A. A detailed ecological exploration of the distribution patterns of wild poaceae from the Jhelum District (Punjab), Pakistan. Sustainability 2022, 14, 3786. [Google Scholar] [CrossRef]
- Roy, A.; Malaviya, D.; Kaushal, P. Genetic improvement of dominant tropical indian range grasses. Range Manag. Agrofor. 2019, 40, 1–25. [Google Scholar]
- Oliveira, J.R. Alexander Grass Seed Physiology and Production: A Step Towards the Conversion of a Weed Into a Forage Plant. Ph.D. Thesis, Federal Technological University of Paraná, Pato Branco, Brazil, 2017. [Google Scholar]
- Haq, S.M.; Shah, A.A.; Yaqoob, U.; Hassan, M. Floristic quality assessment index of the dagwan stream in Dachigam National Park of Kashmir, Himalaya. Proc. Natl. Acad. Sci. India Sect. B. Biol. Sci. 2021, 91, 657–664. [Google Scholar] [CrossRef]
- Rashid, I.; Haq, S.M.; Lembrechts, J.J.; Khuroo, A.A.; Pauchard, A.; Dukes, J.S. Railways redistribute plant species in mountain landscapes. J. Appl. Ecol. 2021, 58, 1967–1980. [Google Scholar] [CrossRef]
- Haq, S.M.; Malik, Z.A.; Rahman, I.U. Quantification and characterization of vegetation and functional trait diversity of the riparian zones in protected forest of Kashmir Himalaya, India. Nord. J. Bot. 2019, 37. [Google Scholar] [CrossRef]
- Zeb, A.; Iqbal, Z.; Khan, S.M.; Rahman, I.U.; Haq, F.; Afzal, A.; Qadir GIjaz, F. Species diversity, biological spectrum and phenological behaviour of vegetation of Biha Valley (Swat), Pakistan. Acta Ecol. Sin. 2020, 40, 190–196. [Google Scholar] [CrossRef]
- Ali, S.; Shah, S.Z.; Khan, M.S.; Khan, W.M.; Khan, Z.; Hassan, N.; Zeb, U. Floristic list, ecological features and biological spectrum of District Nowshera, Khyber Pakhtunkhwa, Pakistan. Acta Ecol. Sin. 2019, 39, 133–141. [Google Scholar] [CrossRef]
- Oliveira, R.S.; Eller, C.B.; Barros, F.d.V.; Hirota, M.; Brum, M.; Bittencourt, P. Linking plant hydraulics and the fast–slow continuum to understand resilience to drought in tropical ecosystems. New Phytol. 2021, 230, 904–923. [Google Scholar] [CrossRef]
- Jardine, E.C.; Thomas, G.H.; Forrestel, E.J.; Lehmann, C.E.; Osborne, C.P. The global distribution of grass functional traits within grassy biomes. J. Biogeogr. 2020, 47, 553–565. [Google Scholar] [CrossRef]
- Guo, Y.; Hou, L.; Zhang, Z.; Zhang, J.; Cheng, J.; Wei, G.; Lin, Y. Soil microbial diversity during 30 years of grassland restoration on the loess plateau, china: Tight linkages with plant diversity. Land Degrad. Dev. 2019, 30, 1172–1182. [Google Scholar] [CrossRef]
- Provoost, S.; Ampe, C.; Bonte, D.; Cosyns, E.; Hoffmann, M. Ecology, management and monitoring of dune grasslands in Flanders, Belgium. In Proceedings of the Littoral 2002 The Changing Coast, Porto, Portugal, 22–26 September 2002; pp. 11–22. [Google Scholar]
- Segura, C.; Jiménez, M.N.; Fernández-Ondoño, E.; Navarro, F.B. Effects of Afforestation on Plant Diversity and Soil Quality in Semiarid SE Spain. Forests 2021, 12, 1730. [Google Scholar] [CrossRef]
- Bergamin, R.S.; Ascensão, F.; Capinha, C.; Bastazini, V.A.G.; Andrade, B.O.; Boldrini, I.I.; Lezama, F.; Altesor, A.; Perelman, S.; Overbeck, G.E. Native and alien grassland diversity respond differently to environmental and anthropogenic drivers across spatial scales. J. Veg. Sci. 2022, 33, e13133. [Google Scholar] [CrossRef]
- Ahmad, K.S.; Hameed, M.; Ahmad, F.; Sadia, B. Edaphic factors as major determinants of plant distribution of temperate himalayan grasses. Pak. J. Bot. 2016, 48, 567–573. [Google Scholar]
- Filibeck, G.; Sperandii, M.G.; Bazzichetto, M.; Mancini, L.D.; Rossini, F.; Cancellieri, L. Exploring the drivers of vascular plant richness at very fine spatial scale in sub-mediterranean limestone grasszlands (central Apennines, Italy). Biodivers. Conserv. 2019, 28, 2701–2725. [Google Scholar] [CrossRef]
- Wang, S.; Zuo, X.; Awada, T.; Medima-Roldan, E.; Feng, K.; Yue, P.; Lian, J.; Zhao, S.; Cheng, H. Changes of soil bacterial and fungal community structure along a natural aridity gradient in desert grassland ecosystems, inner Mongolia. Catena 2021, 205, 05470. [Google Scholar] [CrossRef]
- Wangchuk, K. Lowland pasture in himalayan highland: Edaphic properties and species composition. J. Mt. Sci. 2016, 13, 455–464. [Google Scholar] [CrossRef]
- Starke, A.; O’Connor, T.; Everson, C.S. Topo-edaphic environment and forest plantation disturbance explain patterns of grassland species richness, composition and structure in an agro-ecological landscape, Maputaland, South Africa. Afr. J. Range Forage Sci. 2021, 38, 206–219. [Google Scholar] [CrossRef]
- Gupta, V.V.; Zhang, B.; Penton, C.R.; Yu, J.; Tiedje, J.M. Diazotroph diversity and nitrogen fixation in summer active perennial grasses in a mediterranean region agricultural soil. Front. Mol. Biosci. 2019, 6, 115. [Google Scholar] [CrossRef]
- Wei, Q.; Zhou, Y.; Xiao, N.; Huang, J.; Xiao, H.; Chen, H. Effects of three typical grass cultivation patterns on the community structure of soil mites in rocky desertification control area, Guizhou, China. Environ. Res. Commun. 2022, 4, 045008. [Google Scholar] [CrossRef]
- Soulodre, E.M.; Dhar, A.; Naeth, M.A. Plant community development trends on mixed grass prairie well sites 5 years after reclamation. Ecol. Eng. 2022, 179, 106635. [Google Scholar] [CrossRef]
- Arshad, F.; Waheed, M.; Fatima, K.; Harun, N.; Iqbal, M.; Fatima, K.; Umbreen, S. Predicting the Suitable Current and Future Potential Distribution of the Native Endangered Tree Tecomella undulata (Sm.) Seem. in Pakistan. Sustainability 2022, 14, 7215. [Google Scholar] [CrossRef]
- Wang, Y.; Lehnert, L.W.; Holzapfel, M.; Schultz, R.; Heberling, G.; Görzen, E.; Meyer, H.; Seeber, E.; Pinkert, S.; Ritz, M.; et al. Multiple indicators yield diverging results on grazing degradation and climate controls across Tibetan pastures. Ecol. Indic. 2018, 93, 1199–1208. [Google Scholar] [CrossRef]
- Nafeesa, Z.; Haq, S.M.; Bashir, F.; Gaus, G.; Mazher, M.; Anjum, M.; Rasool, A.; Rashid, N. Observations on the floristic, life-form, leaf-size spectra and habitat diversity of vegetation in the Bhimber Hills of Kashmir himalayas. Acta Ecol. Sin. 2021, 41, 228–234. [Google Scholar] [CrossRef]
- Hussain, M.; Khan, S.; Abd_Allah, E.; Ul Haq, Z.; Alshahrani, T.; Alqarawi, A.; Ur Rahman, I.; Iqbal, M.; Abdullah–Ahmad, H. Assessment of plant communities and identification of indicator species of an ecotonal forest zone at Durand Line, District Kurram, Pakistan. Appl. Ecol. Environ. Res. 2019, 17, 6375–6396. [Google Scholar] [CrossRef]


Publisher’s Note: MDPI stays neutral with regard to jurisdictional claims in published maps and institutional affiliations. |
© 2022 by the authors. Licensee MDPI, Basel, Switzerland. This article is an open access article distributed under the terms and conditions of the Creative Commons Attribution (CC BY) license (https://creativecommons.org/licenses/by/4.0/).