Article

Urban Rail Transit Rolling Stock Scheduling Optimization with Shared Depot

1
Key Laboratory of Transport Industry of Big Data Application Technologies for Comprehensive Transport, Beijing Jiaotong University, Beijing 100044, China
2
Intergrated Transport Research Center of China, Beijing Jiaotong University, Beijing 100044, China
3
Tianjin Transportation Research Institute, Tianjin 300074, China
4
Yunnan Jingjian Rail Transit Investment and Construction Co., Ltd., Kunming 650500, China
*
Author to whom correspondence should be addressed.
Sustainability 2022, 14(22), 15075; https://doi.org/10.3390/su142215075
Submission received: 21 August 2022 / Revised: 7 November 2022 / Accepted: 8 November 2022 / Published: 14 November 2022
(This article belongs to the Section Sustainable Transportation)

Abstract

:
This paper presents a coordinated model to optimize the rolling stock scheduling of two urban rail transit lines with a shared train depot. The proposed integrated and extended integrated optimization problems are transformed into mixed integer linear programming (MILP) problems, which can be efficiently solved by an ant colony optimization algorithm. Numerical examples based on the Beijing Subway System are implemented to demonstrate the performance of the proposed models and solution approach.

1. Introduction

China’s urban rail transit system (URT system) develops with great demands and its construction scale keeps expanding. However, it is still dominated by single-line construction at present, which means that each line is always equipped with at least one depot to meet the parking and maintenance needs of rolling stock and represents an Electric Multiple Unit (EMU) in a URT system. The depot of an urban rail transit system usually covers a huge area in the suburban area. It is worth exploring whether the flexible utilization of urban rail transit land resources, functional resources, and rolling stock utilization [1] can be reorganized through sharing the rolling stock depot in order to improve the operation effect and reduce the operating cost.
Rolling stock scheduling is a very complex and difficult optimization problem because it not only needs to undertake all the timetable tasks, but also needs to meet the infrastructure constraints such as depot location. The research on the EMU started earlier and there are many similarities between the use of the rolling stock of urban rail transits and the EMU. An overview of the state-of-the-art operations research models used by passenger railway operators [2] will be introduced firstly and then we conclude the rolling stock utilization models and techniques with different depot location situations in urban rail transit systems.
There have been lots of studies presented in the literature investigating how one could improve the performances of the train operations through rolling-stock-assignment and shunting schedules were provided [3]. The combinations of each vehicle were considered in studies [4,5,6,7]. Additionally, the constraints related to the number of vehicles for each train were modeled as a multi-commodity flow problem [4]. As a case of dealing with train-circulation and rolling-stock-assignment separately, the rule-based heuristic algorithm for assigning train units to train-circulations was provided [8]. Furthermore, a model of ideal cumulative mileage within one inspection cycle for efficiency was provided [9]. In addition, a mixed integer model was used to describe the rapid railway transportation system rolling stock cycle maintenance problem; the results illustrated that the idling of the rolling stock can be to a maximum extent [10].
The influence of the depot on the rolling stock scheduling are mainly reflected in two aspects: Firstly, the flexible utilization of the rolling stock resources by crossline operation organization through the rail connections. Secondly, through the shared depot, the rolling stocks of the connecting lines can share the depot’s maintenance resources. Cadarso et al. discussed the optimization of the marshaling and operation plan under the condition of the shared depot of multiple suburban railway lines [11,12], but the empty running line under the train operation is the pre-defined input condition and the departure frequency of suburban railway is far lower than that of urban rail transit system. Researches focused on urban rail transit systems mostly discuss the rolling stock scheduling optimization under the condition of single or multiple lines [13,14,15,16,17]. Placido and D’Acierno promoted a decision support system for assessing the feasibility of fleet compositions with dynamic demand and an Italy metro line was used to demonstrate the usage of this method [18]. Samà et al. discussed the train scheduling and routing problem in a complex railway network in which two practical cases from Dutch and British railways are studied [19]. D’Ariano et al. contributed a mixed-integer linear programming formulation to describe the optimization of train sequencing and routing decisions and timing decisions related to short-term maintenance works in a railway network subject to disturbed process times [20]. Hövell et al. introduced the rolling stock servicing scheduling problem to model the rolling stock exchange concept and used the proposed model to test on a real-life case from the Dutch railways [21]. These research methods are mainly constructing a mixed integer linear programming model or a mixed integer programming model and solving the models with an intelligent search algorithm or CPLEX. Table 1 summarizes some relevant studies on the rolling stock scheduling and circulation planning, in terms of the research object, infrastructure description (i.e., single line, multi lines, single depot, multi depots, and shared depot), mathematical formulations, and solution algorithms.
For the summary of Table 1, studies tend to further investigate the rolling stock scheduling process with more and more complex infrastructure descriptions and searches for a global optimal solution.
Our paper focuses on the optimization effect of rolling stock scheduling with a shared depot for multiple urban rail transit lines. Under the condition of the rolling stock shared base, the rolling stock scheduling should be divided into three situations by whether the rolling stock belongs to a certain depot. The first one is that the rolling stock belongs to a certain depot and the rolling stock needs to return to the starting depot after completing all its tasks, which is called the fixed depot rolling stock operation mode. The second is that the rolling stock completes several one-day tasks within a certain period and returns to the starting depot at the beginning of the cycle, which is called the cycle/beat type rolling stock operation mode. The third is the rolling stock does not belong to a depot, it can choose the nearest depot according to the operation situation, the only constraint condition in this situation is that after the end of each day, the number of rolling stock parking in the depot should be fixed, known as the variable rolling stock operation mode. The ownership relationship can be summarized in Table 2.
As shown in Table 2, the flexibility of the variable rolling stock operation mode is higher than the other two modes, which can effectively improve the utilization rate of transportation capacity resources and the management complexity is correspondingly higher. Thus, the variable rolling stock operation mode will be adopted in our study

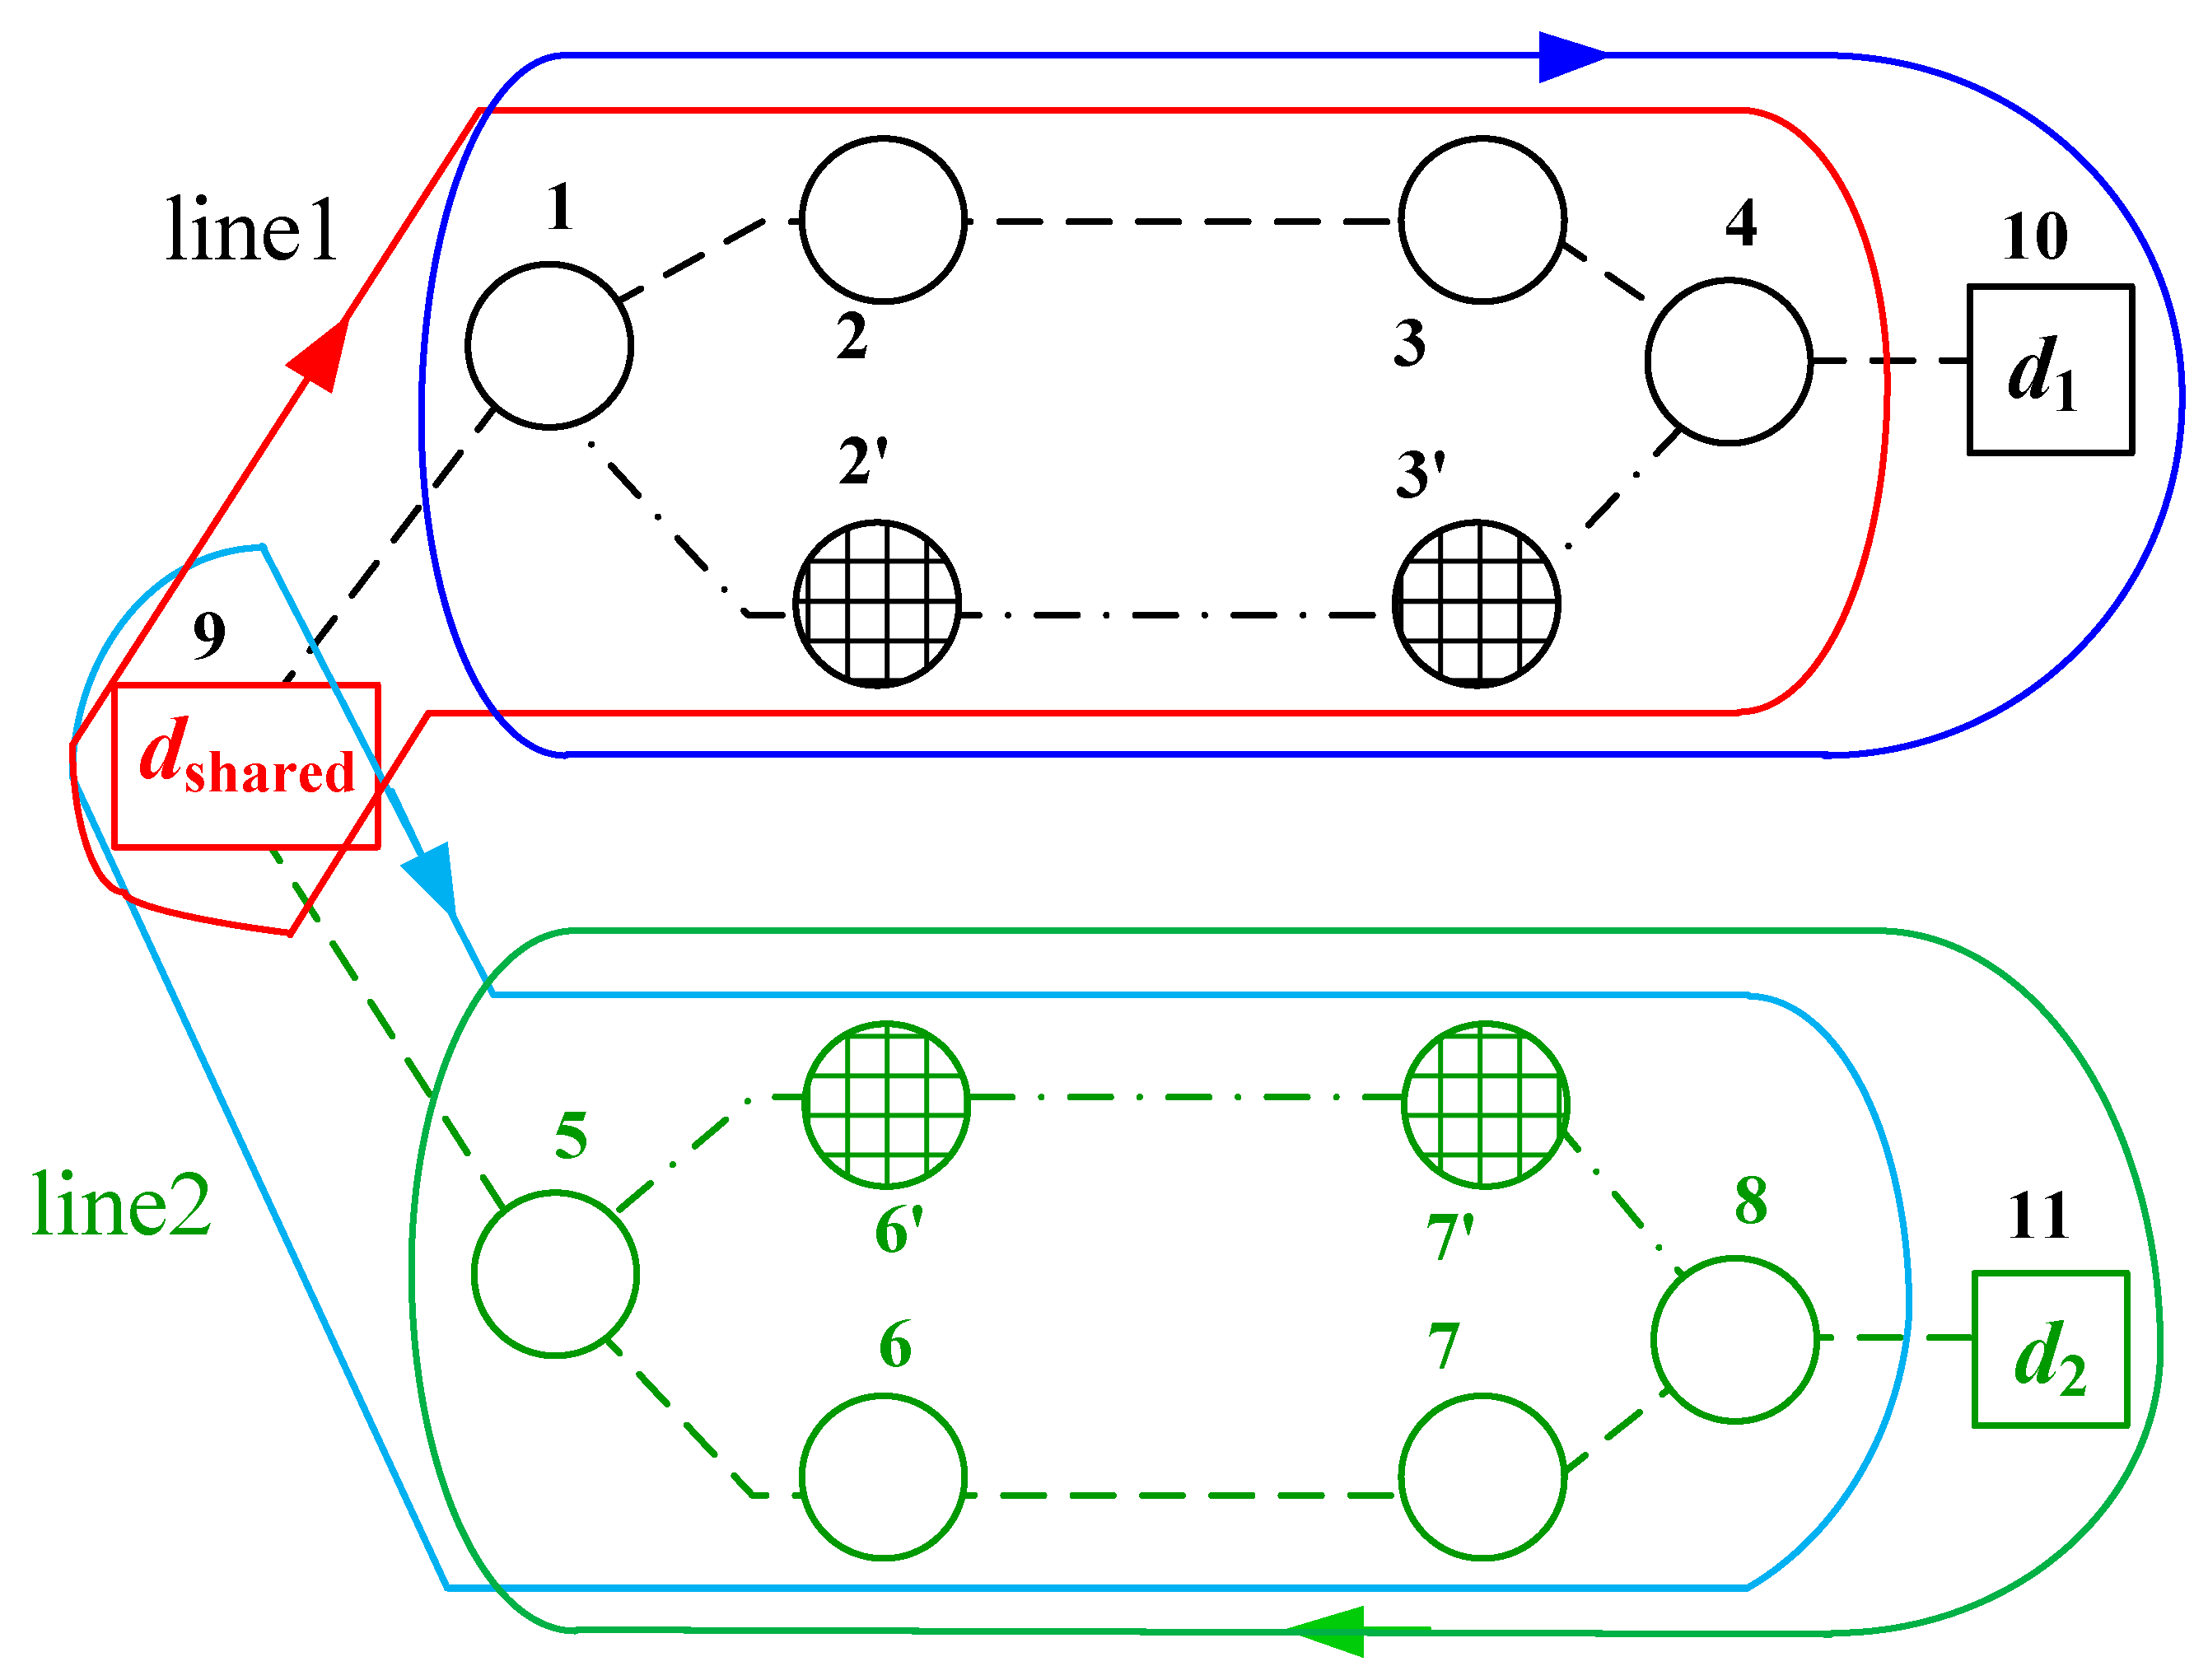
2. Problem Description

The rolling stock scheduling is based on the timetable of train operation, combined with the number of rolling stocks, the number of depot or parking lot, layout and capacity, etc., to create specific arrangements for each rolling stock under the time and place out of the yard, which train tasks, return to the yard, and so on. For urban rail transit systems, the operation plan is generally based on days and all trains run a short distance every day and have the characteristics of round-trip operation.
Under the condition of shared depot, the rolling stock scheduling is more flexible. If two lines share a depot and each line is equipped with a parking lot, the rolling stocks can be comprehensively applied between multiple lines, as shown in Figure 1.
If the two lines are not in operation, based on the circulation characteristics of urban rail transit lines, the middle station is treated with a virtual image, and there are altogether four cycles that start from the depot, run by the number of trains, and return to the depot.

3. Rolling Stock Scheduling Model of Urban Rail Transit with Shared Depot

The difference between the rolling stock scheduling problem with a shared depot and the one with the single line can be summarized as follows: rolling stock can be implemented in the connectivity between the two lines and all rolling stock within the depots are shared, the flexible scheduling model should be considered when the rolling stock are assigned to service tasks of two lines. The rolling stock mainly have the following behaviors:
(1)
Undertake the task of running under an inseparable train between the starting station and the ending station;
(2)
The continuation task, which mainly considers the time or space required to complete the rolling stock operation.
The time–space network is a standard way to model the routing of rolling stock over time. We define the problem of a time–space network G = ( N , A ) , which can also be considered as an event–activity graph. The time–space network composed of a set N of nodes and a set A of edges. N = N 1 N 2 ; N 1 is the set of train number nodes, N 2 is the set of depots nodes; A = a i j ( n i , n j ) , n i , n j N , i j , a i j ( n i , n j ) corresponds to a link between its departing node n i and the arrival one n j . The edges can be divided into two kinds: the connection between the train number node and depot node and the one between two train number nodes. The links between two train number nodes can be divided into a single-line connection and a two-line node connection, c (Table 3).

3.1. Objective Function

The purpose of the research on the application of the underside of urban rail transit is to reduce the operating costs and improve the utilization rate of the rolling stocks. By adjusting the sequence of the connection between two timetable tasks, the connection time between the tasks can be minimized so that the use of the rolling stock can be more compact and the number of rolling stocks can be minimized. Therefore, considering the above two points comprehensively, they constitute the rolling stock connection cost in urban rail transit operation, which can be shown as the sum of the connection cost and the fixed rolling stock operation cost in Equation (1). For a single day rolling stock connection plan, the goal is to reduce the operating cost of the rolling stocks as much as possible while completing all the transportation tasks on the train diagram. In this paper, the operating cost of the rolling stock is divided into two parts. The first part is the waiting cost of all rolling stocks in each node, including the reversing and connecting cost of the rolling stock between the train task nodes and the running cost between the depot node and the train task node. The purpose is to reduce the non-operating time of the rolling stock as much as possible. The second part is the sum of the fixed costs of the rolling stock involved in the operation. The purpose is to use as few rolling stocks as possible. Although the operation cost will also be incurred when the rolling stock completes the transportation task of each train, the sum of these costs has been fixed since the study in this paper is based on the operation plan under static conditions, so it is not considered here.
min Z = k K i N j N c i j w i j x i j k d + k K i N j N 2 f 1 x i j k d

3.2. Constraint Condition

Considering the actual situation of the urban rail transit rolling stock scheduling, the constraint of the rolling stock connection is mainly the space–time constraint of completing the timetable number task and the rolling stock running on the actual line.

3.2.1. Uniqueness Constraint

The uniqueness constraint means that there is only one node before and after each timetable task node connected to it. The node here can be either the number of trains or the yard node. It can be expressed as:
x i j k = 1 , the rolling stock k connecting node i a n d node j 0 , others
i V , i j k K x i j k = 1   j V 2
j V , j i k K x i j k = 1   i V 2

3.2.2. Rolling Stock Consistency Constraint

The front and the next node of each train timetable node should be held by the same rolling stock and will not be allowed to be replaced by other rolling stocks.
j N x i j k d = j N x j i k d i N 1 , k K

3.2.3. Constraint for Empty Running

There must be a train timetable task between two depot nodes. It means that the empty running is not allowed between two depot nodes, which cannot be directly in place.
j N 2 x i j k d = 0 i N 1 , k K

3.2.4. Spatial–Temporal Constraint of Rolling Stocks

The continuation of two train timetable tasks can be divided into two kinds:
w i j = t j d t i a T B s i a = s j d , i N , j N 1 t j d t i a T B s i a s j d , i N , j N 1
w i j = t j d t i a i N 1 , j N 1

3.2.5. Constraint of the Total Number of Rolling Stocks in Depots

In order to discuss the ability of the most flexible rolling stock scheduling mode, we set the starting depot and the return back depot in the model could be different, which is that the rolling stock could return to a depot other than the original depot when the rolling stock is allowed to perform a depot task. However, after the operation of every day the number of rolling stocks parking in a depot should be remain unchanged, in order to avoid affecting the subsequent use of rolling stock.
j N 1 k K x i j k d = j N 1 k K x j i k d i N 2

3.3. Improved Minimum Ant Colony Algorithm

The optimization model is a hybrid integer programming, which can be solved by the general commercial optimization software CPLEX. However, considering the problem of calculating the bottom of the car, the speed of the accurate algorithm decreases with the scale expansion, and the algorithm is designed to improve the efficiency of actual case calculation.
(1).
Basic data preparation and data pretreatment
The basic data and parameters used by the algorithm include: plan the collection of all transportation tasks in the planning period N , the departure depot of each node task s i d , the arrival depot of each node task s i a , the departure time t i d , the arrival time t i a , the set H k states the set of running tasks selected of an ant k during the planning period, and the set A k states the set of current possible tasks of an ant k .
(2).
Internal circulation process
This involves the subsequent nodes of each node and the collection of these nodes is processed, the task is arranged for the bottom of the car, and eventually some of the bottom of the car will be completed for all of the tasks.
Step 1: Initialize the number of ants, ensure k = 0 .
Step 2: k = k + 1 , issue the first ant will from the depot and randomly select a station as the starting station.
Step 3: According to the sorting of the train task in the starting station, select the first train task node i as the current train task.
Step 4: Clear the set of subsequent node tasks A and add all the elements that meet both the current spatial–temporal requirements and have a consecutive task into set A .
Step 5: Determine whether A is an empty set. If not, execute step 6; if yes, jump to step 12.
Step 6: Determine whether the current train task is carried out by a rolling stock. If not, execute step 7; if yes, jump to step 8.
Step 7: From the depot connected or close to the departure station of the current train node, select a rolling stock to execute the train node task and assign the timetable task number to the rolling stock.
Step 8: According to the state transfer formula to count the probability p i j of choosing a train node j , according to the probability of selecting the train task, select a node j randomly as the next train node.
Step 9: In the way of roulette, replace the current train and turn the selected train node j as the current train number.
Step 10: Count the connect time between train numbers i and j by w i j = t j d t i a and determine whether the connection can be executed.
Step 11: The rolling stock will continue to carry out the train number j and assign the train number to the rolling stock. Jump to step 4.
Step 12: Determine whether a station has been traversed; if yes, randomly select a station that has not been chosen, then select the first train task of the station as the current train node and turn the step 4. If not, execute step 13.
Step 13: Determine whether k k max ; if yes, execute step 14; if not, jump to step 2.
Step 14: End the internal circulation and start the external circulation.
(3).
External circulation process
Judge the termination conditions of the program, if N N max , the operation continues, otherwise end the operation and the algorithm terminates.

4. Results

In order to illustrate the proposed methodology, we compute several experiments based on the Beijing Urban Rail Transit System in April 2021. According to the shared depot, we choose the actual operation of Line 5 and Line 8 as the basic data to present the case analysis.
The length of Line 5 is 27 km, with two depots, the Taipingzhuang depot in the north of the line connecting to Station D, Tiantongyuan North Station, and the Songjiazhuang depot in the south of the line connecting to Station E, Songjiazhuang Station. The length of Line 8 is 27.5 km, with the depot Pingxifu located in the middle of the line connecting to Station C, Huilongguan East Street Station. The Pingxifu depot is close to the Taipingzhuang depot and there is a connection line (shown in Figure 2) between them, which can be used to share the rolling stocks.
The Beijing Subway Line 5 and Line 8 have arranged 562 and 432 trains, respectively, a total of 994 train number nodes. There are 43 and 44 rolling stocks for Line 5 and Line 8, respectively. The travel time from the depots to the stations are shown in Table 4 and the turn-back time is uniformly set as 180 s. The values of algorithm parameters are respected as: pheromone importance α = 1 . 1 , relative importance of heuristic factor β = 1 . 1 , pheromone quantity of an ant Q = 500 , pheromone dilution ρ = 0 . 35 , maximum pheromone value τ max = 200 , minimum pheromone value τ min = 10 , and maximum cycle times N max = 500 . The fixed operation cost for each rolling stock working for a day is f 1 = 10 , 000 and the connection cost for each rolling stock running 1 s c i j = 2 .
In this paper, MATLAB software is used to obtain the results of the operation of two lines in the case with a shared depot. The solving procedure requires 6871 s in an Inter i5 processor with 1.6 GHz and 8 GB of RAM memory. The number of iterations is set as 100. As shown in Figure 3a, 84 rolling stocks are needed in total. Additionally, the total cost is closed to CNY 88.2 million.
The train number missions undertaken by the rolling stocks are shown in Appendix A Table A1.

4.1. Number of Rolling Stock

According to the MATLAB operation results, the number of rolling stocks required by the two lines with a shared depot is 84. Compared with the number of rolling stocks under the independent operation of the two lines, it can reduce three rolling stocks, indicating that the sharing of depot can effectively reduce the number of rolling stocks, the operation cost, and can improve the total utilization of rolling stocks.
In the 84 rolling stocks, there are 68 trains contributing to the shared depot and 16 of the trains belong to the Songjiazhuang Depot.
In addition, according to the task of each rolling stock, statistics can be made on the interconnecting operation between the two lines. According to the statistics, 29.8% of the rolling stocks (25 out of 84 rolling stocks) have been used for both the two routes. It shows that the shared depot can effectively realize the interconnection between the two lines and increase the flexibility of operation.

4.2. Application Evaluation Index

In this paper, two indexes are introduced to evaluate the application of rolling stocks: the application efficiency of rolling stocks φ 1 and the daily utilization efficiency φ 2 .
The application efficiency of rolling stocks is an index to measure the utilization balance of the rolling stocks. The calculation method is the percentage of the running time of each rolling stock in the running time of all rolling stocks. The daily utilization efficiency of the rolling stocks is the ratio of the operating time of the rolling stock to the daily operating time of the rail transit, which can reflect the degree of efficient operation of the rolling stocks in a day. From the above operation results, the utilization time of each rolling stock can be counted. Based on the utilization time, the application efficiency and the daily utilization efficiency of the rolling stocks can be obtained.
φ 1 = T k T k
φ 2 = T k T o p e r a t i o n
T k is the operating time of the rolling stock k and T o p e r a t i o n is the operating time of the rail transit in a day (5:00–23:00). According to the rolling stock utilization plan obtained from Appendix A Table A1, we can obtain the running time of each rolling stock and then count the application efficiency and the daily utilization efficiency of the rolling stocks. The calculation results can be shown in Table 5.
According to the data in Table 5, the overall utilization rate of the rolling stocks is not very high. The highest utilization rate is reached by the 22nd rolling stock, which is 2.16%. The rolling stock of the 51st rolling stock is just 0.2%. The reason for the low utilization rate is that the large number of timetable tasks, reaching 994, while the maximum number of timetable tasks can be borne by each rolling stock is only 20, so the overall utilization rate shall be low.
Moreover, there is a large difference in the application efficiencies of each rolling stock, which indicates that the balances of the utilization of the rolling stocks are not very good. This is presumably because of the ant colony algorithm this paper used. For in the process of ants searching for paths, at the beginning the ants can choose train timetable tasks from a more extensive set, but with the passage of time, all train timetable tasks will be selected. As a result, there are too few tasks that can be chosen by the subsequent ants. However, each train timetable node in the time–space network G should be passed through once, so it must send out a new rolling stock from the depot to undertake the task left, which may lead to the result of unbalanced application efficiency.
In addition, it can be seen from the data of the daily utilization efficiency that the daily utilization efficiency of rolling stocks is not balanced. The highest daily utilization efficiency of the rolling stock can reach 87.22%, that means that the daily operation time of the rolling stock can reach 15.7 h with a non-stop operation state. The lowest rolling stock daily utilization efficiency is 1.96% and the operating time is only 1.4 h.

4.3. Sensitivity Analysis

In this section, two kinds of sensitivity analysis are presented to explain the empirical results on the distributions of unit connection cost and to understand the influence of the mechanism of rolling stock purchase cost on fixed cost.
(1).
Explanation of the empirical results on the distributions of unit connection cost
There has been intensive interest in the parameters how to influence the optimal results. Using sensitivity analysis of the unit connection cost, as shown in Figure 4, the total cost, number of rolling stock, the connecting time, and the computation time can be analyzed from a quantitative point of view.
As shown in Figure 4, though the total cost and computation time both have a slight disturbance caused by the raising of the unit connection cost, they have a similar stability. On the contrary, the number of rolling stocks show an irregular pattern of change between 85 and 89 because the unit connection cost affects the total cost, leading to changes in the optimal results.
(2).
Understanding the influence mechanism of rolling stock purchase cost on fixed cost
The rolling stock purchase cost can be a large part of the unit rolling stock operation daily cost, which is an important factor of total cost. In the sensitivity analysis process, the unit rolling stock purchase cost is high, which means that the operators will be more inclined to add the rolling stock connection and waiting behavior to complete the train tasks. The sensitivity analysis of the rolling stock purchase cost can be seen in Figure 5.
Figure 5 illustrates the findings of the sensitivity analysis with the rolling stock purchase cost. Firstly, the total cost increased with the increase in the purchase cost, presenting a single growth trend. Then, the numbers of rolling stock were between 87 and 88 with different unit rolling stock purchase costs. Finally, the computation times were between 4100 and 5100 s.

5. Discussion

The optimization problem of the rolling stock utilization plan of urban rail transit based on shared depots studied in this paper shows that the rolling stock plan plays a very important role in the whole cycle gradually from the early single line operation time to the network operation time, which directly affects the quality of the service level and operating cost of urban rail transit systems.
By summarizing the characteristics of the sharing rolling stocks problem, the urban rail transit rolling stock planning can be compiled as a process into multiple traveling salesman problems, with the total cost and the rolling stock fixed cost minimum as objective functions.
The max–min ant colony algorithm is selected to calculate the above model using lots of the literature readings. The steps of the algorithm are formulated and the basic formula and parameters of the algorithm are explained.
Select Line 5 and Line 8 of the Beijing Metro as a case, both lines have 994 timetable train tasks in a day and the total number of rolling stocks required is 87. Combined with the case, MATLAB was used to calculate the number of rolling stocks operation plans jointly prepared by the two lines with a shared depot and found it to be 84, 3 less than the actual situation.
By analyzing the running time of each counted rolling stock, we find that the balance of the rolling stocks application rate is not very good. The usage rate of the rolling stocks varies from 1.96 to 87.22% in a day. An analysis of unsatisfactory equilibrium results is also carried out. In the future, more solutions will be used to study this problem for comparison.

Author Contributions

Conceptualization, J.F.; methodology, S.L.; software, G.L.; writing—original draft preparation, Y.S.; writing—review and editing, Z.L. All authors have read and agreed to the published version of the manuscript.

Funding

The research described in this paper was substantially supported by the Fundamental Research Funds for the Central Universities (2021JMBM015) and projects (Nos. of 71901022 and 71621001) from the National Natural Science Foundation of China.

Data Availability Statement

Not applicable.

Acknowledgments

The authors would like to thank anonymous referees for their helpful comments and valuable suggestions that improved the content and composition substantially.

Conflicts of Interest

The authors declare no conflict of interest.

Appendix A

Table A1. The rolling stock utilization plan.
No. of Rolling StocksTrain Numbers
1X-81002-81035-81040-81119-81118-81339-81334-81415-81414-81453-81454-
51437-X
2X-51001-51014-51043-51072-51113-51138-51163-51180-51201-51218-51239-
51256-51277-51298-51341-51380-51391-51416-X
3Y-51003-51016-51045-51074-51115-51140-51165-51182-51205-51222-51243-
51260-51281-51306-51337-51376-51387-51414-Y
4X-51018-51047-51078-51119-51142-51167-51184-51207-51224-51245-51262-
51283-51310-51343-51382-51393-51418-X
5X-51007-51020-51051-51082-51123-51144-51169-51186-51209-51226-51247-
51264-51285-51314-51345-51384-51395-51424-X
6X-51009-51022-51055-51088-51129-51148-51171-51188-51211-51228-51251-
51268-51295-51328-51357-51390-51401-51422-X
7X-51002-51027-51050-51091-51122-51149-51168-51191-51208-51229-51246-
51267-51284-51315-51352-51373-51402-51411-51430-X
8X-51004-51029-51052-51093-51124-51151-51170-51195-51212-51233-51250-
51271-51288-51323-51362-51379-51406-51413-51434-X
9X-81011-81012-81059-81064-81143-81132-81189-81188-81223-81224-81255-
81256-81289-81290-81345-81348-51369-51398-51407-51426-X
10X-51006-51031-51054-51095-51126-51153-51174-51197-51214-51235-51252-
51273-51294-51327-51366-51381-51408-51415-51436-X
11X-81006-81043-81050-81133-81130-81363-81358-81431-81432-81467-81468-X
12X-51008-51035-51060-51101-51130-51155-51172-51193-51210-51231-51248-
51269-51286-51317-51354-51375-51404-51417-51438-X
13X-81008-81049-81056-81131-81120-81183-81182-81215-81216-81247-81248-
81279-81280-81325-81328-81409-81408-51409-51428-X
14Y-51011-51026-51063-51094-51133-51152-51175-51192-51213-51230-51253-
51270-51291-51324-51353-51388-51403-51440-Y
15X-51010-51037-51070-51111-51136-51161-51178-51199-51216-51237-51254-
51275-51296-51329-51368-51383-51410-51419-51442-X
16Y-51013-51028-51065-51098-51135-51154-51177-51194-51215-51232-51255-
51272-51297-51330-51359-51396-51405-Y
17X-81010-81057-81062-81147-81144-81323-81318-81397-81398-81447-81448-
51431-X
18X-51015-51030-51067-51100-51137-51156-51179-51196-51217-51234-51261-
51278-51305-51340-51367-51400-51427-X
19X-81016-81065-81070-81153-81150-81197-81196-81227-81228-81259-81258-
81291-81292-81349-81352-51433-X
20X-81013-81020-81077-81082-81167-81164-81203-81204-81235-81236-81267-
81268-81305-81306-81377-81382-51423-X
21Y-81018-81071-81076-81159-81156-81331-81326-81407-81406-81449-81456-
51439-Y
22X-51012-51039-51066-51107-51134-51159-51176-51203-51220-51241-51258-
51279-51302-51333-51372-51385-51412-51435-X
23Y-81003-81024-81083-81086-81169-81168-81205-81206-81237-81238-81271-
81272-81307-81308-81381-81386-81441-81440-81475-81476-Y
24Y-81005-81030-81095-81098-81175-81174-81209-81210-81241-81244-81275-
81276-81313-81316-81393-81396-51421-Y
25X-81022-81079-81014-81165-81152-81309-81314-81405-81404-51397-X
26X-51017-51032-51071-51102-51141-51160-51181-51198-51219-51236-51257-
51274-51299-51334-51361-51392-51425-X
27Y-51019-51036-51077-51108-51145-51164-51185-51202-51223-51240-51263-
51280-51311-51348-51371-Y
28X-51021-51038-51079-51114-51147-51166-51187-51204-51225-51242-51265-
51282-51313-51350-51377-X
29Y-81026-81087-81090-81319-81320-81399-81400-51429-Y
30X-81007-81032-81101-81104-51347-51386-81459-81460-X
31X-81009-81072-81157-81154-81199-81198-81229-81230-81261-81262-81299-
81300-81365-81368-81435-81438-81473-81474-X
32X-81023-81028-81089-81092-81171-81172-81207-81208-81239-81240-81273-
81274-81311-81312-81385-81392-X
33X-81004-81041-81046-81123-81114-81295-81294-81353-81356-51399-51420-X
34X-51024-51057-51090-51131-51150-51173-51190-51221-51238-51259-51276-
51301-51336-51363-51394-81465-81466-X
35Y-81017-81042-81125-81122-81315-81310-81387-81394-81445-81446-81481-
81480-Y
36X-81015-81034-81105-81108-81179-81178-81213-81214-81245-81246-81277-
81278-81317-81322-81403-81402-81455-81458-X
37X-51034-51073-51104-51139-51158-51189-51206-51249-51266-51287-51318-
51349-X
38X-81067-81094--81097-81112-81153-81158-81162-81181-81148-81213-81322-
81367-81374-X
39X-51042-51083-51116-51157-51316-51351-X
40Y-81036-81107-81110-81347-81342-81423-81424-81461-81462-Y
41Y-51044-51085-51118-51331-51370-81463-81464-Y
42X-81031-81048-81129-81128-81187-81186-81219-81220-81251-81252-81285-
81288-81337-81340-X
43Y-81039-81038-81115-81116-81185-81184-81217-81218-81249-81250-81281-
81282-81329-81332-81413-81412-Y
44X-81047-81044-81127-81126-81283-81284-81333-81336-81417-81416-X
45X-51046-51087-51120-51339-51378-81471-81472-X
46X-81051-81054-81137-81134-81343-81338-81419-81418-81457-81470-X
47X-81019-81060-81145-81140-81193-81192-81225-81226-81257-81260-81293-
81296-81357-81360-81433-81434-81469-81478-X
48X-81021-81058-81141-81138-81335-81330-81411-81410-81451-81452-X
49Y-51048-51089-51128-51289-51320-51355-Y
50Y-81052-81139-81136-81191-81190-81231-81232-81263-81264-81301-81302-
81369-81372-Y
51X-81001-51432-X
52Y-51005-51304Y
53X-81025-81102-81177-81176-81211-81212-81243-81254-81287-81298-81361-
81364-81439-81442-81477-81482-X
54X-81055-81066-81151-81148-81391-81388-X
55Y-81063-81068-81163-81160-81201-81200-81233-81234-81265-81266-81321-
81324-81421-81420-Y
56X-81027-81080-81173-81180-81221-81222-81253-81270-81373-81376-81437-
81436-81479-X
57Y-51025-51058-51099-51132-81443-81444-X
58X-51033-51062-51103-51146-51293-51326-51365-X
59X-81029-81170-81269-81286-81341-81346-81425-81426-X
60X-51041-51076-51117-51360-X
61X-51056-51097-51312-81395-81390-X
62X-51064-51105-51332-81427-81428-X
63X-81069-81074-81155-81142-81195-81194-81297-81304-81429-81430-X
64X-81078-81161-81158-51321-51358-X
65X-81075-81084-81181-81202-51325-51364-X
66X-51049-51080-51121-51346-X
67X-81088-51309-51344-X
68X-81094-81327-81344-X
69X-81085-81096-51303-51338-X
70X-81093-81100-81303-81354-X
71X-51053-51084-51125-51290-51335-X
72X-51059-51092-51307-51342-X
73Y-51061-51096-81401-81422-Y
74X-81053-81106-51069-51106-81383-81380-X
75X-81033-81112-81099-81124-X
76Y-81166-81375-81374-Y
77X-51075-51110-81351-81350-X
78X-51109-51300-81379-81378-X
79X-81135-81146-81037-81162-81359-81370-X
80X-81117-81242-51068-51127-51292-81389-81384-X
81X-81061-81362-81045-81366-X
82X-51086-51308-81371-81450-X
83X-81109-51304-81355X
84Y-51023-51040-51081-51112-51143-51162-51183-51200-51227-51244-51319-51356-51389-Y

References

  1. Mao, B.; Gao, Z. Progress of operational resources sharing methods for urban rail networks. J. Transp. Syst. Eng. Inf. Technol. 2018, 18, 1–8. [Google Scholar]
  2. Huisman, D.; Kroon, L.G.; Lentink, R.M.; Vromans, M.J.C.M. Operations research in passenger railway transportation. Stat. Neerl. 2005, 59, 467–497. [Google Scholar] [CrossRef] [Green Version]
  3. Haahr, J.; Lusby, R.M. Integrating rolling stock scheduling with train unit shunting. Eur. J. Oper. Res. 2017, 259, 452–468. [Google Scholar] [CrossRef] [Green Version]
  4. Lin, Z.; Kwan, R.S.K. A branch-and-price approach for solving the train unit scheduling problem. Transp. Res. Part B Methodol. 2016, 94, 97–120. [Google Scholar] [CrossRef]
  5. Peeters, M.; Kroon, L. Circulation of railway rolling stock: A branch-and-price approach. Comput. Oper. Res. 2008, 35, 538–556. [Google Scholar] [CrossRef] [Green Version]
  6. Fioole, P.-J.; Kroon, L.; Maróti, G.; Schrijver, A. A rolling stock circulation model for combining and splitting of passenger trains. Eur. J. Oper. Res. 2006, 174, 1281–1297. [Google Scholar] [CrossRef] [Green Version]
  7. Cacchiani, V.; Caprara, A.; Toth, P. A Lagrangian heuristic for a train-unit assignment problem. Discret. Appl. Math. 2013, 161, 1707–1718. [Google Scholar] [CrossRef]
  8. Lai, Y.; Wang, S.; Huang, K. Optimized train-set rostering plan for Taiwan high-speed rail. IEEE Trans. Autom. Sci. Eng. 2017, 14, 286–298. [Google Scholar] [CrossRef]
  9. Tomiyama, T.; Sato, T.; Okada, K.; Wakamiya, T.; Murata, T. Railway rolling-stock-assignment-scheduling algorithm for minimizing inspection cost. IAENG Int. J. Appl. Math. 2018, 48, 228–237. [Google Scholar]
  10. Canca, D.; Sabido, M.; Barrena, E. A rolling stock circulation model for railway rapid transit systems. Transp. Res. Procedia 2014, 3, 680–689. [Google Scholar] [CrossRef] [Green Version]
  11. Luis, C.; Ángel, M. Robust rolling stock in rapid transit networks. Comput. Oper. Res. 2011, 38, 1131–1142. [Google Scholar]
  12. Giacco, G.L.; D’Ariano, A.; Pacciarelli, D. Rolling stock rostering optimization under maintenance constraints. J. Intell. Transp. Syst. 2014, 18, 95–105. [Google Scholar] [CrossRef]
  13. Zheng, L.; Song, R.; Xiao, Y.; Liu, J. Optimization method for working out vehicle scheduling plan of urban rail transit under network operation. China Railw. Sci. 2014, 35, 104–110. [Google Scholar]
  14. Yue, Y.; Han, J.; Wang, S.; Liu, X. Integrated train timetabling and rolling stock scheduling model based on time-dependent demand for urban rail transit. Comput.-Aided Civ. Infrastruct. Eng. 2017, 32, 856–873. [Google Scholar] [CrossRef]
  15. Wang, Y.; Tang, T.; Ning, B.; Meng, L. Integrated optimization of regular train schedule and train circulation plan for urban rail transit lines. Transp. Res. Part E Logist. Transp. Rev. 2017, 105, 83–104. [Google Scholar] [CrossRef]
  16. Zhang, M.; Wang, Y.; Su, S.; Tang, T.; Ning, B. A short turning strategy for train scheduling optimization in an urban rail transit line: The case of Beijing Subway Line 4. J. Adv. Transp. 2018, 2018, 5367295. [Google Scholar] [CrossRef]
  17. Zhong, Q.; Zhang, Y.; Dian, W.; Zhong, Q.; Wen, C.; Peng, Q. A mixed integer linear programming model for rolling stock deadhead routing before the operation period in an urban rail transit line. J. Adv. Transp. 2020, 2020, 3809734. [Google Scholar] [CrossRef]
  18. Placido, A.; D’Acierno, L. A methodology for assessing the feasibility of fleet compositions with dynamic demand. Transp. Res. Procedia 2015, 10, 595–604. [Google Scholar] [CrossRef] [Green Version]
  19. Samà, M.; D’Ariano, A.; Pacciarelli, D.; Corman, F. Lower and upper bound algorithms for the real-time train scheduling and routing problem in a railway network. IFAC-PapersOnLine 2016, 49, 215–220. [Google Scholar] [CrossRef]
  20. D’Ariano, A.; Meng, L.; Centulio, G.; Corman, F. Integrated stochastic optimization approaches for tactical scheduling of trains and railway infrastructure maintenance. Comput. Ind. Eng. 2019, 127, 1315–1335. [Google Scholar] [CrossRef]
  21. van Hövell, M.E.M.A.; Goverde, R.M.P.; Bešinović, N.; de Weerdt, M.M. Increasing the effiectiveness of the capacity usage at rolling stock service locations. J. Rail Transp. Plan. Manag. 2022, 21, 10297. [Google Scholar]
Figure 1. Layout of lines and depots with a shared depot.
Sustainability 14 15075 g001
Figure 2. The layout of the Beijing Urban Rail Transit Line 5 and Line 8.
Sustainability 14 15075 g002
Figure 3. Results for the iteration equal to 100.
Sustainability 14 15075 g003
Figure 4. The layout of the Beijing Urban Rail Transit Line 5 and Line 8.
Sustainability 14 15075 g004
Figure 5. The sensitivity analysis of rolling stock purchase cost.
Sustainability 14 15075 g005
Table 1. Summary of relevant studies on the rolling stock scheduling and circulation planning.
PublicationsObjectInfrastructureModel StructureSolution Algorithms
Single LineMulti LineSingle DepotMulti DepotsShared Depot
Cadarso [11]SR MCFMCPLEX
Ciacco [12]SR MILPBD
Zheng [13]URT MIPTabu research
Yue [14]URT Bi-level modelCPLEX/SA
Wang [15]URT MILPCPLEX
Zhang [16]URT MILPCPLEX
Zhong [17]URT MILPCPLEX
Samà [19]R MILPLB/UB/CPLEX
D’Ariano [20]R MILPCPLEX
Our workURT MIPACO
Symbol description for this table: railway (R); suburban railway (SR); urban rail transit (URT); multi-commodity flow model (MCFM); mixed integer linear programming (MILP); mixed integer programming (MIP); Cplex solver (CPLEX); benders decomposition (BD); lower bound (LB); upper bound (UB); simulated annealing (SA); and ant colony optimization algorithms (ACO).
Table 2. Comparison of the ownership relationship between the rolling stock and the parking depot.
Rolling Stock Number of DepotWhether Rolling Stock Belongs to the DepotCapacity UtilizationFlexibilityManagement Complexity
Fixed depot rolling stock operation modeFixedYesLowerLowerLower
Cycle/beat type rolling stock operation modeFixedYesAverageAverageAverage
Variable rolling stock operation modeFixedNoHigherHigherHigher
Table 3. Symbols and meanings of parameter variables.
Parameters
K set of rolling stocks, K = k k = 1 , , M
k rolling stock
N 1 set of train number nodes, N 1 = r r = 1 , , n
N 2 set of depot nodes, N 2 = d d = n + 1 , , n + D
N set of both train number and depot nodes
r train number
d depot
c i j unit connection cost
w i j connect time between train numbers i and j
t r d the departure time of train number r
t r a the arrive time of train number r
T B the standard continuous time standard between node i and node j
T S the standard time for the passenger operation process of rolling stock
T Z the standard time for turn-back operation of rolling stock
s r d the departure station of train number node r
s r a the arrive station of train number node r
f 1 Fixed operation cost for a day of one rolling stock
m d the parking capacity of depot d
x i j k d 0–1 decision variable, 1 represents rolling stock k coming from depot d departing from node i to node j , otherwise is 0, i , j N
Table 4. The running time between depots and the connecting stations.
Running SectionX–AX–BX–CX–DX–EY–E
Running time (seconds)92616513063362280210
Table 5. The rolling stock of application evaluation index.
No.Running TimeThe Application EfficiencyThe Daily Utilization EfficiencyNo.Running TimeThe Application EfficiencyThe Daily Utilization Efficiency
132,7601.25 50.56 4343,9201.68 67.78
252,9202.02 81.67 4425,8000.98 39.81
352,9202.02 81.67 4520,3400.78 31.39
449,9801.91 77.13 4626,4001.01 40.74
552,9202.02 81.67 4750,7601.94 78.33
649,9801.91 77.13 4827,0001.03 41.67
755,8602.13 86.20 4917,6400.67 27.22
855,8602.13 86.20 5036,0601.38 55.65
955,0802.10 85.00 5151600.20 7.96
1055,8602.13 86.20 5258800.22 9.07
1129,8201.14 46.02 5345,1201.72 69.63
1255,8602.13 86.20 5414,5200.55 22.41
1352,0201.98 80.28 5538,2801.46 59.07
1452,9202.02 81.67 5636,6601.40 56.57
1555,8602.13 86.20 5717,4000.66 26.85
1649,9801.91 77.13 5820,5800.79 31.76
1732,7601.25 50.56 5922,5600.86 34.81
1849,9801.91 77.13 6014,5800.56 22.50
1944,6401.70 68.89 6113,8600.53 21.39
2047,4601.81 73.24 6214,4600.55 22.31
2132,7601.25 50.56 6326,4001.01 40.74
2256,5202.16 87.22 6414,3400.55 22.13
2355,8002.13 86.11 6516,5600.63 25.56
2446,8601.79 72.31 6614,7000.56 22.69
2525,3200.97 39.07 6711,6400.44 17.96
2649,9801.91 77.13 6866600.25 10.28
2744,1001.68 68.06 6910,9200.42 16.85
2844,1001.68 68.06 7010,6800.41 16.48
2920,8800.80 32.22 7114,7000.56 22.69
3021,6000.82 33.33 7211,7600.45 18.15
3150,1601.91 77.41 7310,9200.42 16.85
3243,9201.68 67.78 7413,7400.52 21.20
3328,2601.08 43.61 7510,6800.41 16.48
3449,7401.90 76.76 7610,9200.42 16.85
3532,6401.25 50.37 7710,3200.39 15.93
3650,7601.94 78.33 7812,9000.49 19.91
3735,2801.35 54.44 7916,6800.64 25.74
3838,2201.46 58.98 8017,2600.66 26.64
3917,6400.67 27.22 8112,0000.46 18.52
4024,1800.92 37.31 8213,7400.52 21.20
4120,3400.78 31.39 8387000.33 13.43
4238,2801.46 59.07 8435,4601.35 54.72
Publisher’s Note: MDPI stays neutral with regard to jurisdictional claims in published maps and institutional affiliations.

