Article

Addressing Energy Poverty in the Energy Community: Assessment of Energy, Environmental, Economic, and Social Benefits for an Italian Residential Case Study

1
Department of Engineering, University of Sannio, 82100 Benevento, Italy
2
Department of Engineering, Durham University, Durham DH1 3LE, UK
3
School of Mechanical Engineering, Kalinga Institute of Industrial Technology, Deemed to be University, Bhubaneswar 751024, India
*
Author to whom correspondence should be addressed.
Sustainability 2022, 14(22), 15077; https://doi.org/10.3390/su142215077
Submission received: 4 October 2022 / Revised: 31 October 2022 / Accepted: 8 November 2022 / Published: 14 November 2022

Abstract

:
Although a clear definition of energy poverty has not been reported in the scientific literature or in general energy directives, this condition affects about 10% of European people. During the last three years, the COVID-19 pandemic combined with the increase in energy bill costs due to energy conflicts has determined the increment of energy poverty. The Renewable Energy Directive, that defines a new legal entity named Renewable Energy Community as a new end-users’ organization, recognizes the chance for low-income households to benefit from being able to access affordable energy tariffs and energy efficiency measures thanks to these new entities. Thus, this paper analyses the energy, economic, and environmental performances of a renewable energy community composed of three residential users distributed in two buildings located in the south of Italy, and one of these buildings is equipped by a rooftop photovoltaic plant. The plants were modelled and simulated through HOMERPRO simulation software while the building energy loads are real and were imported from an energy distributor dataset and were processed in the MATLAB simulation interface. The analysis concerned the comparison of the energy performance achieved by one case in which no renewable plants were installed, and by another case in which the end-users took part in the renewable energy community by sharing the photovoltaic “produced” electricity. The investigation was conducted in terms of the quantity of electricity imported from the power grid and consumed on-site, the avoided emissions, and the operating costs. The business plan has been devoted to defining the advantages of the energy community for vulnerable end-users in a popular neighborhood council estate by evaluating the social energy poverty indexes. The results showed that through the renewable energy community, a mitigation of energy poverty is obtained within a range of 12–16%.

1. Introduction

A European Union (EU) report, launched by the Energy Poverty Observatory, stated that up to 8% of European people were not able to reach sufficient thermal conditions in their home in 2020 [1]. This is the one of the main demonstrations of the energy poverty (EP) development that derives from a mix of different conditions, such as: a high share of peoples’ income which covers the energy expenditure; the limited incomes of individuals; the poor energy efficiency of energy conversion systems; and the low energy performance of buildings. All EPs drivers have been exacerbated by the COVID-19 pandemic that impacted on human health, the world economy, and welfare systems [2]. Indeed, the World Bank has assessed that in 2020, about 115 million people fell into extreme poverty, and this share has increased up to 124 million in 2021 due to the COVID-19 pandemic [3]. Energy poverty in Europe covers a range of 50 and 125 million people [4], but this index changes very significantly across different member states [5]. Although, an accurate investigation of the problem at the EU level is limited by many indexes, various definitions of what EP is [6], and a low number of data [7]. A recent European analysis divided EU countries into three pools as a function of the geographical coverage. The first pool is Central and Eastern European countries, the second pool is countries of Western and Northern Europe, and the third pool is Southern Europe. A total of 48 different studies were identified and analyzed. The majority of studies focus on Southern European countries such as Greece (9), Spain (9), Portugal (6), and Italy (5). This group of countries is particularly vulnerable to energy poverty, as evidenced by the EP indicators [8]. In addition, the Russian invasion of Ukraine in February 2022 has also negatively affected the global economy, increasing the natural gas price and consequently the cost of electricity, especially for countries in which electricity production is highly based on thermoelectric plants, such as in Italy [9]. European countries are experiencing serious disruptions in the supply and rising prices of energy, foods, raw materials, and other primary needs of normal human lives. Thereby, the war could have a devastating impact on EP around the world. The Italian Institute of Statistics estimates that in Italy, over two million families are in absolute poverty (about 7.7%), resulting in 5.6 million of absolute poor people (the incidence among individuals rises up to 9.4%), also due to the increase of energy, metal, and food costs [10]. Indeed, Italy and many other countries are pursuing two objectives that could help the EP questions: the energy security in their economies and the implementation of sustainable development goals [11] by defining the high influence of energy questions on the economic balance of their country [12]. In this context, the EU is committed to fighting EP by protecting vulnerable people through different policy actions. In line with European goals, Italy matched the low emissions targets in 2020 thanks to the Italian National Energy Strategy (SEN) [13] in which the residential building sector is defined as a crucial sector for improving the national energy efficiency [14]. The Clean Energy for all Europeans package, approved in 2019, has recognized the need to address EP as the main pillar of the energy policy in the following years [15]. EU countries are enforced to detect the number of vulnerable people and to make available the standards used for their evaluation. Thus, EU countries that identify a significant share of energy poor consumers are obliged to use the national energy and climate plans and renovation actions to set strategies for tackling EP. The European Commission has further supported the fight against the EP through the Recommendation on EP (EU 2020/1563) [16] that provides guidelines, indicators, and provides a definition of EP to assess it. Among the various directives launched in the Clean Energy for all Europeans package, the Renewable Energy Directive (RED II), enforced in December 2018 [17], has given a formal definition of a renewable energy community (REC) for the first time. The REC is a legal entity involving groups of citizens, public authorities, third sector entities, small and medium-sized enterprises, and social entrepreneurs which is directly involved in the energy transition through producing, selling, storing, and sharing renewable energy with the aim to ensure energy, environmental, and social benefits, instead of economic profits, and fight EP by means of the constrain to involve all households, including vulnerable users. Thus, RECs allow the participation of citizens in the energy transition and guarantee the access to affordable energy tariffs and energy efficiency measures by providing benefits for all, especially for energy-poor persons [18]. In addition, in some EU countries such as Italy, these actions are compatible and combined with the improvement of buildings by implementing measures that improve the energy performance of the building [19,20].
Thanks to the recent legal recognition of RECs and the ensured potential benefits, an intense scientific activity has been developed in recent years on this topic. Different researchers have focused their attention on the evaluation of the techno-economic and environmental aspects of RECs [21].
From a techno-economic point of view, Luz and Silva [22] presented three photovoltaic (PV)-based REC configurations in a small Portuguese city. They developed a Python-based Calliope model of the community by using the real electricity demand to perform the techno-economic evaluation of the three configurations. They demonstrated that all arrangements ensured a PV penetration higher than 23% and an overall reduction in electricity bills up to 8%. Ceglia et al. [23] modeled by means of TRNSYS 17 a small REC composed by two offices that share their PV plants in the south of Italy. They highlighted that the REC configuration ensures an up to 79% increase in self-consumed electricity, with respect to the case in which the sharing electricity between the offices was not allowed. Felice et al. [24] investigated the influence of the electrification of heating and the transport sector, as well as the variability in electricity and the price of RES-based technologies on the RECs’ business plan. They developed a mixed-integer linear model to cut down the RECs’ electricity costs and found that RECs could guarantee a reduction in electricity costs up to 26% compared to the business-as-usual approach. Petrichenko et al. [25] compared the economic profitability of being a distributed prosumer or an REC prosumer by creating a high-resolution model that juxtaposed the different development scenarios of the power grid configuration and the penetration of RESs in the power sector. They demonstrated that the configuration of RECs was the more economic advantageous entity rather than the individual prosumer scheme. More precisely, the avoided costs for the RECs prosumer were about 20% greater than that for the individual one in the case of rooftop PV installations, ensuring a shorter payback period.
Since one of the main drivers for the diffusion of RECs lies in the environmental benefits that they ensure, several studies have analyzed this issue together with the techno-economic aspects. For example, Minuto et al. [26] explored the combination of technologies and retrofit scenarios to reach the EUs environmental goals in a renewable energy community consisting of a condominium located in northern Italy. They applied a multi-criteria analysis and found that the best tradeoff between the economic and environmental performance was the installation of a photovoltaic-driven heat pump that ensures the economic profitability of an investment and a 30% carbon dioxide (CO2) emissions reduction. Fina et al. [27] analyzed the financial and economic benefits for individual citizens that belonged to a REC by considering the different technologies and storages. Scharm et al. [28] evaluated the environmental benefits deriving from the diffusion of a REC in comparison with no-REC scenarios in eight European countries. Fleischhacker et al. [29] proposed a framework to define a REC in a city district by using two open-source models based on the optimization of both economic income and a reduction in CO2 emissions. An Italian study defined the possibility to account for the presence of thermal energy sharing in an energy district based on a “programmable” RES by showing many advantages in a popular quartier in Naples [30].
Moreover, the subject of “energy communities” inherits many of the results and problems associated with the smart-grid and micro-grid [31], but it must also consider the problems associated with technological and social viability within a framework of market-policy [32]. Numerous researchers have examined the configurations of grids and micro-grids with a focus on the technology that can enable the sharing of distributed generated electricity [33]; the control and optimization strategies to optimise the grid (or micro-grid) power flow [31]; or the multi-objective approach to determine the best capacity and type of generation resources for the microgrids [34]. Other researchers have focused on how the energy demand–generation matching technologies may increase the self-sufficiency and the self-consumption of individuals [35].
The aforementioned works are only a small part of many of the most recent research activities on the REC topic and they all have a common factor: they focus on the multidisciplinary goals concerning RECs such as techno-economic optimization, the sizing process for various technologies, and the environmental impact. However, evidences and the recent policy trajectories demonstrate that this traditional approach is not enough to provide a global insight concerning the REC as it does not consider any social factors. Thus, the social implications, such as the creation of jobs or social acceptability and human development must be evaluated to assess the social sustainability of RECs [36]. Some recent works addressed this issue, highlighting the social role of RECs. Hanke et al. explored how RECs could improve energy poverty and injustice by favoring the access of vulnerable groups to affordable energy price [18]. Knox et al. [37] performed a scientific review on the energy community concept and the energy justice dilemma. Hanke and Lowitzsch [38] suggested that vulnerable citizens and RECs need incentives and social and economic support to ensure the participation of vulnerable consumers in RECs. Ambole et al. [39] investigated the pivotal role that RECs could assume in emerging countries, such as those in Sub-Saharan Africa, to facilitate the access to energy and to fight energy poverty. In this region, indeed, about 600 million people live in villages with no electricity and up to 890 million people still adopt dangerous and non-environmentally friendly fueled-based energy conversion systems. Ehnberg et al. [40] assessed the key function that RECs could have in the electrification of a rural community with a high level of poverty.
However, the capability of RECs to mitigate EP has scarcely been investigated in the scientific literature, especially in comprehensive studies which aimed to assess the contemporary energy, environmental, economic, and social aspects of these new entities. Thus, in this study, two different novel issues are addressed:
(i)
The assessment of the energy, environmental, economic, and social benefits of a photovoltaic-based REC located in the south of Italy, compared with the case in which an REC does not exist, in order to evaluate the mitigation of EP.
(ii)
The definition of a new social indicator to measure the potential of RECs in the mitigation of energy poverty.
The social question of EP will be analyzed in this article with the aim to observe if the REC organization can mitigate this social phenomenon. For this reason, the indexes that this paper proposes are referred to the specific economic condition of families and they are often used to define the social welfare services. In order to obtain these goals, the correct selection of EP indicators is fundamental for identifying the EP conditions. It should consider that the EP indicators have been typically classified according to different aspects, such as the objectiveness and subjectiveness, object of measurement (causes, drivers, or outcomes), category, type, outcome, comparability, robustness and quality, and data availability [41]. This paper investigates the condition of EP from simple end-users to a REC by considering a real case study in which the electric energy is be considered as a “primary good”. The aim of this study is to give the methods that were used and suggestions to an energy policy organization to introduce REC organizations into their territories by also including the vulnerable families, as reported in Section 2.2 (point 4), of the REDII [17]. The paper aims to develop the idea that the REC could be considered as the first step in providing a social benefit by acting with a bottom-up approach. In order to realize this scope, a precise methodology has been applied. More precisely, in this paper, the REC energy assessment has been performed through the primary energy evaluation by considering the hourly based electric efficiency indicator for Italian electricity production [42]. The RECs’ economic performances have been evaluated through the well-known indices of the simple payback (SPB) period and the net present value (NPV), as has often been done in the scientific literature [23,43,44]. Concerning the social aspect of the REC, a detailed analysis of the social indexes used in the literature to evaluate EP has been undertaken. The European Commission, with an initiative called the “Energy Poverty Advisory Hub”, proposes the use of two indexes to evaluate energy poverty: the “Low absolute energy expenditure” (M/2) indicator and the “High share of energy expenditure in income” (2M) indicator [44]. M/2 is an index that includes the people that appear to spend too little on energy services and the families in which their energy expenditure is below half of the national median. On the contrary, the 2M index calculates the percentage of users whose energy expenditure share in their income is more than twice the national median share. Another usable index is defined by evaluations in England, which is called “Low Income High Costs” (LIHC), and it takes into account two conditions: the first one is the indicator under which a household is if the people have an energy expenditure above the national median and if the remaining income after they spend that amount is below the official poverty threshold [45]. The results of these indicators could present many inconsistencies due to the not-objective evaluations, the high energy efficiency of some buildings, the house dimensions, etc. For these reasons, a highly popular “10%” indicator is introduced to determine EP condition [46]. It was introduced by Boardman [47] and it defines a household as energy-poor if 10 percent or more of their income is spent on covering energy services. In order to evaluate the EP condition of users by using an objective approach that includes the economic condition of users, the 10% index is used in this study. Moreover, a new socio-economic index that accounts for the equivalent economic status indicator has been introduced and evaluated here.
Following this introduction, the next section presents the materials and methods with reference to the buildings and the users’ description (Section 2.1), the energy conversion systems sizing and configuration (Section 2.2), and the model (Section 2.3) and the methodological pathway (Section 2.4) that describes the research approach that forms the techno-economic, environmental, and social points of view. Section 3 deals with the results and discussion of our research questions. Finally, Section 4 refers to the concluding remarks and points out a need for further research activities.

2. Materials and Methods

In this section, the procedure followed to perform the proposed analysis is presented by four subsections. The first one investigates the buildings and users which make up the REC (Section 2.1). The second one presents the energy conversion systems included in the REC (Section 2.2). Section 2.3 describes the method used for the simulation. In Section 2.4, the methodologies for the energy, environmental, economic, and social analyses are reported.

2.1. Buildings and Users’ Characterization

According to the REDII [17], a district-level REC consisting of three residential users located in San Felice a Cancello, Caserta (the south of Italy, 1034 heating degree days, Italian climatic zone C) is considered. As shown in Figure 1, the three residential users are named R#1, R#2, and R#3 in order to distinguish them.
R#1 occupies the second-floor flat, and R#2 inhabits the first-floor flat of the same building which was erected in 2000. The flats lived-in by R#1 and R#2 have a floor area of 100 m2 and 140 m2 and a heated volume of 300 m3 and 420 m3, respectively. Additionally, R#3 is a single-family house constructed in 1970 and retrofitted in 2020 with a total floor area of 145 m2 and a heated volume of 487 m3 (Figure 1).
R#1 and R#2 are within 300 m from R#3, and they are connected to the same primary electric substation located near the building occupied by R#1/2. R#1 is a family composed of three workers, while R#2 is a family consisting of two adults (of which one is a worker) and two young students. R#3 is a family made up of one retried person and one young worker. The occupancy schedules of R#1, R#2, and R#3 in a typical weekday and weekend day are graphed in Figure 2a,b, respectively.
The main envelope characteristics of each flat are reported according to the time of construction in Table 1 [48].
The electric load of each flat is never equal to zero. A low base electric load in the range of 0.10–0.43 kW is recorded during the night hours, and it is imputable to the alarm system, emergency lights, refrigerators, and phone chargers. The electric load has been determined by considering the real dataset made available by the electricity distributor for each investigated end-user through the corresponding personal point of delivery (POD) [49]. For example, the electric load of a typical weekday and weekend day is depicted in Figure 3a for the winter and in Figure 3b for the summer period.
In addition, in Figure 4, the electric energy requested in each month of 2021 is reported for the three end-users by using real data and their aggregation. The annual electricity demand is equal to 5197, 3746, and 4398 kWh for R#1, R#2, and R#3, respectively.
The electricity is used to supply electric appliances and electric-based energy conversion systems to cover the cooling loads for all users. In addition, in the flat occupied by the R#3 user, the electricity is also used to meet sometimes the heating demand since it is equipped with a reversible electric heat pump (EHP). According to Italian legislation [50], the heating period for the Italian climatic zone C goes from 15 November to 31 March, while the cooling period is assumed to be from 1 June to 30 September. The months with the highest electricity consumption are December, January, and February for the R#3 user due to the one-time use of the electric heat pump to cover the heating load. On the other hand, the greatest electricity request of the R#1 user is recorded in the summer months since the flat occupied by this user is located at the top-floor which shows a high cooling load because it is affected by the highest thermal dispersion through the building envelope.
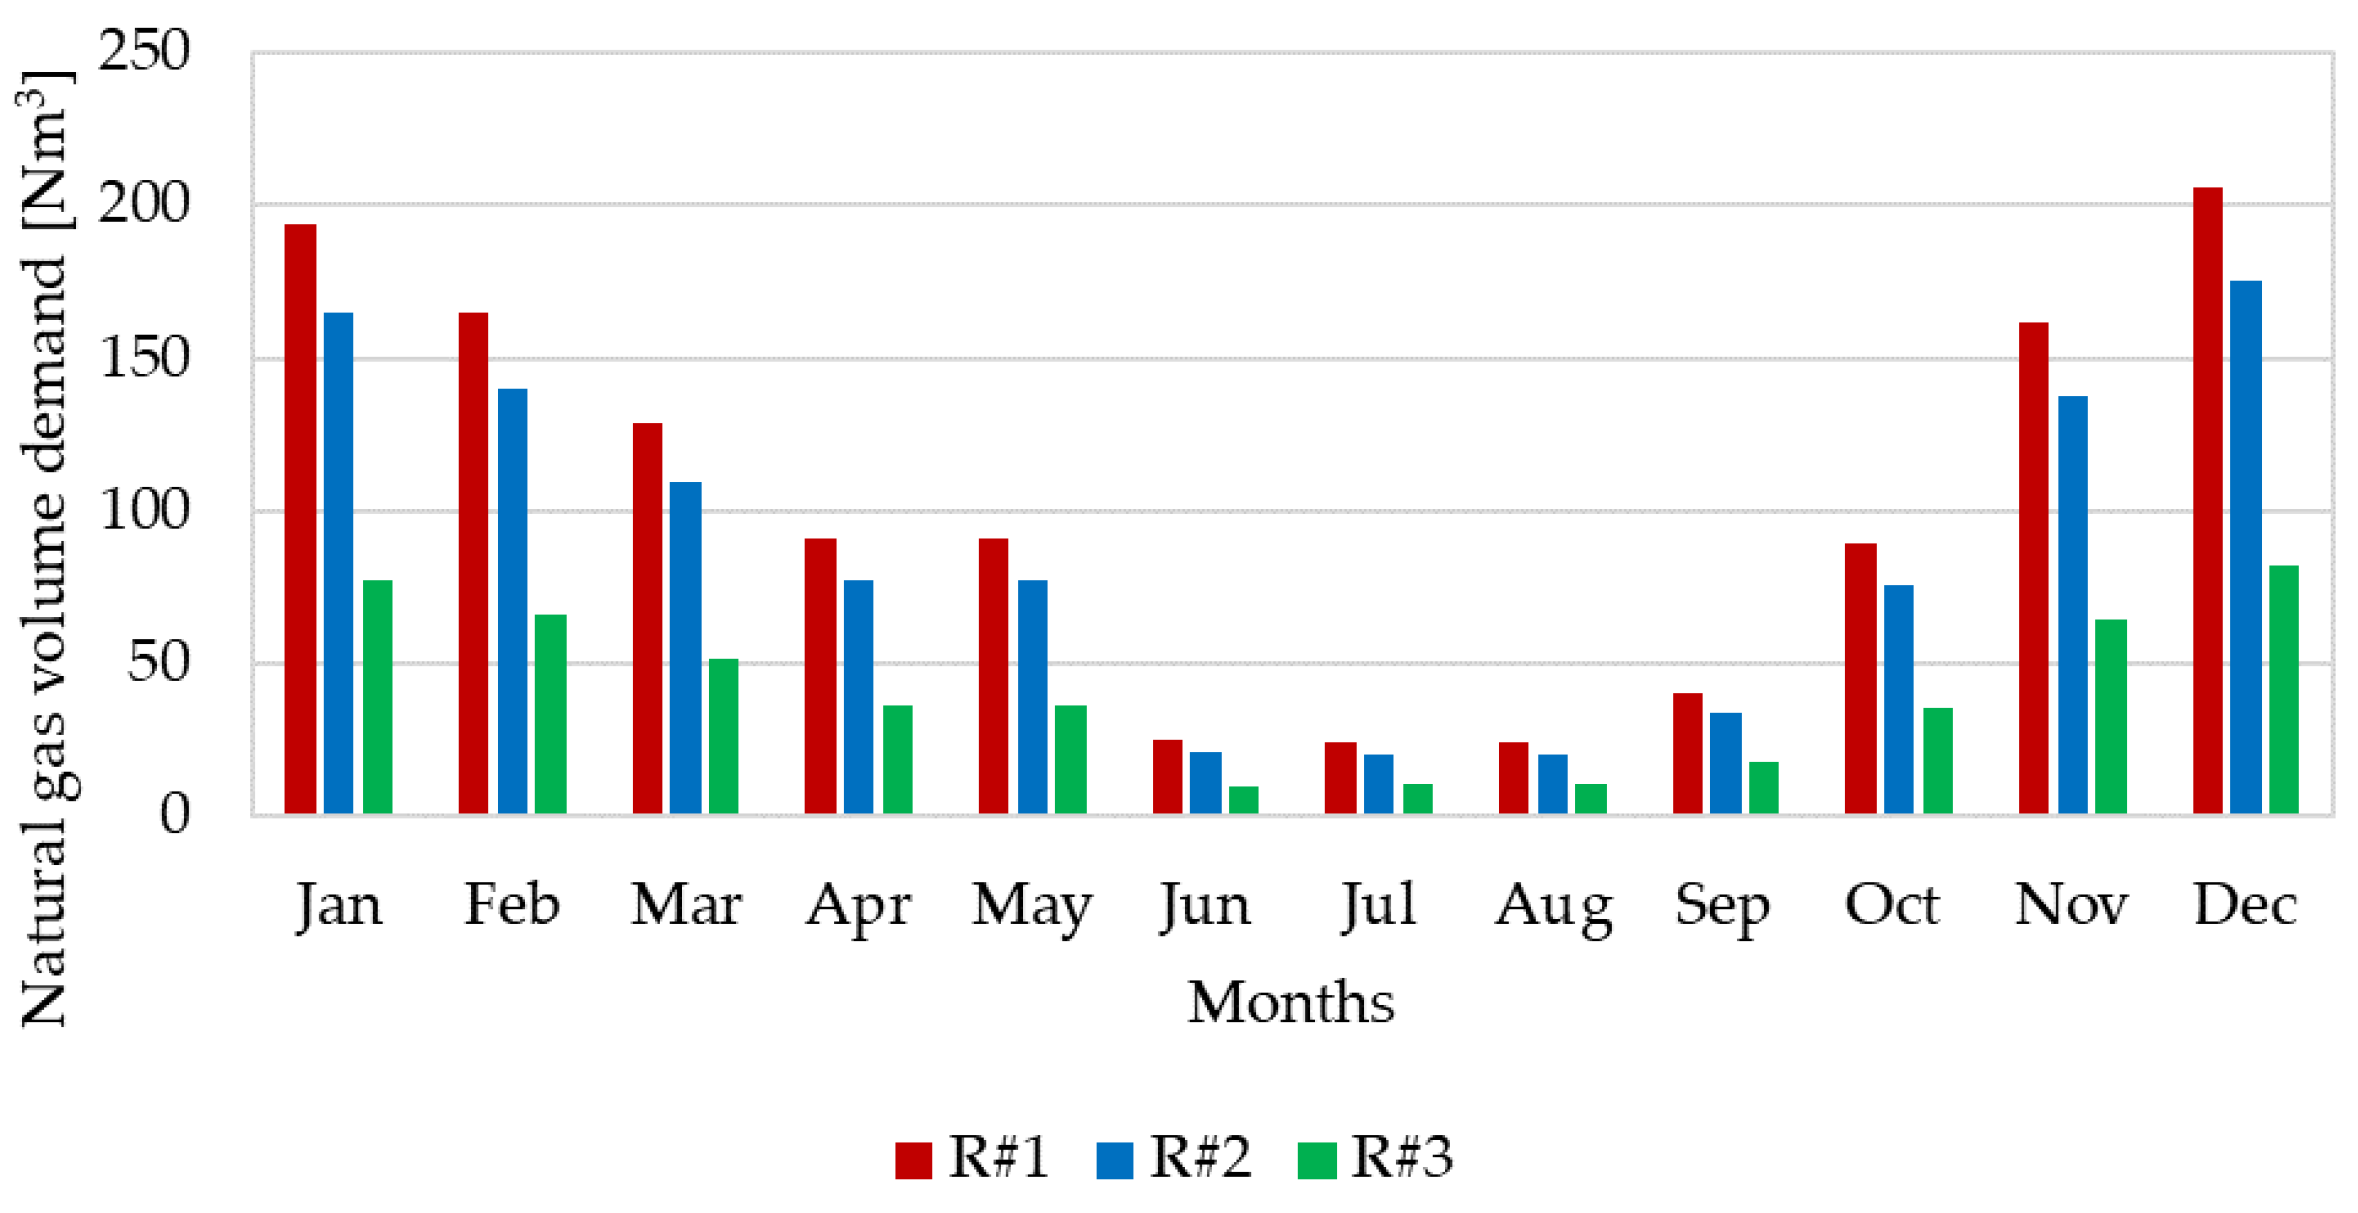
The domestic hot water demand and space heating needs are met by natural gas-fueled boilers, thus in Figure 5, the amount of requested natural gas for each user on a monthly basis is shown by using real data from their bills [51,52,53]. The R#1 and R#2 users showed a higher natural gas consumption than the R#3 user since the heating requests of the whole space are met by the natural gas-fueled boilers.

2.2. Energy Conversion Systems

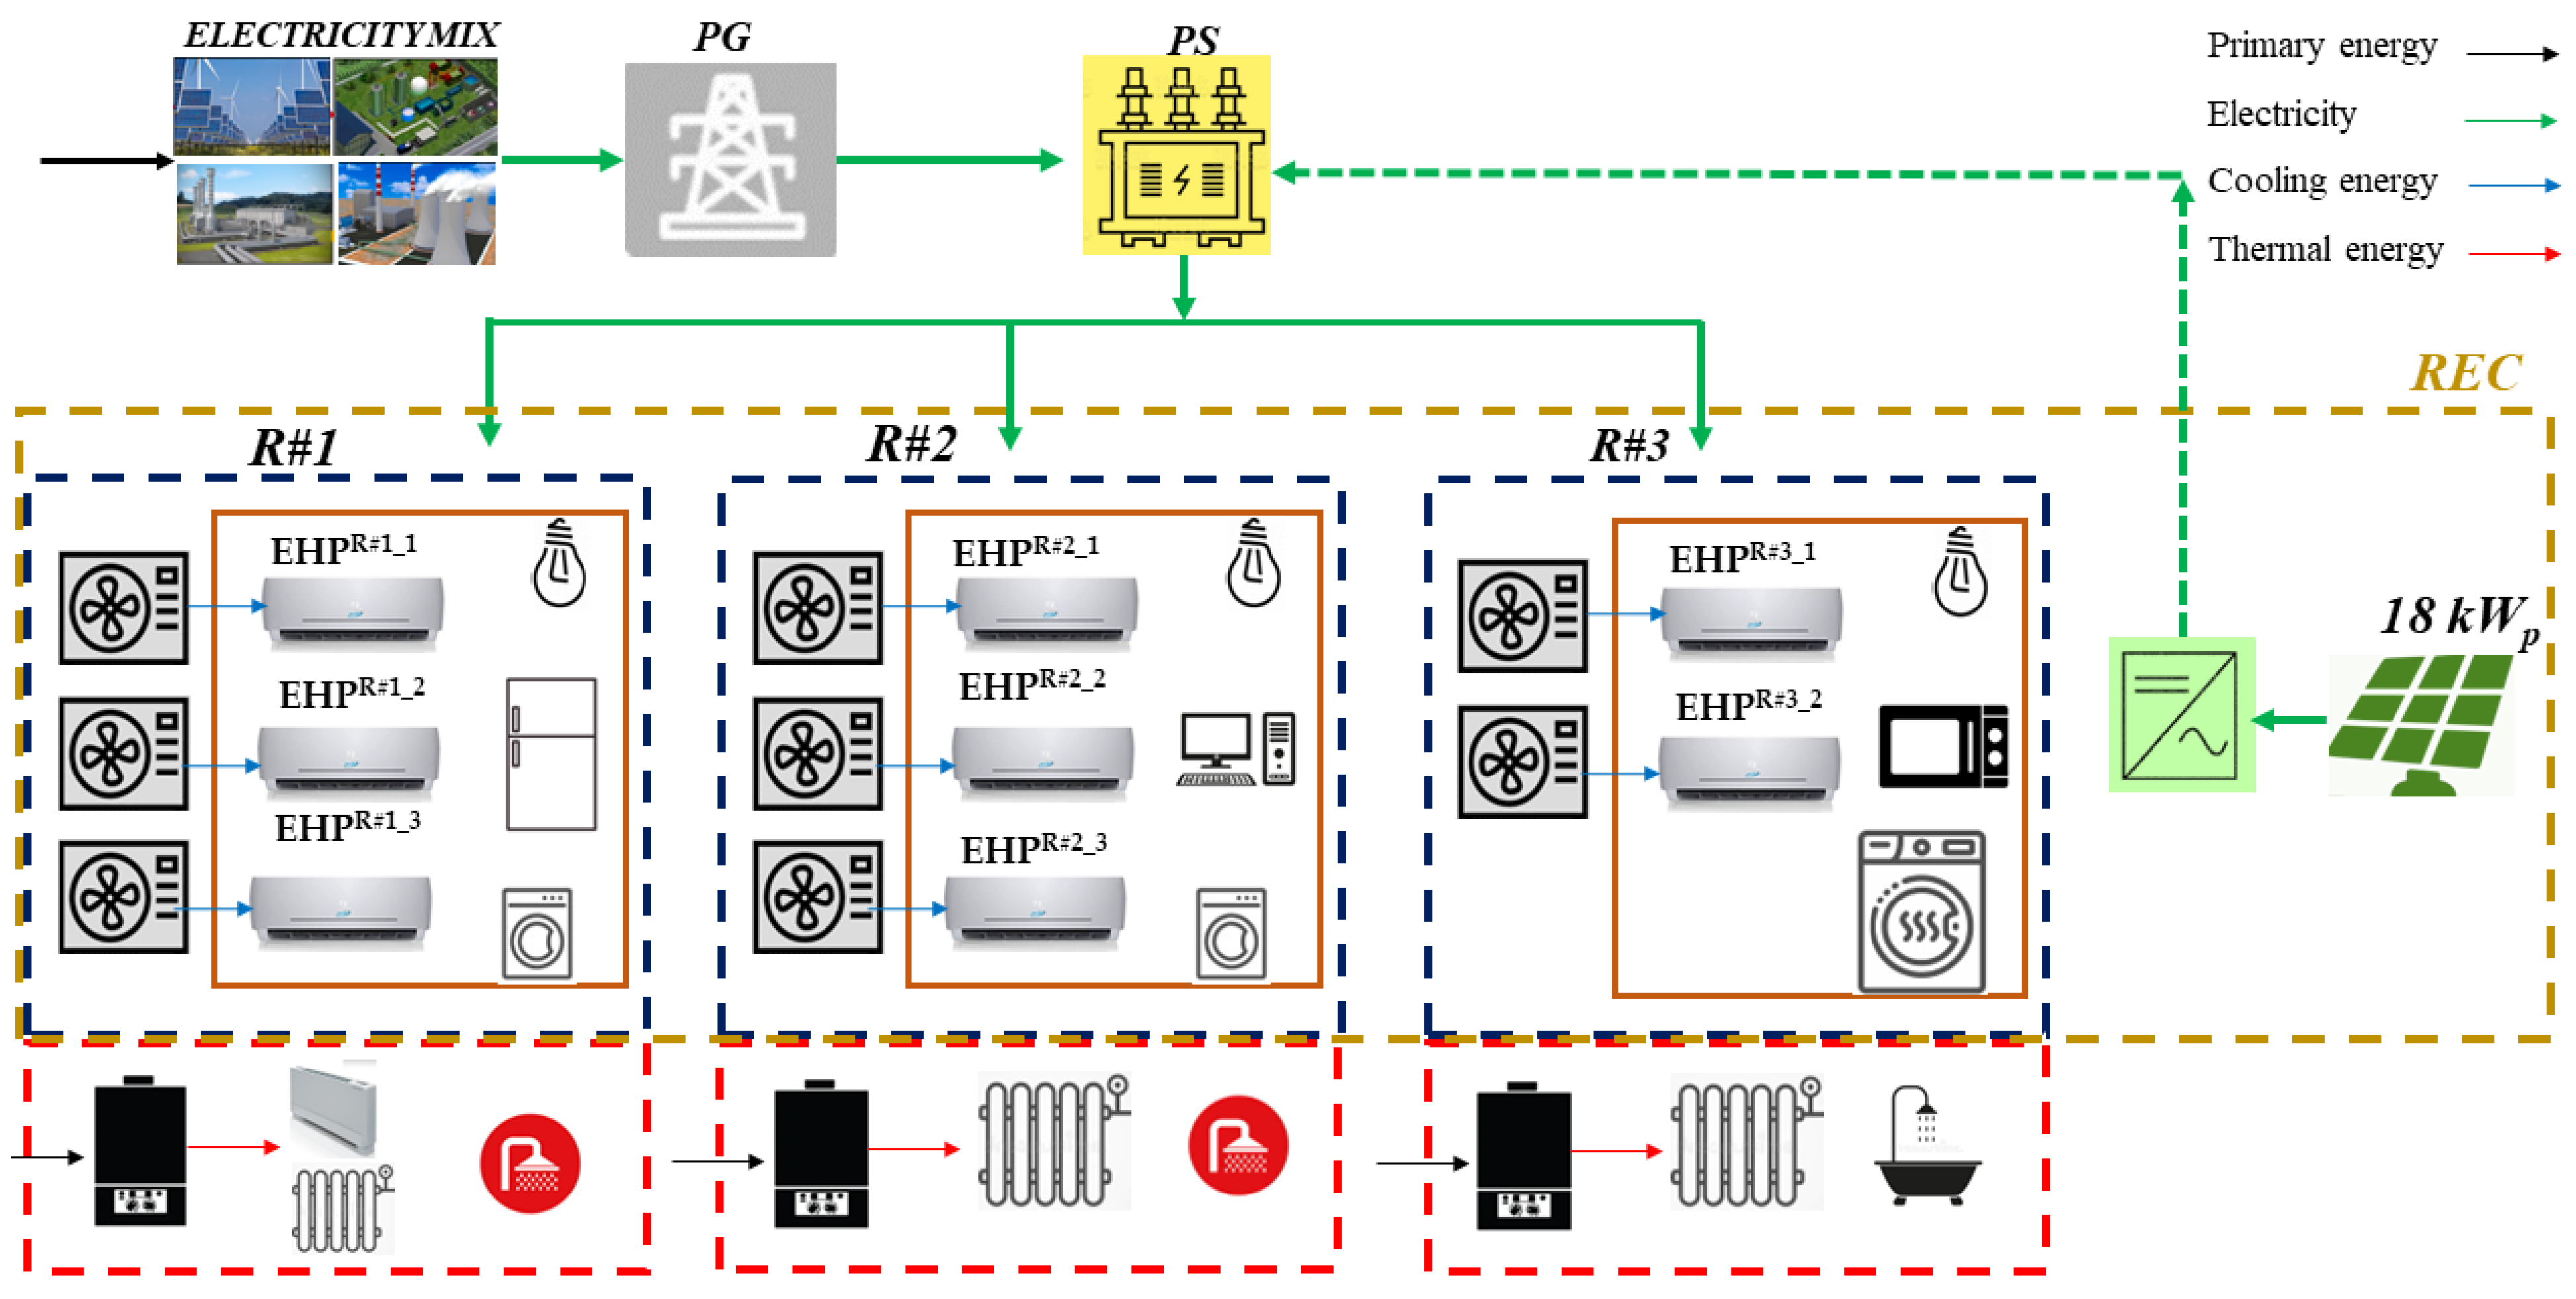
Two configurations have been investigated for the three end-users: the actual simple energy users/consumers (SU) in which no shared RES-based plant is installed, and the REC configuration in which a PV plant is installed, and the photovoltaic electricity is shared among the users. Both configurations are represented in Figure 6, where the SU configuration is referred to by the control volumes enclosed within the red-dotted lines and the REC one is indicated by the control volume contained in the yellow-dotted line. In detail, the energy conversion systems serving the buildings to satisfy the electric, thermal, and cooling demands are depicted in Figure 6. The flats occupied by R#1 and R#2 are equipped with three different air-to-air EHPs (one installed in the living room and two in the bedrooms). While the apartment inhabited by the R#3 user is equipped with two air-to-air EHPs (one installed in the living room and one in the hallway).
In the SU configuration, the electricity needs of the EHPs and the electric appliances are entirely taken from the power grid (PG). Otherwise, in the REC arrangement, the electricity is partially “produced” onsite by a PV rooftop plant connected with the PG by means of a primary substation (PS), as reported in the ARERA directives [53]. In this study, the energy sharing is simulated by considering the virtual scheme of the energy sharing. The “produced” photovoltaic electricity is fed into the PG by the PS (the dotted green line) and the required electricity is also imported from the PG (the solid green line). When the energy demand is higher than the “produced” one, the additional share is supplied by the PG. While, if the production is greater than the needs the excess energy is exported to the PG. In addition, in Figure 6, the red-dotted lines enclosing the control volumes refer to the natural gas-fueled boilers which are used to meet the space heating demand and the domestic hot water needs are reported for the sake of completeness in the SU configuration. It deals with a 30 kWth natural gas-fueled boiler for each flat occupied by R#1 and R#2 with a nominal efficiency equal to 0.93 [54], and a 24 kWth natural gas-fueled boiler for the apartment that is home to R#3 with a nominal efficiency of 0.98 [55]. However, in this comparison study, the analysis refers to the energy sharing approach defined in the Italian REDII transposition as that which is related only to the electricity sharing among end-users, thus the thermal energy supply is not considered [53].
The main features of the energy conversion systems installed at each appartment are listed in the following bullet points, and they are also summarized in Table 2:
  • R#1: three reversible air-to-air heat pumps (EHPR#1_1/2/3) were installed outdoors to meet the space cooling load of the R#1 user during the summer period. They have a rated cooling capacity of 5.2, 2.6, and 2.6 kWCo, respectively, while the nominal energy efficiency ratio (EER) is 3.68, 4.0, and 4.0, respectively [56].
  • R#2: three reversible air-to-air heat pumps (EHPR#2_1/2/3) were installed outdoors to cover the space cooling load of the R#2 user during the summer period. They have a rated cooling capacity of 4.3, 2.5, and 2.5 kWCo, respectively, while the nominal EER is 3.3, 3.6, and 3.6, respectively [57].
  • R#3: two reversible air-to-air heat pumps (EHPR#3_1/2) were installed outdoors to meet the space cooling load of the R#2 user during the summer period and the one-time heating demand, such as during the morning in the winter period. They have a rated cooling capacity of 4.2 and 3.4 kWCo, respectively, and the nominal EER is 3.75 for both of them. In addition, the heating capacity of EHPR#3_1/2 is 4.0 and 5.4 kWth, respectively, while the nominal coefficient of performance (COP) is equal to 4.04 and 4.12, respectively [58].
In the REC configuration, a common PV plant with a peak power equal to 18 kWEl was installed on the roof of the building inhabited by R#1 and R#2 and it occupies an area of about 202 m2. The detailed design and operating parameters of the PV panels [59] and their main characteristics are listed in Table 3 by considering that they are valid in the standard test conditions (1000 W/m2 for the irradiance, 25 °C for the module temperature, and an air mass spectrum coefficient equal to 1.5).

2.3. Model Description

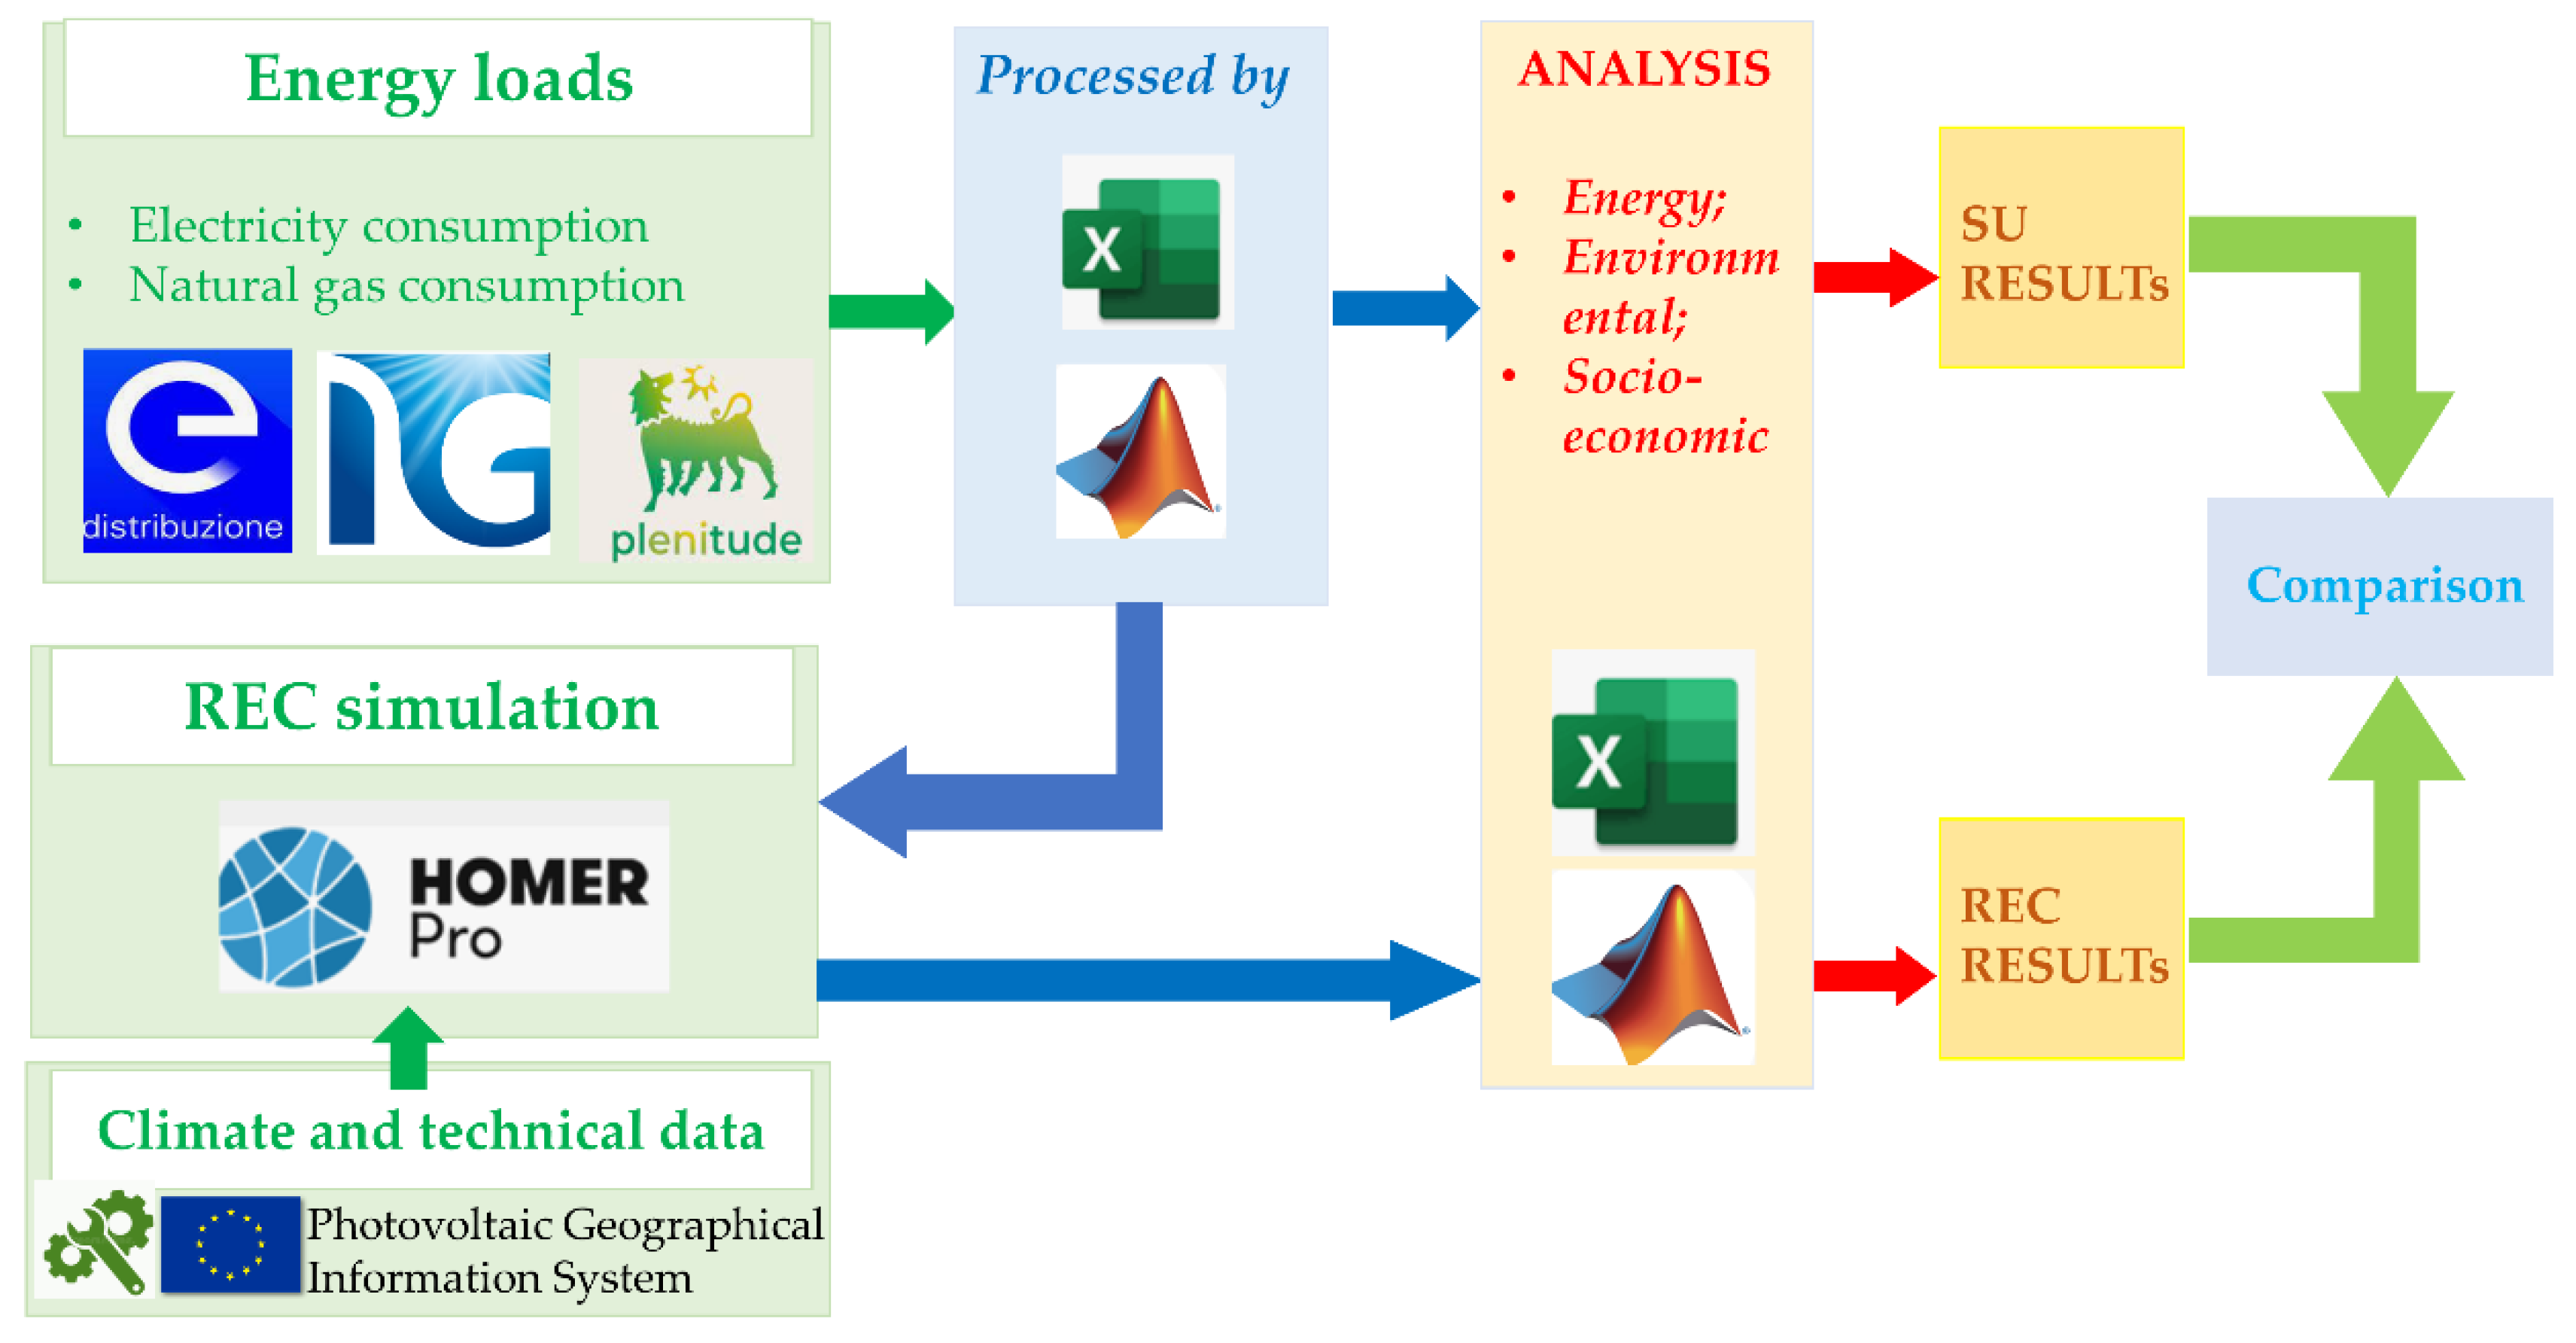
The proposed simulation model is graphed in Figure 7. The energy loads were measured and analyzed through the post-processing techniques using MATLAB and Microsoft Excel. These data were processed for the SU configuration, and they were also used as an input of the HOMERPRO project for the REC [60]. HOMERPRO is an extensively used tool in the scientific community to assess the dynamic behavior of the energy districts activated by RESs.
The input data of HOMERPRO consist of the meteorological data, thermal, and electric loads of the end-users defined for the typologies, economic scenarios, and plant components. Each of these data could be provided through external files or they could be extracted by the HOMERPRO database. In this case study, the information about the meteorological and the electric load data are given as external files extrapolated by the weather channel dataset and electricity distributor, respectively [52,61,62]. Each end-user is already grid connected and the PV plant has been sized according to the constructor’s datasheet [59]. The dynamic simulation has been carried out for one year with a time step equal to 1 h. Furthermore, the results achieved by the HOMERPRO project have been post-processed in the MATLAB environment [62] for the energy, environmental, and socio-economic analysis.

2.4. Methodology

In this section, the methodology of the energy, environmental, and socio-economic analyses conducted for one simulated year with a 1 h time resolution step (θ) have been defined.

2.4.1. Energy Analysis

In regard to the energy analysis, the first of all the electricity required by the Sus configuration is evaluated by using the real data of the energy distributor of each PODs user on a quarterly basis which has been aggregated on an hourly basis ( E ( θ ) E l , P G R # 1 / R # 2 / R # 3 ) [51]. These data also represent the input of the electricity load in the REC simulation for the HOMERPRO project.
For the REC arrangement, the dynamic analysis in HOMERPRO allows for the definition of electricity to be taken from the PG ( E ( θ ) E l , P G R E C ) . In addition, the shared electricity ( E ( θ ) E l , S h R E C ) is evaluated (Equation (1)) by considering the minimum between the electricity taken from the PG by means of the PS ( E ( θ ) E l , P G R E C ) and the electricity “produced” by the PV plant and fed into the PS ( E ( θ ) E l , P V R E C ). In the hours in which the electricity production is higher than the demand ( E ( θ ) E l , P V R E C > E ( θ ) E l R E C ) , the surplus electricity is sold to the PG ( E ( θ ) E l , S e l l R E C = E ( θ ) E l , P V R E C E ( θ ) E l R E C ).
According to the literature [23], the self-sufficiency index, s, is introduced for the REC configuration as the ratio between the photovoltaic electricity consumed on-site (fed and taken into/from PS) and the total electricity request ( E ( θ ) E l R E C / S U s ) . It expresses the amount of electricity demand of the R#1/2/3 users covered by the PV plants, as reported in Equation (2). Furthermore, the self-consumption index, d, is defined as the ratio between the PV electricity fed and what is taken into/from the PS with respect to the total amount of PV-“produced” electricity, as reported in Equation (3). Finally, the primary energy saving is evaluated by comparing the energy taken from the PG in SU and the REC configurations through Equation (4), where η ( θ ) P G is the hourly efficiency for the electricity production in Italy [41].
E ( θ ) E l , S h R E C = m i n ( E ( θ ) E l , P G R E C , E ( θ ) E l , P V R E C )
s = E ( θ ) E l , S h R E C E ( θ ) E l R E C / S U s
d = E ( θ ) E l , S h R E C E ( θ ) E l , P V R E C
E ( θ ) p r R E C = E ( θ ) E l , P G S U   R # 1 / R # 2 / R # 3 E ( θ ) E l , P G R E C η ( θ ) P G

2.4.2. Environmental Analysis

The environmental analysis has been carried out for the REC and SU configurations by means of the CO2 equivalent emissions according to Equations (5) and (6), where α ( θ ) P G is the hourly CO2 emission factor for Italy’s electricity production. Finally, the CO2 emissions saving, Δ C O 2 , is evaluated through Equation (7). According to the REDII, the evaluation of the avoided emissions was also conducted by using the hourly values of the energy and emission factors, which was possible thanks to previous studies [42,63].
C O 2 S U   R # 1 / R # 2 / R # 3 = E ( θ ) E l , P G R # 1 / R # 2 / R # 3   · α ( θ ) P G
C O 2 R E C = E ( θ ) E l , P G R E C   · α ( θ ) P G
Δ C O 2 = C O 2 S U   R # 1 / R # 2 / R # 3 C O 2 R E C

2.4.3. Socio-Economic Analysis

With reference to the economic analysis, the yearly electricity operating cost (OC) is calculated for the SU and REC configurations through Equations (8) and (9), respectively. In Equation (8), the cost of electricity imported from the PG ( E E l , P G R # 1 / R # 2 / R # 3 ) is evaluated by the means of the unitary electricity price referred to by the PG, c E l , P G , equal to 0.32 EUR/kWh, including VAT [64]. The O C E l R E C was calculated by considering the cost of the electricity imported from the PG ( E E l , P G R E C ), the maintenance cost (MC), and the incomes coming from the economic incentive referred to as electricity sharing and from the selling of surplus electricity. More precisely, p E l R E C in Equation (9) is the economic incentive for the shared and self-consumed electricity in the REC layout ( E E l , S h R E C ) which is equal to 0.169 EUR/kWh [53], including all contributions, and p E l , S e l l R E C is the unitary price of the electricity sold to the PG ( E E l , S e l l R E C ) , which is equal to 0.047 EUR/kWh according to the “Ritiro Dedicato” incentive in Italy [65].
In Equation (10), the avoiding cost by using the REC configuration is evaluated with respect to the cost in the SU layout which refers to all the end-users, O C E l S U s [66]. The cost in the SU layout is calculated for each user by considering his real consumption, otherwise, in the REC, the global electricity cost is the result of the sum of the cost of the electricity taken from the grid by each user. The weight on the total cost of the purchased electricity is 38%, 29%, and 33% for R#1, R#2, and R#3, respectively.
O C E l S U = E ( θ ) E l , P G R # 1 / R # 2 / R # 3 · c E l , P G
O C E l R E C = E ( θ ) E l , P G R E C · c E l , P G + M C E ( θ ) E l , S h R E C · p E l R E C E ( θ ) E l , S e l l R E C · p E l , S e l l R E C
Δ O C E l = O C E l S U s O C E l R E C
In addition, the economic analysis is performed by investigating the simple payback period (SPB) that indicates the number of years necessary to balance the initial investment cost of the PV plant (ICPV) and the annual cash flows that are represented by O C E l R E C , as reported in Equation (11).
S P B = f · I C P V O C E l R E C
where f is the percentage of the PV investment cost covered by the economic support mechanism.
In this study, no additional economic evaluation will be conducted according with studies of the literature due to the fact that the aim is related to a comparison between the REC condition and single users and its effect on the EP conditions. In regard to the social analysis in this study, an evaluation of the energy poverty condition of the three end-users is proposed. According to the literature study [47], the most widespread social index used to perform an analysis on energy poverty is the “10%” indicator, that is calculated as reported in Equation (12). It is the ratio between the global energy cost for each end-user and the overall family income ( I R # 1 / R # 2 / R # 3 ) . Thus, it expresses that an end-user is in an EP condition if he spends more than 10% of his overall income on energy services. In addition, in this study, this index is upgraded by considering a different family income used in the Italian economic system, ISEE. The access to the RECs services as well as to the public utility services at favorable conditions (landline telephone, electricity, and gas) are included in that subsidized social benefit. The ISEE is the indicator used to evaluate and compare the economic situation of households that intend to apply for a subsidized social benefit. It is a more comprehensive indicator than just the overall family income, since it is assessed by the sum of the overall family incomes and 20% of the portfolio of the properties and investments of the family members. Thus, according to this new index ( 10 % I S E E R # 1 / R # 2 / R # 3 ) , an end-user is in an EP condition if more than 10% of his ISEE is imputable to energy services.
In this study, these two indices are evaluated in both the SU and REC configurations to assess the improvement in the energy poverty condition of end-users thanks to the participation to the REC. In order to evaluate the real EP condition of each consumer, the global OC cost ( O C t o t R # 1 / R # 2 / R # 3 ) is calculated by including also the cost associated with natural gas consumption ( O C N G , T h R # 1 / R # 2 / R # 3 ) over the consumption of electricity, O C E l R # 1 / R # 2 / R # 3 .
10 % R # 1 / R # 2 / R # 3 = O C t o t R # 1 / R # 2 / R # 3 I R # 1 / R # 2 / R # 3
10 % I S E E R # 1 / R # 2 / R # 3 = O C t o t R # 1 / R # 2 / R # 3 I S E E R # 1 / R # 2 / R # 3

3. Results and Discussion

In this section, the results of the dynamic simulation are elaborated and discussed following the methodology reported in Section 2.4. Figure 8 shows the monthly electricity flows, including the shared energy within the REC, that one taken from the grid, the PV electricity production, and the electricity sold to the PG.
The total electricity shared in the REC is equal to 30.48 MWh/y, while the electric energy taken from the PG amounts to 8 MWh/y. Furthermore, the electricity sold to the PG corresponds to 2.02 MWh/y and the total PV electricity production is 32.5 MWh/y. In some winter months (from November to February), when the photovoltaic electricity production is low, the amount of electricity sold to the PG decreases while the share of electricity taken from the PG increases. In this period, the electricity production from the PV plant can cover a share of the total electric loads ranging from 63.4% in December to 80.8% in November. Conversely, during the spring, autumn, and summer months (from March to October), the electricity production from the PV plant is able to cover a share of the total electric loads ranging from 84.7% in August to 93.8% in April. During the year, only a small amount of photovoltaic electricity is sold to the PG, and it varies from 4.94% (in August) to 8.47 (in March) of the total photovoltaic production. However, the electricity taken from the grid is never null, even if a certain share of the photovoltaic electricity is sold to the grid. This is due to the fact that there is a not perfect match between the photovoltaic electricity availability and the electricity needs. More precisely, in June and July, when the electric load is high due to the operation of EHPs to meet the cooling loads, a non-negligible amount of electricity is taken from the PG (469.1 kWh in June and 860.8 kWh in July, corresponding, respectively, to 5.0 and 4.9 % of the total load). This issue can be improved by considering the installation of electricity storages.
The low influence of the electricity taken from the grid, with respect to the total electricity balance, can be seen from the electricity load duration curve depicted in Figure 9.
The electric load is covered for about 59% of the total operating hours in a year by PV electricity and during the remaining 3670 h, the electricity is taken from the PG. For about 2930 h in a year, the PV electricity production is higher than the RECs electricity load and, in these hours, the surplus electricity is sold to the PG. In regard to the s index value (Equation (2)), it is equal to 0.78 while the d index (Equation (3)) amounts 0.94. The first one evidences that on a yearly basis, there is a certain amount of electric load that is covered by the electricity taken from the PG, and the latter one determines that only a small share of the PV electricity production is sold to the PG.
By comparing the primary energy request of the SU layout (11.5 MWh/y) and REC configuration (4.4. MWh/y), it is possible to evaluate the primary energy saving ( E ( θ ) p r R E C , Equation (4)) achieved thanks to the REC configuration: it is equal to 61.6% on a yearly basis. It means that the sharing of the PV plant among residential users guarantees a consistent reduction in primary energy, with respect to the SU layout, in which all the electricity needs are satisfied by taking electricity from the PG.
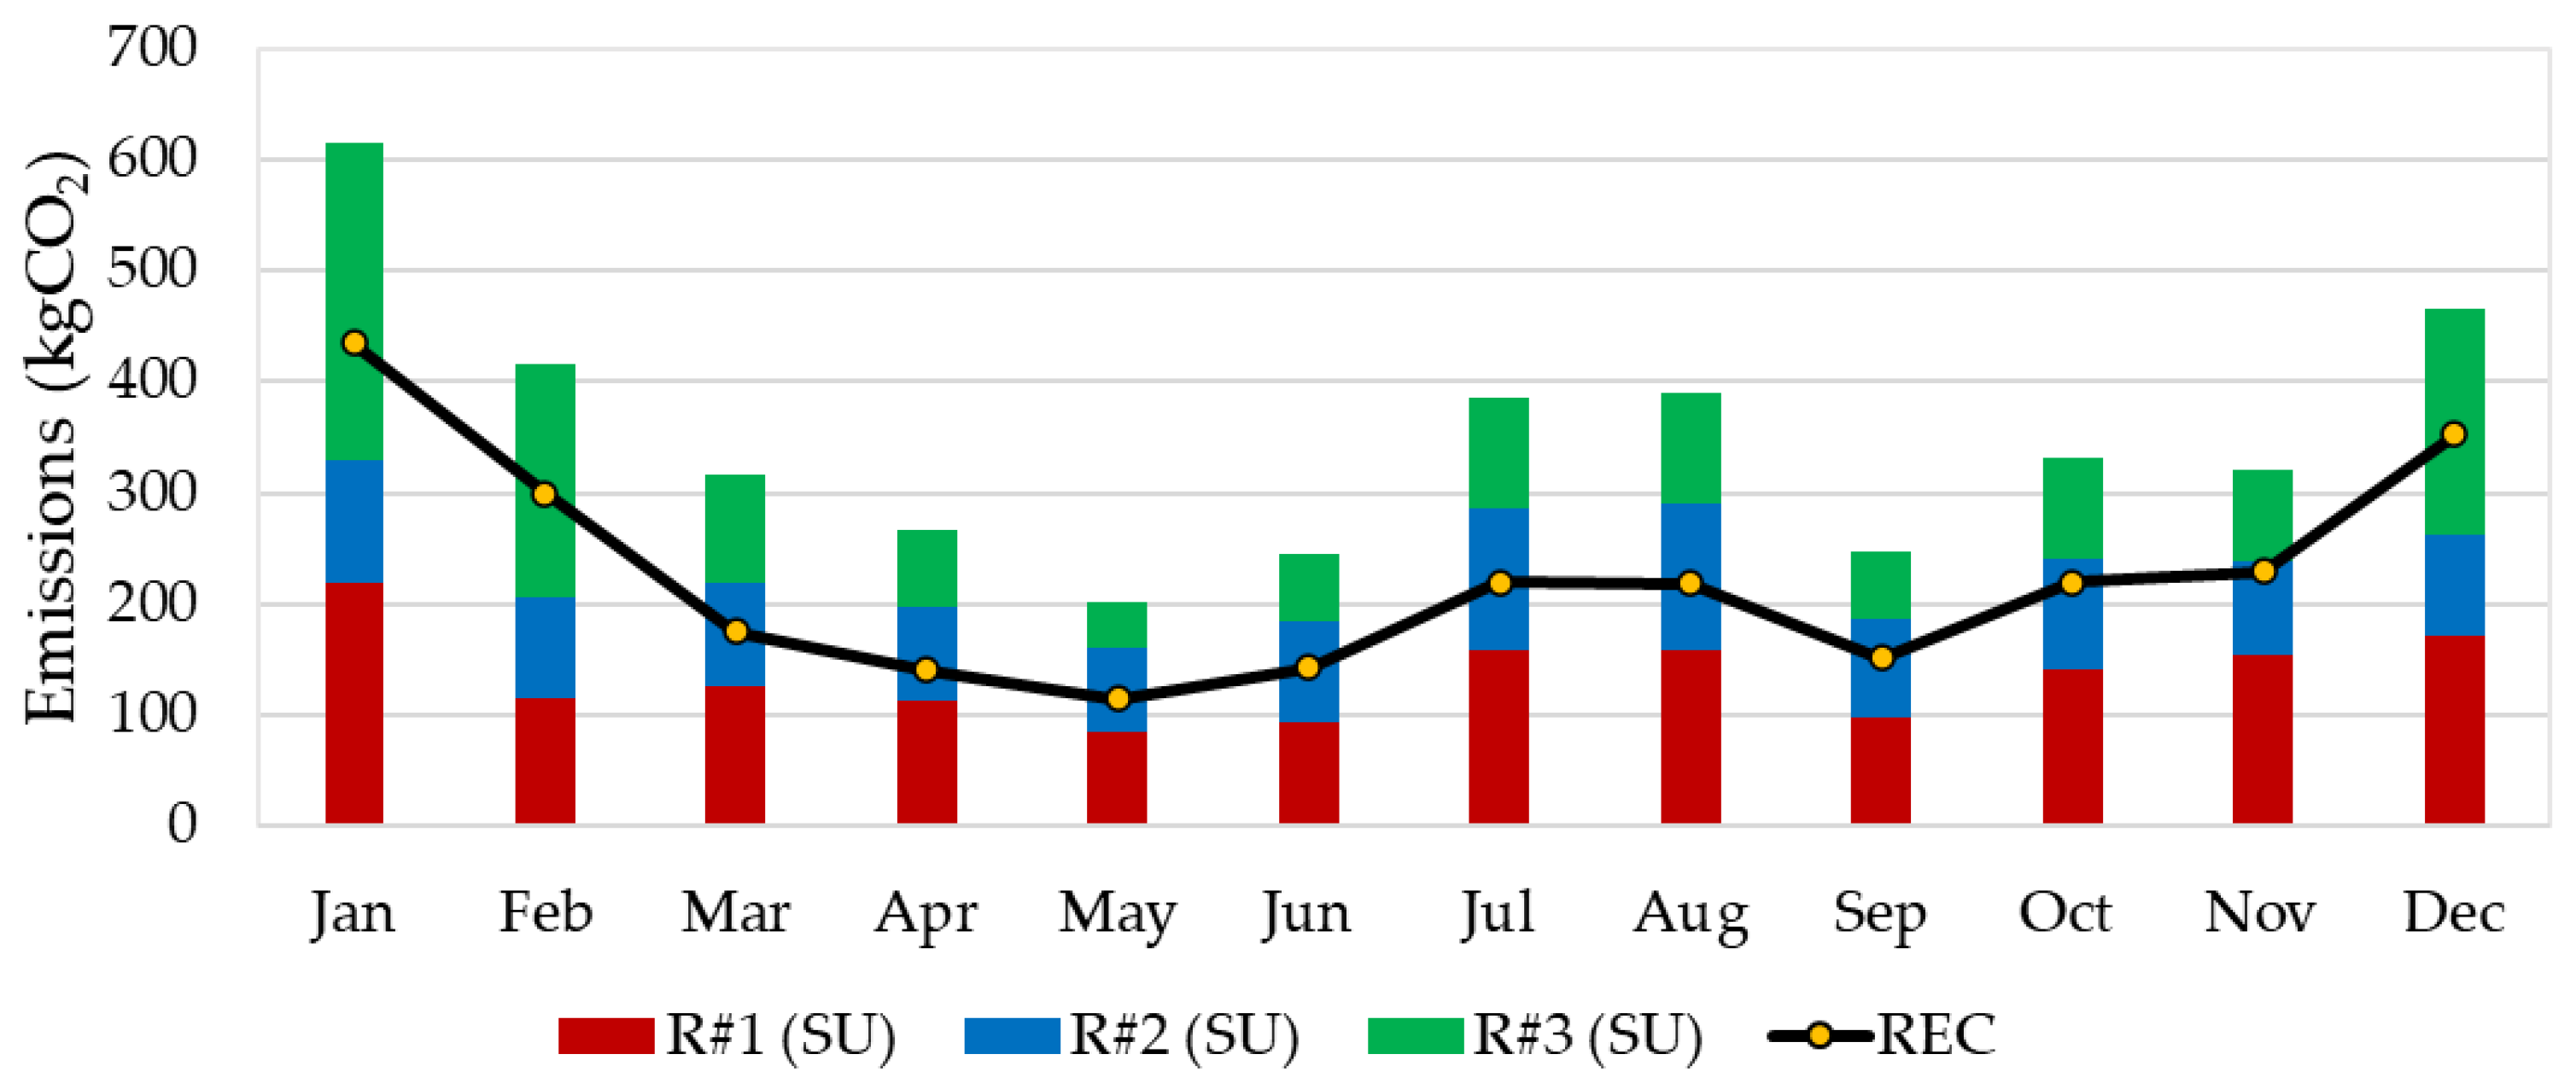
In the same way, the environmental performance assessment has been carried out by evaluating the ΔCO2 (Equation (7)), which amounts to 64% on a yearly basis. By conducting the analysis on a monthly basis, the ΔCO2 index ranges from 24.51% in December (when the contribution of PV electricity is low) to 44.2% in August, when the photovoltaic electricity shared among end-users in the REC layout increases. In more detail, Figure 10 shows the CO2 emissions in the SU configuration by splitting the emissions among each end-user and the CO2 emissions imputable to the REC layout on a monthly basis.
In order to highlight the importance of performing an environmental assessment by considering the time-variability of the CO2 emissions factor for the electricity production, Figure 11 shows the hourly average value of the electric load of the R#3 user ( E   ¯ ( θ ) E l R # 3 ), and the hourly average value of the CO2 emissions factor for the electricity production α ¯ ( θ ) P G , with reference to three typical days. The first one (Figure 11a) is a winter day and it refers to the two variable’s average values in January, the second one (Figure 11b) is an intermediate day in which no space heating or cooling loads occur and it refers to April, while the third one (Figure 11c) is related to a summer day and it reports the average hourly values of E   ¯ ( θ ) E l R # 3 and α ¯ ( θ ) P G in August.
The hourly average electric load was lower in April than in January and August since the EHPs are switched off in this month. The highest load occurs in different hours of the day for each month: it is verified at 18:00 in January, at 8:00 in April, and 19:00 in August. However, the evaluation of the CO2 emissions thanks to the time-varying α ¯ ( θ ) P G allowed us to perform the assessment by considering the real CO2 emission scenario. For example, when the hourly average electricity load in August assumes the value of about 0.7 kWh at 18:00, the emission factor was lower than 300 gCO2/kWhEl, and so the CO2 emissions of the R#3 user evaluated through these data amount to 210 gCO2 in that hour. If the same assessment had been conducted through the yearly average value of the CO2 emission factor for the electricity production (equal to 316.8 gCO2/kWhEl), the CO2 emissions of the R#3 user would amount to 222 gCO2, leading to an overestimation of 5.3%. This condition is even more evident for the same hours in which the hourly emission factor decreases to 200 gCO2/kWhEL thanks to the high penetration of the RES source in the electricity production mic. For example, at 12:00 on 13 July, the CO2 emissions factor evaluated by using the hourly value is equal to 157.5 gCO2/kWhEL, and the evaluation of the emissions by using the yearly mean value would result in an overestimation of 50.3%. The same analysis could be conducted for all hours of the day, underling the failure of the environmental assessment through the yearly average value of the CO2 emissions factor that is widespread in the scientific literature.
In regard to the economic results, the operating costs associated with each end-user in the SU configuration is reported in Table 4 for the electricity and natural gas consumption based on their real energy bills and according to Equation (8). The higher electricity costs are associated with the R#1 and R#3 end-users, while the greatest natural gas cost is imputable to the R#1 end-user. In addition, the socio-economic indexes are calculated according to Equations (11) and (12) and are reported in Table 4.
By considering the 10 % R # 1 / R # 2 / R # 3 index that is traditionally used in the literature, the results indicate that only the R#2 end-user is near to the energy poverty condition (the threshold to assess this condition is expressed by a value of this index equal to or higher than 10%) [46]. Otherwise, if the 10 % I S E E R # 1 / R # 2 / R # 3 index is considered, R#2 and R#3 are in the EP condition when they are in the SU layout. This result highlights that the ISEE parameters could be more suitable to assess the EP condition than the traditional 10 % R # 1 / R # 2 / R # 3 index, since it analyzes the comprehensive socio-economic status of a family, and it could be useful to other welfare programs as well.
The EP condition has been investigated for all end-users in the REC layout too. Figure 12 graphs the 10% index and 10%ISEE index in the SU and REC configurations to compare them. By considering both indexes, in the REC layout, no end-user is in the EP condition. The results show an improvement for all the end-users of the two indexes. In particular, for R#1, R#2, and R#3, the EP condition goes from 5.71%, 9.84%, and 6.60% to 2.96%, 5.25%, and 6.58 by considering the 10% index, and it passes from 6.59%, 10.93%, and 10.41% to 3.41%, 5.25%, and 6.58% by considering the 10%ISEE index.
According to Equations (9)–(11), the operating costs of the REC configuration and the SPB have been evaluated by assuming the data given in Table 5.
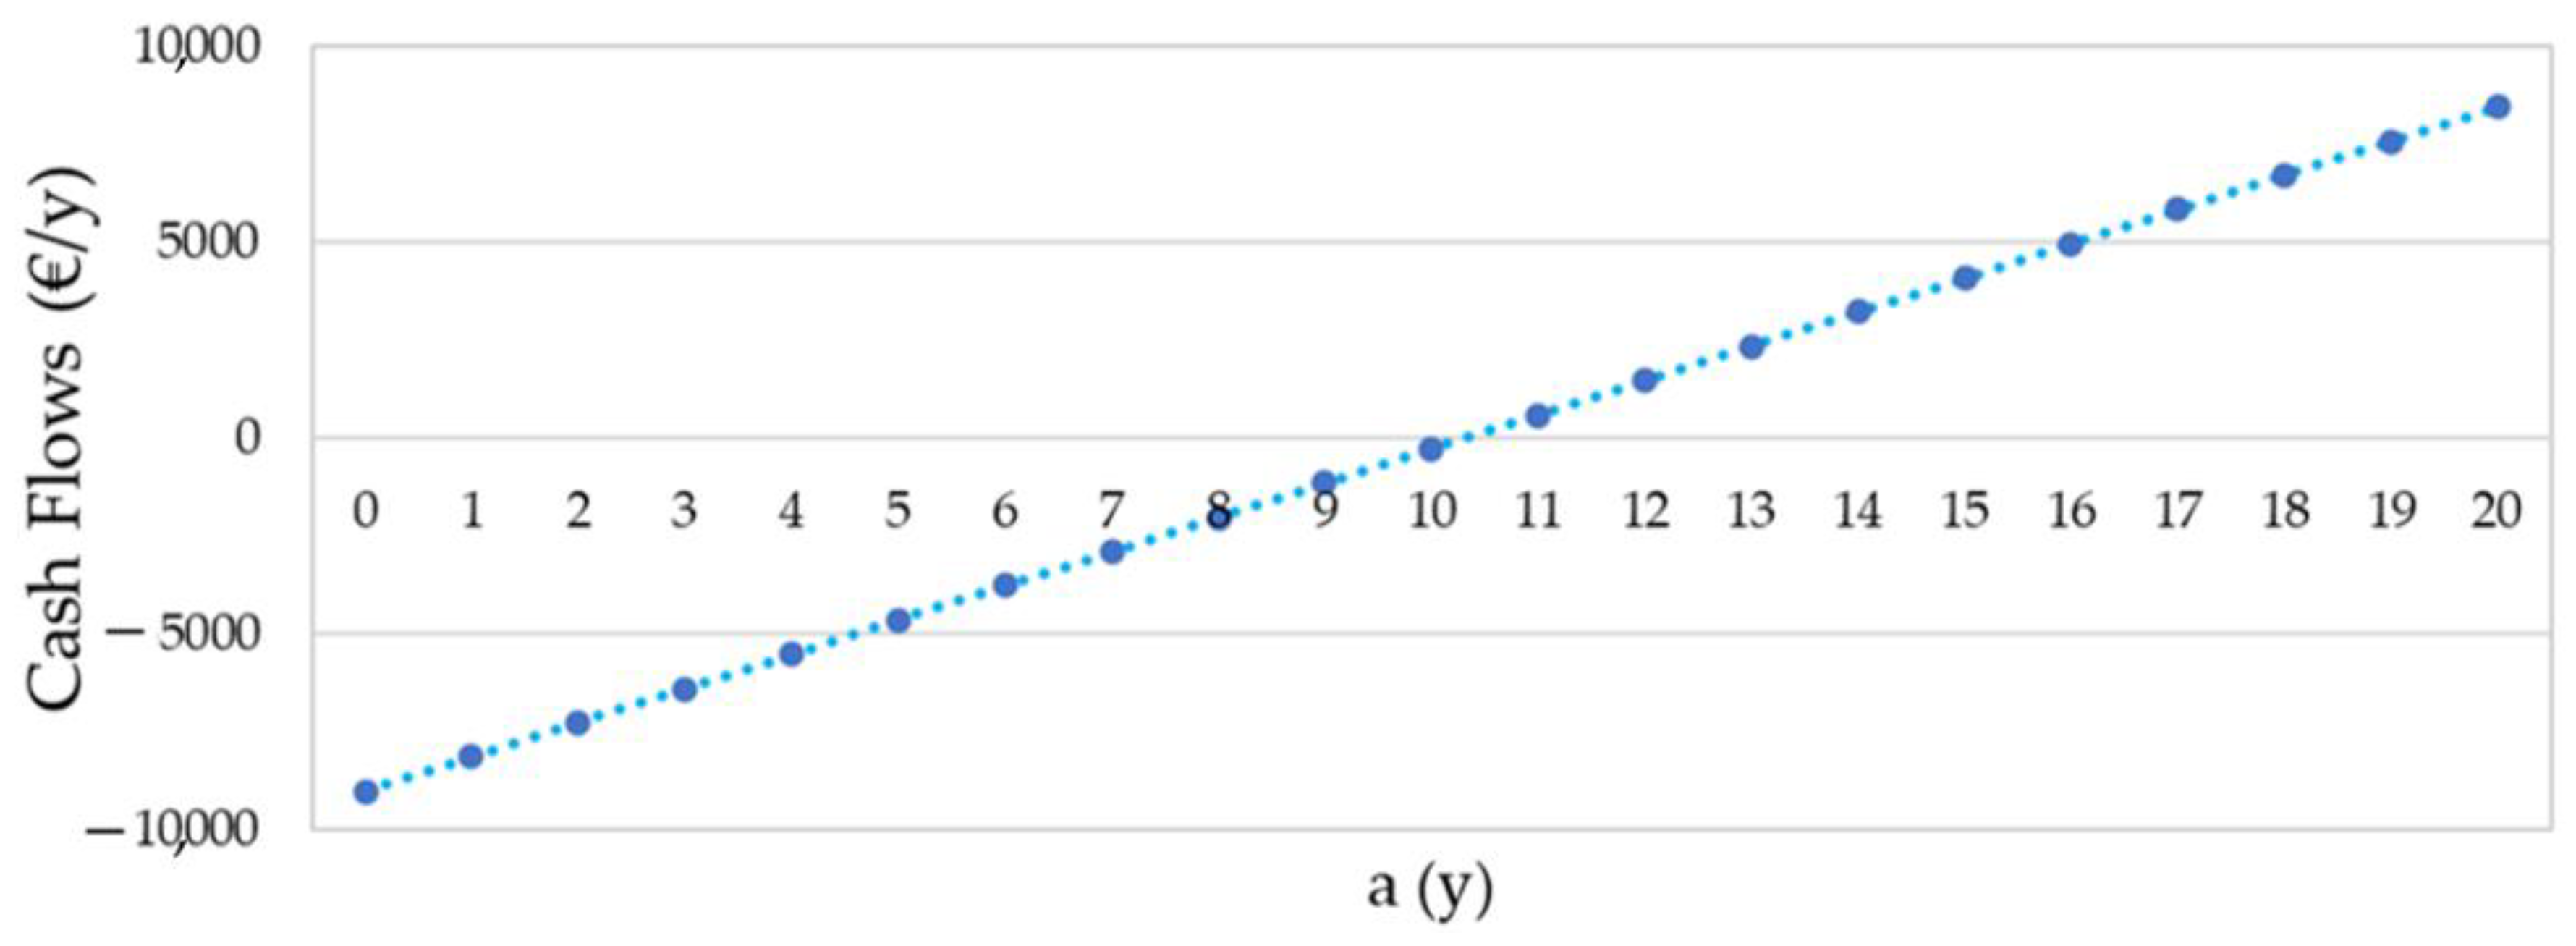
The SPB is equal to 10 years by considering that the RECs members purchase the plant I by using only the tax associated deduction to the PV plant. The cash flows of the REC are reported in Figure 13.
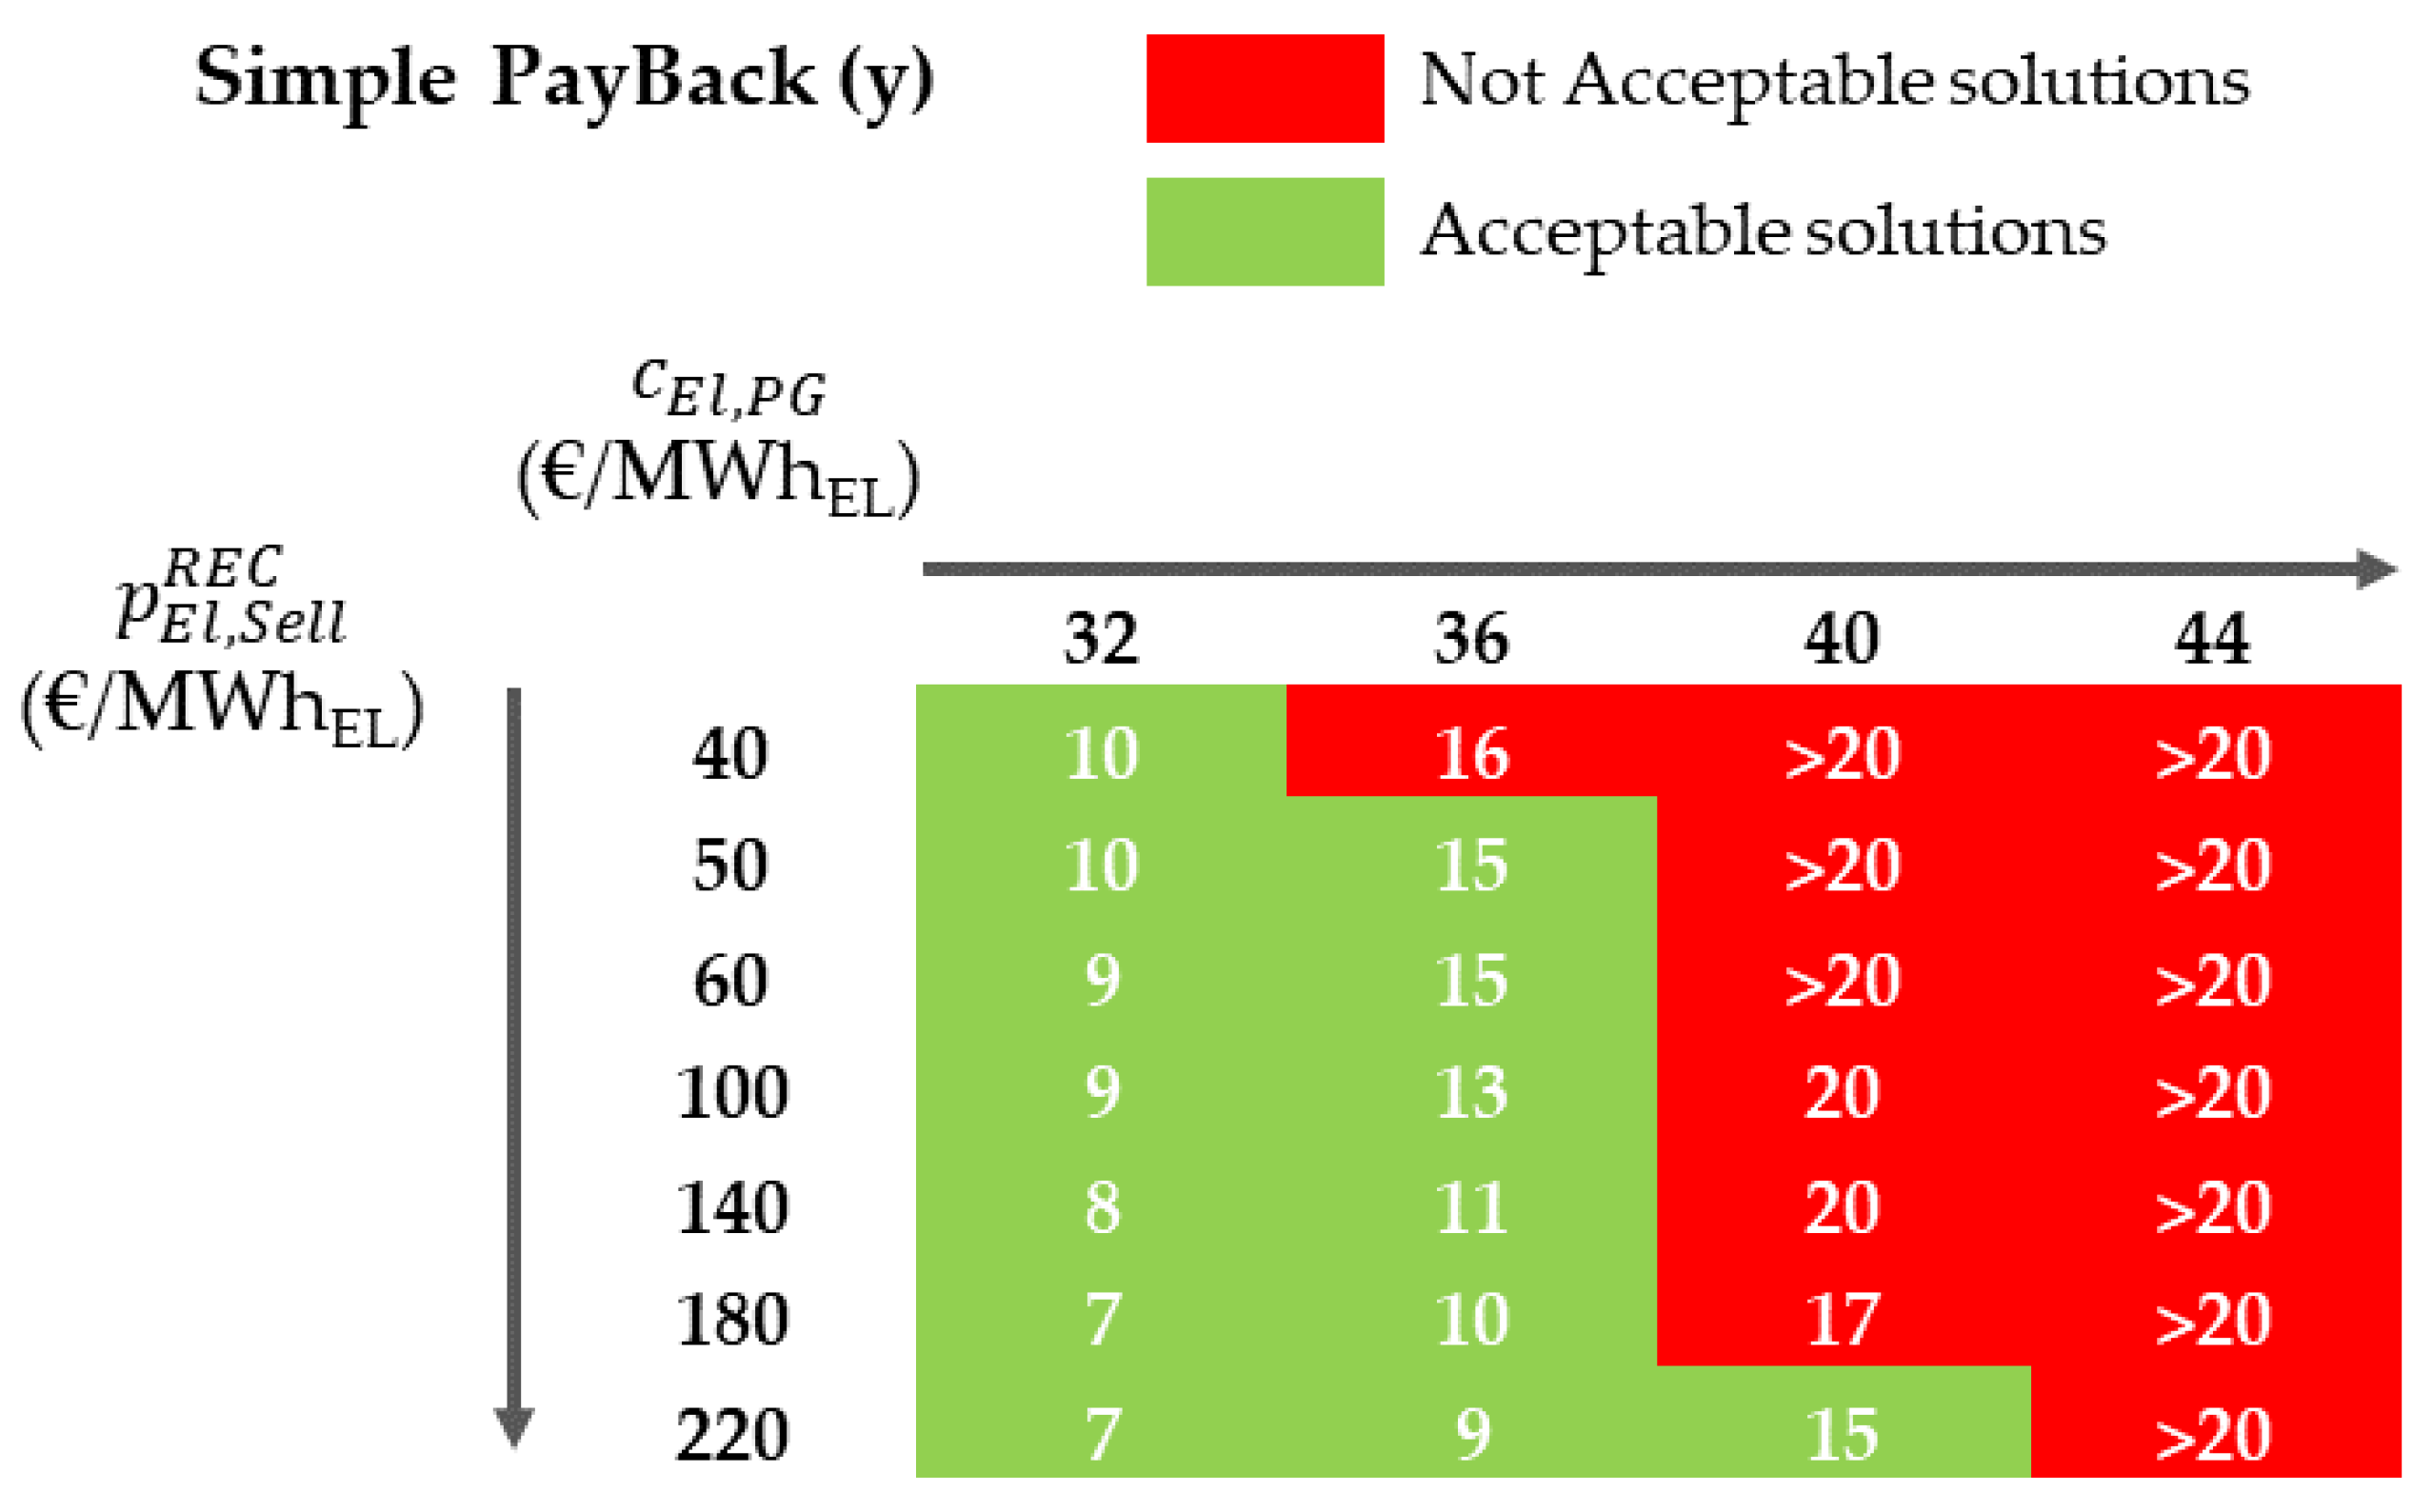
By assuming the same O C E l R E C for all the years of operation, the cash flows became positive from the 11th year, with 20 years of an incentive for energy sharing. The global net income of the community assumes a value equal to EUR 45,416. Considering the effect of the COVID-19 pandemic period and the Russian invasion of Ukraine, the European and Italian electricity price has increased from 32 to 44 EUR/MWhEL since the first half of 2022 [64]. At the same time, in Italy, the price associated with “Ritiro dedidcato” for the selling of electricity to the PG has grown up to 220EUR/MWhEL [68]. In order to take into account the electricity market changes and challenges of this historical era, a sensitivity analysis has been carried out to evaluate the advantages of the REC in terms of the SPB as a function of c E l , P G and p E l , S e l l R E C . In Figure 14, the SPB trend is reported as a function of the selling and purchase electricity cost variability.
The results show that if an electricity cost near to 32 EUR/MWhEL is considered, the economic feasibility of REC is verified for alle the selling electricity prie ( p E l , S e l l R E C ) ensuring an SPB ≤ 10 years (the green cells in Figure 14). Otherwise, if the electricity purchase cost ( c E l , P G ) increases to 36 EUR/MWhEL, the economic profitability of the REC (SPB ≤ 15) is verified only when the selling price ( p E l , S e l l R E C ) is higher than or equal to 50 EUR/MWhEL. In addition, if the electricity cost rises to 44 EUR/MWhEL (as during 2022), the constitution of the REC could be disadvantageous for all selling conditions by considering 20 years of the RECs economic incentive. These results show that the REC evaluation need be contextualized into electricity market scenarios and that the energy policy organizations must consider the possibility of an increase or decrease in p E l R E C according with the electricity market changes.

4. Conclusions

This study investigates the energy, environmental, and socio-economic performance of a photovoltaic-based energy community located in San Felice a Cancello, a small town in the south of Italy. The renewable-based community is composed of three residential flats located in two buildings, equipped with a photovoltaic plant with a peak power equal to 18 kWEl installed on the roof of one building. The heating and cooling demands of the offices are satisfied by means of reversible air-to-air heat pumps and natural gas boilers. The energy community layout is compared with a configuration in which the users do not belong to the community. The prosumers are connected through a primary substation to share the “produced” electricity by the renewable plant, but they are also connected to the power grid. The simulation results have demonstrated that the renewable energy community could ensure a primary energy saving equal to 61% and a carbon dioxide emission reduction up to 64% on a yearly basis, with respect to the configuration of simple end-users. In addition, in this study, the socio-economic indexes investigating the energy poverty status have been analyzed to evaluate the improvement of this condition. The results show an improvement in energy poverty conditions for all users by taking some of them above the poverty limit. Moreover, a new socioeconomic index, 10%ISEE, that is an upgrade of the widespread 10% index, has been introduced to evaluate the comprehensive socio-economic status of end-users, based not only on their global incomes but also on the 20% of the portfolio of their properties and investments.
With reference to the economic analysis, a simple payback of 10 years has been evaluated for the considered renewable energy community. However, the current energy challenges have imposed the need to perform a sensitivity analysis by varying the selling and purchase electricity cost to evaluate the economic profitability of the renewable energy community in all economic scenarios. The results have demonstrated that the economic mechanism support for renewable energy communities must be adapted to the current electricity prices/costs in order to guarantee the economic profitability of the community. An additional evaluation could be obtained by including the possibility of improving envelope characteristics of the buildings to reduce the energy demands. Moreover, it could be useful to diversify the renewable energy sources used to satisfy the RECs energy needs by considering the greater flexibility ensured by “programmable” energy sources. In future studies, a more detailed analysis will be conducted on the economic and environmental advantages and disadvantages of renewable energy communities’ configurations.

Author Contributions

Conceptualization, F.C., E.M. and M.S.; methodology, F.C., E.M. and M.S. software, F.C. and E.M., formal analysis, F.C., E.M. and M.S., investigation, F.C., E.M. and M.S.; resources, F.C., E.M. and M.S.; data curation, F.C., E.M., S.S. and M.S.; writing—original draft preparation, F.C., E.M., S.S. and M.S.; visualization, F.C., E.M., S.S. and M.S.; supervision, F.C., E.M., S.S. and M.S. All authors have read and agreed to the published version of the manuscript.

Funding

This research received no external funding.

Institutional Review Board Statement

Not applicable.

Informed Consent Statement

Not applicable.

Data Availability Statement

The data presented in this study are available on request from the corresponding author. The data are not publicly available due to their large size.

Acknowledgments

Thanks to the families that have participated in the study by providing their personal data about their energy consumptions.

Conflicts of Interest

The authors declare no conflict of interest.

Nomenclature

dRES local self-consumption (-)
EEnergy demand (kWh/y)—(MWh/y)
E(θ)Energy demand (kWh)—(MWh)
EEREnergy efficiency ratio (-)
fPercentage of PV investment cost covered by economic mechanism support (%)
HDDHeating degree days (-)
IIncome (EUR/y)
ISEEEquivalent economic situation indicator (EUR/y)
OCOperating cost (EUR/y)
cUnit price (EUR/kWh)- (EUR/m3)
pEconomic incentive for self-consumption REC (EUR/MWh)
sRES load covered (-)
CO 2 CO2 emission (kgCO2/y)
SPBSimple payback (y)
10%Socio-economic index (-)
Subscript
CoCooling
ElElectric
PGPower grid
prPrimary
PVPhotovoltaic
RResidential
RECRenewable energy community
SUSingle user
SellSell
ShShared
ThThermal
Greek Symbol
αElectricity emission factor (kgCO2/kWh)
η Efficiency (-)
Acronyms
ARERAEnergy and Environmental Italian Authority
CO2Carbon dioxide
EHPElectric heat pump
EUEuropean union
EPEnergy poverty
IEMDInternal Electricity Market Directive
LIHCLow income high costs
M/2Low absolute energy expenditure
2MHigh share of energy expenditure in income
PGItalian electric grid
PODPoint of delivery
PVPhotovoltaic panel
RResidential user
RECRenewable energy community
REDIIRenewable Energy Directive
RESRenewable energy source
PGPower grid
PSPrimary substation
SUSingle user

References

  1. European Union. Energy Poverty Observatory. Towards an Inclusive Energy Transition in the European Union: Confronting Energy Poverty Amidst a Global Crisis. 2020. Available online: https://op.europa.eu/en/publication-detail/-/publication/4a440cf0-b5f5-11ea-bb7a-01aa75ed71a1/language-en (accessed on 12 July 2022).
  2. Carfora, A.; Scandurra, G.; Thomas, A. Forecasting the COVID-19 effects on energy poverty across EU member states. Energy Policy 2022, 161, 112597. [Google Scholar] [CrossRef] [PubMed]
  3. World Bank. Global Economic Prospects Global Economic Prospects; World Bank Publications: Washington, DC, USA, 2020. [Google Scholar] [CrossRef]
  4. EPEE (European Fuel Poverty and Energy Efficiency). Diagnosis of Causes and Consequences of C in Belgium, France, Italy, Spain and United Kingdom (WP2-Deliverable 5); Dixit Productions: Boulogne, France, 2009. [Google Scholar]
  5. BPIE (Buildings Performance Institute Europe). Alleviating Fuel Poverty in the EU. Investing in Home Renovation, a Sustainable and Inclusive Solution; BPIE: Brussels, Belgium, 2014. [Google Scholar]
  6. Thomson, H.; Snell, C.; Liddell, C. Fuel poverty in the European Union: A concept in need of definition? People Place Policy 2016, 10, 5–24. [Google Scholar] [CrossRef]
  7. European Commission. Bringing Energy Poverty Research into Local Practice: Exploring Subnational Scale Analyses Energy Poverty Advisory Hub, February 2022. Available online: https://energy-poverty.ec.europa.eu/system/files/2022-03/EPAH_Bringing%20Energy%20Poverty%20Research%20into%20local%20practice_final.pdf (accessed on 25 October 2022).
  8. Bouzarovski-Buzar, S. Energy Poverty in the EU: A Review of the Evidence. DG Regio Workshop on Cohesion Policy Investing in Energy Efficiency in Buildings; European Union: Brussels, Belgium, 2011. [Google Scholar]
  9. The Lancet Regional Health—Europe. The regional and global impact of the Russian invasion of Ukraine. Lancet Reg. Health Eur. 2022, 15, 100379. [Google Scholar] [CrossRef] [PubMed]
  10. Rapporto 2021 su Povertà ed Esclusione Sociale in Italia. Italian Document. Available online: https://archivio.caritas.it/caritasitaliana/allegati/9651/Rapporto_Caritas_poverta_2021_oltre_ostacolo.pdf (accessed on 25 October 2022).
  11. Orzechowski, A.; Bombol, M. Energy Security, Sustainable Development and the Green Bond Market. Energies 2022, 15, 6218. [Google Scholar] [CrossRef]
  12. Ferrer, R.; Shahzad, S.J.H.; Soriano, P. Are green bonds a different asset class? Evidence from time-frequency connectedness analysis. J. Clean. Prod. 2021, 292, 125988. [Google Scholar] [CrossRef]
  13. ENEA. Action Plan for the Energy Efficiency; ENEA: Roma, Italy, 2017. [Google Scholar]
  14. Corrado, V.; Ballarini, I. Refurbishment trends of the residential building stock: Analysis of a regional pilot case in Italy. Energy Build. 2016, 132, 91–106. [Google Scholar] [CrossRef]
  15. European Commission Clean Energy for All Europeans Package. 2019. Available online: https://ec.europa.eu/energy/topics/energy-strategy/clean-energy-all-europeans_en (accessed on 13 January 2022).
  16. Commission Recommendation (EU) 2020/1563 of 14 October 2020 on Energy Poverty. Available online: https://eur-lex.europa.eu/legal-content/EN/TXT/?uri=CELEX:32020H1563&qid=1606124119302 (accessed on 14 July 2022).
  17. Directive (EU) 2018/2001 of the European Parliament and of the Council of 11 December 2018 on the Promotion of the Use of Energy from Renewable Sources (Recast). 2018. Available online: https://eur-lex.europa.eu/legal-content/EN/TXT/?uri=uriserv:OJ.L_.2018.328.01.0082.01.ENG (accessed on 14 July 2022).
  18. Hanke, F.; Guyet, R.; Feenstra, M. Do renewable energy communities deliver energy justice? Exploring insights from 71 European cases. Energy Res. Soc. Sci. 2021, 80, 102244. [Google Scholar] [CrossRef]
  19. Italian Revenue Agency, Fiscal Incentives for Energy Saving. 2019. Available online: https://agenziaentrate.gov.it/portale/web/guest/cittadini/agevolazioni (accessed on 7 November 2022). (In Italian)
  20. Italian Revenue Agency, Guidlines to Superbonus 110%. 2020. Available online: https://agenziaentrate.gov.it/portale/web/guest/superbonus-110%25 (accessed on 7 November 2022). (In Italian)
  21. Ceglia, F.; Marrasso, E.; Pallotta, G.; Roselli, C.; Sasso, M. The State of the Art of Smart Energy Communities: A Systematic Review of Strengths and Limits. Energies 2022, 15, 3462. [Google Scholar] [CrossRef]
  22. Luz, P.G.; Silva, R.A. Modeling Energy Communities with Collective Photovoltaic Self-Consumption: Synergies between a Small City and a Winery in Portugal. Sustainability 2021, 14, 323. [Google Scholar] [CrossRef]
  23. Ceglia, F.; Marrasso, E.; Roselli, C.; Sasso, M. Small Renewable Energy Community: The Role of Energy and Environmental Indicators for Power Grid. Sustainability 2021, 13, 2137. [Google Scholar] [CrossRef]
  24. Felice, A.; Rakocevic, L.; Peeters, L.; Messagie, M.; Coosemans, T.; Camargo, L.R. Renewable energy communities: Do they have a business case in Flanders? Appl. Energy 2022, 132, 119419. [Google Scholar] [CrossRef]
  25. Petrichenko, L.; Sauhats, A.; Diahovchenko, I.; Segeda, I. Economic Viability of Energy Communities versus Distributed Prosumers. Sustainability 2022, 14, 4634. [Google Scholar] [CrossRef]
  26. Minuto, F.D.; Lazzeroni, P.; Borchiellini, R.; Olivero, S.; Bottaccioli, L.; Lanzini, A. Modeling technology retrofit scenarios for the conversion of condominium into an energy community: An Italian case study. J. Clean. Prod. 2021, 282, 124536. [Google Scholar] [CrossRef]
  27. Fina, B.; Schwebler, M.; Monsberger, C. Different Technologies’ Impacts on the Economic Viability, Energy Flows and Emissions of Energy Communities. Energies 2022, 14, 4993. [Google Scholar] [CrossRef]
  28. Schram, W.; Louwen, A.; Lampropoulos, I.; van Sark, W. Comparison of the Greenhouse Gas Emission Reduction Potential of Energy Communities. Energies 2019, 12, 4440. [Google Scholar] [CrossRef] [Green Version]
  29. Fleischhacker, A.; Lettner, G.; Schwabeneder, D.; Auer, H. Portfolio optimization of energy communities to meet reductions in costs and emissions. Energy 2019, 173, 1092–1105. [Google Scholar] [CrossRef]
  30. Ceglia, F.; Macaluso, A.; Marrasso, E.; Sasso, M.; Vanoli, L. Modelling of polymeric shell and tube heat exchangers for low-medium temperature geothermal applications. Energies 2020, 13, 2737. [Google Scholar] [CrossRef]
  31. Yamashita, D.Y.; Vechiu, I.; Gaubert, J.P. A review of hierarchical control for building microgrids. Renew. Sustain. Energy Rev. 2020, 118, 109523. [Google Scholar] [CrossRef]
  32. Jank, R. Annex 51: Case studies and guidelines for energy efficient communities. Energy Build. 2017, 154, 529–537. [Google Scholar] [CrossRef]
  33. Shaukat, N.; Ali, S.M.; Mehmood, C.A.; Khan, B.; Jawad, M.; Farid, U.; Ullah, Z.; Anwar, S.M.; Majid, M. A survey on consumers empowerment, communication technologies, and renewable generation penetration within Smart Grid. Renew. Sustain. Energy Rev. 2018, 81, 1453–1475. [Google Scholar] [CrossRef]
  34. Jafari, A.; Khalili, T.; Ganjehlou, H.G.; Bidram, A. Optimal integration of renewable energy sources, diesel generators, and demand response program from pollution, financial, and reliability viewpoints: A multi-objective approach. J. Clean. Prod. 2020, 247, 119100. [Google Scholar] [CrossRef]
  35. Sousa, T.; Soares, T.; Pinson, P.; Moret, F.; Baroche, T.; Sorin, E. Peer-to-peer and community-based markets: A comprehensive review. Renew. Sustain. Energy Rev. 2019, 104, 367–378. [Google Scholar] [CrossRef] [Green Version]
  36. Cuesta, M.A.; Castillo-Calzadilla, T.; Borges, C.E. A critical analysis on hybrid renewable energy modelling tools: An emerging opportunity to include social indicators to optimise systems in small communities. Renew. Sustain. Energy Rev. 2020, 122, 109691. [Google Scholar] [CrossRef]
  37. Knox, S.; Hannon, M.; Stewart, F.; Ford, R. The (in)justices of smart local energy systems: A systematic review, integrated framework, and future research agenda. Energy Res. Soc. Sci. 2022, 83, 102333. [Google Scholar] [CrossRef]
  38. Hanke, F.; Lowitzsch, J. Empowering Vulnerable Consumers to Join Renewable Energy Communities—Towards an Inclusive Design of the Clean Energy Package. Energies 2020, 13, 1615. [Google Scholar] [CrossRef] [Green Version]
  39. Ambole, A.; Koranteng, K.; Njoroge, P.; Luhangala, D.L. A Review of Energy Communities in Sub-Saharan Africa as a TransitionPathway to Energy Democracy. Sustainability 2021, 13, 2128. [Google Scholar] [CrossRef]
  40. Ehnberg, J.; Ahlborg, H.; Hartvigsson, E. Approach for flexible and adaptive distribution and transformation design in ruralelectrification and its implications. Energy Sustain. Dev. 2020, 54, 101–110. [Google Scholar] [CrossRef]
  41. Rademaekers, K.; Yearwood, J.; Ferreira, A.; Pye, S.; Hamilton, I.; Agnolucci, P.; Grover, D.; Karásek, J.; Anisimova, N. Selecting Indicators to Measure Energy Poverty. Trinomics. 2016. Available online: https://trinomics.eu/wp-content/uploads/2016/06/Selecting-Indicators-to-Measure-Energy-Poverty.pdf (accessed on 26 October 2022).
  42. Ceglia, F.; Marrasso, E.; Roselli, C.; Sasso, M. Time-evolution and forecasting of environmental and energy performance of electricity production system at national and at bidding zone level. Energy Convers. Manag. 2022, 265, 115772. [Google Scholar] [CrossRef]
  43. Fichera, A.; Marrasso, E.; Sasso, M.; Volpe, R. Energy, Environmental and Economic Performance of an Urban Community Hybrid Distributed Energy System. Energies 2020, 13, 2524. [Google Scholar] [CrossRef]
  44. EPAH. Indicators & Data. Energy Poverty Advisory Hub. 2022. Available online: https://energy-poverty.ec.europa.eu/energy-poverty-observatory/indicators_en (accessed on 26 October 2022).
  45. Department of Energy and Climate Change (DECC). Annual Fuel Poverty Statistics Report England. National Statistics of England. 2016. Available online: https://assets.publishing.service.gov.uk/government/uploads/system/uploads/attachment_data/file/637430/Annual_Fuel_Poverty_Statistics_Report_2016_-_revised_26.04.2017.pdf (accessed on 26 October 2022).
  46. Siksnelyte-Butkiene, I.; Streimikiene, D.; Lekavicius, V.; Balezentis, T. Energy poverty indicators: A systematic literature review and comprehensive analysis of integrity. Sustain. Cities Soc. 2021, 67, 102756. [Google Scholar] [CrossRef]
  47. Boardman, B. Fuel Poverty: From Cold Homes to Affordable Warmth; Belhaven Press: London, UK, 1991; 267p, ISBN 1852931396. [Google Scholar]
  48. Corrado, V.; Ballarini, I.; Corgnati, S.P. Building Typology Brochure—Italy. 2014. Available online: https://episcope.eu/fileadmin/tabula/public/docs/brochure/IT_TABULA_TypologyBrochure_POLITO.pdf (accessed on 14 July 2022).
  49. Personal Data about Energy Consumption on Enel Distribution. Available online: https://www.e-distribuzione.it/servizi.html (accessed on 14 July 2022).
  50. UNI TS 11300-2. Energy Performance of Buildings. In Part 2: Evaluation of Primary Energy Need and System Efficiencies for Space Heating and Domestic Hot Water Production; UNI, Ente Nazionale di Unificazione: Milan, Italy, 2008; Available online: https://tuxdoc.com/download/uni-ts-11300-2-3_pdf (accessed on 14 July 2022).
  51. ENI. Personal Data about Energy Consumption. Available online: https://www.eni.com/it-IT/area-riservata.html (accessed on 14 July 2022).
  52. ITALGAS. Personal Data about Energy Consumption. Available online: https://clienti.italgas.it/clienti/login.action (accessed on 14 July 2022).
  53. d.lgs, 112/2020/R/eel, Italy. Guidelines for the Regulation of Economic Items Relating to Electricity Subject to Collective Self-Consumption or Sharing within the Renewable Energy Community. (Orientamenti per la Regolazione Delle Partite Economiche Relative All’energia Elettrica Oggetto di Autoconsumo Collettivo o di Condivisione Nell’ambito di Comunità di Energia Rinnovabile, in Italian). Available online: https://www.arera.it/it/docs/20/112-20.htm (accessed on 18 July 2022).
  54. RIELLO. Technical Data—Sheet Boiler. Available online: https://www.riello.it/catalogo/caldaie?range=31BICGAERF (accessed on 30 July 2022).
  55. ARISTON. Technical Data—Sheet Boiler. Available online: https://www.ariston.com/it-it/prodotti/caldaie/condensazione (accessed on 30 July 2022).
  56. RIELLO. Technical Data—Sheet Air to Air Heat Pump. Available online: https://www.riello.it/catalogo/condizionamento?range=61ABEASWRT (accessed on 31 July 2022).
  57. MITSUBISHI. Technical Data—Sheet Air to Air Heat Pump. Available online: https://climatizzazione.mitsubishielectric.it/uploads/document/scheda_tecnica_5068.pdf (accessed on 31 July 2022).
  58. DAIKIN. Technical Data—Sheet Air to Air Heat Pump. Available online: https://www.daikin.it/it_it/cataloghi-e-app.html (accessed on 31 July 2022).
  59. KYOCERA. Technical Data—Sheet Photovoltaic. Available online: https://global.kyocera.com/prdct/solar/ (accessed on 31 July 2022).
  60. HOMER. Homer Energy, Citizen Manual of HOMER®Pro, Version 3.7; HOMER: Boulder, CO, USA, 2016.
  61. European Community. Photovoltaic Geographical Information System. Available online: https://re.jrc.ec.europa.eu/pvg_tools/en/#api_5.2 (accessed on 31 July 2022).
  62. MATLAB. MATLAB and Statistics Toolbox Release; MathWorks, Inc.: Natick, MA, USA, 2018. [Google Scholar]
  63. Ceglia, F.; Marrasso, E.; Rosselli, C.; Sasso, M. An innovative environmental parameter: Expanded Total Equivalent Warming Impact. Int. J. Refrig. 2021, 131, 980–989. [Google Scholar] [CrossRef]
  64. ARERA. Electricity Price Trend for the Typical Domestic Consumer in Greater Protection. Data of First Semester 2021. (Andamento del Prezzo Dell’energia Elettrica per il Consumatore Domestico Tipo in Maggior Tutela, in Italian). Available online: https://www.arera.it/it/dati/eep35.htm (accessed on 15 July 2022).
  65. ARERA. Minimum Renewable Energy Price. Available online: https://www.arera.it/it/elettricita/prezziminimi.htm (accessed on 15 July 2022).
  66. Ceglia, F.; Esposito, P.; Faraudello, A.; Marrasso, E.; Rossi, P.; Sasso, M. An energy, environmental, management and economic analysis of energy efficient system towards renewable energy community: The case study of multi-purpose energy community. J. Clean. Prod. 2022, 369, 133269. [Google Scholar] [CrossRef]
  67. IRENA. International Renewable Energy Agency, Renewable Power Generation Costs in 2019. 2020. Available online: https://www.irena.org/-/media/Files/IRENA/Agency/Publication/2020/Jun/IRENA_Power_Generation_Costs_2019.pdf%20tabella (accessed on 31 October 2022).
  68. GSE. Renewable Sell Price. Available online: https://www.gse.it/servizi-per-te/fotovoltaico/ritiro-dedicato/documenti (accessed on 31 October 2022).
Figure 1. Buildings’ location from Google Maps.
Sustainability 14 15077 g001
Figure 2. Occupancy schedules for R#1, R#2, and R#3: (a) weekday; (b) weekend day.
Sustainability 14 15077 g002
Figure 3. Electric load during winter (a) and summer (b) periods.
Sustainability 14 15077 g003
Figure 4. Monthly electric energy load.
Sustainability 14 15077 g004
Figure 5. Natural gas consumption.
Sustainability 14 15077 g005
Figure 6. Schematic layout of the renewable energy community (REC) and simple energy users (SU).
Sustainability 14 15077 g006
Figure 7. Model graph.
Sustainability 14 15077 g007
Figure 8. Energy flow of REC on monthly based.
Sustainability 14 15077 g008
Figure 9. Duration curve load, PV production, and the electricity taken from grid.
Sustainability 14 15077 g009
Figure 10. CO2 emission for REC and each end-user.
Sustainability 14 15077 g010
Figure 11. Hourly average value of electric R#3 load and CO2 emission factor for electricity production. (a) Winter day as a mean of January; (b) intermediate day as a mean of April; and (c) summer day as a mean of August.
Sustainability 14 15077 g011
Figure 12. Socio-economic indexes for SU and REC case.
Sustainability 14 15077 g012
Figure 13. Cash flows of REC.
Sustainability 14 15077 g013
Figure 14. SPB trend as a function of selling and purchase electricity price.
Sustainability 14 15077 g014
Table 1. Main building envelope features for flats.
CharacteristicsUnitR#1R#2R#3
Area and volume ratio(m−1)0.660.660.70
External wall transmittance(W∙m2∙K−1)0.610.610.82
Roof transmittance(W∙m2∙K−1)-0.700.95
Inter-floor slabs transmittance(W∙m2∙K−1)0.93--
Ground floor transmittance(W∙m2∙K−1)--1.24
Window transmittance(W∙m2∙K−1)3.43.43.7
g-value(-)0.760.760.76
Table 2. Air-to-air heat pump data for all the apartments.
EHPCooling
Power (kWCo)
Heating
Power (kWth)
EER (-)COP (-)
EHPR#1_1
EHPR#1_2/EHPR#1_3
5.26.03.684.0
2.63.24.04.0
EHPR#2_14.34.93.33.75
EHPR#2_2/EHPR#2_32.53.153.64.2
EHPR#3_14.243.754.04
EHPR#3_23.45.43.754.12
Table 3. PV plant parameters.
ParameterValue
Peak power (kW)0.15
Solar panel efficiency (%)14.4
Rated working voltage (V)22.5
Rated working current (A)8.25
Open circuit voltage (V)18.2
Short circuit current (A)8.87
Nominal operating cell temperature (°C)45.0
Maximum power temperature factor (%/°C)−0.46
Temperature coefficient of current (%/K)0.06
Gross area (m2)1.69
Table 4. Operating cost and socio-economic indicators in SU layout.
Economic/Social IndexR#1R#2R#3
O C E l S U (EUR/y)1663.01198.81407.2
O C N G , T h S U (EUR/y)905.2796.4362.1
O C t o t S U (EUR/y)2568.21968.31769.3
I S U   R # 1 / R # 2 / R # 3 (EUR/y)45,00020,00026,800
I S E E S U   R # 1 / R # 2 / R # 3 (EUR/y) 39,00018,00017,000
10 % R # 1 / R # 2 / R # 3 (%)5.71%9.84%6.60%
10 % I S E E R # 1 / R # 2 / R # 3 (%)6.59%10.93%10.41%
Table 5. PV parameter cost [67].
Parameters SymbolUnitValue
Investment cost PVICPVEUR 18,000
Maintenance cost of PVMCEUR/y1800
Year of incentive ay20
Percentage of ICPV covered by economic mechanism supportf%50
Publisher’s Note: MDPI stays neutral with regard to jurisdictional claims in published maps and institutional affiliations.