Article

Effect of Situation Kinematics on Drivers’ Rear-End Collision Avoidance Behaviour—A Combined Effect of Visual Looming, Speed, and Distance Analysis

1
Beijing Key Laboratory of Urban Intelligent Traffic Control Technology, North China University of Technology, Beijing 100144, China
2
Engineering Research Center of Catastrophic Prophylaxis and Treatment of Road & Traffic Safety of Ministry of Education, Changsha University of Science & Technology, Changsha 410114, China
3
Guangdong Provincial Transport Planning & Research Center, Guangzhou 510199, China
4
Standards and Metrology Research Institute, China Academy of Railway Sciences Co., Ltd., Beijing 100081, China
*
Author to whom correspondence should be addressed.
Sustainability 2022, 14(22), 15103; https://doi.org/10.3390/su142215103
Submission received: 17 August 2022 / Revised: 29 October 2022 / Accepted: 11 November 2022 / Published: 15 November 2022
(This article belongs to the Special Issue Transport Safety)

Abstract

:
Considering the large proportion of rear-end collisions occurring in our daily life and the severity it may lead to, the objective of this study was to investigate the effect of situation kinematics on drivers’ rear-end collision avoidance behaviour after brake onset. A wide range of lead vehicle deceleration scenarios were designed based on driving simulator experiments to collect drivers’ deceleration behaviour data. Different from measures (e.g., speed, the lead vehicle’s deceleration et al.) often adopted in previous studies, a visual looming-based measure at different time points was calculated combined with analysis of speed and distance to quantify situation kinematics in this study. The Spearman’s nonparametric rank correlation test was firstly conducted to examine the correlation between visual looming-based metrics and related deceleration behaviour. The mixed model was performed on drivers’ brake jerk and maximum deceleration rate, while the logistic model was then performed to predict the probability of the occurrence of rear-end collisions. Spearman’s nonparametric test showed that both deceleration ramp-up and drivers’ maximum deceleration rate increase significantly as the looming traces increase faster. Results of the logistic model indicated that the probability of occurrence of a potential collision might be higher if the situation at the brake onset is quite urgent and braking is moderate. It was demonstrated that both drivers’ deceleration ramp-up and maximum deceleration rate could be highly kinematic-dependent, and visual looming, driving speed, and distance can be useful information for drivers to take relative deceleration actions.

1. Introduction

According to statistics of the World Health Organization, road traffic injuries are one of the eight lead causes of death globally. It was estimated that around 1.25 million people died from road traffic injuries and another 20–50 million people sustained non-fatal injuries as a result of road traffic collisions [1]. Among all the collision types, rear-end crashes are the most frequently occurring one, and it accounted for approximately 32% in the US [2]. A rear-end collision is commonly induced by a sudden deceleration of the lead vehicle during a car-following process, and it can be avoided using forward collision warning (FCW) systems [3].
However, an effective FCW system should be designed on the base of a good understanding of the collision avoidance behaviour. There is considerable literature supporting the importance of a quick response to the lead vehicle’s brake and major factors that may affect drivers’ brake response time, including drivers’ age, gender, profession, weather condition, and so on [4,5,6,7,8,9,10,11]. As for drivers’ crash avoidance behaviour after brake onset, both driving simulator studies and naturalistic studies demonstrated that drivers often reached a maximum deceleration rate [12,13] and there was a stepwise ramp-up towards the maximum deceleration [6,12,13]. Generally, drivers’ maximum deceleration rate increased with the increase in driving speeds and reduced headway distance. Factors adopted in the literature mentioned above (except [13]) can be categorized as the lead vehicle’s driving status (driving speed and lead vehicle’s deceleration rate) and scenario status (headway distance when driver in simulator brakes).
Generally, the time to collision (TTC) was an important indicator affecting drivers’ deceleration behaviour. Indicators including both driver demographics (age group and gender) and driving context (day of week, time of day, travel speed, and traffic congestion) were shown to be statistically significant [14]. Situation urgency was described by TTC. Thus, a TTC threshold design has been the key factor when designing FCW [15,16]. In fact, Lee [17] reported that rather than information about speed, distance, or acceleration, measures from a visual looming perspective could provide a more straightforward way to quantify situation urgency. If the collision draws nearer, the lead vehicle looms on the driver’s retina. As looming objects might indicate an impending collision or an approaching object, drivers in the following vehicles have to rely on visual information about how quick they are approaching the lead vehicle. That kind of information is called visual looming, and it has been supported by behavioural evidence [18,19]. Visual looming-based measures are used to quantify situation kinematics such as inverse tau τ−1, the rate between lead vehicle’s optical expansion rate θ ˙ on the driver’s retina and its optical size θ , which is a visually available estimate of inverse TTC [17]. The important role of τ−1 and similar quantities on deciding on drivers’ responses to collisions have been supported by many studies [20,21,22]. Markkula et al. [13] tested the effect of situation kinematics measured by τ−1 on drivers’ deceleration control behaviour. Drivers’ deceleration behaviour was highly dependent on situation urgency, and possible brake response mechanism underlying was proposed in the study.
Alternative measures to quantify visual looming can be theta dot θ ˙ [23,24] and v/τ, where v is the driving speed of the following vehicle [25,26,27,28,29]. All of the measures behave in the same way, increasing faster as the collision draws nearer [30]. The effect of visual looming information on drivers’ deceleration behaviour can be unaffected by the choice of kinematical measures [13]. Although the effect of visual looming-based situation kinematics on collision avoidance behaviour after brake onset has been tested [13], a combined effect of visual looming, speed, and distance information on drivers’ collision avoidance behaviour after brake onset has not been tested before. Thus, experiments including a wide range of lead vehicle deceleration scenarios were conducted using a driving simulator. By collecting drivers’ speed, distance, and visual looming information at brake onset and maximum braking, the paper aims to explore the main cues that drivers use to control braking and the possible factors that contribute to rear-end collisions.

2. Methods

2.1. Subjects

As a continuing work of Xue et al. [31], the dataset used in this study is the same as the one in that paper. In this experiment, a total of 46 participants (24 males vs. 22 females) aged from 30–40 years (M = 34.33, SD = 2.99) were recruited. Each participant held a valid Chinese driver license and had at least one year’s driving experience and 30,000 km driving mileage per year. After arrival, each participant was given at least 10 min of driving to familiarize them with the driving simulator operation. For the test driving, participants were asked to drive on a straight road, and they were instructed to accelerate or decelerate to a designated speed, so that they could adapt to the operation of the driving simulator. Before the formal experiment, participants were told just to follow the lead vehicle and drive as they normally would and they were not told about the lead vehicle’s sudden brake beforehand. When the formal experiment began, the participants would rest for at least 5 min between the tests. All participants signed an informed consent form and they received RMB 100 (about USD 15) for their attendance.

2.2. Equipment

The equipment used in this experiment is Beijing Jiaotong University driving simulator, as shown in Figure 1. The simulator is composed of a cabin of Ford Focus and automatic gearbox, gas/brake pedal, and other components, which are in full accordance with the real vehicle. The simulator has a linear motion base, capable of operating with a single degree of freedom (the rotation of pitch). The driving scenarios are designed with Sim Vista (Real time Inc., Wasilla, AK, USA) and projected on five screens with a resolution of 1400 × 1050 pixels to realize a driver’s 300 degree field of front view and three rear-view mirrors (left, middle, and right), which are simulated by LCD screens.

2.3. Scenario Design

In this study, scenarios with a bidirectional straight segment with a speed limit of 60 km/h were created. Three kinds of initial driving speeds (60 km/h, 40 km/h, and 20 km/h) of the lead vehicle were designed in this experiment, corresponding to three levels of traffic congestion. In each level of traffic congestion scenarios, the participants were assigned to follow a vehicle stopped 1500 m ahead. When drivers in the simulator drove 50 m behind the lead vehicle, the lead vehicle began to accelerate to one of the three initial speeds. Three deceleration points were designed in each drive; the lead vehicle was programmed to decelerate at an assigned deceleration rate once it drove to the deceleration point. The distance between each deceleration point was around 1 min. When the driving speed of the lead vehicle reached the designed value, the lead vehicle would keep this speed until it drove to the next deceleration point (see Figure 2 for the profile of deceleration and speed). The order of the three drives was counterbalanced between participants. A series of vehicles coming from the opposite direction were arranged to simulate the realistic traffic situation, and a double yellow solid line in the middle of the road was designed according to Chinese traffic regulations to avoid the simulator’s overtaking behaviour. Each participant had about 15 min of total driving time during, in which each drive lasted about 5 min.

2.4. Visual Looming-Based Measures

The metric used in this study to quantify situation kinematics was τ−1, the optical variables θ and θ ˙ can be calculated by the following formulas [17,25], and detailed definitions of each variable are shown in Table 1:
θ = 2 · arctan ( W 2 d )
θ ˙ = W v r e l / ( d 2 + W 2 4 ) ,
τ 1 = θ ˙ θ ,

2.5. Model and Data for Analysis

Spearman’s nonparametric rank correlation test was first conducted to find the correlation between τ 1 and collision avoidance behaviour. Robust linear regression was adopted as well, for illustration purposes, by using the Matlab function robustfit with default settings (2014b).
Mixed model, also known as random coefficient model, hierarchical linear model or mixed-effects model [32], was used in this study to investigate the effect of situation kinematics and other variables, e.g., headway distance when drivers in the simulator started braking (DB) or drivers in the simulator reached their maximum deceleration (DM) on deceleration ramp-up and maximum deceleration rate, taking drivers’ individual differences into consideration as well. The general form of the model can be described as:
Y i j = β 0 + h   =   1 p β h X h i j   +   α j   +   ε i j ,
α j ~ N ( 0 ,   σ α 2 ) ,
ε i j ~ N ( 0 ,   σ ε 2 )
where Y i j is the ith deceleration ramp-up or maximum deceleration rate of the jth individual, X h i j is the ith value of the jth individual for the hth predictor, the predictor here can be visual looming-based measures, headway distance, and so on. B 0 is the overall intercept, β h is the slope (regression coefficient) of the hth predictor, α j is the individual-specific effects with mean of zero and variance of σ α 2 , and ε i j is the residual associated with the ith value of the jth individual from a normal distribution of residuals with mean of zero and variance of σ ε 2 . Mixed model in this study was applied by Matlab function fitlme with default settings (R2014b).
As mentioned in Section 2.2, each driver in this experiment experienced three drives, and there were three deceleration scenarios within one drive, so drivers had nine deceleration scenarios in total (414 recordings). As the purpose of this study was to investigate the effect of situation urgency on near-crash and crash deceleration behaviour, recordings with time headway larger than 3.5 s were excluded. Only 323 recordings were kept for further analysis. Analysis was carried out between situation kinematics, in terms of inverse tau and drivers’ deceleration behaviour.

3. Results

3.1. The Spearman’s Nonparametric Test between τ B 1 and Deceleration Behaviour

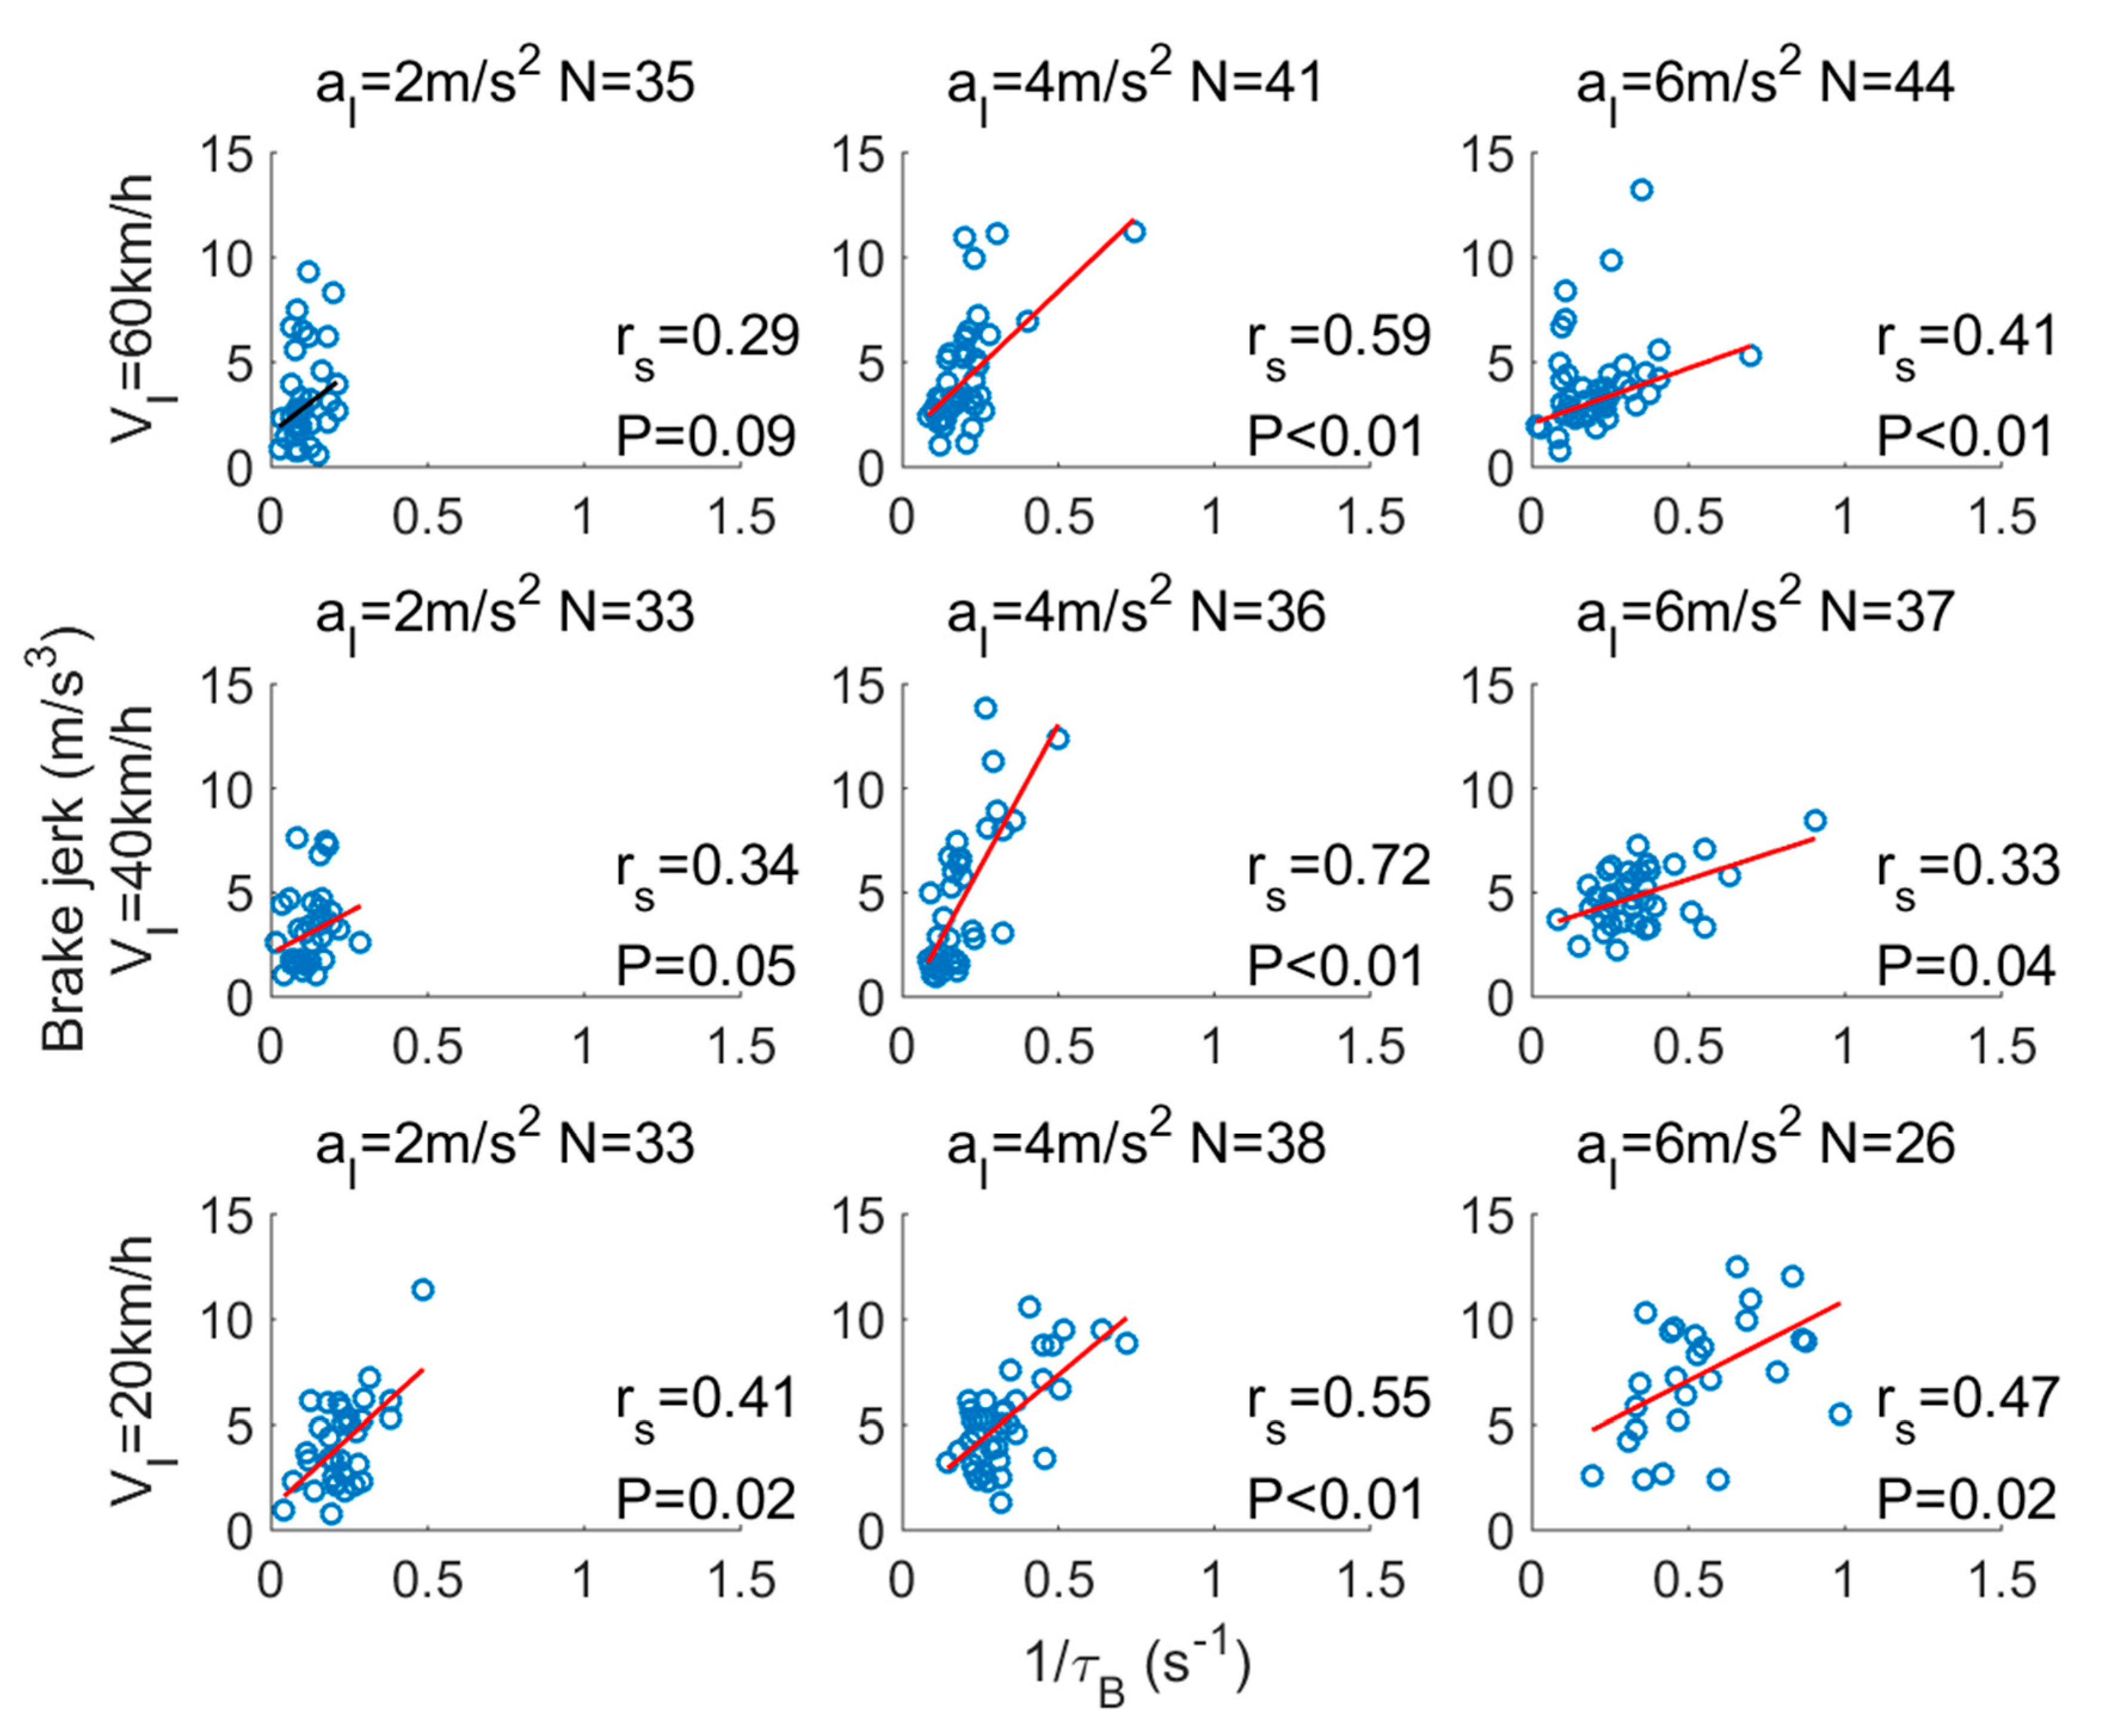
The correlations between τ B 1 and deceleration ramp-up jB and maximum deceleration rate am are shown in Figure 3 and Figure 4. For the brake jerk, the correlation is significant for all the driving speed conditions, except the lead vehicle driving at 60 km/h with deceleration rate (al) is 2 m/s2. Overall, drivers’ deceleration ramp-up becomes faster as the situation becomes more urgent (with larger τ B 1 ). According to the modelling framework purposed by Markkula [33], drivers’ brake pedal adjustments depend on how much the visual looming deviates from the looming the drivers are expecting. In relatively more urgent conditions, i.e., strong looming conditions, the looming is already very strong at the drivers’ brake onset. In order to make the looming match the expectations of the drivers themselves, drivers may need to brake hard in a very short time, thus making the brake ramp-up increase faster (larger jerks) in a more urgent situation than in a less urgent situation (weaker looming condition).
Generally, the maximum deceleration rates (am) increase when drivers’ brake onset becomes more urgent (with larger τ B 1 ). Obviously, a larger maximum deceleration rate is needed to avoid a rear-end collision in a rather urgent situation. However, a statistically insignificant correlation is found when the lead vehicle is driving at 40 km/h with a deceleration rate of 6 m/s2.

3.2. Prediction of Brake Jerk and Maximum Deceleration Rate

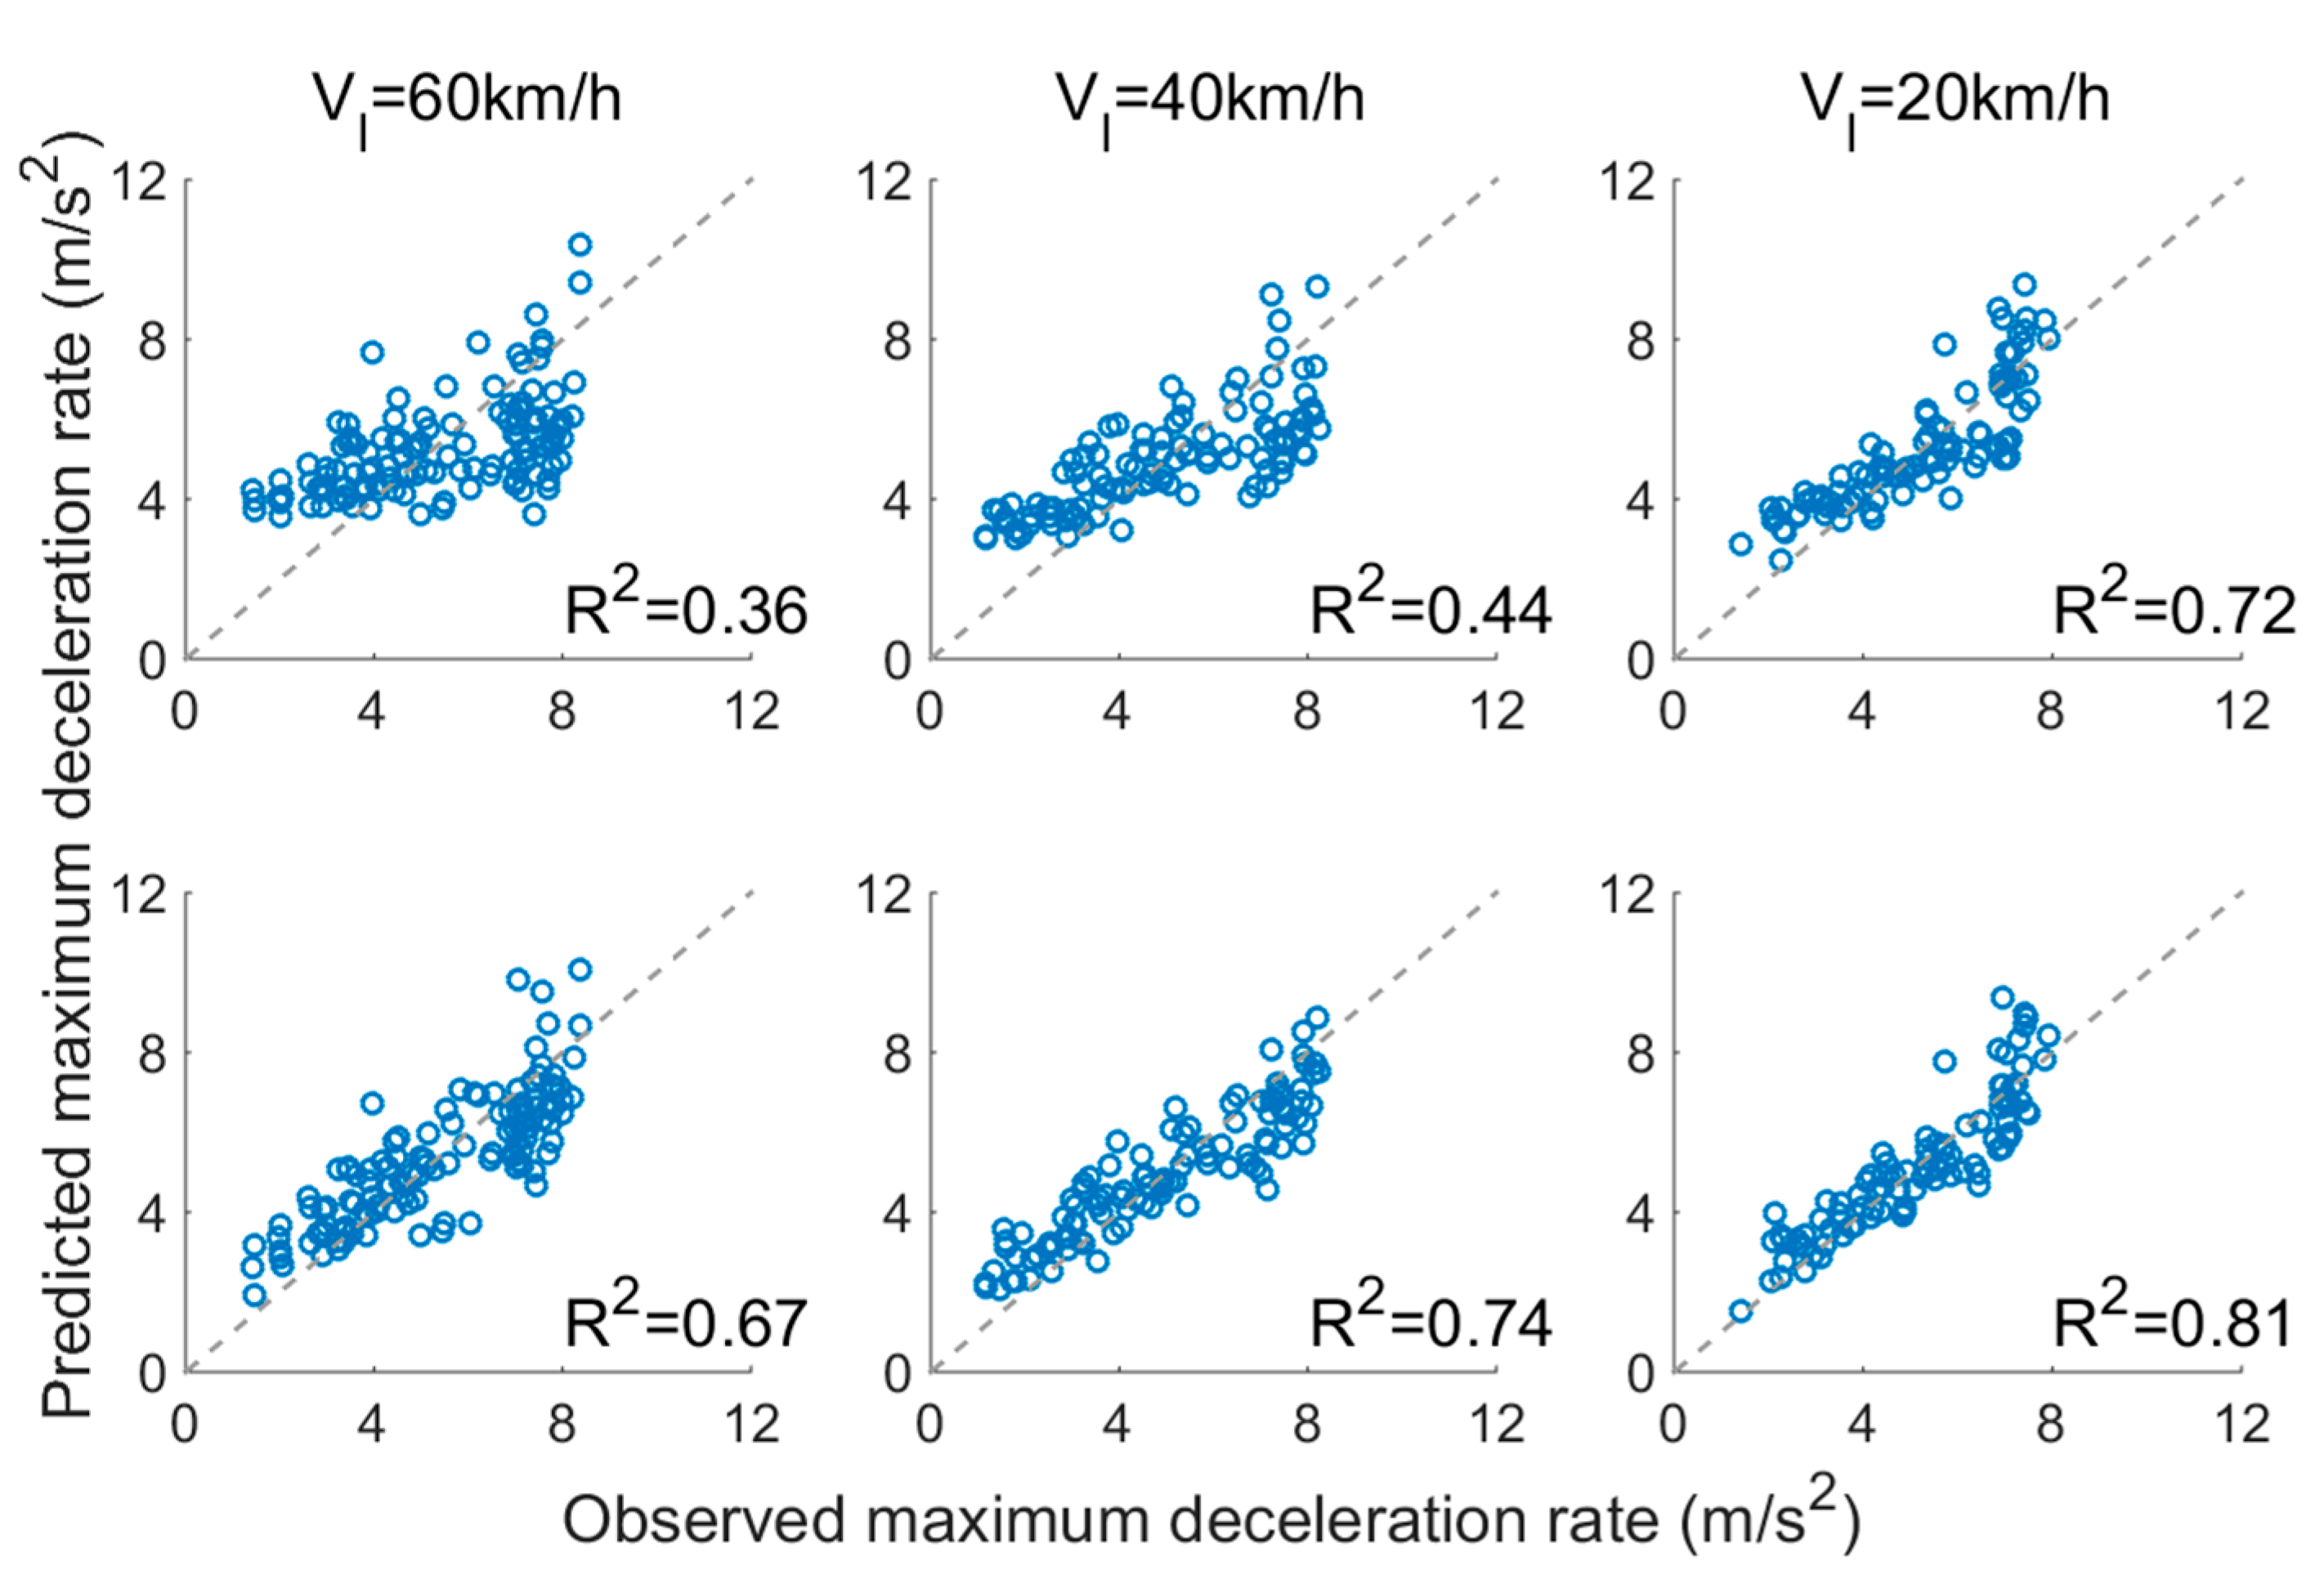
Table 2 shows the mixed-model results of jB and am, respectively. All the predictors have significant effects on drivers’ brake jerk. Generally, drivers’ deceleration ramp-up increases faster with larger τ B 1 and faster driving speed Vf, while it decreases with larger DB. Figure 5 shows the predicted brake jerk in three speed conditions, respectively. However, drivers’ brake jerks are not well predicted when driving at 60 km/h and 40km/h, especially for brake jerks larger than 8 m/s3. As drivers usually keep a smaller headway distance when driving at a slower speed than at a faster speed [34,35,36], when the lead vehicle is driving at 20 km/h, drivers keep a smaller distance from the lead vehicle and may mainly rely on distance and visual looming to control how hard they brake. However, for fast speed conditions, there may be other cues (e.g., brake lights) that drivers use to decide on how hard they brake. It was found that for the eight underestimated recordings with Vl = 60 km/h, there were three recordings that came from one participant. All of the underestimated recordings have a mean brake response time around 0.84 s (S.D. = 0.15). These recordings may be induced by drivers who brake at the lead vehicle brake light onset and brake very hard, instead of taking the current driving situation into much consideration.
For the prediction of am, am increases with strong looming when drivers brake, as well as at fast driving speed or when there is a large brake jerk or small headway distance. However, as shown in Figure 5 (upper panel), drivers’ maximum deceleration rate is not well predicted when the lead vehicle is driving at 60 km/h and 40 km/h. Obviously, am larger than 7 m/s2 is mostly underestimated. When the lead vehicle’s speed is 40 km/h, nearly all the underestimated recordings (except one observation) are from the group with al equals to 6 m/s2. Just as the only insignificant condition in Figure 4, drivers’ maximum deceleration rates are quite large even if the situation is not urgent (small τ B 1 ). By looking at the underlying data, it was found that for both the 60 km/h and 40 km/h underestimated recordings, the mean time that drivers use from brake onset to maximum braking is 2.25 s and 1.53 s, respectively, whereas the mean time is 0.93 s and 0.88 s for the non-underestimated drivers. In fact, for these underestimated recordings, the situation at brake onset is not urgent enough to make drivers reach such a large maximum deceleration, but they may prefer to brake moderately until the brake limit is almost reached. To further investigate the correlation between situation urgency and maximum deceleration rates, visual looming and distance at maximum braking (marked as τ M 1 and DM) were collected and adopted together with Vf and jB in model B (results in Table 1). Generally, am in model B is well predicted, with most circles settled down on the diagonal lines. Comparison between model A and model B is conducted using a simulated likelihood ratio test, with 1000 simulations. A significant difference is found between the two models with p < 0.01, and model B provides a better model fitting with smaller AIC (1016.3 vs. 1154.7).

3.3. Logistic Analysis of Rear-End Collision Probability

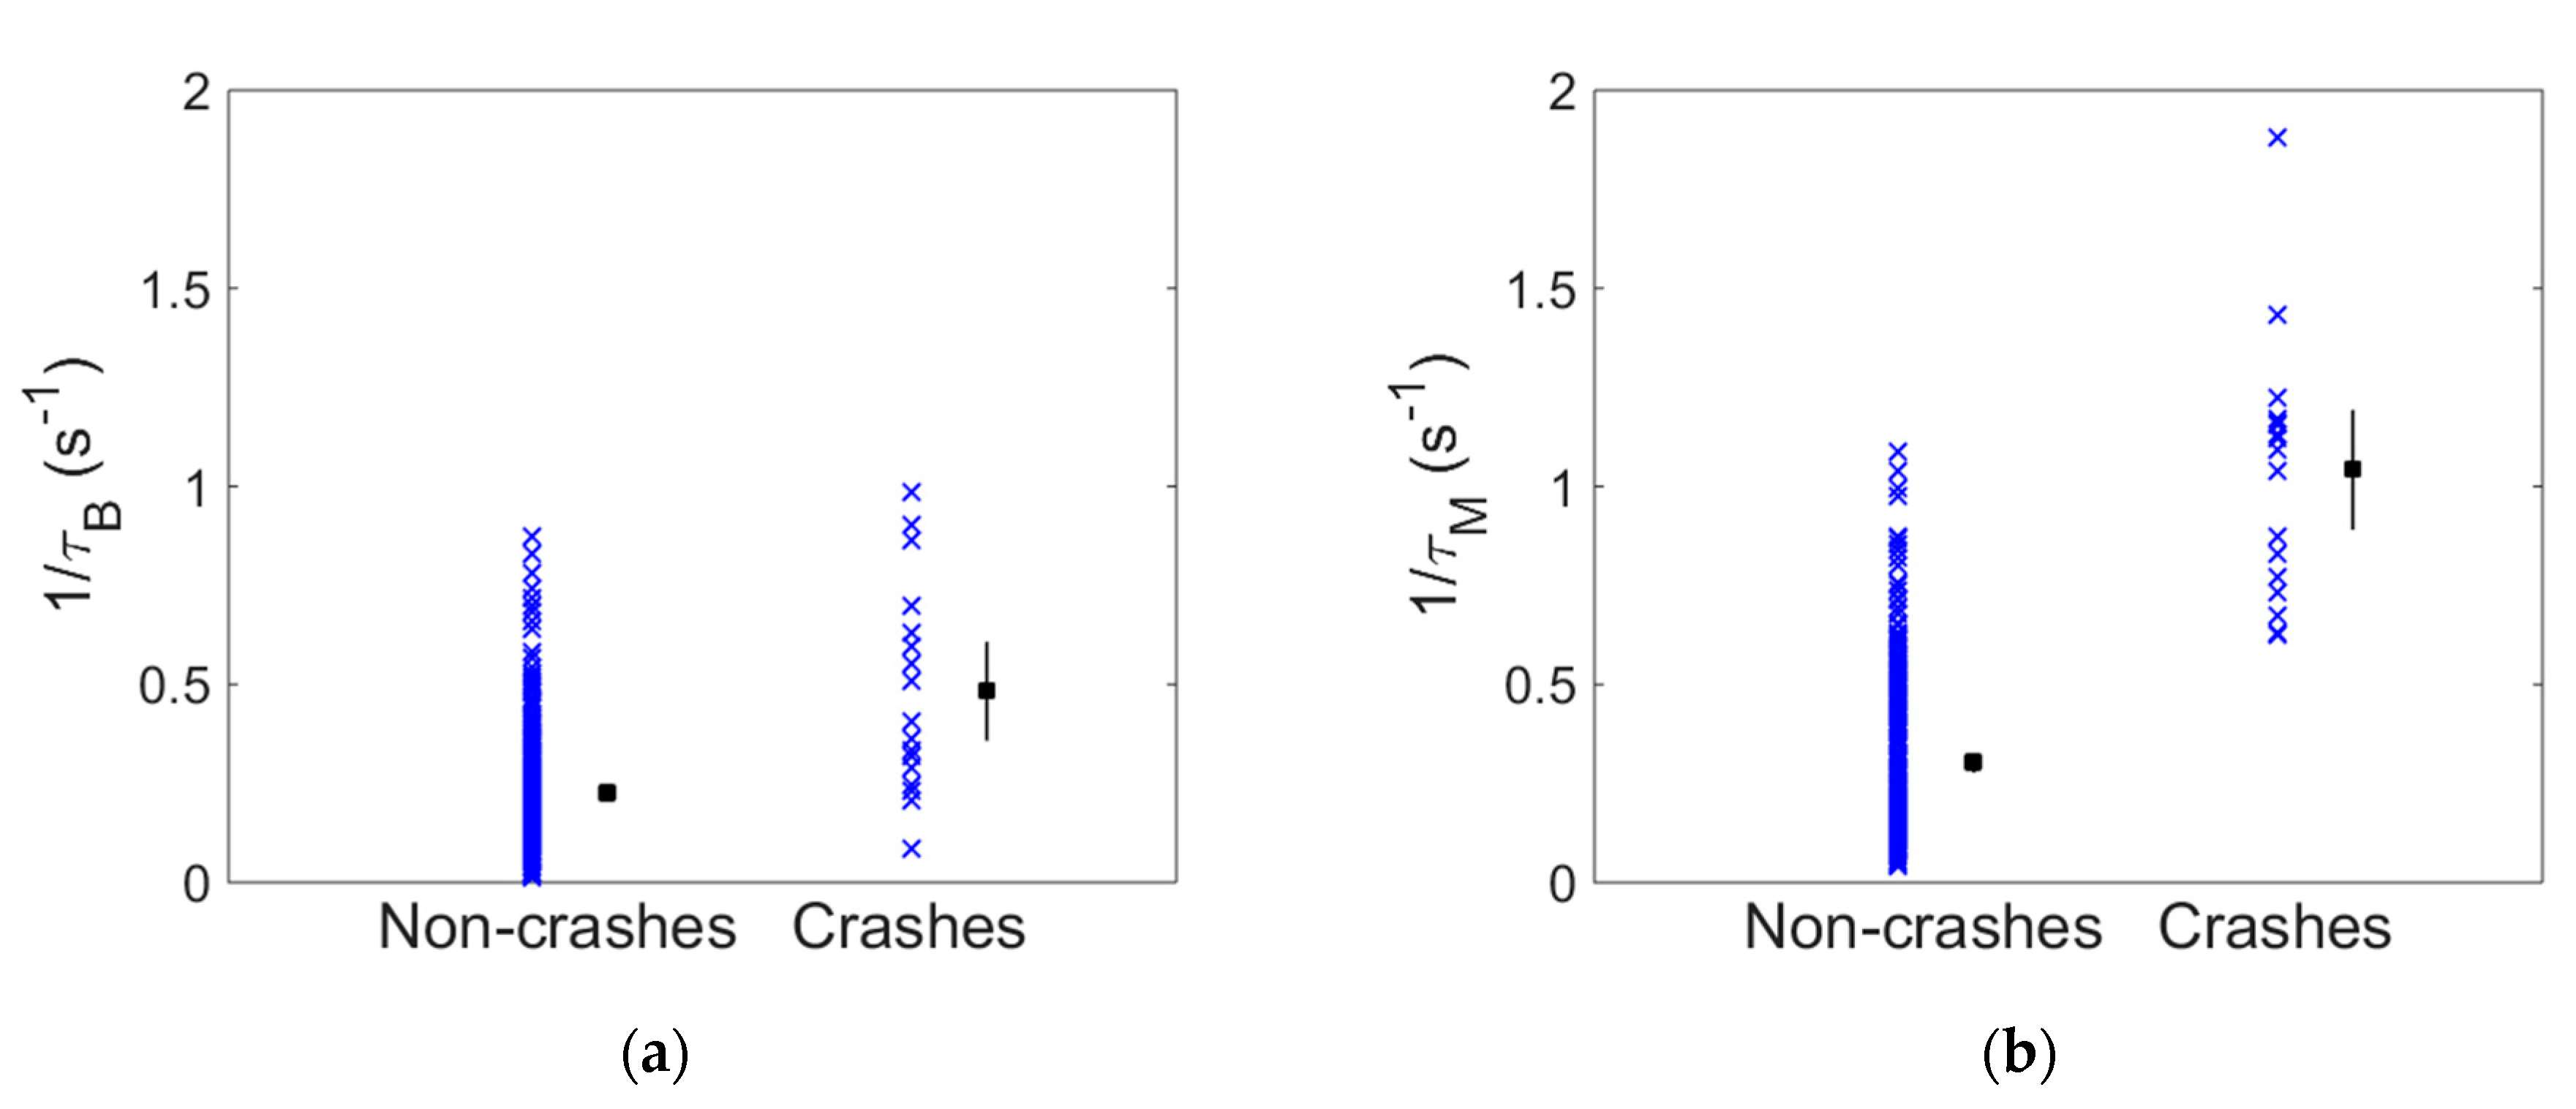
In this study, only 19 rear-end crashes occurred among all 323 recordings. Logistic regression analysis is applied in this section to investigate the impacts of visual looming-based situation urgency together with deceleration behaviour on the collision outcomes. Results of the logistic regression are shown in Table 3. For model A, all predictors have statistically significant effects on rear-end collision avoidance outcome. However, in model B, the effect of am is not significant with p = 0.32. Generally, model B provides a better model fitting with looming signal and distance collected at maximum braking. Figure 6 shows τ B 1 and τ M 1 in non-crash and crash groups, respectively. The mean τ B 1 for crashes is larger than that in the non-crash groups (0.48 vs. 0.23), but the difference between the two groups is not very large. As the lead vehicle draws nearer, the difference becomes larger and larger (1.04 vs. 0.30). For the 19 rear-end crashes, 12 crashes occurred with τ M 1 larger than 1 s−1. It seems that if the situation at maximum braking is already very urgent (quite large τ M 1 ), no matter how hard one brakes, the collision can be inevitable.

4. Conclusions

The goal of this study was to investigate the effect of situation urgency on drivers’ rear-end collision deceleration avoidance behaviour. Visual looming-based metrics τ−1, driving speed, and headway distance were adopted in this paper to quantify situation urgency. In this paper, it was found that drivers’ deceleration behaviour was highly kinematics-dependent. Both deceleration ramp-up and drivers’ maximum deceleration rate increase significantly as the looming traces increase faster. On one hand, the results in this study verified the results generated in the paper of Markkula et al. [13], and it provided powerful evidence of visual control theory of braking [37]. On the other hand, by predicting drivers’ brake jerk, maximum deceleration rate, and collision outcomes, the paper may provide some insights on FCW design. As the timing of most FCW systems was decided by headway distance or TTC values, an FCW design mainly based on visual looming, driving speed, and distance information can be developed to see whether it provides a better warning effect compared with traditional ones. Additionally, some in-vehicle protected measures can be triggered in advance if the looming is quite strong at maximum braking to prevent possible injury by the potential collision. However, although the effect of situation urgency on drivers’ deceleration behaviour can be unaffected by the choice of visual looming measures, the comparison between different visual looming metrics can be conducted to investigate which kind of visual measures can be closer to drivers’ uses.

Author Contributions

The work presented in this paper was carried out in collaboration between all authors. Q.X. and X.O. conceived the research theme, implemented the data analysis, and prepared the manuscript. W.G. gave technical support and conceptual advice. Q.X. and Y.Z. performed the experiments and gathered the behavioural data. All authors discussed the study results, contributed to the paper development, and approved the final version. All authors have read and agreed to the published version of the manuscript.

Funding

This research was supported by NCUT Start-up Fund, Natural Science Foundation of China (72171017) and Open Fund of Engineering Research Center of Catastrophic Prophylaxis and Treatment of Road & Traffic Safety of Ministry of Education (Changsha University of Science & Technology).

Institutional Review Board Statement

Not applicable.

Informed Consent Statement

Informed consents were obtained from all subjects involved in the study.

Data Availability Statement

Data, models, or codes that support the findings of this study are available from the corre-sponding author upon reasonable request.

Conflicts of Interest

The authors declare no conflict of interest.

References

  1. World Health Organization. Global Status Report on Road Safety: Supporting a Decade of Action; World Health Organization: Geneva, Switzerland, 2013. [Google Scholar]
  2. Kusano, K.D.; Gabler, H.C. Pre-crash scenarios for determining target populations of active safety systems. In Proceedings of the 23rd International Technical Conference on the Enhanced Safety of Vehicles (ESV), Seoul, Republic of Korea, 27–30 May 2013. [Google Scholar]
  3. Montgomery, J.; Kusano, K.D.; Gabler, H.C. Age and gender difference in time to collision braking from the 100-car naturalistic driving study. Traffic Inj. Prev 2014, 15, S15–S20. [Google Scholar] [CrossRef]
  4. Barrett, G.V.; Kobayashi, M.; Fox, B.H. Feasibility of studying driver reaction to sudden pedestrian emergencies in an automobile simulator. Hum. Factors 1968, 10, 19–26. [Google Scholar] [CrossRef]
  5. McGehee, D.V.; Mazzae, E.N.; Baldwin, G.H.S.; Grant, P.; Simmons, C.J.; Hankey, J.; Forkenbrock, G. Examination of Drivers’ Collision Avoidance Behavior Using Conventional and Antilock Brake Systems on the IOWA Driving Simulator; Technical Report; University of Iowa: Iowa City, IA, USA, 1999. [Google Scholar]
  6. Lee, J.D.; McGehee, D.V.; Brown, T.; Reyes, M.L. Collision warning, driver distraction, and driver response to rear-end collisions in a high-fidelity driving simulator. Hum. Factors 2002, 44, 314–334. [Google Scholar] [CrossRef] [Green Version]
  7. Muttart, J.W. Development and Evaluation of Driver Response Time Predictors Based upon Meta-Analysis; Technical Paper 2003-01-0885; SAE International: Warrendale, PA, USA, 2003. [Google Scholar]
  8. Muttart, J.W. Quantifying driver response times based upon research and real life data. In Proceedings of the Third International Driving Symposium on Human Factors in Driver Assessment, Training and Vehicle Design, Rockport, ME, USA, 27–30 June 2005. [Google Scholar]
  9. Fischer, M.; Barkley, R.A.; Smallish, L.; Fletcher, K. Hyperactive children as young adults: Driving abilities, safe driving behavior, and adverse driving outcomes. Accid. Anal. Prev. 2007, 39, 94–105. [Google Scholar] [CrossRef]
  10. Li, X.; Yan, X.; Wu, J.; Radwan, E.; Zhang, Y. A rear-end collision risk assessment model based on drivers’ collision avoidance process under influences of cell phone use and gender—A driving simulator based study. Accid. Anal. Prev. 2016, 97, 1–18. [Google Scholar] [CrossRef] [Green Version]
  11. Wang, X.; Zhu, M.; Chen, M.; Tremont, P. Drivers’ rear end collision avoidance behaviors under different levels of situational urgency. Transp. Res. Part C 2016, 71, 419–433. [Google Scholar] [CrossRef] [Green Version]
  12. Fambro, D.B.; Koppa, R.J.; Picha, D.L.; Fitzpatrick, K. Driver braking performance in stopping sight distance situations. Transp. Res. Rec. 2000, 1701, 9–16. [Google Scholar] [CrossRef]
  13. Markkula, G.; Engström, J.; Lodin, J.; Bargman, J.; Victor, T. A farewell to brake reaction times? Kinematics dependent brake response in naturalistic rear-end emergencies. Accid. Anal. Prev. 2016, 95, 209–226. [Google Scholar] [CrossRef]
  14. Kusano, K.; Chen, R.; Gabler, H. Effect of driving context on time to collision at brake application during car following. In Proceedings of the FAST-Zero’15: 3rd International Symposium on Future Active Safety Technology toward Zero Traffic Accidents, Gothenburg, Sweden, 9–11 September 2015. [Google Scholar]
  15. Kusano, K.D.; Chen, R.; Montgomery, J.; Gabler, H.C. Population distributions of time to collision at brake application during car following from naturalistic driving data. J. Saf. Res. 2015, 54, 95.e29–104. [Google Scholar] [CrossRef]
  16. Hang, J.; Yan, X.; Li, X.; Duan, K.; Yang, J.; Xue, Q. An improved automated braking system for rear-end collisions: A study based on a driving simulator experiment. J. Saf. Res. 2022, 80, 416–427. [Google Scholar] [CrossRef]
  17. Lee, D.N. A theory of visual control of braking based on information about time-to-collision. Perception 1976, 5, 437–459. [Google Scholar] [CrossRef]
  18. Hassenstein, B.; Hustert, R. Hiding responses of locusts to approaching objects. J. Exp. Biol. 1999, 202, 1701–1710. [Google Scholar] [CrossRef]
  19. Franconeri, S.L.; Simons, D.J. Moving and looming stimuli capture attention. Percept. Psychophys. 2003, 65, 999–1010. [Google Scholar] [CrossRef] [Green Version]
  20. Kondoh, T.; Yamamura, T.; Kitazaki, S.; Kuge, N.; Boer, E.R. Identification of visual cues and quantification of drivers’ perception of proximity risk to the lead vehicle in car-Following situations. J. Mech. Syst. Transp. Logist. 2008, 1, 170–180. [Google Scholar] [CrossRef] [Green Version]
  21. Jurecki, R.S.; Stanczyk, T.L. Driver model for the analysis of pre-accident situations. Veh. Syst. Dyn. 2009, 47, 589–612. [Google Scholar] [CrossRef]
  22. Jurecki, R.S.; Stanczyk, T.L. Driver reaction time to lateral entering pedestrian in a simulated crash traffic situation. Transp. Res. Part F 2014, 27, 22–36. [Google Scholar] [CrossRef]
  23. Lamble, D.; Kauranen, T.; Laakso, M.; Summala, H. Cognitive load and detection thresholds in car following situations: Safety implications for using mobile (cellular) telephones while driving. Accid. Anal. Prev. 1999, 31, 617–623. [Google Scholar] [CrossRef]
  24. Maddox, M.E.; Kiefer, A. Looming threshold limits and their use in forensic practice. Proc. Hum. Factors Ergon. Soc. Annu. Meet. 2012, 56, 700–704. [Google Scholar] [CrossRef]
  25. Kiefer, R.J.; Cassar, M.T.; Flannagan, C.A.; LeBlanc, D.J.; Palmer, M.D.; Deering, R.K.; Shulman, M.A. Forward Collision Warning Requirements Project Final Report–Task 1; US Department of Transportation: Washington, DC, USA, 2003.
  26. Kiefer, R.J.; LeBlanc, D.J.; Flannagan, C.A. Developing an inverse time-to-collision crash alert timing approach based on drivers’ last-second braking and steering judgments. Accid. Anal. Prev. 2005, 37, 295–303. [Google Scholar] [CrossRef]
  27. Fajen, B.R. Calibration, information and control strategies for braking to avoid a collision. J. Exp. Psychol. Hum. Percept. Perform. 2005, 3, 480–501. [Google Scholar] [CrossRef]
  28. Fajen, B.R. Perceptual learning and the visual control of braking. Percept. Psychophys. 2008, 70, 1117–1129. [Google Scholar] [CrossRef] [Green Version]
  29. Treiber, M.; Kesting, A. Chapter 11: Car-Following models based on driving strategies. In Traffic Flow Dynamics, 1st ed.; Springer: Berlin, Germany, 2013; pp. 181–204. [Google Scholar]
  30. Xue, Q.; Yan, X.; Zhao, Y.; Zhang, Y. The role of situation criticality in affecting the effect of cognitive load on drivers’ brake responses: A driving simulator based study. J. Adv. Transp. 2020, 2020, 8886541. [Google Scholar] [CrossRef]
  31. Xue, Q.; Markkular, G.; Yan, X.; Merat, N. Using perceptual cues for brake response to a lead vehicle: Comparing threshold and accumulator models of visual looming. Accid. Anal. Prev. 2018, 118, 114–124. [Google Scholar] [CrossRef]
  32. Tso, G.K.F.; Guan, J. A multilevel regression approach to understand effects of environment indicators and household features on residential energy consumption. Energy 2014, 66, 722–731. [Google Scholar] [CrossRef]
  33. Markkula, G. Modeling driver control behavior in both routine and near-accident driving. Proc. Hum. Factors Ergon. Soc. Annu. Meet. 2014, 58, 879–883. [Google Scholar] [CrossRef] [Green Version]
  34. Hogema, J.H. Modelling of individual car following behavior. In XV European Annual Conference on Human Decision Making and Manual Control; TNO: The Hague, The Netherlands, 1996. [Google Scholar]
  35. Brackstone, M.; Sultan, B.; McDonald, M. Motorway driver behaviour: Studies on car following. Transp. Res. Part F 2002, 5, 31–46. [Google Scholar] [CrossRef]
  36. Duan, J.Y.; Li, Z.Z.; Salvendy, G. Automatic imitation of risky behavior: A study of simulated driving in China. Traffic Inj. Prev. 2012, 13, 442–449. [Google Scholar] [CrossRef]
  37. Engström, J.; Markkula, G.; Xue, Q.; Merat, N. Simulating the effect of cognitive load on braking responses in lead vehicle braking scenarios. IET Intell. Transp. Syst. 2018, 12, 427–433. [Google Scholar] [CrossRef]
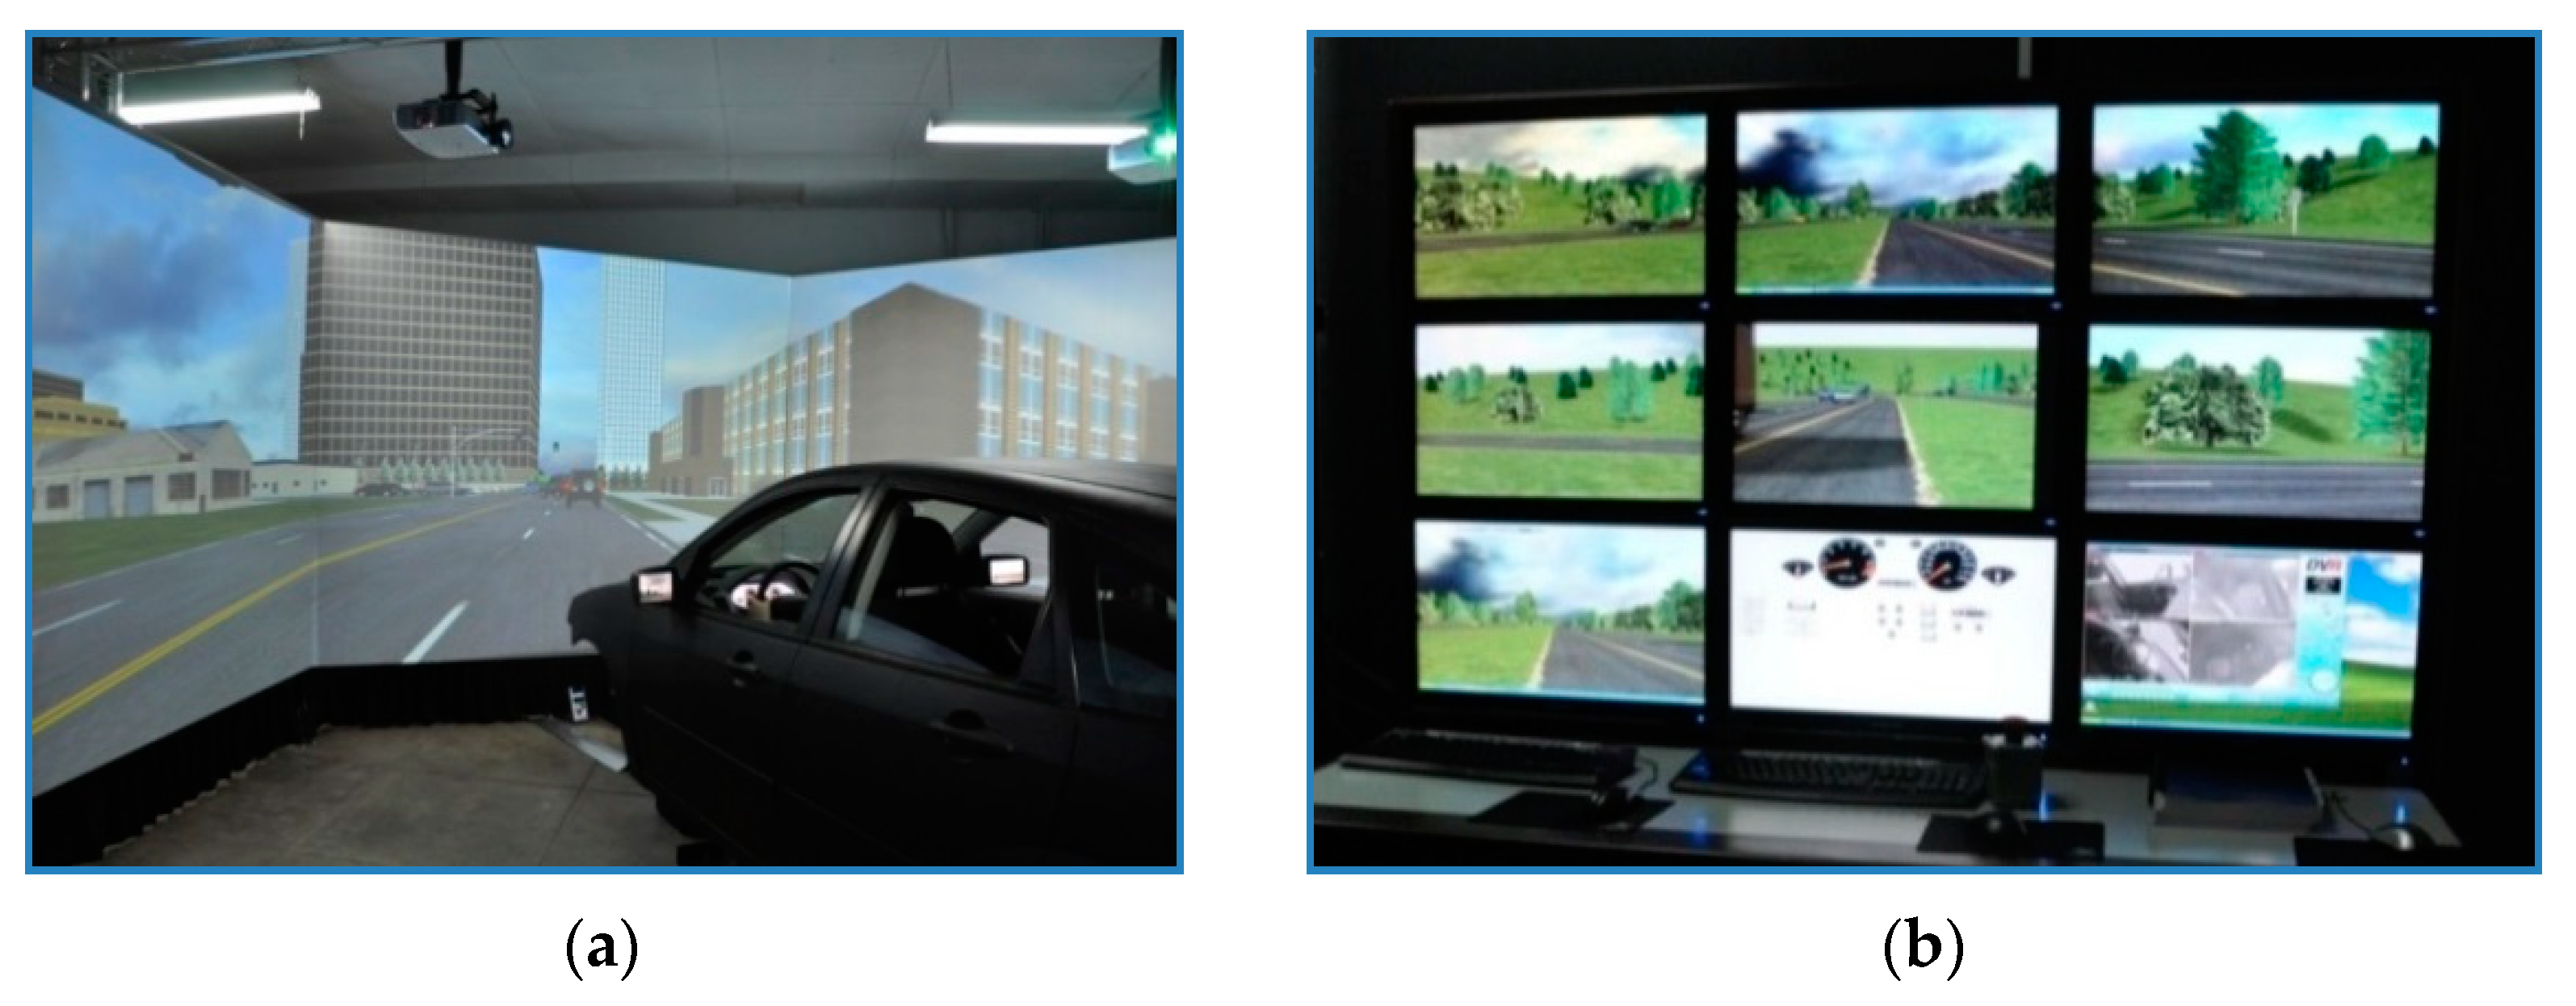
Figure 1. Illustration of the driving simulator system. (a) BJTU driving simulator; (b) operation system.
Sustainability 14 15103 g001
Figure 2. Lead vehicle’s speed and deceleration rate in three drives (dashed vertical lines show start and end points of the lead vehicle’s deceleration). (a) Initial driving speed of 60 km/h; (b) Initial driving speed of 40 km/h; (c) Initial driving speed of 20 km/h.
Sustainability 14 15103 g002
Figure 3. Brake jerk as a function of τ−1 at the time when participants in the simulator started braking.
Sustainability 14 15103 g003
Figure 4. Maximum deceleration rate as a function of τ−1 at the time when participants in the simulator started braking.
Sustainability 14 15103 g004
Figure 5. Predicted brake jerk and maximum deceleration rate (for maximum deceleration prediction, the upper panel is results of model A and the lower panel is results of model B) under three speed conditions.
Sustainability 14 15103 g005
Figure 6. τ−1 at the time when participants in the simulator started braking and reached maximum deceleration under non-crash and crash conditions (whiskers indicate the variance of τ−1 on 95% CI; for non-crash conditions, the whiskers are too short to be seen). (a) τ B 1 in non-crash and crash groups; (b) τ M 1 in non-crash and crash groups.
Sustainability 14 15103 g006
Table 1. Definitions of the variables in Equations (1)–(3).
NotationsDefinitions
Vehicle stateWthe width of the lead vehicle
dthe distance from driver’s eyes to the tail of the lead vehicle
v r e l the relative speed of the two vehicles
Optical variables τ B 1 τ 1 collected when drivers in the simulator started braking
τ M 1 τ 1 collected when drivers in the simulator reached their maximum deceleration rate
Table 2. Mixed-model results of brake jerk jB and maximum deceleration rate am, with all p < 0.01.
ObservationsMixed Model
Estimate (95% CI)T TestR2
brake jerk jBN = 323intercept3.34 [2.43 4.25]7.120.65
τ B 1 7.02 [5.58 8.45]9.61
DB−0.08 [−0.11 −0.05]−5.14
Vf0.08 [0.02 0.13]2.82
σ α 1.24 [0.95 1.60]--
σ ϵ 1.58 [1.45 1.72]--
maximum deceleration rate ammodel A
N = 323
intercept1.52 [0.76 2.28]3.950.48
τ B 1 3.82 [2.51 5.13]5.75
jB0.34 [0.26 0.42]8.68
DB−0.03 [−0.05 −0.00]−2.16
Vf0.14 [0.09 0.18]6.09
σ α 0 [--]--
σ ϵ 1.41 [1.31 1.53]--
model B
N = 323
intercept1.90 [1.29 2.51]6.140.73
τ M 1 3.41 [2.85 3.97]12.00
jB0.28 [0.22 0.35]9.06
DM−0.06 [−0.08 −0.04]−4.99
Vf0.14 [0.11 0.18]8.45
σ α 0.67 [0.49 0.92]--
σ ϵ 1.04 [0.95 1.13]--
Table 3. Logistic regression analysis results.
EstimateS.E.T TestR2
model Aintercept−10.923.80−2.87 20.62
τ B 1 27.407.733.55 2
jB−2.410.64−3.79 2
DB−0.220.08−2.71 2
am0.880.332.66 2
Vf0.540.212.63 2
model Bintercept−9.405.67−1.690.81
jB−1.310.50−2.62 2
am0.540.540.99
τ M 1 14.485.122.83 2
DM−0.680.30−2.24 1
Vf0.430.212.06 1
1 p < 0.05. 2 p < 0.01.
Publisher’s Note: MDPI stays neutral with regard to jurisdictional claims in published maps and institutional affiliations.