Article

Drought-Induced Nitrogen and Phosphorus Carryover Nutrients in Corn/Soybean Rotations in the Upper Mississippi River Basin

1
Texas A&M AgriLife Research, Blackland Research and Extension Center, Temple, TX 76502, USA
2
USDA NRCS Resource Inventory and Assessment Division, Blackland Research Center, Temple, TX 76502, USA
3
USDA Agricultural Research Service, Grassland Soil and Water Research Laboratory, Temple, TX 76502, USA
*
Author to whom correspondence should be addressed.
Sustainability 2022, 14(22), 15108; https://doi.org/10.3390/su142215108
Submission received: 4 October 2022 / Revised: 7 November 2022 / Accepted: 8 November 2022 / Published: 15 November 2022
(This article belongs to the Special Issue Soil Fertility and Plant Nutrition in Sustainable Crop Production)

Abstract

:
Droughts reduce crop yields, which translates to reduced nutrient uptake or removal from the soil. Under such conditions, residual plant nutrients such as nitrogen (N) and phosphorus (P) can be carried over for subsequent crops. We applied the Agricultural Policy Environmental eXtender (APEX) model to simulate continuous corn (Zea mays L.)/soybean (Glycine max [L.] Merr.) rotations on 3703 farm fields within the Upper Mississippi River Basin (UMRB) over a 47-year timescale: 1960 to 2006. We used the Standardized Precipitation Index (PSI) to identify the drought years between 1960 to 2006, following which we evaluated potential drought-induced carryover N and P nutrients in corn/soybean rotations relative to near normal and very to extremely wet years. Overall, drought reduced N uptake, total N losses, N mineralization and N fixation, the main driver of the soybean carryover N. Given the high cost of fertilizers and concerns over nutrient loss impacts on offsite water quality, farmers are compelled to account for every plant nutrient that is already in the soil. Information from this study could be applied to develop optimal N and P recommendations after droughts, while identification of region-wide potential reductions in N and P applications has implications for conservation efforts aimed at minimizing environmental loading and associated water quality concerns.

1. Introduction

Droughts have been categorized into four types: agricultural, meteorological, hydrological, and socioeconomic [1]. This study focuses on agricultural drought which, according to the US National Drought Mitigation Center (NDMC), occurs when an area or region has a protracted period of inadequate and often poorly distributed rainfall resulting in extensive damage to agriculture [2]. Droughts can last for days, weeks, months, or years. Large-scale agricultural droughts pose many management challenges and uncertainties not only to farmers, but also policy makers, business managers, and the general public [3]. Because it is difficult to know exactly when a drought will begin and end, or how severe and intense it will be, it is almost impossible to predict or quantify its impact on crop yields. There are many challenges faced by farmers after a drought, paramount among them is nitrogen (N) and phosphorus (P) nutrient management for the subsequent crop.
Drought affects plant growth and consequently reduces crop yields, or in extreme cases there is no yield at all, which translates to reduced nutrient uptake or removal from the soil. Water-driven leaching and runoff nutrient losses are also diminished in a drought [4,5]. Under such conditions, it may be possible for a farmer to consider the residual nutrients (N and P) in the soil as a credit towards the subsequent crop. In the case of N, the size of the carryover N, regardless of whether N is derived from applied chemical, organic/manure fertilizers or soybean N fixation, will depend on many factors, such as N uptake by the crop, N immobilization and mineralization, and edge-of-the field N losses. Environmental conditions, including the amount and distribution of winter and spring precipitation, will also impact the magnitude of the carryover N [6,7]. In the Midwest, precipitation in early spring or summer is associated with higher losses of nitrate in tile drainage [7,8]. Phosphorus tends to be less mobile than N; therefore, the carryover P is largely driven by the harvested yield, although P levels may also be impacted by rainfall between the end of the drought year’s harvest and the following year’s planting, which may lead to P losses via soil erosion, and to a lesser extent, leaching. According to the Potash & Phosphate Institute [9], only 10 to 30 percent of the applied P is utilized by the crop in the first season of application. Some P will be utilized in subsequent years, but in progressively lesser amounts; the remaining P will be lost via erosion and leaching or will remain bound to particulate in the soil or subsoil.
After a drought, many farmers are faced with tough N and P management decisions, in particular, estimating how much of the N and P applied in the previous year may be available to the subsequent crop, and how to accordingly adjust their N and P fertilizer rates. Biological N fixation (BNF) in soybean has been widely cited as a key contributor to the carryover N. Under normal growing seasons, most of the fixed N is removed from the soil in the harvested soybeans. According to Córdova et al. [10], the N exported via seed is greater than the N imported via BNF. The average soybean harvest N removal is 155 kg N ha−1, at an average yield level of 2.7 Mg ha−1 [11]. Some N is, however, returned to the soil through exudates and rhizodeposition, and when the soybean residues, roots and nodules die and decompose. The total N benefit has been estimated to range from 45 to 67 kg N ha−1 [10,12,13,14,15]. This N benefit contributes to most of the N credit generally used in N fertilizer recommendations for the subsequent corn crop.
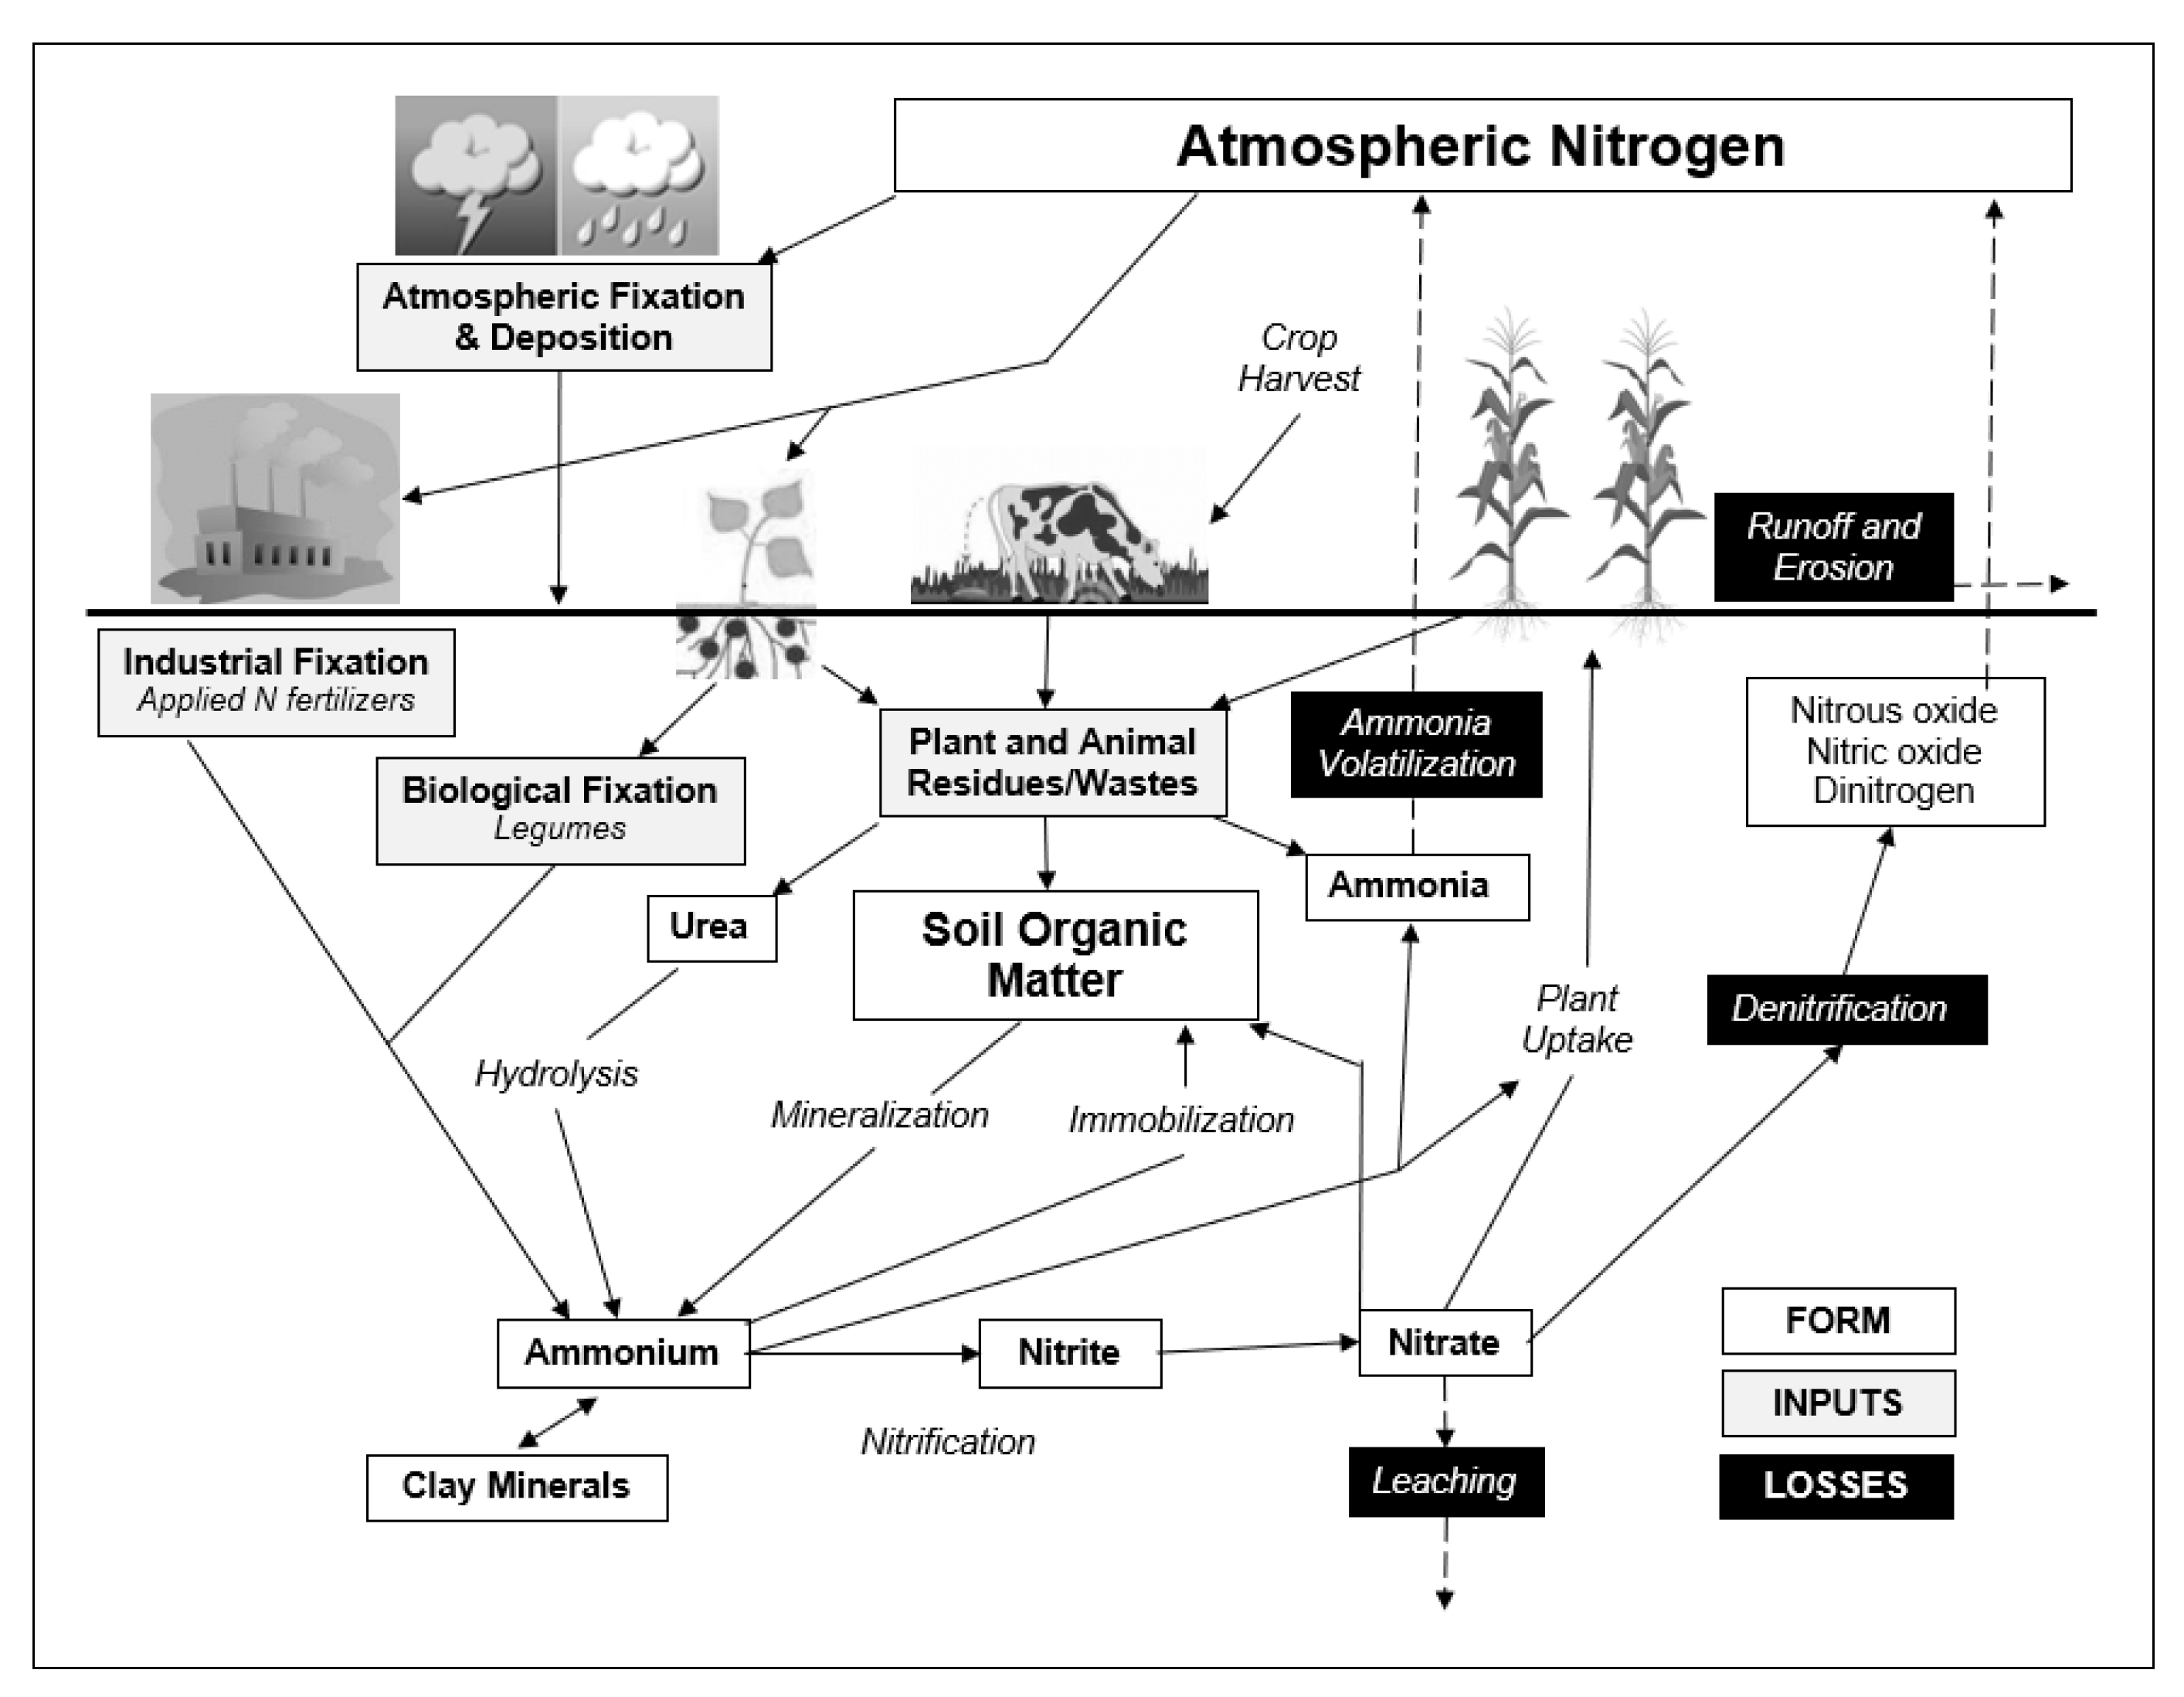
Overall, multiple site-specific factors that include management practices, land type, topography, soil texture–hydrologic group interactions, and local climate/weather conditions interact to determine the magnitude of the carryover N and P. Minimum tillage reduces residue oxidation, but wetter conditions could also trigger N losses through denitrification, volatilization, and leaching. In wet conditions, pests and diseases thrive, which may result in reduced plant growth and nutrient uptake. On the other hand, dry soil conditions reduce nitrous oxide-N losses [16]. Planting cover crops can biologically immobilize nitrate until the next cropping season. While high soil temperatures (>30 °C) can decrease soybean nodule initiation and growth in tropical and subtropical areas [17], high temperatures exceeding 30 °C rarely occur in the Upper Mississippi River Basin (UMRB). High residual soil nitrate carryover N did not have any adverse effects on soybean yields [18], but reduced N fixation [19].
At the farm level, large-scale agricultural droughts pose many management challenges and uncertainties to farmers. Currently, there are only a few impact analyses on the effects of drought on N and P dynamics and associated potential carryover to the next season, which were spurred on by the December 2011 drought [20,21]. According to the IPNI [22], soil testing and plant nutrient analysis are the best tools for assessing the magnitude of carryover N and P nutrients for determining appropriate adjustment of N and P fertilizer rates for the next crop.
The primary objective of this study was to estimate at the regional level, drought-induced carryover N and P nutrients in corn/soybean rotations across the UMRB. Predicting exactly when a drought will occur is currently almost impossible. Our research strategy was to apply the Standardized Precipitation Index (SPI) [23] to identify drought events (years) over a 47-year time series for the period 1960 to 2006, following which we computed drought-induced N and P carryover nutrients from an APEX (Agricultural Policy Environmental eXtender) model [24] simulated Conservation Effects Assessment Project (CEAP) baseline output database [25] of 3703 farm fields within the UMRB. Biophysical models like APEX, driven by daily climatic variables enable assessment of cropping systems management options over time and across large landscapes (watershed-, regional-, and national-scale), especially where on-the-ground assessments are not feasible.

2. Materials and Methods

A description of the UMRB, the APEX model simulations, the SPI, and the applied methodology are given below. Detailed information on the APEX model, calibration, validation, application, and demonstrated capability to effectively simulate various cropping systems is well documented in [26,27,28] and hence will not be discussed in this paper.

2.1. Study Area

The UMRB includes large parts of Illinois, Iowa, Minnesota, Missouri, and Wisconsin, and small areas in Indiana, Michigan, and South Dakota (Figure 1 and Figure 2). In total, the land area is some 492,100 square kilometers, about half of which is used for crop production. More than 90% of the cropland is planted annually in a corn/soybean rotation [29]. Average annual minimum and maximum temperatures range from 5 °C to 13 °C, while average total yearly precipitation ranges from 511 to 1071 mm.
According to the USDA NRCS [25] approximately 20% of the UMRB is classified as Highly Erodible Land (HEL), land that is inherently very susceptible to erosion, including soils with a natural erosion potential of at least eight times the NRCS-defined soil loss tolerance level or T value. For a specific soil, the T value is the maximum amount of soil loss in Mg ha−1 y−1 that can be tolerated and still permit a high level of crop productivity to be sustained economically and indefinitely. The T values range from 2.24 to 11.21 Mg ha−1 y−1 for soils that can sustain more erosion without losing significant productive potential [30]. The cropland in the UMRB includes soils of 18 different soil textural classes which belong to four hydrologic groups: A, B, C, and D. Soil hydrologic groups basically define soil characteristics that affect their runoff potentials. To facilitate easy analytical handling, the soils were grouped into three main textural classes; clayey, loamy, and sandy. Silty loams, predominately classified as loamy, cover almost 50% of the basin.

2.2. The APEX Baseline Model Simulations

The baseline simulations for the UMRB were developed based on actual farmer reported management practices on 3703 UMRB farm fields gathered in the 2003 to 2006 CEAP National Cropland Assessment Survey [25], hence the baseline simulations account for actual cropping patterns, farming activities, and conservation practices applied by farmers in the UMRB during that period. Each farm field is associated with a National Resources Inventory (NRI) sample point, which has a statistical acreage weight so that the sum of the weights of all sample points is equal to the total cropland acreage in the region. The NRI sample points have information that describes specific farms that includes the land type (HEL or non-HEL), soil types, conservation practices, and information on farming practices.
To set up the baseline simulations, the NRI sample points were linked to the NRCS Soil Survey Geographic (SSURGO) databases, spatial daily weather data from 122 National Oceanic and Atmospheric Administration (NOAA) weather stations (Figure 2), APEX model crop parameters used for the CEAP analysis of the UMRB, and actual farmer practices gathered in the 2003–2006 NRI-CEAP National Crop Survey [25]. The CEAP survey collected three years of management data at each NRI sample point. These management data were applied to each point, with management repeating on three-year intervals for the duration of the model simulation. The three-year management scenarios in this study represented corn/soybean rotations based on the farmer survey. The use of these baseline management scenarios was an improvement on previous CEAP APEX modeling work by allowing for a more realistic simulation of actual farmer’s conditions and management practices. Each NRI sample point was simulated over a 47-year timescale: 1960 to 2006, using actual weather. The mean, minimum and maximum to the mean annual precipitation across the UMRB are shown in Figure 3a. The average annual precipitation across the basin was about 850 mm. Interannual variability in precipitation is highly pronounced.

2.3. Accounting for N and P Carryover Nutrients in the APEX Model

APEX is suitable for this study because of its proven capability to dynamically simulate N and P cycling and losses in the soil in respect to crop management [26,27,28]. The model uses a process-based mass balance approach to integrate various components of the N and P cycles [24]. For N, the main mass balance processes are made up of inputs that include: atmospheric N deposition (Nat), inorganic N fertilizers (Nif), N from mineralized organic matter (Nom) (including additions from animal manures) and biological N fixation (Nbf), while outputs are due to: N plant uptake and crop harvest (Nuh), losses in runoff (Nru), sediment (water and wind erosion) (Nse), leaching (Nle), sub-surface flow (Nss), and gaseous losses through denitrification (Ndn) and volatilization (Nvl) (Figure 4).
Phosphorus inputs and outputs are similar to those of N, but unlike N, atmospheric P inputs (dust) are very minimal, and gaseous losses (phosphine) are not accounted for as they are rare or occur in only specialized, local conditions [31]. Overall, the P cycle occurs at a much slower pace compared to the N cycle. Phosphorus inputs include inorganic P fertilizers (Pif), P from mineralized organic matter (Pom) (including additions from animal manures), while outputs are due to: P plant uptake and crop harvest (Puh), losses in runoff (Pru), sediment (water and wind erosion) (Pse), leaching (Ple), and sub-surface flow (Pss).
Algorithms used to compute the N and P mass balance components are described in detail in [32]. For the purposes of this study, carryover N and P are computed as residual N and P remaining after accounting for inputs and outputs (Equations (1) and (2)). Losses of N and P through sub-surface flow were negligible and hence were not included in the carryover N and P calculations.
Ncarryover = NInputs (Nif + Nom + Nbf) − NOutputs (Nuh + Nse + Nru + Nle + Nvl + Ndn)
Pcarryover = PInputs (Pif + Pom) − POutputs (Puh + Pru + Pse + Ple)
While N and P immobilization ties up N and P, temporarily making them unavailable to plants, we did not count this process as an output since immobilized N and P are eventually released to plants through mineralization. The mass nutrient balance methodology is widely used by the Food and Agriculture Organization (FAO) to assess soil nutrient stocks at region and country levels across the world. The mass nutrient balance methodology has also been used in agricultural systems to evaluate nutrient management, understand nutrient sources and sinks, nutrient availability to crops, and nutrient use efficiency [15,33]. According to Roy et al. [34], and of further relevance here, nutrient balance methodologies are emerging as reliable tools for devising time-scale soil fertility interventions based on a sound policy framework.

2.4. The Standardized Precipitation Index

The uncertainty of when a drought will occur, its severity, intensity, and duration, prompted the development of drought indices since the 20th century primarily for classifying and monitoring droughts [35]. Among the many indices that were developed (see [36,37,38]), we applied the Standardized Precipitation Index (SPI) [23] to identify drought events (years) across the UMRB from 1960 to 2006. The SPI is a powerful and flexible index that is simple to calculate [23,39] and was designed to quantify the precipitation deficit of a location or region for multiple timescales [38]. The SPI is used by researchers, drought planners, and national meteorological, and hydrological services in over 70 countries to provide early warning of drought and help assess drought severity [38,40]. In the USA, the National Climatic Data Center (NCDC, NOAA) routinely applies the index to quantify, assess and report on agricultural drought (Figure 5). The SPI captures the severity of droughts, from near normal years, to severe to extremely dry years, and very wet to extremely wet years. Despite the fact that the SPI is based on precipitation only and does not consider the impacts of temperature during drought conditions, the index has proven very effective in drought severity assessments and in providing early warning of drought in several countries [38,40].
From Figure 5, it is apparent and important to note that the SPI is relative to the location, as impacted by location-specific factors of the prevailing weather. For example, the moderately dry category in Nebraska is not the same as in Iowa when discussing the capacity to produce a corn crop. The shortfall in rain and designation of moderately dry in Nebraska is different than Iowa because the base level of precipitation is different between the two. So, the shortfall may result in both being categorized as moderately dry but that shortfall in Nebraska may severely limit the ability to produce a corn crop while in Iowa it is still possible because of starting out with a higher average.
The SPI program and User Guide are free of charge and can be downloaded from the US National Drought Mitigation Center website (http://drought.unl.edu/MonitoringTools/DownloadableSPIProgram.aspx (accessed on 5 August 2021)). Monthly precipitation of at least 20–30 years is required [41,42]. Details on the mathematical computations of the SPI can be obtained from [2,38]. In summary, long-term monthly precipitation data is fitted to a probability distribution, which is then transformed into a normal distribution [42,43]. Because the SPI is normalized, the index captures both dry and wet events in the same computation [40]. SPI values are standard deviations from the median precipitation. The classification system linking SPI values to drought intensities is shown in Table 1. Positive SPI values indicate above normal (median) precipitation, and negative values indicate below normal precipitation. Drought starts when the SPI value is equal or below −1.0 and ends when the value becomes positive [38]. The positive sum of the SPI for all months within a drought event are the drought’s “magnitude” [40,44].
To identify the drought, normal, and wet years across the UMRB, monthly precipitation data for the 122 NOAA weather stations for the 47-year timescale, from 1960 to 2006, was aggregated to represent the whole of the UMRB as shown in Figure 3a. The aggregated monthly precipitation data was used to generate SPIs for the UMRB (Figure 3b). A preliminary evaluation of the monthly timescales: 3-, 6-, 9- and 12-month showed the 9-month timescale worked best at identifying drought events across the UMRB, when compared to actual measured average precipitation (Figure 3a) and reported UMRB drought events in the literature (https://www.ncdc.noaa.gov/ (accessed on 15 October 2021)). SPI values below −1.5 for the 9-month timescale are usually a good indication that dryness is having a significant impact on agriculture and may be affecting other sectors as well [37]. The 9-month SPI provides an indication of inter-seasonal precipitation patterns over medium timescale duration. It is important, though, to note that droughts usually take a season or more to develop. For purposes of this study, we applied SPI values < −1.5, −0.99 to 0.99, and >1.5 to respectively identify the severe to extreme dry, near-normal, and very wet to extremely wet years within a 9-month timescale.
APEX-simulated UMRB baseline output data for the years with SPI values below −1.5, −0.99 to 0.99, and above 1.5 were extracted and analyzed for the effects of severe to extreme dry, near-normal, and very to extremely wet events (years) on potential carryover N and P, and various N and P cycle mass balance components that contribute to the magnitude of the carryover N and P. In addition, the impacts of site-specific factors that included land type, soil texture, and hydrologic soil group were also evaluated. It is, however, important to note that many environmental conditions, especially the amount and distribution of winter and spring precipitation, affect how much residual N and P is eventually carried over for the succeeding crop.

3. Statistical Analysis

A one-way analysis of variance (ANOVA) was performed with SAS version 9.3 [45] to compare the potential N and P carryover nutrients across the three categories of drought. Descriptive statistics: mean and confidence limits (p ≤ 0.05) were performed on the simulated variables for each of the three SPI identified drought conditions, which were severe to extreme dry, near-normal, and very wet to extremely wet years over the 47-year timescale and reported as mean annual values. The REG procedure in SAS was used to conduct regression analyses to describe the linear trend and interannual variability of actual measured corn and soybean yields as impacted by precipitation during the study period of 1960 to 2006 (Data source: USDA NASS [46]).
Due to programing and weather data acquisition logistics during the initial UMRB baseline simulation, we could not include the December 2011 drought year into this evaluation.

4. Results and Discussion

4.1. Identification of Severe to Extremely Dry, near Normal, and Very to Extremely Wet Years

The computed 9-month timescale SPI values and the actual measured average precipitation of the UMRB are shown in Figure 3. The dashed lines in Figure 3b show the—1.5 and 1.5 SPIs. As stated earlier, an SPI > 1.5 represents very wet to extremely wet years, and an SPI < −1.5 implies the years were severe to extremely dry, while SPIs between—0.99 and 0.99 represent near normal growing season conditions. There was a good agreement between the SPI and the actual measured average precipitation (Figure 3a) and reported UMRB drought events in the literature (https://www.ncdc.noaa.gov/ (accessed on 15 October 2021)). The dry and wet years identified by the SPI corresponded closely to the years of actually measured low and high precipitation, respectively. Between 1960 and 2006, we identified five years as being severe to extremely dry: 1963, 1964, 1976, 1988, and 1989. Five years were identified as being very wet to extremely wet: 1965, 1973, 1982, 1990, and 1993, while 22 years were classified as having near normal growing season conditions. We selected five years out of the 22 near normal seasons: 1975, 1978, 1979, 1996 and 2000 which had their mean precipitation closest to the overall mean: 850 mm precipitation for the basin. The average precipitation during the severe to extremely dry years, near-normal years and very wet to extremely wet years ranged from 577 to 730 mm, 812 to 865 mm, and 1004 to 1116 mm, respectively. The driest and wettest years were 1976 (577 mm) and 1993 (1116 mm).

4.2. Corn and Soybean Yield Trends across the UMRB

The annual average precipitation over the study period (1960 to 2006) for the near normal, severe to extremely dry, and very wet to extremely wet years was 850, 663 and 1030 mm, respectively.
The seasonal crop water-use of corn and soybean ranges from 450 to 700 mm and 500 to 800 mm, respectively [47]. Although the annual average precipitation for the severe to extremely dry years is within the range of the seasonal crop water use of both corn and soybean, the temporal and spatial spread of the precipitation over the growing season and across the basin is a more important determinant of crop yield than is total precipitation.
There are huge variations in measured annual average corn and soybean yields over time (Figure 6). Corn and soybean yields increased linearly over time at rates of 110 and 20 kg ha−1 y−1, respectively. The linear trend is the best fit to historical corn and soybean yields, which in this study respectively accounted for 69% and 54% of the variation in annual average corn and soybean yields (Figure 6) [48,49]. Similar yield trends and variations have been reported in the literature [50,51]. Favorable weather and improved farming technologies that include improved hybrids/varieties, fertilization, irrigation and planting density optimization, pest resistance, planting of cover crops to trap residual soil moisture and nutrients, etc. can result in higher positive yield deviations from the trendline. On the other hand, since global climate change-induced droughts are becoming more of a reality [52,53,54], higher negative yield deviations should also be expected.
As expected, the deviations of actual measured corn and soybean yields from the fitted trendlines followed the mean annual precipitation pattern (Figure 3a). Near normal seasons had annual average corn and soybean yields of 8.04 and 2.59 Mg ha−1, respectively. Compared to the near normal seasons, the severe to extremely dry spells reduced corn and soybean yields by 27% and 20%, respectively. Just as drought reduces crop yields, too wet a season also negatively impacts crop growth and yield. Compared to the near normal season, the very wet to extremely wet conditions reduced corn and soybean yields by 9% and 6%, respectively.

4.3. Assessing APEX’s Capability to Simulate N and P Cycle Attributes Used to Evaluate Carryover N and P in Corn and Soybean

There is substantial variability in both simulated and data reported in the literature on the N and P cycle attributes, due to variability in soil conditions, weather, crop management, as well as potential interactions between these factors (Appendix A). Accounting for all N and P nutrient fluxes and obtaining a complete nutrient mass balance is extremely challenging due to the inherent complexity of the N and P cycles and the difficulty in directly measuring various fluxes, such as mineralization, denitrification, and volatilization [55,56,57].
Compared to results published in the literature, APEX estimates of N mineralization and total N losses for corn are much lower. Similarly, there is a significant difference between simulated soybean N uptake rates and reported literature values. We can only speculate that these differences could have been caused by differences between our APEX simulation data inputs compared to actual conditions. For instance, the soils input data were obtained from the USDA NRCS SSURGO database. Researchers often question what the soil characteristics numbers in the database actually represent, for instance, and at what point and after what type of management practice? Model outputs are a function of these values and could well be one of several reasons for the differences between simulated and literature values. All research based on running simulations that use soil databases for large areas must deal with this issue. This is clearly an area that needs more research and improvement. That said, our simulation results for N and P uptake, mineralization, losses and N fixation gave a reasonable representation of the N and P cycle attributes used to evaluate carryover N and P in corn/soybean rotations across the UMRB for the 47-year simulation period, 1960–2006.

4.4. Carryover N under Severe to Extremely Dry Years

APEX simulation results of the key N inputs that contribute to the carryover N under the three precipitation scenarios: severe to extremely dry, near normal, and very wet to extremely wet years are presented in Table 2 and summarized in Figure 7. Applied N fertilizer inputs for corn, BNF in soybean and crop residue mineralization make positive contributions to carryover N, while N losses and N uptake reduce the potential size of the carryover N. The carryover N and the key N inputs that contribute to the carryover N varied in response to the severity of the drought. For the most severe to extreme dry years, four out of the five years had a positive corn carryover N that ranged from 1 to 37 kg N ha−1. Similar observations were made in Minnesota where below normal seasonal precipitation resulted in increased soil nitrate levels in the fall season [6]. Although 1989 was classified as a drought year in our study, it had a negative N nutrient balance, a result of high N uptake and N losses with sediment and volatilization. The high N losses with sediment and volatilization were due to high intensity precipitations (but overall low volume) that triggered soil erosion and also conditions that are favorable for the volatilization.
Interestingly, among the severe to extremely dry years, 1989 had the second highest N uptake (195 kg N ha−1), and highest sediment loss (12 kg N ha−1). The high sediment losses could easily be explained by the fact that 1989 had the highest precipitation during the dry summer months of July, August, and September. The year 1989 had the third highest precipitation (668 mm) after the years 1964 (741 mm) and 1963 (677 mm). While N uptake in 1989 (195 kg N ha−1) was comparable to N uptake in 1963 (198 kg N ha−1), we cannot adequately explain why N uptake was lower in 1964 (175 kg N ha−1), but can only speculate the effects of interacting site-specific factors of seasonal rainfall patterns and possible differences in management practices such as planting dates, cropping sequences in rotations etc.
Soybean had a positive carryover N across all five drought years. Carryover N ranged from 10 to 43 kg N ha−1. The total soybean N benefit or ‘soybean rotation effect’, normally passed onto the corn crop in corn/soybean rotations, has been estimated at between 45 to 67 kg N ha−1 [10,12,13,14,15]. The carryover N is due to N fixation by the soybean, higher N mineralization of the low C:N soybean residues [15], and the reduced total soybean N losses when compared to corn losses. Due to the low C:N ratio, soybean residues decompose quicker, releasing N faster through mineralization, without soil microbes tying up inorganic N (immobilization) in the process. That said, the carryover N can be reduced under drought stress conditions due to poor nodulation and hence reduced N fixation by the stressed soybean plants [58,59]. When compared to the near normal years, drought reduced N fixation by approximately 15%. However, and to our initial surprise, the driest year among the severe to extremely dry years, 1976 (610 mm) had the highest fixed N (120 kg N ha−1), while 1988 which had a comparable precipitation (617 mm) had a 28% lower N fixation. The lower N fixation in 1988 can be explained by poor precipitation distribution during the growing season. There was low precipitation during the first half of the year which included the crop establishment period, only reaching a peak of 50 mm in May. The precipitation increased during the latter part of the season, peaking at 92 mm in August when the crop had almost reached maturity. While1976 had a slightly lower precipitation than 1988, its precipitation was higher, reaching 98 mm in April, and thereafter declining, but still providing adequate soil moisture during both the crop establishment (April to May) and active crop growth (May to August) periods.

4.5. Near Normal Years

Three out of five of the near normal precipitation years 1978, 1979, and 2000 had a negative corn carryover N as a result of higher N uptake and N losses due to sediment, leaching, and volatilization, while the opposite could be said of the two years 1975 and 1996 that had positive carryover N. Similar to the drought years, soybean had positive and on average, slightly higher carryover N across all the five near normal years. Although N fixation was comparably higher than in the dry years, N uptake and losses were also high. The year 1996 had the lowest precipitation among the near normal years (850 mm vs. 863 mm avg. precipitation). Not surprising, the N uptake by both corn and soybean was lowest in 1996. Besides other interacting factors, such as year-specific management practices, the low uptake can be attributed to the relatively lower precipitation, in particular, during the active growth period of July and August.

4.6. Very Wet to Extremely Wet Years

The corn carryover N under the very wet to extremely wet years were all negative. The wettest year was 1993, and as expected, total N losses were the highest and were primarily related to soil erosion and leaching. In general, N mineralization was relatively higher under the very wet to extremely wet years. Overall, high N uptake and high N losses as a result of the excessive precipitation negatively impacted the corn carryover N. The soybean carryover N was similar to that under the near normal years. The comparable carryover N was a result of high N mineralization and N fixation. However, and as expected, total N losses were higher due to leaching, losses in sediment, and gaseous emissions. Under excess soil moisture conditions, cover crops are a viable option for sequestering N and can also improve carryover N and P [8,60]. Dabney et al. [8] showed that a cover crop can reduce nitrate losses to tile drains by 7 to 65 kg ha−1.
While data to prove the validity of the soybean carryover N is widely reported [12,13,14,61], data on corn carryover N is not readily available. For the purposes of this study, we analyzed corn N and P fertilizer application rates in the UMRB states: Illinois, Iowa, Minnesota and Wisconsin (data source: [62]) during the near normal years, and one year following each of the severely to extremely dry and very to extremely wet years to assess potential reductions in N and P applications after droughts. Interestingly, and although not statistically significant, N and P application rates following droughts were on average 9% and 7%, respectively, lower than those in near normal years (Figure 8). The potential carryover N and P respectively ranged from 8 to 17 (Avg. 13 kg N ha−1), and −2 to 8 (Avg. 3 kg P ha−1). While our average simulated carryover N (Table 2) is similar to the average estimated USDA ERS [62] carryover, the average simulated carryover P is four times higher. USDA ERS [62] estimated N and P application rates following the very to extremely wet years were numerically higher than those following droughts (Figure 8) but lower than those under the near normal years.

4.7. Role of N Immobilization

Nitrogen immobilization has also been shown to affect the size of the carryover N in corn. Crop plant N is initially immobilized in crop residues, but is later mineralized from the residues, releasing N to the soil N pool for uptake. Soybean immobilizes N more quickly than corn, allowing the N mineralization phase to start earlier, and hence providing N to the subsequent crop more rapidly. In addition, there is less N immobilization and faster mineralization in soybean because of the lower C:N ratios of soybean residues [6]. Drought or no drought, inclusion of legumes in crop rotations appears to be a good thing for N use efficiency and environmental protection as it can reduce N fertilizer inputs in the subsequent corn or wheat crop.

4.8. Carryover P under Severe to Extremely Dry Years, Near-Normal Years and Very Wet to Extremely Wet Years

Carryover P is smaller compared to the carryover N, but so are the P fertilizer inputs (corn: 34 kg P ha−1; soybean 11 kg P ha−1) (Table 3 and Figure 7). As pointed out earlier, only about 10 to 30% of the applied P fertilizer ends up being used by the crop during the first season. When P is applied to the soil, it is easily fixed by calcium, iron and aluminum and therefore will move very little [9]. In addition, little P is lost by leaching, while reasonable amounts of P are lost through soil erosion and crop removal. The fixed, residual P will be slowly available to subsequent crops.
For both corn and soybean, the carryover P was positive across all three precipitation scenarios, ranging from 3 to 19 kg P ha−1 and 0 to 9 kg P ha−1, respectively (Table 3). Surprisingly, P mineralization and uptake were comparable between corn and soybean across years and precipitation scenarios. Although low, total P losses are higher in corn than soybean. Phosphorus mineralization is a key contributor to the carryover P, though the carryover P is also impacted by the low soil erosion and leaching losses. Reduced crop yields caused by a drought also means less P will be removed with the harvest; hence most P will be carried over to the next crop but may still be in a non-readily usable form. As with the carryover N, the carryover P and the key inputs that drive the carryover P varied in response to the precipitation scenarios. The severe to extremely dry years had the highest carryover P, followed by the very to extremely wet years, and then the near normal years. Differences in the carryover P were mainly due to the amount of mineralized P and losses.

4.9. Spatial Variation of Carryover N and P across the UMRB

Besides N and P fertilizer inputs, the magnitude of drought-induced carryover N and P is hugely impacted by multiple interacting site-specific factors that can vary across areas or regions. These factors include, but are not limited to management practices, land type, topography, soil texture–hydrologic group interactions, and local climate/weather conditions [63,64]. The spatial variation in average annual carryover N and P during the severe to extremely dry years across the UMRB is captured in Figure 9. Corn and soybean carryover N during the drought years respectively averaged 13 kg N ha−1 (Range: −18 to 37 kg N ha−1) and 30 kg N ha−1 (Range:10 to 43 kg N ha−1), while the carryover P respectively ranged from −43 to 99 kg P ha−1 y−1 and −28 to 98 kg P ha−1 y−1. Overall, soybean had a higher average carryover N (29 ± 2 kg N ha−1) than corn (13 kg N ha−1). Unlike the carryover N, corn had a higher average carryover P: 10 kg P ha−1 y−1 than soybean: 3 kg P ha−1 y−1. Similar spatial variations in response to site-specific factors were reported for N fixation rates, total soil N storage, N losses, soil organic carbon (SOC), and sediment losses across the UMRB [63,64] Overall, the site-specific factors impact various soil processes or parameters that enhance or reduce the magnitude of carryover N and P, e.g., soil moisture and air-space volume, temperature, nutrient pools etc.

4.10. Effects of Site-Specific Factors on Carryover N and P

Table 4 shows the effects of site-specific factors of land type, soil texture and soil hydrologic group on corn and soybean carryover N and P nutrients, along with the key attributes that affect the magnitude of the carryover N and P. As expected, the corn carryover N under non-HEL was higher than that on HEL mostly due the higher N mineralization and reduced N losses. Among the soil textural classes, the carryover N was surprisingly similar between the clayey and sandy soils (31 kg N ha−1). Clayey soils had lower mineralized N and losses, while sandy soils had higher mineralized N and losses. Unexpectedly, the loamy soils had the lower carryover N due to the higher N uptake and lower mineralized N. The sandy soil response could be biased because of the small number of simulated sandy soils that may not have been fully representative of all the possible sandy soil classes: only three percent of the simulated hectares were classified as sandy. Similarly, and despite the higher N losses in hydrologic group A soils (31 kg N ha−1), the soils had the highest carryover N due to the higher mineralization (50 kg N ha−1). While N losses were comparable among hydrologic group B, C, and D, the higher N uptake and lower N mineralization resulted in lower carryover N compared to the sandy soils. The higher available soil water when moving from sandy to clayey soils facilitates higher N uptake.
Similar to corn, the soybean carryover N under non-HEL was higher than that on HEL mostly due to the higher N mineralization. Clayey soils had the highest carryover N primarily due to the high N mineralization. Although loamy soils had the highest N fixation input (111 kg N ha−1), N uptake was higher while N mineralization was lowest among the three soil types. Soybean carryover N among the hydrologic soil groups followed a similar pattern to that of corn, with hydrologic group A soils having the highest carryover N. Sandy and hydrologic group A soils had the least N fixation. This result was expected since 83% of sandy soils in the UMRB belong to soil hydrologic group A [63]. In general, N fixation in sandy and hydrologic group A soils is constrained by inadequate soil moisture. Overall, differential impacts of the site-specific factors on the carryover N were most pronounced among the soil textural classes, and then soil hydrologic groups, and land types.
The corn carryover P was positive and comparable across land types, soil textural classes, and hydrologic soil groups (Avg. 11 kg P ha−1) (Table 4a). Similar to corn, and although small (Avg. 3 kg P ha−1), the soybean carryover P was also positive across land types, soil textural classes and hydrologic soil groups. The carryover P is largely driven by differences in crop P uptake. Overall, P losses for both corn and soybean were relatively minor. As mentioned earlier, P tends to be less mobile than N, with only 10 to 30% of the applied P utilized by the crop in the first season of application [8].
For the UMRB, loamy soils predominate, with 76% belonging to hydrologic group B, while 60% of clayey soils and 83% of sandy soils belong to hydrologic groups D and A, respectively [63]. On average, clayey and loamy soils are inherently more fertile than sandy soils and hence are expected to have higher carryover nutrients. The high variability in carryover N and P makes N and P application recommendations after a drought challenging, but also provides an opportunity for precision farming guidelines if the underlying differences can be predicted accurately.
With a changing climate, droughts and floods are likely to become more frequent. After a drought, significant amounts of unused N and P remain in the soil, while floods can wash away N and P. Planting cover crops in a drought or during floods can harvest large amounts of residual N and P that can help jump start next year’s crops.

5. Conclusions

This paper addresses the frontier challenges of N and P nutrient management after a drought, an important topic that affects the efficiency of N and P fertilizer use in corn/soybean rotations, especially given the fact that climate change-induced droughts are becoming more of a reality. Information from this study could better guide development of optimal N and P recommendations and best management practices after droughts. Besides slowing erosion, improving overall soil health, and enhancing nutrient and moisture availability, planting cover crops can biologically immobilize nitrate until the next cropping season. The high cost of fertilizers and concerns over nutrient loss impacts on offsite water quality, and compels farmers to account for every plant nutrient that is already in the soil. Identifying region-wide potential reductions in N and P applications after droughts has implications on conservation efforts aimed at minimizing environmental loading and associated water quality benefits. Although the results of this study are based on a simulation approach, they underscore the importance of nutrient management for the subsequent crop following a drought. Future research could be directed towards better understanding of the impacts of drought and potential carryover of plant nutrients under various climate change scenarios.

Author Contributions

M.N.M. conceived and designed the study; J.M.O. assisted in analyzing the data and writing; E.M.S. assisted in writing and proof-reading the paper; J.R.K. provided guidance and revised the paper. All authors have read and agreed to the published version of the manuscript.

Funding

This work and preparation of this manuscript was supported by the USDA-ARS, Grassland, Soil and Water Research Laboratory, Temple, TX, through Specific Cooperative Agreement #58-6206-1-053. We would also like to recognize the USDA Natural Resource Conservation Service (NRCS) Resource Inventory and Assessment Division for partly funding the study under Grant #50560781150.

Institutional Review Board Statement

Not applicable.

Informed Consent Statement

Not applicable.

Data Availability Statement

Not applicable.

Acknowledgments

The authors gratefully acknowledge the technical assistance of Theresa Pitts, a programmer at Texas AgriLife Research, Temple, Texas, for performing the numerous simulations and compiling the output databases.

Conflicts of Interest

The authors declare no competing interest.

Appendix A

Appendix A.1

APEX simulated nitrogen (N) uptake, mineralization, fixation and losses under corn and soybean fields across the Upper Mississippi River Basin (UMRB) compared to measured literature data.
APEX SimulatedLiteratureReferences
RangeMeanRangeMean
Variablekg ha−1
CornN Uptake143–21118690–3362[6,65,66,67,68,69,70,71]
N Mineralization13–4533 ± 234–16573[59,68,69,72,73,74]
Total N losses29–4239 ± 10–13970[59,63,67,75,76,77,78]
SoybeanN Uptake127–150141 ± 10–337245[10,68,79,80]
N Mineralization42–6456 ± 245–6756[59,68,79,80]
N fixation118–146133 ± 10–336137[10,18,68,79,80,81,82,83,84]
Total N losses14–1917 ± 10–924[67,75,76,78]

Appendix A.2

APEX simulated phosphorus (P) uptake, mineralization, fixation and losses under corn and soybean fields across the Upper Mississippi River Basin (UMRB) compared to measured literature data.
APEX SimulatedLiteratureReferences
RangeMeanRangeMean
Variablekg ha−1
CornP Uptake27–373241–15397[6,64,85,86]
P Mineralization7–1411
Total P losses3–440–22[63,87,88,89,90]
SoybeanP Uptake17–201948–6758[85,86]
P Mineralization8–1512
Total P losses1–220–22[87,88,89]
(–) Data on P mineralization under corn/soybean rotations was not readily available. Phosphorus mineralization is difficult to study because of the quick reaction of available P with various soil minerals [57].

References

  1. Wilhite, D.A.; Glantz, M.H. Understanding the drought phenomenon: The role of definitions. Water Int. 1985, 10, 111–120. [Google Scholar] [CrossRef] [Green Version]
  2. US NDMC (US National Drought Mitigation Center). 2015. Available online: http://drought.unl.edu/DroughtBasics/WhatisDrought.aspx (accessed on 1 December 2021).
  3. Himanshu, S.K.; Fan, Y.; Ale, S.; Bordovsky, J. Simulated efficient growth-stage-based deficit irrigation strategies for maximizing cotton yield, crop water productivity and net returns. Agric. Water Manag. 2021, 250, 106840. [Google Scholar] [CrossRef]
  4. Rimski-Korsakov, H.; Rubio, G.; Lavado, R.S. Effect of water stress in maize crop production and nitrogen fertilizer fate. J. Plant Nutr. 2009, 32, 565–578. [Google Scholar] [CrossRef]
  5. Al-Kaisi, M.M.; Elmore, R.W.; Guzman, J.G.; Hanna, H.M.; Hart, C.E.; Helmers, M.J.; Hodgson, E.W.; Lenssen, A.W.; Mallarino, A.P.; Robertson, A.E.; et al. Drought impact on crop production and the soil environment: 2012 experiences from Iowa. J. Soil Water Conserv. 2013, 68, 19A–24A. [Google Scholar] [CrossRef] [Green Version]
  6. Randall, G.W.; Vetsch, J.A.; Huffman, J.R. Nitrate losses in subsurface drainage from a corn-soybean rotation as affected by time of nitrogen application and use of nitrapyrin. J. Environ. Qual. 2003, 32, 1764–1772. [Google Scholar] [CrossRef]
  7. IPNI (International Plant Nutrition Institute). Crop Nutrition Following the 2012 Drought: Northcentral U.S. 2012. Available online: http://nanc.ipni.net (accessed on 7 July 2021).
  8. Dabney, S.M.; Delgado, J.A.; Meisinger, J.J.; Schomberg, H.H.; Liebig, M.A.; Kaspar, T.; Mitchell, J.; Reeves, W. Using cover crops and cropping systems for nitrogen management. In Advances in Nitrogen Management for Water Quality; Delgado, J.A., Follett, R.F., Eds.; Soil and Water Conservation Society: Ankeny, IO, USA, 2010; pp. 230–281. [Google Scholar]
  9. P&PI (Potash & Phosphate Institute). Phosphorus Fixation—The Good and Bad of It. Agri-Briefs: Agronomic News Items No. 2; Potash & Phosphate Institute: Atlanta, GA, USA, 1998. [Google Scholar]
  10. Córdova, S.C.; Castellano, M.J.; Dietzel, R.; Licht, M.A.; Togliatti, K.; Martinez-Feria, R.; Archontoulis, R. Soybean nitrogen fixation dynamics in Iowa, USA. Field Crops Res. 2019, 236, 165–176. [Google Scholar] [CrossRef]
  11. Salvagiotti, F.; Cassman, K.G.; Specht, J.E.; Walters, D.T.; Weiss, A.; Dobermann, A.R. Nitrogen uptake, fixation, and response to fertilizer N in soybeans: A review. Field Crops Res. 2008, 108, 1–13. [Google Scholar] [CrossRef] [Green Version]
  12. Shrader, W.D. Legumes, how much nitrogen do they provide? In Proceedings of the 25th Iowa Fertilizer and Agricultural Chemical Dealers Conference, Iowa State Univ. Coop. Ext. Serv. Publ. EC-810t, Ames, IA, USA, 29–30 November 1973. [Google Scholar]
  13. Kurtz, L.T.; Boone, L.V.; Peck, T.R.; Hoeft, R.G. Crop rotation for efficient nitrogen use. In Nitrogen in Crop Production; Hauck, R.D., Ed.; ASA; CSSA; SSSA: Madison, WI, USA, 1984; pp. 295–306. [Google Scholar]
  14. Bundy, L.G.; Andraski, T.W.; Wolkowski, R.P. Nitrogen credits in soybean–corn crop sequences on three soils. Agron. J. 1993, 85, 1061–1067. [Google Scholar]
  15. Gentry, L.E.; David, M.B.; Below, F.E.; Royer, T.V.; McIsaac, G.F. Nitrogen mass balance of a tile-drained agricultural watershed in East-Central Illinois. J. Environ. Qual. 2009, 38, 1841–1847. [Google Scholar] [CrossRef] [Green Version]
  16. Chen, H.H.; Li, X.; Hu, F.; Shi, W. Soil nitrous oxide emissions following crop residue addition: A meta-analysis. Glob. Chang. Biol. 2013, 19, 2956–2964. [Google Scholar] [CrossRef]
  17. Michiels, J.; Verreth, C.; Vanderleyden, J. Effects of temperature stress on bean nodulating Rhizobium strains. Appl. Environ. Microbiol. 1994, 60, 1206–1212. [Google Scholar] [CrossRef] [PubMed]
  18. Schmidt, J.P.; Schmitt, M.A.; Randall, G.W.; Lamb, J.A.; Orf, J.H.; Gollany, H.T. Swine manure application to nodulating and non-nodulating soybean. Agron. J. 2000, 92, 987–992. [Google Scholar] [CrossRef]
  19. Herridge, D.F.; Peoples, M.B. Ureide assay for measuring nitrogen fixation by nodulated soybean calibrated by 15N methods. Plant Physiol. 1990, 93, 495–503. [Google Scholar] [CrossRef] [PubMed] [Green Version]
  20. ASA. American Society of Agronomy. Managing Nutrients after Drought. 2012. Available online: https://www.agronomy.org/files/education/managing-nutrients-drought-resources/drought-nutrient-webinar-slides.pdf (accessed on 13 September 2022).
  21. Lory, J.A.; Scharf, P.C. Impact of the Drought on Next Year’s Fertilizer Rates. 2012. Available online: https://ipm.missouri.edu/IPCM/2012/8/Impact-of-the-Drought-on-Next-Years-Fertilizer-Rates/ (accessed on 1 August 2022).
  22. IPNI (International Plant Nutrition Institute). Estimates of Nutrient Uptake and Removal. 2012. Available online: http://www.ipni.net/article/IPNI-3296 (accessed on 12 November 2021).
  23. McKee, T.B.; Doesken, N.J.; Kleist, J. The relationship of drought frequency and duration to time scale. In Proceedings of the Eighth Conference on Applied Climatology, Anaheim, CA, USA, 17–22 January 1993. [Google Scholar]
  24. Williams, J.R.; Izaurralde, R.C. The APEX Model. In Watershed Models; Singh, V.P., Frevert, D.K., Eds.; CRC Press: Boca Raton, FL, USA; Taylor and Francis Group: Boca Raton, FL, USA, 2005; pp. 437–482. [Google Scholar]
  25. USDA NRCS (Natural Resources Conservation Service). Conservation Effects Assessment Project (CEAP). Assessment of the Effects of Conservation Practices on Cultivated Cropland in the Upper Mississippi River Basin. 2010. Available online: http://www.nrcs.usda.gov/technical/nri/ceap/ (accessed on 21 August 2021).
  26. Gassman, P.W.; Williams, J.R.; Wang, X.; Saleh, A.; Osei, E.; Hauck, L.M.; Izaurralde, R.C.; Flowers, J.D. The Agricultural Policy Environmental Extender (APEX) Model: An emerging tool for landscape and watershed environmental analyses. Trans. ASAE 2010, 53, 711–740. [Google Scholar] [CrossRef] [Green Version]
  27. Williams, J.R.; Potter, S.; Wang, X.; Atwood, J.; Norfleet, L.; Gerik, T.; Lemunyon, J.; King, A.; Steglich, E.; Wang, C.; et al. APEX Model Validation for CEAP. 2010. Available online: http://www.nrcs.usda.gov/technical/nri/ceap/umrbdocumentation/ (accessed on 24 August 2021).
  28. Wang, X.; Williams, J.R.; Gassman, P.W.; Baffaut, C.; Izaurralde, R.C.; Jeong, J.; Kiniry, J.R. Epic and Apex: Model use, calibration, and validation. Trans. ASAE 2012, 55, 1447–1462. [Google Scholar] [CrossRef]
  29. USDA NASS (National Agricultural Statistics Service). Cropland Data Layer. USDA NRCS Geospatial Data Gateway. 2007. Available online: http://datagateway.nrcs.usda.gov/ (accessed on 1 January 2022).
  30. Womach, J. Agriculture: A Glossary of Terms, Programs, and Laws; (Order Code 97-905); CRS Report for Congress: Washington, DC, USA, 2005. [Google Scholar]
  31. Glidemann, D.; Edwards, M.; Kuschk, P. Phosphine gas in the upper troposphere. Atmos. Environ. 2003, 37, 2429–2433. [Google Scholar] [CrossRef]
  32. Williams, J.R.; Izaurralde, R.C.; Steglich, E. The APEX Model (Version 0604)—Theoretical Documentation; Report# 2008-17; Blackland Research and Extension Center (BREC): Temple, TX, USA, 2008. [Google Scholar]
  33. David, M.B.; Drinkwater, L.E.; McIsaac, G.F. Sources of nitrate yields in the Mississippi river basin. J. Environ. Qual. 2010, 39, 1657–1667. [Google Scholar] [CrossRef] [Green Version]
  34. Roy, R.N.; Misra, R.V.; Lesschen, J.P.; Smaling, E.M. Assessment of Soil Nutrient Balance: Approaches and Methodologies; FAO: Rome, Italy, 2003. [Google Scholar]
  35. Heim, R.R., Jr. A review of twentieth-century drought indices used in the United States. Bull. Am. Meteor. Soc. 2002, 83, 1149–1165. [Google Scholar] [CrossRef] [Green Version]
  36. Yu, C.; Li, C.; Xin, Q.; Chen, H.; Zhang, J.; Zhang, F.; Li, X.; Clinton, N.; Huang, X.; Yue, Y.; et al. Dynamic assessment of the impact of drought on agricultural yield and scale-dependent return periods over large geographic regions. Environ. Modell. Softw. 2014, 62, 454–464. [Google Scholar] [CrossRef] [Green Version]
  37. Sivakumar, M.V.K.; Motha, R.P.; Wilhite, D.A.; Deborah, A.; Wood, D. (Eds.) Agricultural Drought Indices. In Proceedings of the WMO/UNISDR Expert Group Meeting on Agricultural Drought Indices, Murcia, Spain, 2–4 June 2010; World Meteorological Organization: Geneva, Switzerland, 2011. [Google Scholar]
  38. WMO (World Meteorological Organization). Standardized Precipitation Index User Guide; WMO: Geneva, Switzerland, 2012. [Google Scholar]
  39. McKee, T.B.; Doesken, N.J.; Kleist, J. Drought monitoring with multiple timescales. In Proceedings of the Ninth Conference on Applied Climatology, Dallas, TX, USA, 15–20 January 1995; pp. 15–20. [Google Scholar]
  40. Svoboda, M. Applying the Standardized Precipitation Index as a drought indicator. In Proceeding of the Mali Drought Monitoring Workshop, Bamako, Mali, 14–17 September 2009. [Google Scholar]
  41. Guttman, N.B. On the sensitivity of sample L moments to sample size. J. Clim. 1994, 7, 1026–1029. [Google Scholar] [CrossRef]
  42. Guttman, N.B. Comparing the Palmer drought index and the Standardized Precipitation Index. J. Am. Water Resour. Assoc. 1998, 34, 113–121. [Google Scholar] [CrossRef]
  43. Edwards, D.C.; McKee, T.B. Characteristics of 20th Century Drought in the United States at Multiple Time Scales; Climatology Report 97-2; Department of Atmospheric Science, Colorado State University: Fort Collins, CO, USA, 1997. [Google Scholar]
  44. NCDC (National Climatic Data Center, National Oceanic and Atmospheric Administration, NOAA). The Standard Precipitation Index (SPI). 2015. Available online: https://www.ncdc.noaa.gov/oa/climate/research/prelim/drought/spi.html (accessed on 7 August 2021).
  45. SAS Version 9.4 of the SAS System for Windows; Statistical Analysis System (SAS) Institute Inc.: Cary, NC, USA, 2018.
  46. USDA NASS (National Agricultural Statistics Service). Census of Agriculture Database. 2015. Available online: http://www.nass.usda.gov/index.asp (accessed on 1 July 2022).
  47. FAO (Food and Agricultural Organization, United Nations (UN). Water. Natural Resources Management and Environment Department. 2013. Available online: http://www.fao.org/nr/water/index.html (accessed on 14 October 2021).
  48. Irwin, S.; Good, D. Forming expectations for the 2015 U.S. average corn yield: What does history teach us? Farmdoc. Dly. 2015, 5, 36. [Google Scholar]
  49. Kumar, R.; Mahgoub, A.Y.; Buckmaster, D.; Chaterji, S. Yield Trends of Corn and Soybean in the Midwest. In Proceedings of the ASABE Annual International Meeting, Boston, MA, USA, 7–10 July 2019. [Google Scholar]
  50. Westcott, C.P.; Jewison, M.; Weather Effects on Expected Corn and Soybean Yield. A Report from the USDA Economic Research Services. FDS-13g-01. 2012. Available online: http://www.ers.usda.gov/ (accessed on 5 August 2021).
  51. USGCRP. Global Climate Change Impacts in the United States. United States Global Change Research Program; Karl, T.R., Melillo, J.M., Peterson, T.C., Eds.; Cambridge University Press: New York, NY, USA, 2009. [Google Scholar]
  52. Boubacar, I. The effects of drought on crop yields and yield variability in Sahel. In Proceeding of the Southern Agricultural Economics Association Annual Meeting, Orlando, FL, USA, 6–9 February 2010. [Google Scholar]
  53. Wetherald, R.T.; Manabe, S. Simulation of hydrologic changes associated with global warming. J. Geophys. Res. 2002, 107, 4379. [Google Scholar] [CrossRef]
  54. IPCC (Intergovernmental Panel on Climate Change). Contribution of Working Groups I, II and III to the Fourth Assessment Report of the Intergovernmental Panel on Climate Change; Pachauri, R.K., Reisinger, A., Eds.; IPCC: Geneva, Switzerland, 2007. [Google Scholar]
  55. Davidson, E.A.; Seitzinger, S. The enigma of progress in denitrification research. Ecol. Appl. 2006, 16, 2057–2063. [Google Scholar] [CrossRef]
  56. Amit, K.; Munesh, K.; Rajiv, P.; Guo, Z.Y.; Marina, C. Forest soil nutrient stocks along altitudinal range of Uttarakhand Himalayas: An aid to Nature Based Climate Solutions. Catena 2021, 207, 105667. [Google Scholar] [CrossRef]
  57. Schlesinger, H.W.; Bernhardt, E.S. Soil Phosphorus Cycling. Biogeochemistry: An Analysis of Global Change, 3rd ed.; Elsevier Inc.: Amsterdam, The Netherlands, 2013. [Google Scholar]
  58. Sinclair, R.T.; Serraj, R. Legume nitrogen fixation and drought. Nature 1995, 378, 344. [Google Scholar] [CrossRef]
  59. Serraj, R.; Sinclair, T.R.; Purcell, L.C. Symbiotic N2 fixation response to drought. J. Exp. Bot. 1999, 50, 143–155. [Google Scholar] [CrossRef] [Green Version]
  60. SARE (Sustainable Agriculture Research and Education). Benefits of Cover Crops. In Managing Cover Crops Profitably, 3rd ed.; University of Maryland: College Park, MD, USA; Available online: https://www.sare.org/publications/managing-cover-crops-profitably/benefits-of-cover-crops/ (accessed on 1 September 2022).
  61. Gentry, L.E.; Below, F.E.; David, M.B.; Bergerou, J.A. Source of the soybean N credit in maize production. Plant Soil 2001, 236, 175–184. [Google Scholar] [CrossRef]
  62. USDA ERS (Economic Research Service). ERS Annual Report, FY2019. Available online: https://www.ers.usda.gov/ (accessed on 21 June 2022).
  63. Meki, N.M.; Marcos, J.; Atwood, J.; Norfleet, L.; Steglich, E.; Williams, J.; Gerik, T. Effects of site-specific factors on corn stover removal thresholds and subsequent environmental impacts in the Upper Mississippi River Basin. J. Soil Water Conserv. 2011, 66, 386–399. [Google Scholar] [CrossRef] [Green Version]
  64. Meki, N.M.; Atwood, J.D.; Norfleet, L.M.; Williams, J.R.; Gerik, T.J.; Kiniry, J.R. Corn residue removal effects on soybean yield and nitrogen dynamics in the Upper Mississippi River Basin. J. Agroecol. Sustain. Food Syst. 2013, 37, 379–400. [Google Scholar] [CrossRef]
  65. Angle, J.S.; McClung, G.; Mclntosh, M.S.; Thomas, P.M.; Wolf, D.C. Nutrient losses in runoff from conventional and no-till corn watersheds. J. Environ. Qual. 1984, 13, 431–435. [Google Scholar] [CrossRef]
  66. Christianson, L.E.; Harmel, R.D. 4R Water quality impacts: An assessment and synthesis of forty years of drainage nitrogen losses. J. Environ. Qual. 2015, 44, 1852–1860. [Google Scholar] [CrossRef] [PubMed]
  67. DeBruin, J.; Butzen, S. Nitrogen Uptake in Corn. Pioneer. 2019. Available online: https://www.pioneer.com/us/agronomy/nitrogen_uptake_corn.html (accessed on 11 November 2021).
  68. Gale, K. Fertility Needs of Corn. AgriGold. 2019. Available online: http://www.agrigold.com/Universal/Articles/Fertility-Needs-of-Corn/ (accessed on 11 November 2021).
  69. Meisinger, J.; Kaspar, T.; Robison, D. Dealing with Drought: Securing Nitrogen with Cover Crops. CropLife Media Group Webinars, August 2012. Available online: http://www.croplife.com/webinars (accessed on 16 November 2021).
  70. Ciampitti, I.A.; Salvagiotti, F. New insights into soybean biological nitrogen fixation. Agron. J. 2018, 110, 1185–1196. [Google Scholar] [CrossRef] [Green Version]
  71. Kanwar, R.S.; Baker, J.L.; Laflen, J.M. Nitrate movement through the soil profile in relationship to tillage system and fertilizer application method. Trans. ASAE 1985, 28, 1802–1807. [Google Scholar] [CrossRef]
  72. Kunert, K.J.; Vorster, B.J.; Fenta, B.A.; Kibido, T.; Dionisio, G.; Foye, C.H. Drought stress responses in soybean roots and nodules. Front. Plant Sci. 2016, 7, 1015. [Google Scholar] [CrossRef] [PubMed] [Green Version]
  73. Torbert, H.A.; Hoeft, R.G.; Vanen Heuvel, R.M.; Mulvaney, R.L.; Hollinger, S.E. Short-term excess water impact on corn yield and nitrogen recovery. J. Prod. Agric. 1993, 6, 337–344. [Google Scholar] [CrossRef]
  74. USDA NASS (National Agricultural Statistics Service). Census of Agriculture Database. 2004. Available online: http://www.nass.usda.gov/index.asp (accessed on 17 September 2021).
  75. Beegle, D.B.; Durst, P.T. Managing Phosphorus for Crop Production. Agronomy Facts 13; Penn State Cooperative Extension; The Pennsylvania State University: State College, PA, USA, 2002. [Google Scholar]
  76. Mallarino, A.P.; Oltmans, R.R.; Prater, J.R.; Villavicencio, C.X.; Thompson, L.B. Nutrient Uptake by Corn and Soybean, Removal, and Recycling with Crop Residue. 2011. Available online: http://www.agronext.iastate.edu/soilfertility/info/mallarino-2.pdf (accessed on 11 November 2021).
  77. Schulte, E.E.; Kelling, K.A. Understanding Plant Nutrients: Soil and Applied Phosphorus. A2520. Wisconsin County Extension Office. Wisconsin. USA. 2019. Available online: http://corn.agronomy.wisc.edu/Management/pdfs/a2520.pdf (accessed on 11 November 2021).
  78. Flynn, R.; Idowu, J. Nitrogen Fixation by Legumes. Guide A-129. Department of Extension Plant Sciences, New Mexico State University. 2019. Available online: https://aces.nmsu.edu/pubs/_a/A129/ (accessed on 11 November 2021).
  79. Sawyer, J. Estimating Nitrogen Losses in Wet Corn Fields. Iowa State University, Extension and Outreach. 2014. Available online: https://crops.extension.iastate.edu/cropnews/2014/06/estimating-nitrogen-losses-wet-corn-fields (accessed on 11 November 2021).
  80. Wu, T.Y.; Ma, B.L.; Liang, B.C. Quantification of seasonal soil nitrogen mineralization for corn production in eastern Canada. Nutr. Cycl. Agroecosystems 2008, 81, 279–290. [Google Scholar] [CrossRef]
  81. Greer, K.D.; Pittelkow, C.M. Linking nitrogen losses with crop productivity in maize agroecosystems. Front. Sustain. Food Syst. 2018, 2, 29. [Google Scholar] [CrossRef]
  82. Schmidt, J.P. Nitrogen Fertilizer for Soybean? Crop Insights; Pioneer: Champaign, IL, USA, 2019; Available online: https://www.pioneer.com/us/agronomy/nitrogen_fertilizer_soybean.html (accessed on 11 January 2022).
  83. Streeter, J.G. Effects of drought on nitrogen fixation in soybean root nodules. Plant Cell Environ. 2003, 26, 1199–1204. [Google Scholar] [CrossRef]
  84. Zoubek, G.; Nygren, A. Credit Soil Organic Matter for Nitrogen. 2008. Available online: https://cropwatch.unl.edu/credit-soil-organic-matter-nitrogen (accessed on 11 August 2021).
  85. Christianson, L.E.; Harmel, R.D.; Smith, D.; Williams, M.R.; King, K. Assessment and synthesis of 50 years of published drainage phosphorus losses. J. Environ. Qual. 2016, 45, 1467–1477. [Google Scholar] [CrossRef] [Green Version]
  86. Jayasundara, S.; Wagner-Riddle, C.; Parkin, G.; von Bertoldi, P.; Warland, J.; Kay, B.; Voroney, P. Minimizing nitrogen losses from a corn–soybean–winter wheat rotation with best management practices. Nutr. Cycl. Agroecosystems 2007, 79, 141–159. [Google Scholar] [CrossRef]
  87. Bender, R.R.; Haegele, J.W.; Ruffo, M.L.; Below, F.E. Nutrient uptake, partitioning, and remobilization in modern, transgenic insect-protected maize hybrids. Agron. J. 2013, 105, 161–170. [Google Scholar] [CrossRef]
  88. Sawyer, J.E.; Nafziger, E.; Randall, G.; Bundy, L.; Rehm, G.; Joern, B. Concepts and Rationale for Regional Nitrogen Rate Guidelines for Corn. 2006. Available online: www.extension.iastate.edu/Publications/2015.pdf (accessed on 15 November 2021).
  89. Syswerda, S.P.; Basso, B.; Hamilton, S.K.; Tausig, J.B.; Robertson, G.P. Long-term nitrate loss along an agricultural intensity gradient in the Upper Midwest USA. Agric. Ecosyst. Environ. 2012, 149, 10–19. [Google Scholar] [CrossRef] [Green Version]
  90. Tomer, M.D.; Moorman, T.B.; Kovar, J.L.; Cole, K.J.; Nichols, D.J. Eleven years of runoff and phosphorus losses from two fields with and without manure application, Iowa, USA. Agric. Water Manag. 2016, 168, 104–111. [Google Scholar] [CrossRef]
Figure 1. Location of the Upper Mississippi River Basin (UMRB) showing various land use patterns. Source: USDA National Agricultural Statistics Service (USDA NASS 2007).
Sustainability 14 15108 g001
Figure 2. Location of the Upper Mississippi River Basin (UMRB) and the 122 National Oceanic and Atmospheric Administration (NOAA) weather stations.
Sustainability 14 15108 g002
Figure 3. (a)—Mean, minimum and maximum to the mean annual precipitation across the Upper Mississippi River Basin (UMRB), and (b)—Standardized Precipitation Index (SPI) of the UMRB: 1960–2006 for a 9-month timescale. The 9-month timescale covers the cropping season time in a calendar year. The dashed lines mark the SPI values of −1.5 and 1.5.
Sustainability 14 15108 g003
Figure 4. Nitrogen cycle showing key agroecosystem inputs and outputs, and associated processes.
Sustainability 14 15108 g004
Figure 5. The Standard Precipitation Index (SPI) showing the severity of the 2012 drought season (March to August) across the USA. Source and credit: National Climatic Data Center (NCDC, NOAA) https://www.ncdc.noaa.gov/sotc/drought/201206#det-spi (accessed on 2 September 2021).
Sustainability 14 15108 g005
Figure 6. Corn and soybean yield trends during the study period: 1960 to 2006. (Data source: [46]).
Sustainability 14 15108 g006
Figure 7. Average corn and soybean carryover nitrogen (N) and phosphorus (P) under the severe to extremely dry, near normal and very to extremely wet years. Positive values indicate N and P inputs or availability in the soil due to applied fertilizer, mineralization, and N fixation, while negative values indicate N and P outputs from the soil due to uptake and losses.
Sustainability 14 15108 g007
Figure 8. Average annual nitrogen and phosphorus fertilizers applied to corn/soybean rotations in the Upper Mississippi River Basin states: Illinois, Iowa, Minnesota and Wisconsin during the near normal years, and one year after each of the severely to extremely dry and very to extremely wet years. Original data source: USDA ERS.https://www.ers.usda.gov/data-products/fertilizer-use-and-price/ (accessed on 10 January 2022).
Sustainability 14 15108 g008
Figure 9. Spatial variation in average annual corn and soybean carryover nitrogen (N) and phosphorus (P) across the Upper Mississippi River Basin (UMRB) during the severe to extremely dry years.
Sustainability 14 15108 g009
Table 1. Classification system linking Standardized Precipitation Indices (SPI’s) to drought intensities.
SPI ValuesDescription
+2.0 and moreextremely wet
1.5 to 1.99very wet
1.0 to 1.49moderately wet
−0.99 to 0.99near normal
−1.0 to −1.49moderately dry
−1.5 to −1.99severely dry
−2.0 and lessextremely dry
Table 2. Carryover nitrogen (N) and some of the key factors that affect the magnitude of the carryover N in corn/soybean rotations under severe to extremely dry, near normal and very to extremely wet years.
Severe to Extremely Dry YearsNear Normal YearsVery to Extremely Wet Years
19631964197619881989Mean19751978197919962000Mean19651973198219901993Mean
CropVariablekg ha−1kg ha−1kg ha−1
CornCarryover N 1 ± 07 ± 137 ± 236 ± 3−18 ± 313 ± 25 ± 1−27 ± 2−9 ± 26 ± 1−50 ± 3−15 ± 1−40 ± 3−13 ± 3−33 ± 3−44 ± 3−20 ± 3−30 ± 3
Applied N176176176176176176176176176176176176176176176176176176
Mineralized N37 ± 229 ± 237 ± 213 ± 329 ± 529 ± 340 ± 242 ± 345 ± 313 ± 427 ± 333 ± 364 ± 342 ± 264 ± 252 ± 485 ± 562 ± 3
N Uptake198 ± 1175 ± 1154 ± 1132 ± 1195 ± 1171 ± 1182 ± 1202 ± 1191 ± 1143 ± 1211 ± 1186 ± 1223 ± 1180 ± 1234 ± 1211 ± 1202 ± 1200 ± 1
N losses with:
Sediment5 ± 07 ± 05 ± 03 ± 012 ± 16 ± 08 ± 016 ± 017 ± 113 ± 017 ± 114 ± 029 ± 117 ± 117 ± 130 ± 139 ± 226
Runoff1 ± 01 ± 000001 ± 01 ± 01 ± 01 ± 001 ± 02 ± 01 ± 01 ± 01 ± 01 ± 01 ± 0
Leaching3 ± 05 ± 07 ± 07 ± 15 ± 05 ± 08 ± 115 ± 012 ± 115 ± 112 ± 112 ± 117 ± 122 ± 19 ± 117 ± 122 ± 117 ± 1
Volatilization3 ± 07 ± 08 ± 08 ± 09 ± 07 ± 09 ± 07 ± 07 ± 08 ± 09 ± 08 ± 07 ± 07 ± 09 ± 09 ± 012 ± 09 ± 0
Denitrification3 ± 03 ± 02 ± 03 ± 03 ± 03 ± 03 ± 03 ± 03 ± 03 ± 04 ± 03 ± 02 ± 03 ± 03 ± 04 ± 04 ± 03 ± 0
Total N losses14 ± 023 ± 122 ± 121 ± 128 ± 122 ± 129 ± 143 ± 139 ± 140 ± 142 ± 139 ± 157 ± 251 ± 239 ± 261 ± 279 ± 257 ± 2
SoybeanCarryover N 10 ± 332 ± 243 ± 331 ± 232 ± 330 ± 330 ± 219 ± 234 ± 268 ± 313 ± 333 ± 266 ± 48 ± 340 ± 420 ± 327 ± 332 ± 3
Mineralized N40 ± 354 ± 256 ± 353 ± 481 ± 457 ± 358 ± 461 ± 654 ± 764 ± 542 ± 556 ± 586 ± 543 ± 469 ± 376 ± 555 ± 566 ± 4
N fixation126 ± 2116 ± 2120 ± 287 ± 2116 ± 2113 ± 2118 ± 2127 ± 2139 ± 2146 ± 2135 ± 2133 ± 2149 ± 2123 ± 2149 ± 2126 ± 2144 ± 2138 ± 2
N Uptake148 ± 1129 ± 1122 ± 199 ± 1152 ± 1130 ± 1132 ± 1150 ± 1145 ± 2127 ± 1149 ± 1141 ± 1148 ± 1139 ± 1161 ± 1156 ± 1151 ± 2139 ± 1
N losses with:
Sediment1 ± 02 ± 02 ± 01 ± 03 ± 02 ± 03 ± 03 ± 13 ± 04 ± 14 ± 03 ± 07 ± 05 ± 06 ± 08 ± 06 ± 16 ± 0
Runoff0000001 ± 001 ± 00001 ± 01 ± 01 ± 01 ± 01 ± 01 ± 0
Leaching2 ± 03 ± 04 ± 04 ± 04 ± 03 ± 03 ± 09 ± 15 ± 06 ± 15 ± 16 ± 19 ± 17 ± 14 ± 010 ± 16 ± 17 ± 1
Volatilization4 ± 04 ± 04 ± 04 ± 06 ± 04 ± 05 ± 05 ± 04 ± 04 ± 05 ± 05 ± 04 ± 05 ± 04 ± 06 ± 06 ± 05 ± 0
Denitrification1 ± 01 ± 01 ± 01 ± 01 ± 01 ± 02 ± 02 ± 01 ± 01 ± 01 ± 01 ± 01 ± 02 ± 01 ± 02 ± 02 ± 02 ± 0
Total N losses8 ± 010 ± 011 ± 010 ± 014 ± 010 ± 014 ± 119 ± 114 ± 115 ± 115 ± 115 ± 122 ± 120 ± 116 ± 127 ± 121 ± 121 ± 1
Mean ± confidence limits at p ≤ 0.05. The carryover N was computed using Equation (1): Ncarryover = NInputs (Nif + Nom + Nbf) − NOutputs (Nuh + Nse + Nru + Nle + Nvl + Ndn), where NInputs are made up of applied inorganic N fertilizers (Nif), N from mineralized organic matter (Nom) (including additions from animal manures) and biological N fixation (Nbf), while NOutputs are due to: N plant uptake and crop harvest (Nuh), sediment (water and wind erosion) (Nse), losses in runoff (Nru), leaching (Nle), and gaseous losses through volatilization (Nvl) and denitrification (Ndn).
Table 3. Carryover phosphorus (P) and some of the key factors that affect the magnitude of the carryover P in corn/soybean rotations under severe to extremely dry, near normal and very to extremely wet years.
Severe to Extremely Dry YearsNear Normal YearsVery to Extremely Wet Years
19631964197619881989Mean19751978197919962000Mean19651973198219901993Mean
CropVariablekg ha−1kg ha−1kg ha−1
CornCarryover P 8 ± 112 ± 113 ± 119 ± 15 ± 111 ± 111 ± 17 ± 16 ± 110 ± 13 ± 17 ± 16 ± 110 ± 19 ± 13 ± 111 ± 18 ± 1
Applied P323535353334323534343533343436343234
Mineralized P12 ± 010 ± 07 ± 08 ± 09 ± 09 ± 014 ± 011 ± 010 ± 07 ± 09 ± 010 ± 08 ± 013 ± 011 ± 013 ± 017 ± 012 ± 0
P Uptake35 ± 031 ± 027 ± 023 ± 034 ± 031 ± 032 ± 435 ± 334 ± 427 ± 037 ± 034 ± 029 ± 032 ± 034 ± 037 ± 029 ± 032 ± 0
Total P losses ††1 ± 02 ± 02 ± 01 ± 03 ± 02 ± 03 ± 04 ± 04 ± 04 ± 04 ± 04 ± 07 ± 05 ± 04 ± 07 ± 09 ± 06 ± 0
SoybeanCarryover P 4 ± 14 ± 12 ± 16 ± 11 ± 03 ± 16 ± 12 ± 1001 ± 02 ± 12 ± 14 ± 13 ± 12 ± 19 ± 14 ± 1
Applied P10 ± 011 ± 011 ± 011 ± 011 ± 011 ± 010 ± 011 ± 010 ± 011 ± 011 ± 011 ± 011 ± 010 ± 012 ± 011 ± 010 ± 011 ± 0
Mineralized P14 ± 011 ± 08 ± 09 ± 011 ± 010 ± 015 ± 012 ± 011 ± 08 ± 010 ± 011 ± 09 ± 014 ± 09 ± 014 ± 015 ± 012 ± 0
P Uptake20 ± 017 ± 016 ± 013 ± 020 ± 017 ± 017 ± 020 ± 019 ± 017 ± 019 ± 018 ± 016 ± 018 ± 015 ± 020 ± 013 ± 017 ± 0
Total P losses1 ± 01 ± 01 ± 01 ± 01 ± 01 ± 01 ± 02 ± 02 ± 02 ± 01 ± 02 ± 02 ± 02 ± 02 ± 03 ± 03 ± 02 ± 0
Mean ± confidence limits at p ≤ 0.05. The carryover P was computed using Equation (2): Pcarryover = PInputs (Pif + Pom) − POutputs (Puh + Pru + Pse + Ple), where PInputs are made up of applied inorganic P fertilizers (Pif), P from mineralized organic matter (Pom) (including additions from animal manures), while outputs are due to: P plant uptake and crop harvest (Puh), losses in runoff (Pru), sediment (water and wind erosion) (Pse) and leaching (Ple). †† Total P losses: dissolved in runoff, with sediment (water and wind erosion) and leaching.
Table 4. (a) Effects of site-specific factors on corn carryover nitrogen (N) and phosphorus (P) across the Upper Mississippi River Basin (UMRB) under severe to extremely dry years. Data values are annual averages across corn fields over a 47-year timescale: 1960–2006. (b) Effects of site-specific factors on soybean carryover nitrogen (N) and phosphorus (P) across the Upper Mississippi River Basin (UMRB) under severe to extremely dry years. Data values are annual averages across soybean fields over a 47-year timescale: 1960–2006.
(a)
Land TypeSoil Textural ClassSoil Hydrologic Group
HEL non-HELClayeyLoamySandyABCD
Variablekg ha−1
Carryover N−3 ± 216 ± 231 ± 79 ± 231 ± 844 ± 513 ± 2−2 ± 19 ± 2
Applied N164 ± 2177 ± 1176 ± 6174 ± 1158 ± 6163 ± 6176 ± 1161 ± 2176 ± 2
N mineralization25 ± 330 ± 139 ± 428 ± 144 ± 850 ± 428 ± 230 ± 429 ± 3
N Uptake168 ± 1169 ± 1161 ± 7170 ± 1141 ± 4138 ± 5169 ± 1168 ± 2174 ± 1
N losses ††24 ± 022 ± 123 ± 223 ± 030 ± 331 ± 322 ± 025 ± 122 ± 1
Carryover P9 ± 112 ± 010 ± 212 ± 011 ± 211 ± 211 ± 113 ± 112 ± 1
Applied P32 ± 135 ± 031 ± 235 ± 026 ± 226 ± 234 ± 135 ± 135 ± 1
P mineralization9 ± 09 ± 09 ± 19 ± 010 ± 19 ± 19 ± 010 ± 010 ± 0
P Uptake30 ± 030 ± 028 ± 130 ± 025 ± 124 ± 130 ± 029 ± 030 ± 0
P losses ††2 ± 02 ± 02 ± 02 ± 0002 ± 03 ± 03 ± 0
(b)
Carryover N 4 ± 214 ± 144 ± 59 ± 113 ± 618 ± 511 ± 1−1 ± 310 ± 3
N fixation110 ± 1112 ± 291 ± 9111 ± 177 ± 778 ± 7110 ± 1116 ± 3108 ± 2
N mineralization57 ± 367 ± 2105 ± 863 ± 285 ± 685 ± 662 ± 255 ± 575 ± 4
N Uptake152 ± 1154 ± 1139 ± 7154 ± 1131 ± 4127 ± 4151 ± 1159 ± 2162 ± 1
N losses †††11 ± 111 ± 113 ± 211 ± 018 ± 218 ± 210 ± 013 ± 111 ± 0
Carryover P4 ± 02 ± 01 ± 13 ± 03 ± 12 ± 14 ± 13 ± 12 ± 1
P Applied12 ± 010 ± 07 ± 211 ± 08 ± 17 ± 111 ± 011 ± 110 ± 1
P mineralization10 ± 010 ± 010 ± 110 ± 010 ± 110 ± 110 ± 010 ± 111 ± 1
P Uptake17 ± 017 ± 015 ± 117 ± 015 ± 015 ± 016 ± 017 ± 018 ± 0
P losses †††1 ± 01 ± 01 ± 01 ± 0001 ± 01 ± 01 ± 0
Mean ± confidence limits at p ≤ 0.05. HEL = highly erodible land. †† N and P losses are due to processes described in Table 3 and Table 4. ††† N and P losses are due to processes described in Table 2 and Table 3.
Publisher’s Note: MDPI stays neutral with regard to jurisdictional claims in published maps and institutional affiliations.

