Abstract
In the process of cyclic loading, strain development not only presents the strain softening phenomenon, but also a strain hardening phenomenon, depending on the different values of static deflection stress. The strain hardening and strain softening characteristics of soft clay are studied by cyclic triaxial tests. The test results show that when the static deflection stress is zero, the value of cyclic cumulative strain is small, and the strain development presents the softening phenomenon. When the static deflection stress is greater than zero, the accumulation strain increases with increasing cyclic deflection stress, and the strain development present strain hardening phenomenon. Therefore, a strain softening index and strain hardening index were proposed to describe the cyclic characteristics of soil. Moreover, an equivalent cyclic creep model was established by considering the strain hardening index to describe cyclic characteristics of suction pile. The results obtained using the proposed method are in reasonably good agreement with the measured results. This can provide a new method for analyzing the cyclic characteristics of soil and the suction pile.
1. Introduction
Suction piles typically need to be designed for cyclic lateral loading (Ye et al. [1]; Kong et al. [2]; Tong et al. [3]; Zhang and Andersen [4]). In the process of cyclic loading, the strain development not only exhibits the strain softening phenomenon, but also the strain hardening phenomenon, depending on the static deflection stress. However, research has mostly focused on strain softening, ignoring the strain hardening of soft clay. This paper analyzes the strain hardening characteristic and strain accumulation characteristics of soil. At the same time, an equivalent cyclic creep model is proposed for the cyclic bearing characteristics of suction piles.
To study the cyclic characteristics of soft clay, Andersen [5], Huo and Lei [6], Mitchell and King [7], Liu [8] and Zhuang [9] conducted a large number of cyclic triaxial tests and found that the static stress, cyclic stress, and number of cycles have an effect on the cyclic cumulative deformation characteristics of soft clay. Zhou and Gong [10], Matasovic and vucetic [11], Yao and Nie [12], Cai et al. [13], and Idriss et al. [14] found that the soft clay presents strain softening phenomenon under the condition of no static deviator stress. The test results showed that the higher the cyclic deviatoric stress, the more obvious the soil softening effect. Idriss et al. [14] proposed the concept of softening factor to describe the strain softening phenomenon of soft clay. Based on the strain softening factor, Wang [15] proposed an equivalent strain softening factor. In terms of strain accumulation, Monismith et al. [16] conducted a large number of cyclic triaxial tests to study the characteristics of cyclic cumulative strain. Li and Selig [17] and Chai and Miura [18] established the cyclic cumulative deformation method by considering the number of cycles, static deflection stress level, cyclic deflection stress level and other factors. Huang [19] proposed the concept of relative deflection stress level D*, which considers a more comprehensive set of factors. Hyde and Brown [20] and Yasuhara et al. [21] established the cyclic creep constitutive model to describe the cyclic cumulative deformation of soft clay. Based on the theory of static creep, Wang et al. [22] proposed an equivalent cyclic cumulative deformation empirical model of soft clay based on a large number of cyclic triaxial test data. Moreover, Zhu et al. [23] established an equivalent cyclic cumulative deformation model to analyze the long-term cyclic bearing characteristics of soil by considering soil weakening factors in the creep element model. However, when the static deflection stress is greater than zero, strain develops, with the strain hardening phenomenon being present, while strain softening is not applicable to the cyclic accumulation model. Therefore, it is necessary to study the strain hardening characteristics of soil.
The above research has mainly studied the strain softening phenomenon during testing. At the same time, the strain accumulation model, in which the strain softening factor is considered, is not yet accurate enough to describe the cyclic bearing characteristics of soft clay. In the process of cyclic loading, the strain development not only exhibits the strain softening phenomenon, it also exhibits the strain hardening phenomenon, depending on the different values of static deflection stress. Therefore, the cyclic bearing characteristics of soil are studied by means of cyclic triaxial tests. At the same time, an equivalent cyclic creep model is established by considering the strain hardening index to describe the cyclic bearing characteristics of suction piles.
2. Cyclic Triaxial Tests of Soft Clay
The specimen soil was taken from the coast of Guanyun. As shown in Figure 1a, the remolded test soil was consolidated using the vacuum preloading method. When the soil consolidation was completed, the soil cyclic triaxial test was started using the GDS apparatus (Figure 1b). Three confining pressures were selected to conduct cyclic triaxial tests under the different static deflection stress (qs) and the cyclic deviatoric stress (qd). The specific test schemes are shown in Table 1. The stress–strain curves of saturated soft clay are shown in Figure 2. The Mohr–Coulomb ultimate strength (qf) indices of soft clay were calculated to be c = 18.3 kPa and φ = 19.6°.
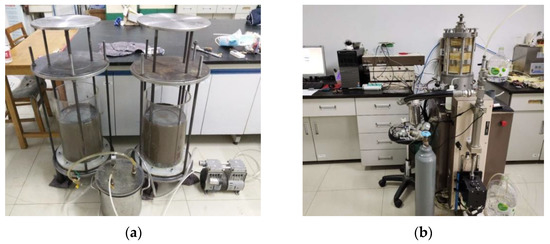
Figure 1.
Cyclic triaxial test. (a) Soil consolidation; (b) GDS apparatus.

Table 1.
Test parameters.
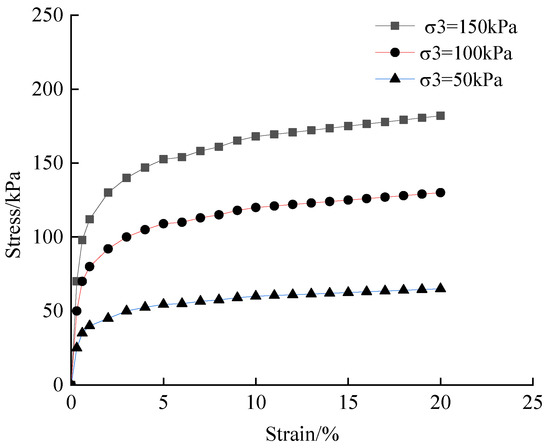
Figure 2.
Strength characteristics of soft clay.
2.1. Strain Softening Results
Figure 3 shows the stress–strain curves with static deflection stress of zero. Under the low cyclic deflection stress, the strain accumulation is not obvious. At the same time, the strain softening is small. With increasing cyclic deflection stress, the strain softening is more obvious. However, the strain accumulation is very small. It can be seen that the strain softening increases with increasing cyclic deflection stress.
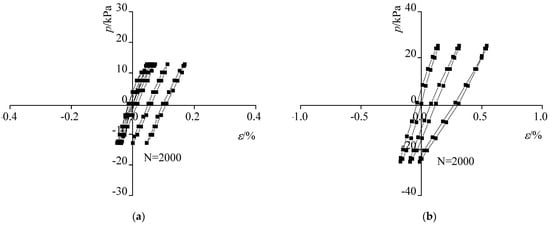
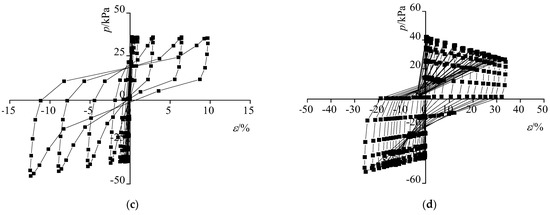
Figure 3.
Stress–strain relationship (σ3 = 100 kPa). (a) qd = 0.3 qf; (b) qd = 0.4 qf; (c) qd = 0.6 qf; (d) qd = 0.7 qf.
Figure 4 shows the strain softening under the following numbers of cycles: 1, 10, 1000 and 2000. It can be observed that the maximum value and the minimum value of strain increases with increasing number of cycles. When the cyclic deflection stress ratio is larger, the strain amplitude is larger. Moreover, the maximum value of strain is linearly related to the logarithm of the number of cycles.
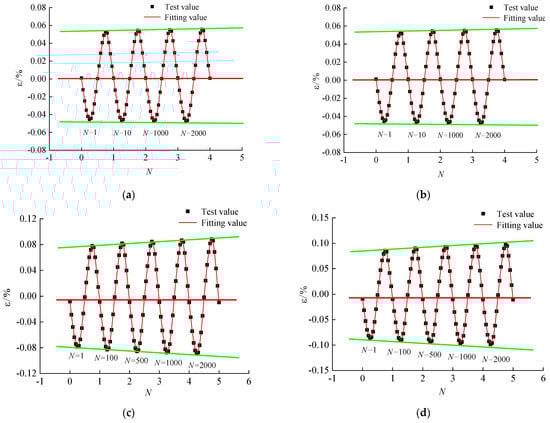
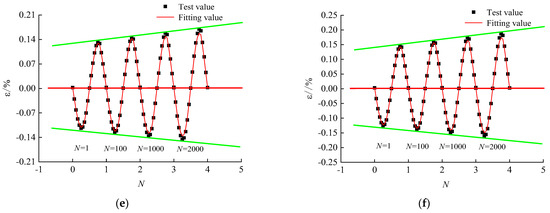
Figure 4.
Development of strain softening. (a) qs = 0.4 qf, qf = 0.1 qf; (b) qs = 0.5 qf, qf = 0.1 qf; (c) qs = 0.4 qf, qd = 0.2 qf; (d) qs = 0.5 qf, qd = 0.2 qf; (e) qs = 0.4 qf, qd = 0.3 qf; (f) qs = 0.5 qf, qd = 0.3 qf.
2.2. Strain Hardening Results
Figure 5 shows the cyclic cumulative strain development process under different cyclic deflection stress ratios. When the static deflection stress (qs) is 0.4 and the cyclic deviatoric stress (qd) is 0.1, the cyclic cumulative strain is small. When the static deflection stress (qs) is 0.5 and the cyclic deviatoric stress (qd) is 0.3, the cyclic cumulative strain is larger. It can be observed that the cyclic deflection stress obviously affects the strain accumulation results. The cyclic cumulative strain increases with static deflection stress and cyclic deflection stress.
Figure 5.
Stress–strain curves (σ3 = 100 kPa). (a) qs = 0.4 qf, qd = 0.1 qf; (b) qs = 0.4 qf, qd = 0.2 qf; (c) qs = 0.5 qf, qd = 0.2 qf; (d) qs = 0.5 qf, qd = 0.3 qf.
Figure 6a shows that when the static deflection stress (qs) is 0.4 and the cyclic deviatoric stress is 0.2, the cyclic cumulative strain is small. When the static deflection stress (qs) is 0.4 and the cyclic deviatoric stress (qd) is 0.3, the cyclic cumulative strain is larger than the result when the static deflection stress (qs) is 0.4 and the cyclic deflection stress (qd) is 0.2. Figure 5b shows that when the static deflection stress (qs) is 0.5 and the cyclic deflection stress (qd) is 0.2, the cyclic cumulative strain is small. When the static deflection stress (qs) is 0.5 and the cyclic deflection stress (qd) is 0.3, the cyclic cumulative strain is larger than the result of the static deflection stress (qs) is 0.5 and the cyclic deflection stress (qd) is 0.2. It can be observed that the cyclic cumulative strain increases with increasing static deflection stress and cyclic deflection stress.
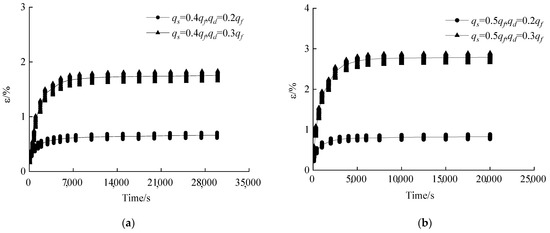
Figure 6.
Strain–time curves (σ3 = 100 kPa). (a) qs = 0.4 qf; (b) qs = 0.5 qf.
Figure 7 shows the strain amplitude under the following numbers of cycles: 1, 10, 1000 and 2000. It can be seen that the maximum value of strain decreases with the number of cycles. The strain decreases rapidly at the beginning of the curve and slowly at the end of the curve. At the same time, when the cyclic deflection stress is larger, the strain amplitude is smaller. Moreover, the maximum value of strain is linearly related to the logarithm of the number of cycles. Simultaneously, with increasing cyclic deflection stress, the strain hardening phenomenon becomes more obvious.
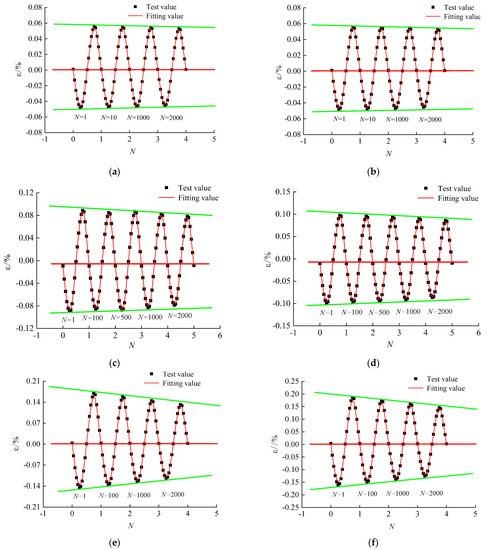
Figure 7.
Development of strain hardening. (a) qs = 0.4 qf, qf = 0.1 qf; (b) qs = 0.5 qf, qf = 0.1 qf; (c) qs = 0.4 qf, qd = 0.2 qf; (d) qs = 0.5 qf, qd = 0.2 qf; (e) qs = 0.4 qf, qd = 0.3 qf; (f) qs = 0.5 qf, qd = 0.3 qf.
3. Strain Softening and Hardening Index
3.1. Strain Softening Index
When the static deflection stress is zero, the value of cyclic cumulative strain is low and the strain develops present strain softening phenomenon. It can be seen from Figure 8 that when the static deflection stress is 0, the gradient of the hysteresis loops of the Nth cycle number was smaller than the gradient of the hysteresis loops of the first cycle number. As a result, the gradient of the hysteresis loops decreases constantly with the number of cycles. Therefore, the strain development of soil exhibits the strain softening phenomenon.
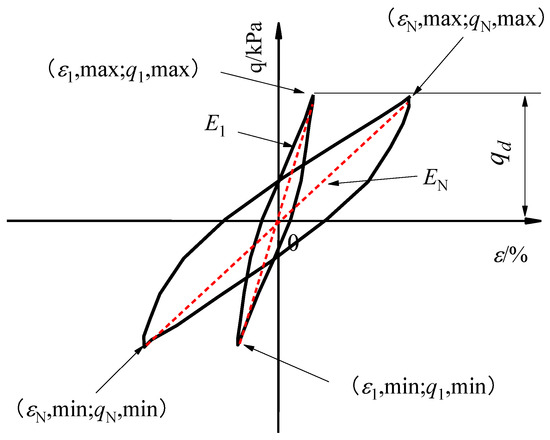
Figure 8.
Strain softening phenomenon.
The gradient of the hysteresis loops of the Nth cycle is expressed as follows:
where qN,max and qN,min are the maximum and minimum deflection stresses; εN,max and εN,min are the maximum and minimum deflection strains.
The strain softening index can be expressed as follows:
According to the test results, the softening index has a certain relationship with the development of the number of cycles. To realize the strain softening phenomenon using the finite element method, a strain softening index was proposed to describe the strain softening process of soil by considering the factor of the static deflection stress and cyclic deflection stress. Therefore, the strain softening index can be described as follows:
where α, n1, n2 and n3 are the fitting parameters. The value of α is 0.16, the value of n1 is 3.6, the value of n2 is 7.64, and the value of n3 is 0.02; w is the cyclic frequency; qf is ultimate strength of soil; qs is the static deflection stress; qd is the cyclic deflection stress; and qa is the reference stress.
The strain softening index and fitting results under different cyclic deflection stresses and different static deflection stresses are shown in Figure 9. It can be observed that the strain–time curve obtained by the strain softening index is consistent with the test results. Therefore, the strain softening index is able to accurately describe the strain softening phenomenon.
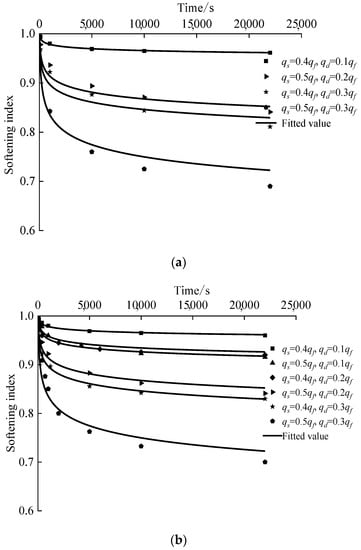

Figure 9.
Strain softening index–time curves. (a) σ3 = 50 kPa; (b) σ3 = 100 kPa; (c) σ3 = 150 kPa.
3.2. Strain Hardening Index
Figure 10 shows that the strain increment decreases with increasing number of cycles. Figure 11 shows that with increasing number of cycles, the hysteresis loops gradually incline toward the strain reverse direction. The maximum and minimum strains decrease with decreasing number of cycles. As a result, the shear modulus of soil is constantly increasing with increasing number of cycles. Therefore, the strain development of soil exhibits the strain hardening phenomenon.
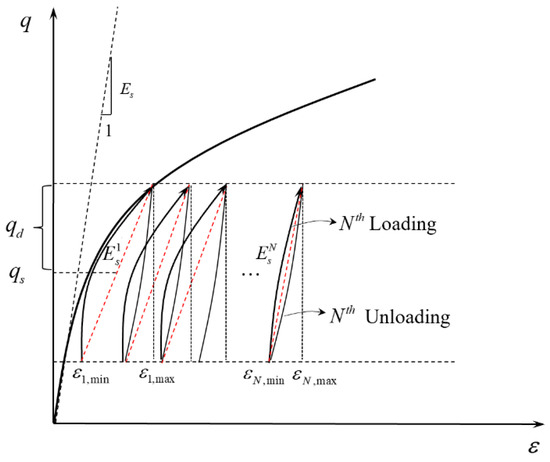
Figure 10.
Stress–strain relationship.
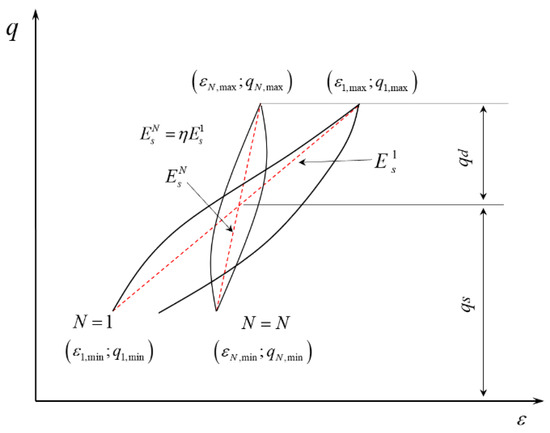
Figure 11.
Strain hardening phenomenon.
The strain hardening index is proposed to describe the strain hardening processes. The strain hardening index can be expressed as follows:
where is the soil shear modulus of the first cycle; is the soil shear modulus of the Nth cycle; is the maximum strain in the first cycle; is the minimum strain in the first cycle; is the maximum strain in the Nth cycle; is the minimum strain in the Nth cycle.
To analyze the hardening index, the strain hardening index in consideration of the cyclic deflection stress and static deflection stresses was expressed as follows:
where α, n1, n2 and n3 are the fitting parameters. The value of α is 0.14, the value of n1 is 3.8, the value of n2 is 7.58, and the value of n3 is 0.018; w is the cyclic frequency; qf is the ultimate strength of the soil; qs is the static deflection stress; qd is the cyclic deflection stress; and qa is the reference stress.
The strain hardening index fitting results under different cyclic deflection stresses and different static deflection stresses are shown in Figure 12. The strain hardening index fitting results are consistent with the test results. It can be observed that the strain hardening index is able to accurately describe the strain hardening phenomenon of soil.
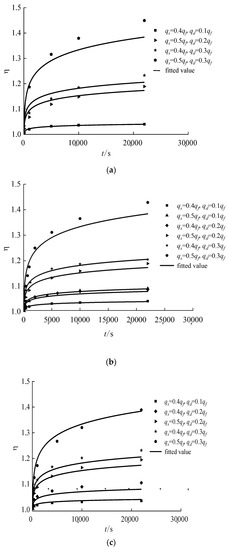
Figure 12.
Strain hardening index–time curves. (a) σ3 = 50 kPa; (b) σ3 = 100 kPa; (c) σ3 = 150 kPa.
4. Equivalent Cyclic Creep Model
To describe the cyclic cumulative deformation characteristics of soil, an equivalent cyclic creep model is proposed in this paper. As shown in Figure 13, the equivalent cyclic creep model innovatively introduces the stress control switch and strain hardening index into the equivalent cyclic creep model, making it able to effectively describe the cyclic accumulation characteristics and strain hardening characteristics of soil. Therefore, the equivalent cyclic creep model is established as follows:
where σs is the static deflection stress; σcyc is the cyclic deflection stress; E0, E1, η1 are the fitting parameters.
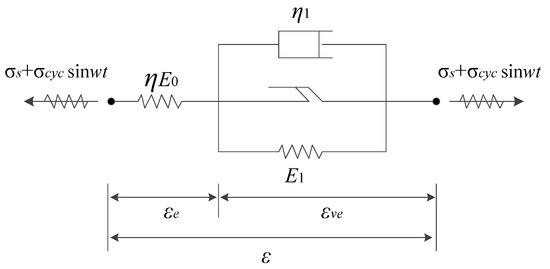
Figure 13.
Equivalent cyclic creep model.
The equivalent cyclic creep constitutive model of soft clay is shown in Equation (7):
where is the total strain at step n; is the instantaneous elastic strain of the Hookean body at step n; is the viscoelastic strain of the Kelvin body at step n; is the viscoelastic strain rate of the Kelvin body at step n; and , , and are the total stress, the stress of the Hookean body, and the stress of the Kelvin body, respectively, at step n.
The expression of stress–strain increment relationship can be expressed as follows:
where is the calculation step size at step n; and is the difference coefficient.
The increment expression of viscoelastic body can be expressed as follows:
where .
For the current incremental step, the Jacobian matrix can be obtained as follows:
where the is the Jacobian matrix in ABAQUS.
To verify the correctness of the equivalent creep model in the ABAQUS subroutine, some the test results were selected to compare them with the finite element results. It can be seen from Figure 14, Figure 15 and Figure 16 that the results obtained using the proposed method are in reasonably good agreement with the test results. Therefore, the equivalent cyclic creep model can be used to analyze the strain accumulation and strain hardening process of soft clay.
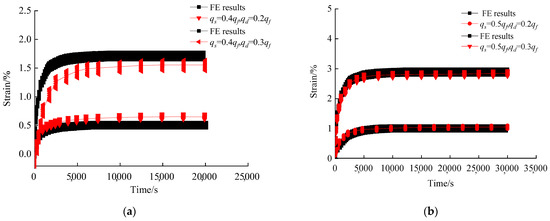
Figure 14.
Cumulative cycle–strain curves (σ3 = 50 kPa). (a) qs = 0.4 qf; (b) qs = 0.5 qf.
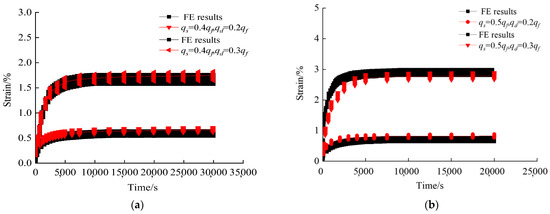
Figure 15.
Cumulative cycle–strain curves (σ3 = 100 kPa). (a) qs = 0.4 qf; (b) qs = 0.5 qf.
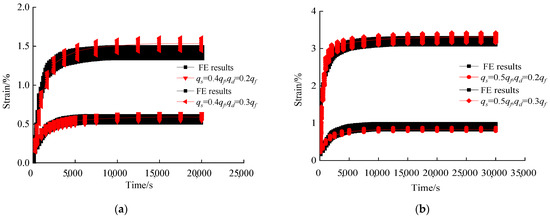
Figure 16.
Cumulative cycle–strain curves (σ3 = 150 kPa). (a) qs = 0.4 qf; (b) qs = 0.5 qf.
In ABAQUS, the diameter of the suction pile model was set to 100 mm, the wall thickness was set to 5 mm and the length was set to 600 mm. The FE model was established using the C3D8 solid element. The equivalent creep model is adopted for soil constitutive. The load direction of suction pile is horizontal. Figure 17 shows the displacement cloud diagram of suction pile following different numbers of cycles. It can be seen that the displacement increases with increasing numbers of cycles.
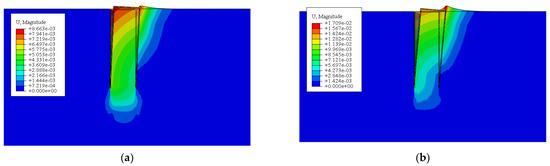
Figure 17.
Cyclic cumulative deformation of suction pile. (a) N = 50; (b) N = 1500.
Figure 18 shows the displacement–time curve of suction pile under different loading conditions. The displacement of the suction pile is small under conditions with low static load ratio and low cyclic load ratio. With increasing cyclic load ratio, the cyclic displacement of the suction pile develops more obviously. The displacement develops rapidly in the early stage, and slowly in the later stage. It can be seen that the cumulative displacement of the caisson increases with increasing cyclic load ratio. Therefore, the equivalent cyclic creep model can be used to analyze the cyclic cumulative deformation characteristics of the suction pile.
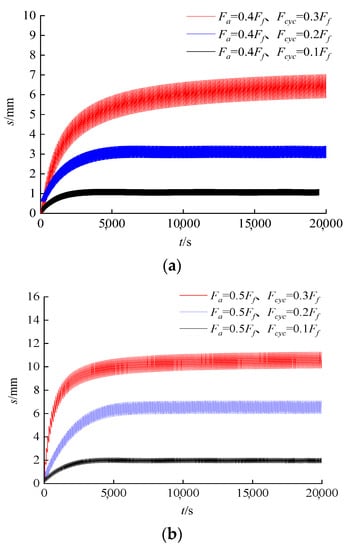
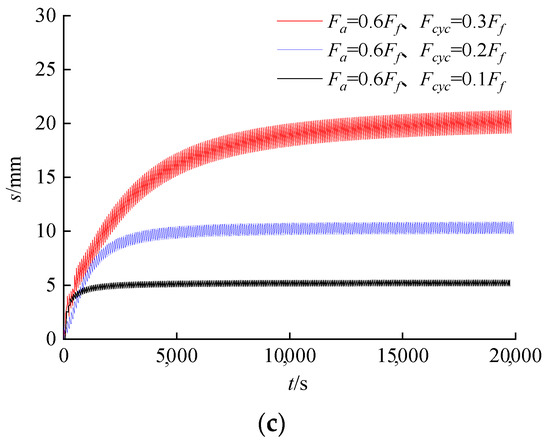
Figure 18.
Displacement–time curve. (a) Fa = 0.4 Ff; (b) Fa = 0.5 Ff; (c) Fa = 0.6 Ff.
Figure 19 shows the displacement accumulation deformation process of the suction pile. With the increase in the number of cyclic loads, the cyclic cumulative deformation of the caisson pile model gradually increases. The results from the proposed method are in reasonably good agreement with the measured results [24]. This provides a new method for analyzing the cyclic characteristics of soil and suction piles.
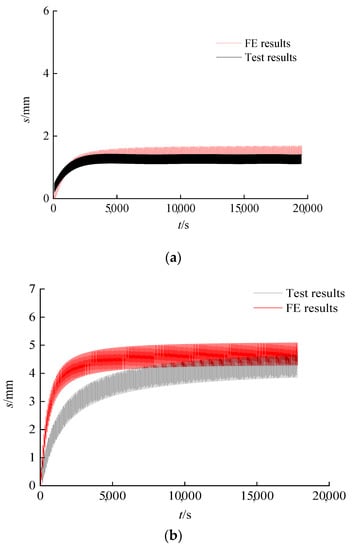
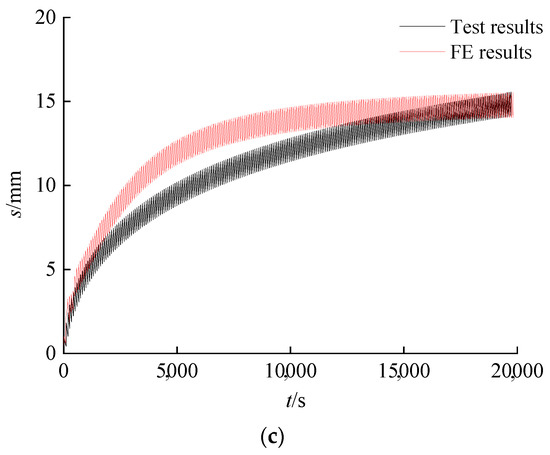
Figure 19.
Displacement–time curve. (a) Fa = 0.4 Ff, Fcyc = 0.1 Ff; (b) Fa = 0.5 Ff, Fcyc = 0.2 Ff; (c) Fa = 0.6 Ff, Fcyc = 0.3 Ff.
5. Conclusions
In this paper, the strain hardening characteristics and strain softening characteristics of soft clay were studied by cyclic triaxial tests. Moreover, an equivalent cyclic creep model was established to describe the strain accumulation and strain hardening characteristics of soil and the cyclic characteristics of the suction pile. The main conclusions obtained were as follows:
- (1)
- In the process of cyclic loading, the strain development not only exhibits the strain softening phenomenon, but also the strain hardening phenomenon, depending on the different values of static deflection stress. Therefore, a strain softening index and strain hardening index were proposed to describe the cyclic characteristics of soil.
- (2)
- An equivalent cyclic creep model was established in consideration of the strain hardening index to describe the cyclic cumulative deformation and strain hardening characteristics of soil. Simultaneously, the results obtained using the proposed method were in reasonably good agreement with the measured results. Therefore, the equivalent cyclic creep model can be used to analyze the strain accumulation and strain hardening process of soft clay.
- (3)
- The equivalent cyclic creep model was applied to analyze the cyclic bearing characteristics of the suction pile. The results show that the finite element results were consistent with the model test results. This can provide a new method for analyzing the cyclic characteristics of soft clay and the cyclic cumulative deformation characteristics of suction piles.
Author Contributions
K.H.: Conceptualization, Methodology, Validation, Formal analysis, Investigation, Data Curation, Writing—Original Draft, Visualization. W.Z.: Investigation, Resources, Data Curation, Writing—Review and Editing, Project administration. X.L.: Conceptualization, Methodology, Validation, Formal analysis, Investigation, Data Curation, Writing—Original Draft, Visualization. Z.Y.: Formal analysis, Investigation, Data Curation. Y.Z.: Investigation, Resources, Writing—Review and Editing, Supervision, Project administration, Funding acquisition. Shu Yan: Writing—Review and Editing. S.Y.: Writing—Review and Editing. X.G.: Writing—Review and Editing. G.D.: Investigation, Resources, Data Curation, Project administration. All authors have read and agreed to the published version of the manuscript.
Funding
This work was supported by the National Natural Science Foundation of China (grant numbers 52208333, 51878160, 52078128), the Jiangsu Province Excellent Postdoctoral Funding Program (grant number 2022ZB135); and the Postdoctoral Innovation Talent Fund (grant number 2242022R20025). This work was supported by the science and technology program of China Huaneng Group (HNKJ20-H53; CERI/TF-20-HJK09; HNKJ19-H17). The authors are grateful for their support. The authors thank the Big Data Center of Southeast University for providing the facility support on the numerical calculations in this paper.
Institutional Review Board Statement
Not applicable.
Informed Consent Statement
Not applicable.
Data Availability Statement
The data used to support the findings of this study are included within the article.
Conflicts of Interest
The author declares no conflict of interest.
References
- Zhang, Y.; Andersen, K.H.; Jeanjean, P. Verification of a framework for cyclic p-y curves in clay by hindcast of Sabine River, SOLCYP and centrifuge laterally loaded pile tests. Appl. Ocean Res. 2020, 97, 102085. [Google Scholar] [CrossRef]
- Kong, D.; Liu, Y.; Deng, M.; Zhao, X. Analysis of influencing factors of lateral soil resistance distribution characteristics around monopile foundation for offshore wind power. Appl. Ocean Res. 2020, 97, 102106. [Google Scholar] [CrossRef]
- Tong, D.; Liao, C.; Jeng, D.S.; Wang, J. Numerical study of pile group effect on wave-induced seabed response. Appl. Ocean Res. 2018, 76, 148–158. [Google Scholar] [CrossRef]
- Zhang, Y.; Andersen, K.H.; Jeanjean, P.; Mirdamadi, A.; Gundersen, A.S.; Jostad, H.P. A framework for cyclic p-y curves in clay and application to pile design in GoM. In Proceedings of the OSIG SUT Conference, London, UK, 12–14 September 2017. [Google Scholar]
- Andersen, K.H. Bearing capacity under cyclic loading-offshore, along the coast, and on land. Can. Geotech. J. 2009, 5, 513–535. [Google Scholar] [CrossRef]
- Huo, H.F.; Lei, H.Y. Cyclic properties of normal consolidated clay under coupled effect of static and dynamic stresses. Chin. J. Rock Mech. Eng. 2015, 34, 1288–1295. [Google Scholar]
- Mitchell, R.J.; King, R.D. Cyclic loading of an Ottawa area champlain sea clay. Can. Geotech. J. 2011, 1, 52–63. [Google Scholar]
- Liu, X.M. Experimental Study on Characteristics of K0-Consolidated Stiff Clay under Traffic Loading Conditions; Zhejiang University: Hangzhou, China, 2020. [Google Scholar]
- Zhuang, H. Experimental Study on Cyclic Behavior of Wenzhou Reconstituted Soft Clay under Different Stress Histories; Wenzhou University: Wenzhou, China, 2021. [Google Scholar]
- Zhou, J.; Gong, X.N. Study on strain softening insaturated soft clay under cyclic loading. China Civ. Eng. J. 2000, 6, 75–78. [Google Scholar]
- Matasovic, N.; Vucetic, M. A pore pressure model for cyclic straining of clay. Soils Found. 1992, 3, 156–173. [Google Scholar] [CrossRef]
- Yao, M.L.; Nie, S.L.L. A model for calculation deformation of saturated soft clay. Chin. J. Hydraul. Eng. 1994, 7, 51–55. [Google Scholar]
- Cai, Y.Q.; Liu, W.; Xu, C.J.; Huang, H.C. Cyclic stress-strain relationship of soft clay based on modified Iwan model. Chin. J. Geotech. Eng. 2007, 9, 1314–1319. [Google Scholar]
- Idriss, I.M.; Singh, R.D.; Dobry, R. Nonlinear behavior of soft clays during cyclic loading. J. Soil Mech. Found. 1978, 12, 1427–1447. [Google Scholar] [CrossRef]
- Wang, J.; Cai, Y.Q. Study on accumulative plastic under cyclic strain model of soft clay loading. Chin. J. Rock Mech. Eng. 2008, 2, 331–338. [Google Scholar]
- Monismith, C.L.; Ogawa, N.; Freeme, C.R. Permanent deformation characteristics of subgrade soils due to repeated loading. Transp. Res. Rec. 1975, 537, 1–17. [Google Scholar]
- Li, D.; Selig, E.T. Cumulative plastic deformation for fine-grained subgrade soil. J. Geotech. Eng. 1996, 12, 1006–1013. [Google Scholar] [CrossRef]
- Chai, J.C.; Miura, N. Traffic-load-induced permanent deformation of road on soft subsoil. J. Geotech. Geo. Eng. 2002, 11, 907–916. [Google Scholar] [CrossRef]
- Huang, M.S.; Li, J.J.; Li, X.Z. Cumulative deformation behavior of soft clay in cyclic undrained tests. Chin. J. Geotech. Eng. 2006, 7, 891–895. [Google Scholar]
- Hyde, A.F.L.; Brown, S.F. The plastic deformation of a silty clay under creep and repeated loading. Geotechnique 1976, 1, 173–184. [Google Scholar] [CrossRef]
- Yasuhara, K.; Hirao, K.; Hyde, A.F. Effects of cyclic loading on undrained strength and compressibility of clay. Soils Found. 1992, 1, 100–116. [Google Scholar] [CrossRef]
- Wang, Y.Z.; Qi, J.L.; Dong, Y.H.; Long, Y.C. Research on cumulative deformation of saturated soft clay under cyclic loads. J. Waterw. Harb. 2017, 3, 286–290. [Google Scholar]
- Zhu, D.F.; Huang, H.W.; Yin, J.H. Cyclic creep behavior of saturated soft clay. Chin. J. Geotech. Eng. 2005, 9, 1060–1064. [Google Scholar]
- Zhu, W.B.; Dai, G.L.; Wang, B.C.; Gong, W.M.; Sun, J.; Hu, H. Study on cyclic characteristics and equivalent cyclic creep model of the soft clay at the bottom of suction caisson foundation. Rock Soil Mech. 2022, 43, 466–478. [Google Scholar]
Publisher’s Note: MDPI stays neutral with regard to jurisdictional claims in published maps and institutional affiliations. |
© 2022 by the authors. Licensee MDPI, Basel, Switzerland. This article is an open access article distributed under the terms and conditions of the Creative Commons Attribution (CC BY) license (https://creativecommons.org/licenses/by/4.0/).