Article

Temporal and Spatial Pattern Evolution and Influencing Factors of the National Comprehensive Disaster-Reduction Demonstration Community in China

1
School of Geography and Tourism, Qufu Normal University, Rizhao 276826, China
2
Center for Land Studies, Qufu Normal University, Rizhao 276826, China
*
Author to whom correspondence should be addressed.
Sustainability 2022, 14(22), 15238; https://doi.org/10.3390/su142215238
Submission received: 8 October 2022 / Revised: 23 October 2022 / Accepted: 15 November 2022 / Published: 17 November 2022

Abstract

:
A comprehensive disaster-reduction demonstration community (CDRDC) is imperative for building community resilience when confronted with disasters. However, the temporal characteristics and spatial heterogeneity of CDRDC in China are rarely involved in relevant research, and the influencing factor selection dimension is relatively singular. Based on the list of CDRDCs in China from 2008 to 2020, this study analyzed the spatial–temporal evolution pattern of CDRDCs at different scales and explored the correlation between CDRDCs and influencing factors such as population, GDP, disaster frequency and natural disaster risk. We also deduced the theoretical distribution and the key development areas of CDRDCs, analyzed the problems faced by the establishment of CDRDCs in different regions of China, and put forward targeted optimization countermeasures for community-based disaster mitigation. The results are as follows: (1) The distribution of CDRDCs shows significant regional differences, with 50% concentrated in the eastern region. (2) The number of CDRDCs is closely related to population, GDP, and natural disaster risk, but it has a poor correlation with disaster frequency. (3) The capital circle, the Yangtze River Delta, the Pearl River Delta, eastern Fujian, and eastern Hubei will be the key development areas of CDRDCs in the future. The research results can provide a theoretical basis and technical support for the layout optimization of CDRDCs in China.

1. Introduction

China is one of the countries with the most serious natural disasters in the world [1]. In recent years, the frequency and severity of extreme weather events such as droughts, wildfires, storms, floods, and heatwaves have increased under the continuous influence of global climate change and human activities, causing a large number of casualties and property losses [2,3]. According to the annual disaster statistics released by the National Disaster Reduction Center of China, between 2015 and 2021, there were 950 deaths and 150 million people affected by natural disasters every year, resulting in CNY 338.8 billion in direct economic losses [4]. Hence, effectively improving community resilience and reducing disaster risks has become a hot issue.
The U.S. Federal Emergency Management Agency (FEMA) first proposed the concept of a “disaster-resistant community” in 1996, which considered the community to be the basic unit of disaster prevention and mitigation [5]. The “disaster-resistant community” undertakes pre-disaster preparation, disaster relief, and post-disaster reconstruction, aiming to minimize casualties and economic losses when faced with natural disasters [6]. Hence, research on community-based disaster mitigation (CBDM) has drawn much attention in recent years [7,8,9,10,11]. The Comprehensive Disaster Reduction Demonstration Community (CDRDC) plays an important role in CBDM. Some countries have begun to build disaster-reduction communities, with the “disaster-resistant community” in the United States [5] and the “disaster prevention community” in Japan [12] as the main representatives. There are obvious regional differences in the infrastructure of urban and rural communities in China. In addition, the awareness and ability of Chinese community residents to reduce disasters are weak as the main representative [13]. To fundamentally change the above situation of the CBDM, the Ministry of Emergency Management and the Ministry of Civil Affairs of China have organized the establishment of the CDRDC every year since the Wenchuan earthquake in 2008. By the end of 2020, a total of 14,512 communities were included in the CDRDC list. However, studies on the CDRDC itself are lacking [14]. Since the establishment of CDRDCs in China, what kind of evolution characteristics have their spatial–temporal pattern presented, which influencing factors affect the development and how the future distribution trend will develop need to be further studied.
Therefore, based on the CDRDC list of China during the period 2008–2020, this paper analyses the evolution of the spatial–temporal pattern of CDRDC, explores its correlation with population, GDP, disaster frequency and natural disaster risk, and estimates the theoretical distribution and key development areas of CDRDC. Finally, the problems faced by the establishment of the CDRDC were analyzed in different regions of China, and targeted optimization countermeasures for the CBDM were proposed. The results provide a reference for optimizing the layout of CDRDCs, optimizing the allocation of disaster reduction resources, improving disaster reduction capacity building, and formulating disaster prevention and reduction plans.

2. Literature Review

2.1. Community-Based Disaster Mitigation (CBDM)

Research hotspots of CBDM mainly focus on community-based disaster risk management [15,16,17], community-based disaster risk reduction [18,19,20], community resilience drivers [21], barriers [22] and building [23], community disaster risk [24,25] and vulnerability [26,27] assessment, community disaster reduction capability evaluation [28,29,30], public participation [31,32,33], especially gendered participation in CBDM [34,35]. For example, Hosseini and Izadkhah [15] found that earthquake drills and community-based disaster risk management programs are highly beneficial for strengthening preparedness in Iran. By analyzing the failures in disaster management, Imperiale and Vanclay [22] identified the cultural and political barriers to enhancing disaster risk reduction and community resilience. Islam et al. [26] integrated two models for prioritizing the hazards, their vulnerability risks, and mitigation challenges in the community of Matlab municipality in Bangladesh. The Qijiawan community of the Hui people in Nanjing was taken as an example in order to build an evaluation index system of the disaster reduction ability of ethnic minority aggregation areas [28]. Based on a randomized survey in China, Duan et al. [31] employed a structural equation model to study the influencing factors of public participation in meteorological disaster prevention and mitigation.
As mentioned above, community-based disaster risk, community resilience, community-based disaster vulnerability, community disaster reduction capacity, public participation, etc., are all factors that need to be considered in the CDRDC creation criteria. The separate research on the influencing factors of CDRDC has gradually matured. At the same time, the correlation between the influencing factors and CDRDC is also urgent to clarify.

2.2. Path for CBDM

There are many specific paths for CBDM, including the construction of CDRDCs, disaster shelters and disaster supplies warehouses, which can facilitate the implementation of some directional risk reduction plans.
With extensive attention to disaster problems, the research on the optimization of disaster shelters and relief materials has gradually increased. Among them, the planning principles and indicators and suitability evaluation research are concerned in the early stage. The current research focuses on site selection models and optimization algorithms and has carried out a lot of research work. For example, Ma et al. [36] reviewed site selection optimization models for location-allocation problems associated with natural disaster shelters. Boonmee et al. [37] reviewed optimization models for emergency humanitarian logistics facility location problems. Heuristic algorithms such as particle swarm optimization algorithm [38,39,40,41,42,43,44], genetic algorithm [45,46,47,48,49], simulated annealing algorithm [50,51], firefly algorithm [52], and ant colony optimization algorithm [53] can effectively solve the above location-allocation problems.
In contrast, there is a lack of research on CDRDCs compared with disaster shelters and disaster supplies warehouses. Based on the CDRDC list from 2008 to 2011, Zhou et al. [54] analyzed the temporal and spatial pattern of CDRDC and its dynamic characteristics at the county scale. A quantitative model was constructed to regress the relationship between the number of CDRDCs and population density, GDP per capita, and the frequency of natural disasters during 1949–2010 in most counties of China. Based on the CDRDC list from 2008 to 2017, combined with local disaster information, social-economic data and other data sources, Wu et al. [3] analyzed the spatial–temporal distribution characteristics of CDRDCs in the past ten years and quantified the demonstration benefits and disaster reduction benefits of this project. In addition to the most basic temporal and spatial pattern, more efforts should be devoted to the research of influencing factor analysis, suitability evaluation, and layout optimization for CDRDC.

3. Materials and Methods

3.1. Data

The research data in this paper mainly include the CDRDC list data, disaster frequency data, natural disaster risk data, and socioeconomic data in China (Table 1).

3.2. Methodology

3.2.1. Framework

First, a comprehensive database of CDRDCs is built based on three types of research data: CDRDC list, socioeconomic data and disaster data. Then, with the help of the spatial analysis function of GIS, the spatial–temporal pattern of the CDRDC at the provincial, municipal and county scales is drawn, and the spatial correlation between the total number of CDRDCs and influencing factors such as population, GDP, and natural disaster risk is analyzed by superposition. To further understand the relationship between CDRDCs and these influencing factors, the stepwise regression method is used to construct their regression relationship, and the theoretical distribution and key development areas of CDRDCs are deduced accordingly. Finally, the problems faced by the establishment of the CDRDCs in different regions of China are analyzed, and targeted optimization countermeasures for the CBDM are put forward accordingly (Figure 1).

3.2.2. Correlation Analysis

The establishment of CDRDCs should take disaster risk into account. Therefore, four factors related to disaster risk are selected to estimate the number of CDRDCs, and the stepwise regression method is employed here to construct the regression relationship between CDRDC and population, GDP, disaster frequency and natural disaster risk (Equation (1)). Once the theoretical number of CDRDCs is estimated, the key development areas of CDRDCs are predicted based on the estimated high-value areas of CDRDCs.
The idea of the stepwise regression method is to introduce the independent variables one by one and then test the significance of each variable in the regression equation, eliminating the insignificant independent variables meanwhile. We then repeat the above introducing and eliminating steps until the independent variables in the regression model have a significant impact on the dependent variables. Finally, we establish the optimal multiple regression equation. The specific steps are as follows:
Step 1: We establish a univariate regression model between regression independent variables x1, x2, …, xp and the dependent variable y, respectively:
y = β0 + βixi, i = 1, …, p
And then, we calculate the value of the F test statistic for the regression coefficient of the variable xi, denoted by F1(1), …, Fp(1), taking the maximum value F i 1 (1) = max{F1(1), …, Fp(1)}.
For a given significance level α, the corresponding critical value is denoted by F(1). If F i 1 (1)F(1), x i 1 is introduced into the regression model, eliminate x i 1 otherwise.
Step 2: We establish a binary regression model between the p-1 independent variable subsets { x i 1 , x 1 }, …, { x i 1 , x i 1 1 }, { x i 1 , x i 1 + 1 }, …, { x i 1 , x p } and the dependent variable y. F i 2 (2)=max{F1(2), …, F i 1 1 (2), F i 1 + 1 (2), …, Fp(2)} is calculated then. Likewise, if F i 2 (2)F(2), x i 2 is introduced into the regression model, eliminate x i 2 otherwise.
By analogy, the independent variable subset { x i 1 , x i 2 , …, x k } and their regression coefficient are gradually determined.

4. Results

4.1. Spatial–Temporal Pattern of CDRDC

4.1.1. Temporal Pattern of CDRDC

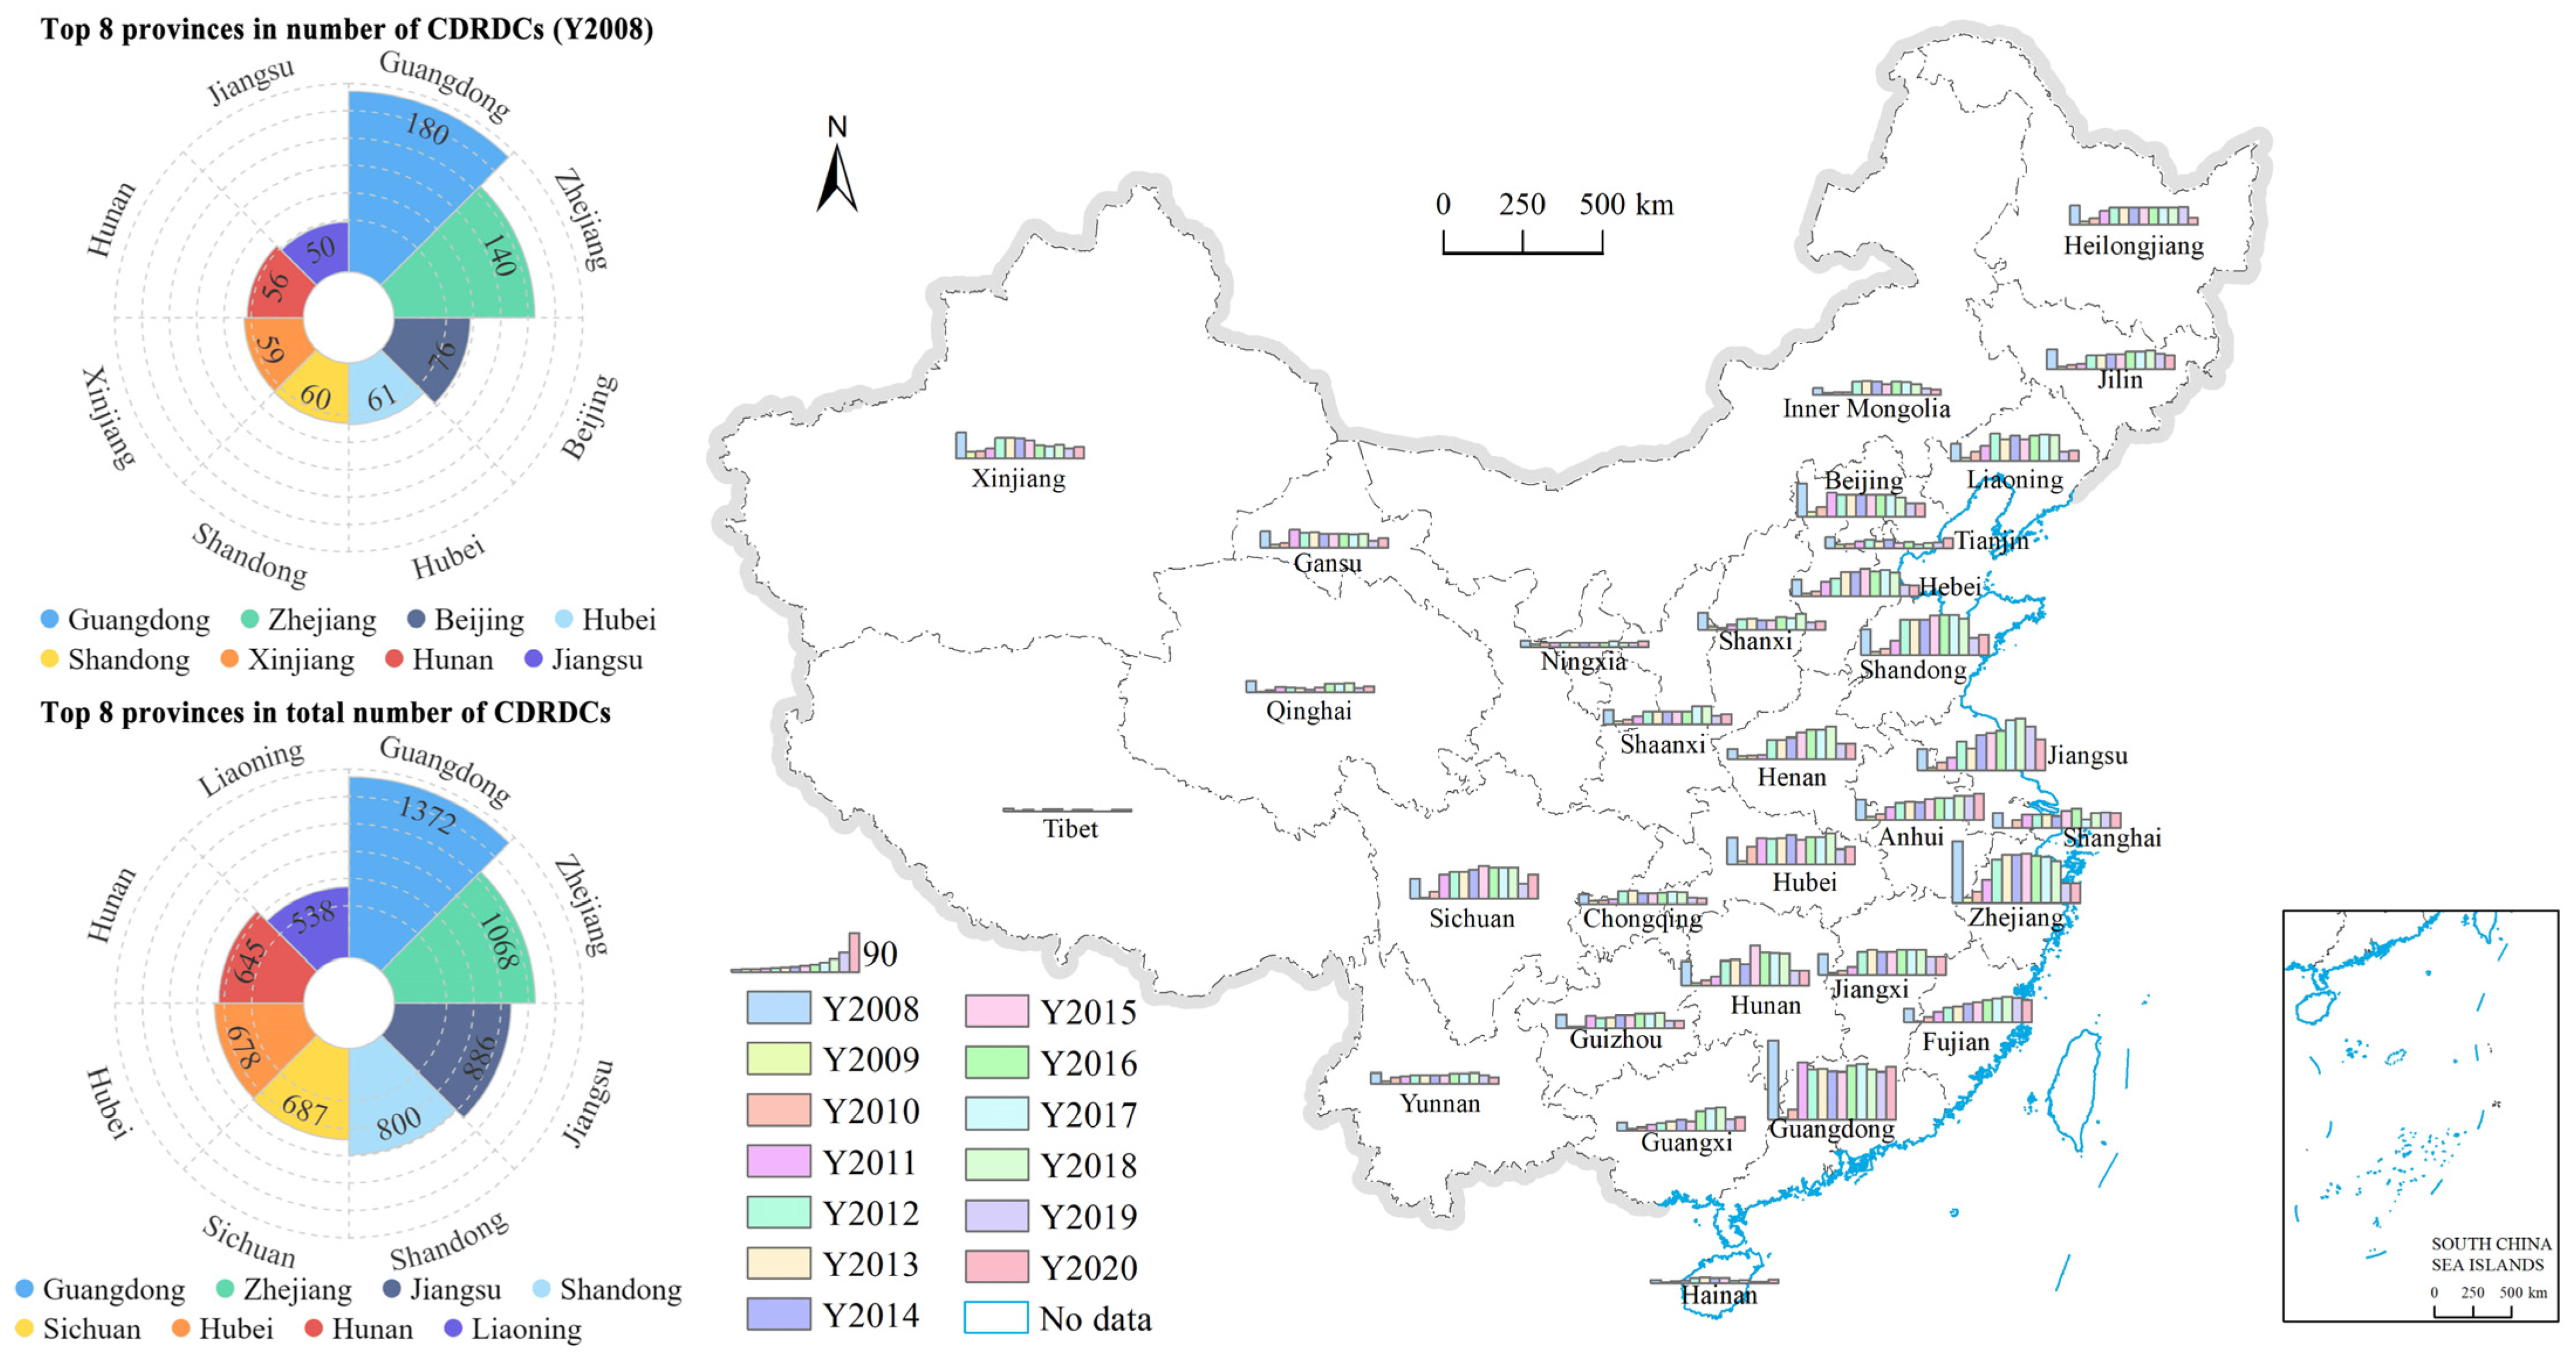
From 2008 to 2020, the number of CDRDCs continued to increase, with 2011–2018 being a period of rapid growth, and more than 1000 CDRDCs were established every year. After 2018, the total number of CDRDCs in each province continued to grow steadily after a slight decline (Figure 2, Table 2). The establishment process of the CDRDC strictly follows the goals and requirements of the National Comprehensive Disaster Prevention and Mitigation Plan (NCDRMP) of China. During the “12th Five-Year Plan” and “13th Five-Year Plan” periods, the numbers of new CDRDCs were 7426 and 6398, respectively, and both exceeded the target of 5000 increments required in the NCDRMP in the same period. Recently, the State Council of China issued the “14th Five-Year Plan for National Emergency Response System”. During the “14th Five-Year Plan” period, the establishment of CDRDCs was still steadily increasing, with the target of adding more than 3000 CDRDCs.

4.1.2. Spatial Pattern of CDRDC

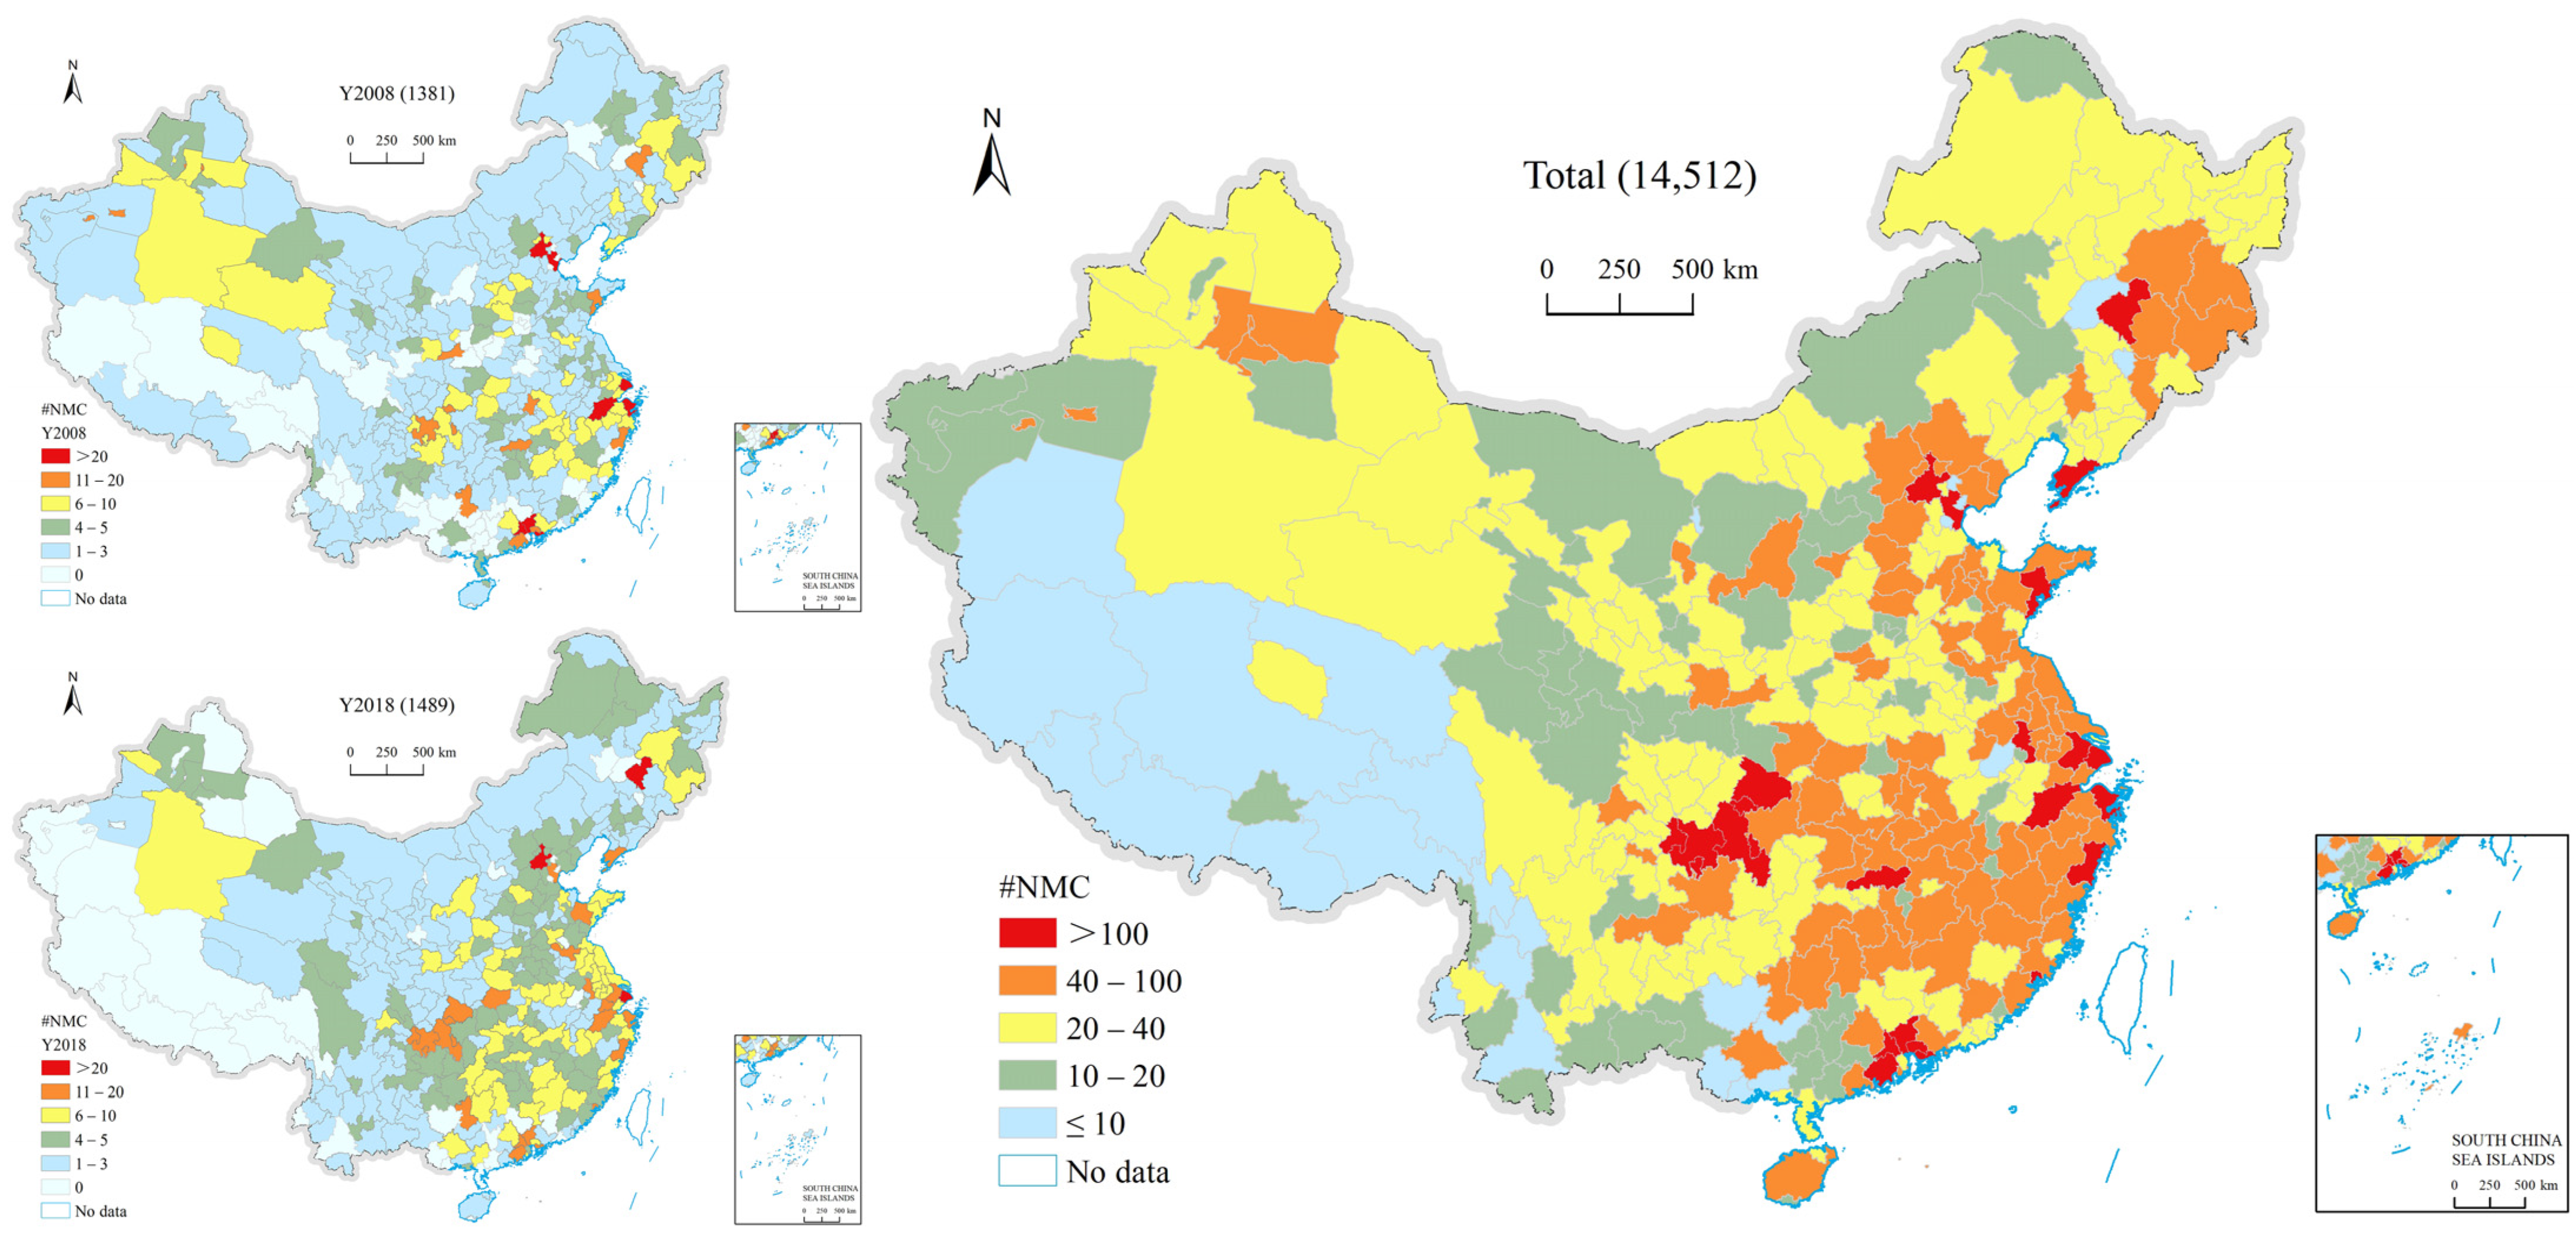
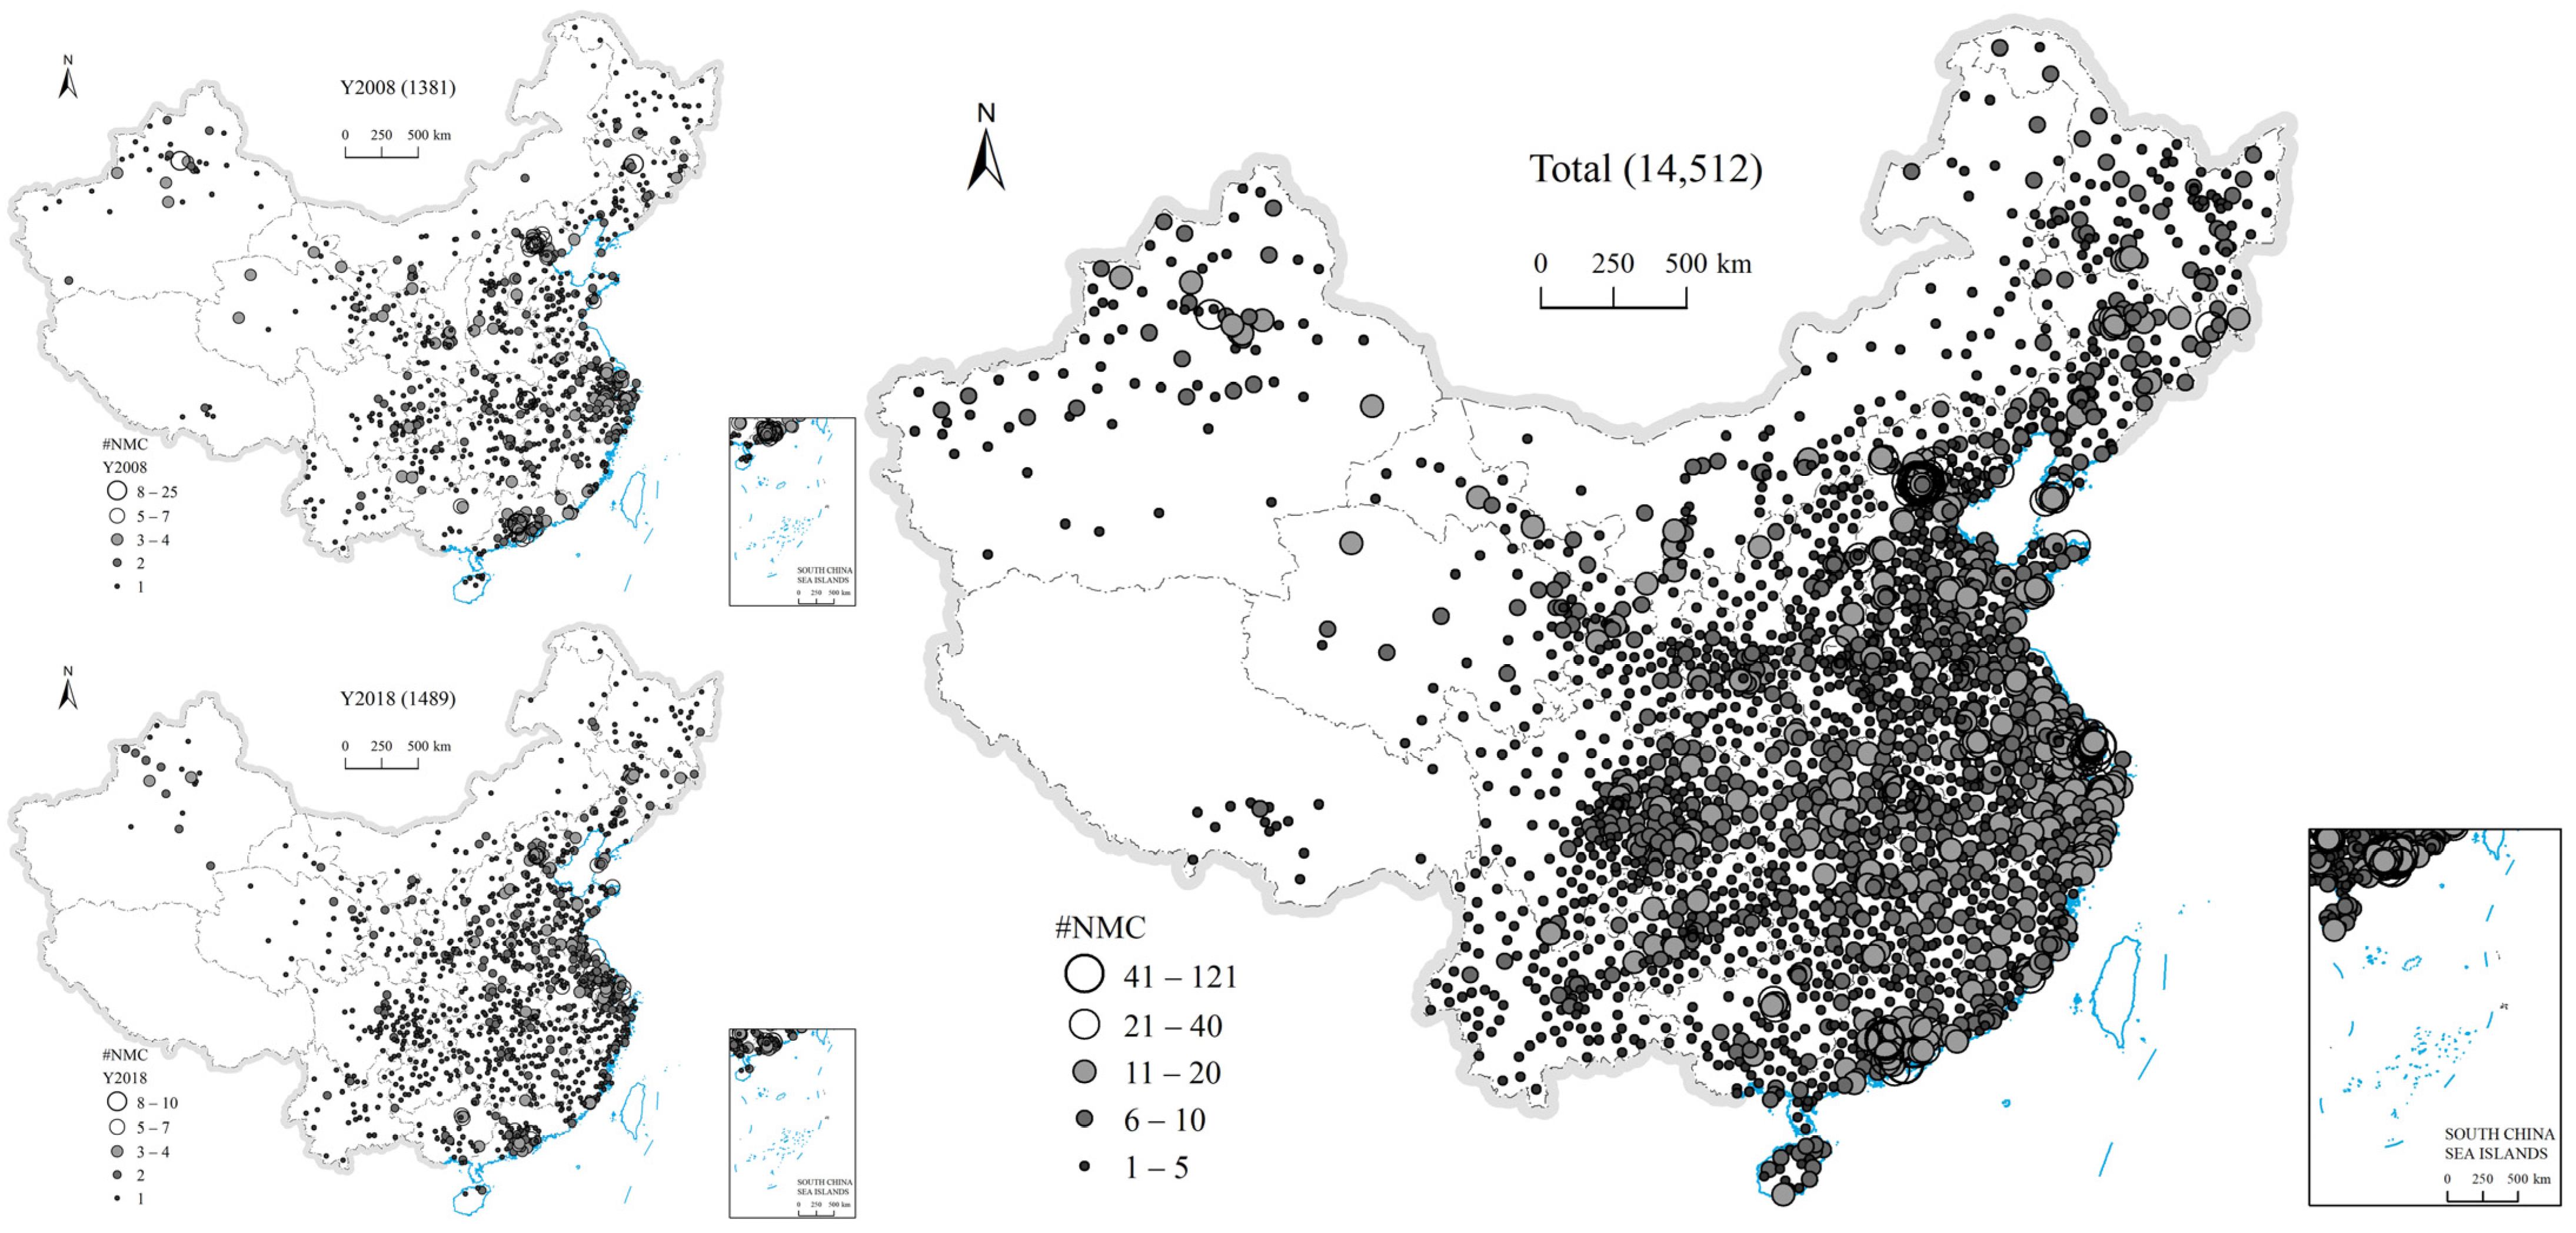
Combining the spatial patterns of CDRDCs at the provincial, municipal and county scales (Figure 2, Figure 3 and Figure 4), we can see that by the end of 2020, (1) CDRDCs have achieved full coverage at the provincial scale. Only Nagqu and Ngari in Tibet have not yet been established at the municipal scale. The county-level coverage rate reached 88%. (2) The CDRDC has experienced the spatial–temporal evolution pattern of “first east and then west—the central region rises—east, central and western regions advance together”, and the distribution range has expanded significantly. (3) The provinces with the fastest increasing number of CDRDCs are mainly located in the eastern coastal areas, followed by Sichuan Province and the central region. There are 8 provinces in China with more than 500 CDRDCs. These 8 provinces have a total of 6082 CDRDCs, accounting for approximately 42% of the national total. The number of CDRDCs in Tibet, Ningxia, Qinghai, and Hainan Provinces increased slowly (Figure 2, Table 2). (4) In addition to the four municipalities of Beijing, Tianjin, Shanghai and Chongqing, there are 15 other cities with a total of more than 100 CDRDCs, and these are mainly located in coastal areas, where 15% of China’s CDRDCs are concentrated in less than 3% of the land area (Figure 3, Table 3). (5) The CDRDCs are concentrated in the eastern region of China, with the Hu Huanyong line as the boundary (Figure 4). There are 74 counties in the CDRDC high-density area (counties with a total of more than 20 CDRDCs), which are concentrated in the Pearl River Delta, the capital circle, and the Yangtze River Delta region. The total number of CDRDCs in these regions reaches 2284, accounting for 16% of the national total (Table 4).

4.2. Spatial Correlation of CDRDCs with Influencing Factors

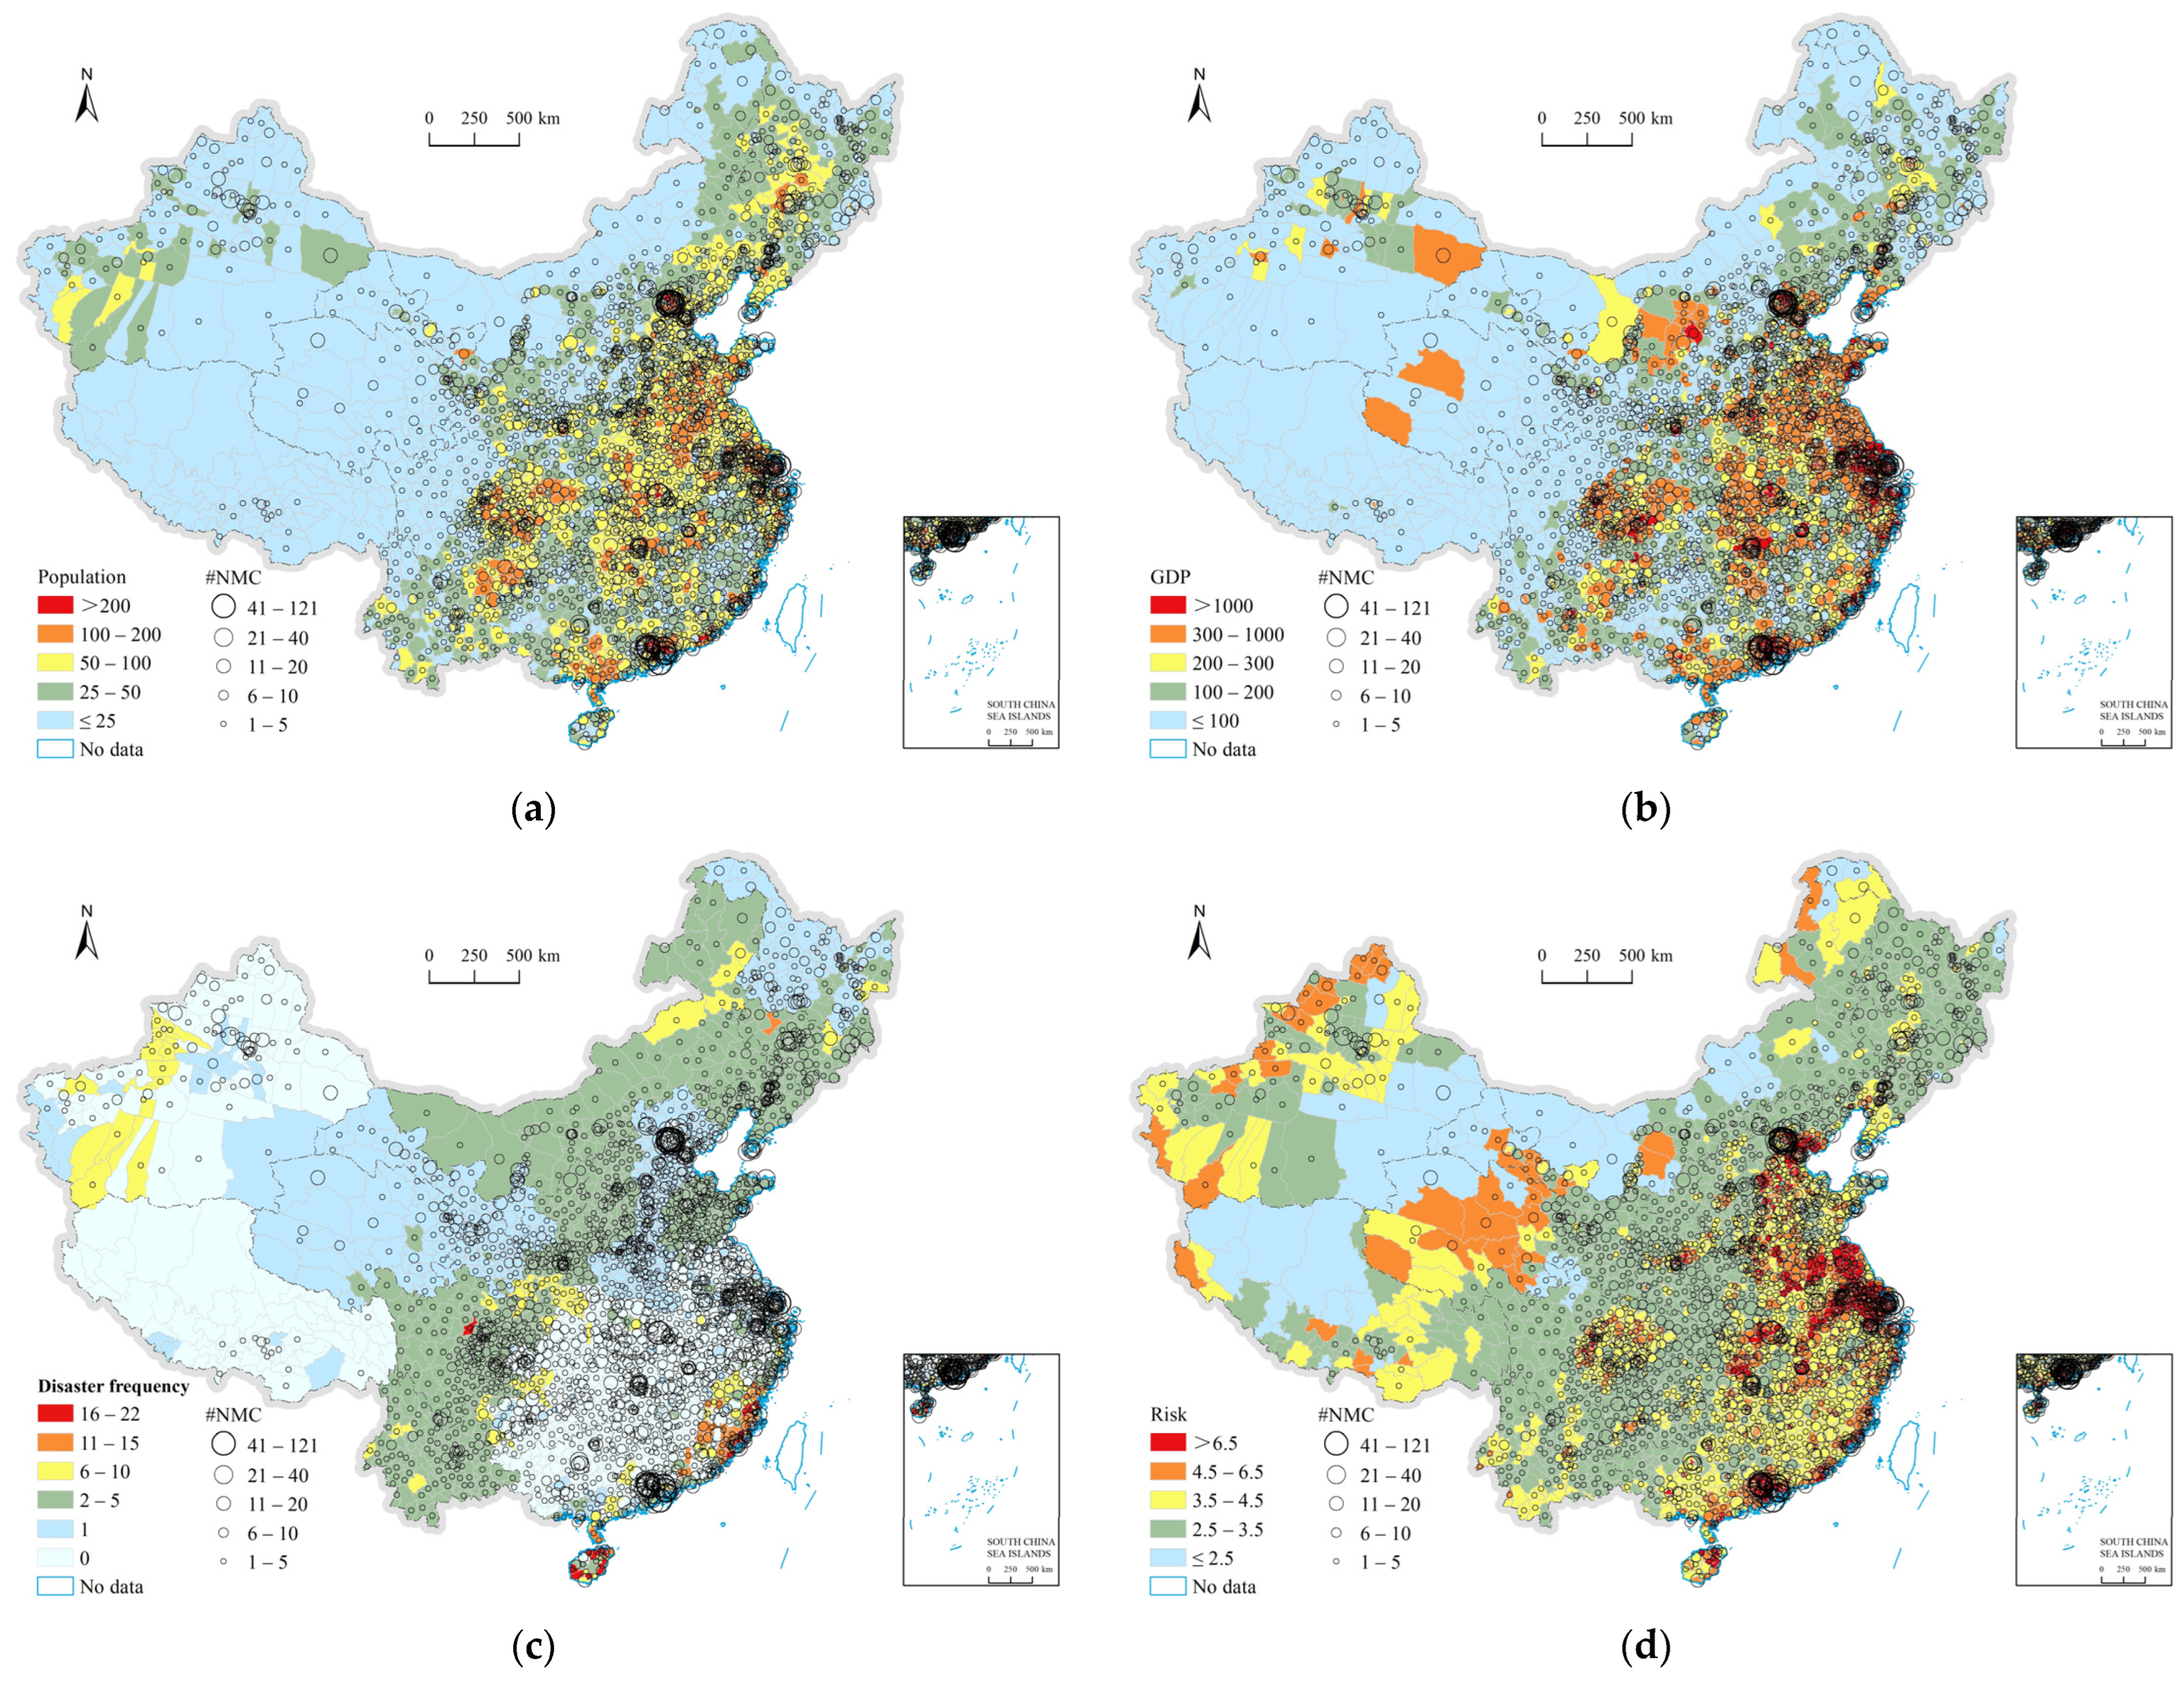
By superimposing CDRDC with population, GDP, disaster frequency and natural disaster risk, the spatial correspondence among them is shown in Figure 5. Overall, CDRDC has a good spatial correspondence with population, GDP, and natural disaster risk, but there are regional differences. In eastern China, the spatial correspondence between CDRDC and population, GDP, and natural disaster risk is completely consistent, especially in the capital circle, the Yangtze River Delta, and the Pearl River Delta. In the central region of China, such as Hunan and Hubei, with high natural disaster risk, dense population and relatively developed economy, the establishment of CDRDCs is relatively sufficient. In western China, the spatial correspondence between CDRDC and GDP, population, and natural disaster risk is not completely consistent. The establishment of CDRDCs in most areas with high GDP, population, and natural disaster risk is relatively backward.
In contrast, CDRDCs have poor spatial correspondence with disaster frequency (Figure 5c), and there are also regional differences. In eastern China, the spatial distribution of CDRDCs in the Pearl River Delta has good correspondence with disaster-prone areas (disaster frequency > 5). On the one hand, the disaster frequency in the Bohai Rim and the Yangtze River Delta is relatively low, while a large number of CDRDCs are created here. On the other hand, Fujian and Hainan are disaster-prone areas with high disaster frequency, and their coastal areas are densely populated and economically developed, but the number of CDRDCs is relatively insufficient. In the central region of China, Hunan, Hubei, Jiangxi, Anhui, and Henan provinces have lower disaster frequencies and more CDRDCs than the western provinces. In western China, the junction of Sichuan and Shaanxi and the junction of Sichuan, Chongqing and Guizhou are disaster-prone areas, while the establishment of CDRDCs is insufficient. Additionally, the number of CDRDCs located in disaster-prone areas in Yunnan and Xinjiang is lower than that with lower disaster frequency in their provinces.

4.3. Theoretical Distribution and the Key Development Areas of CDRDC

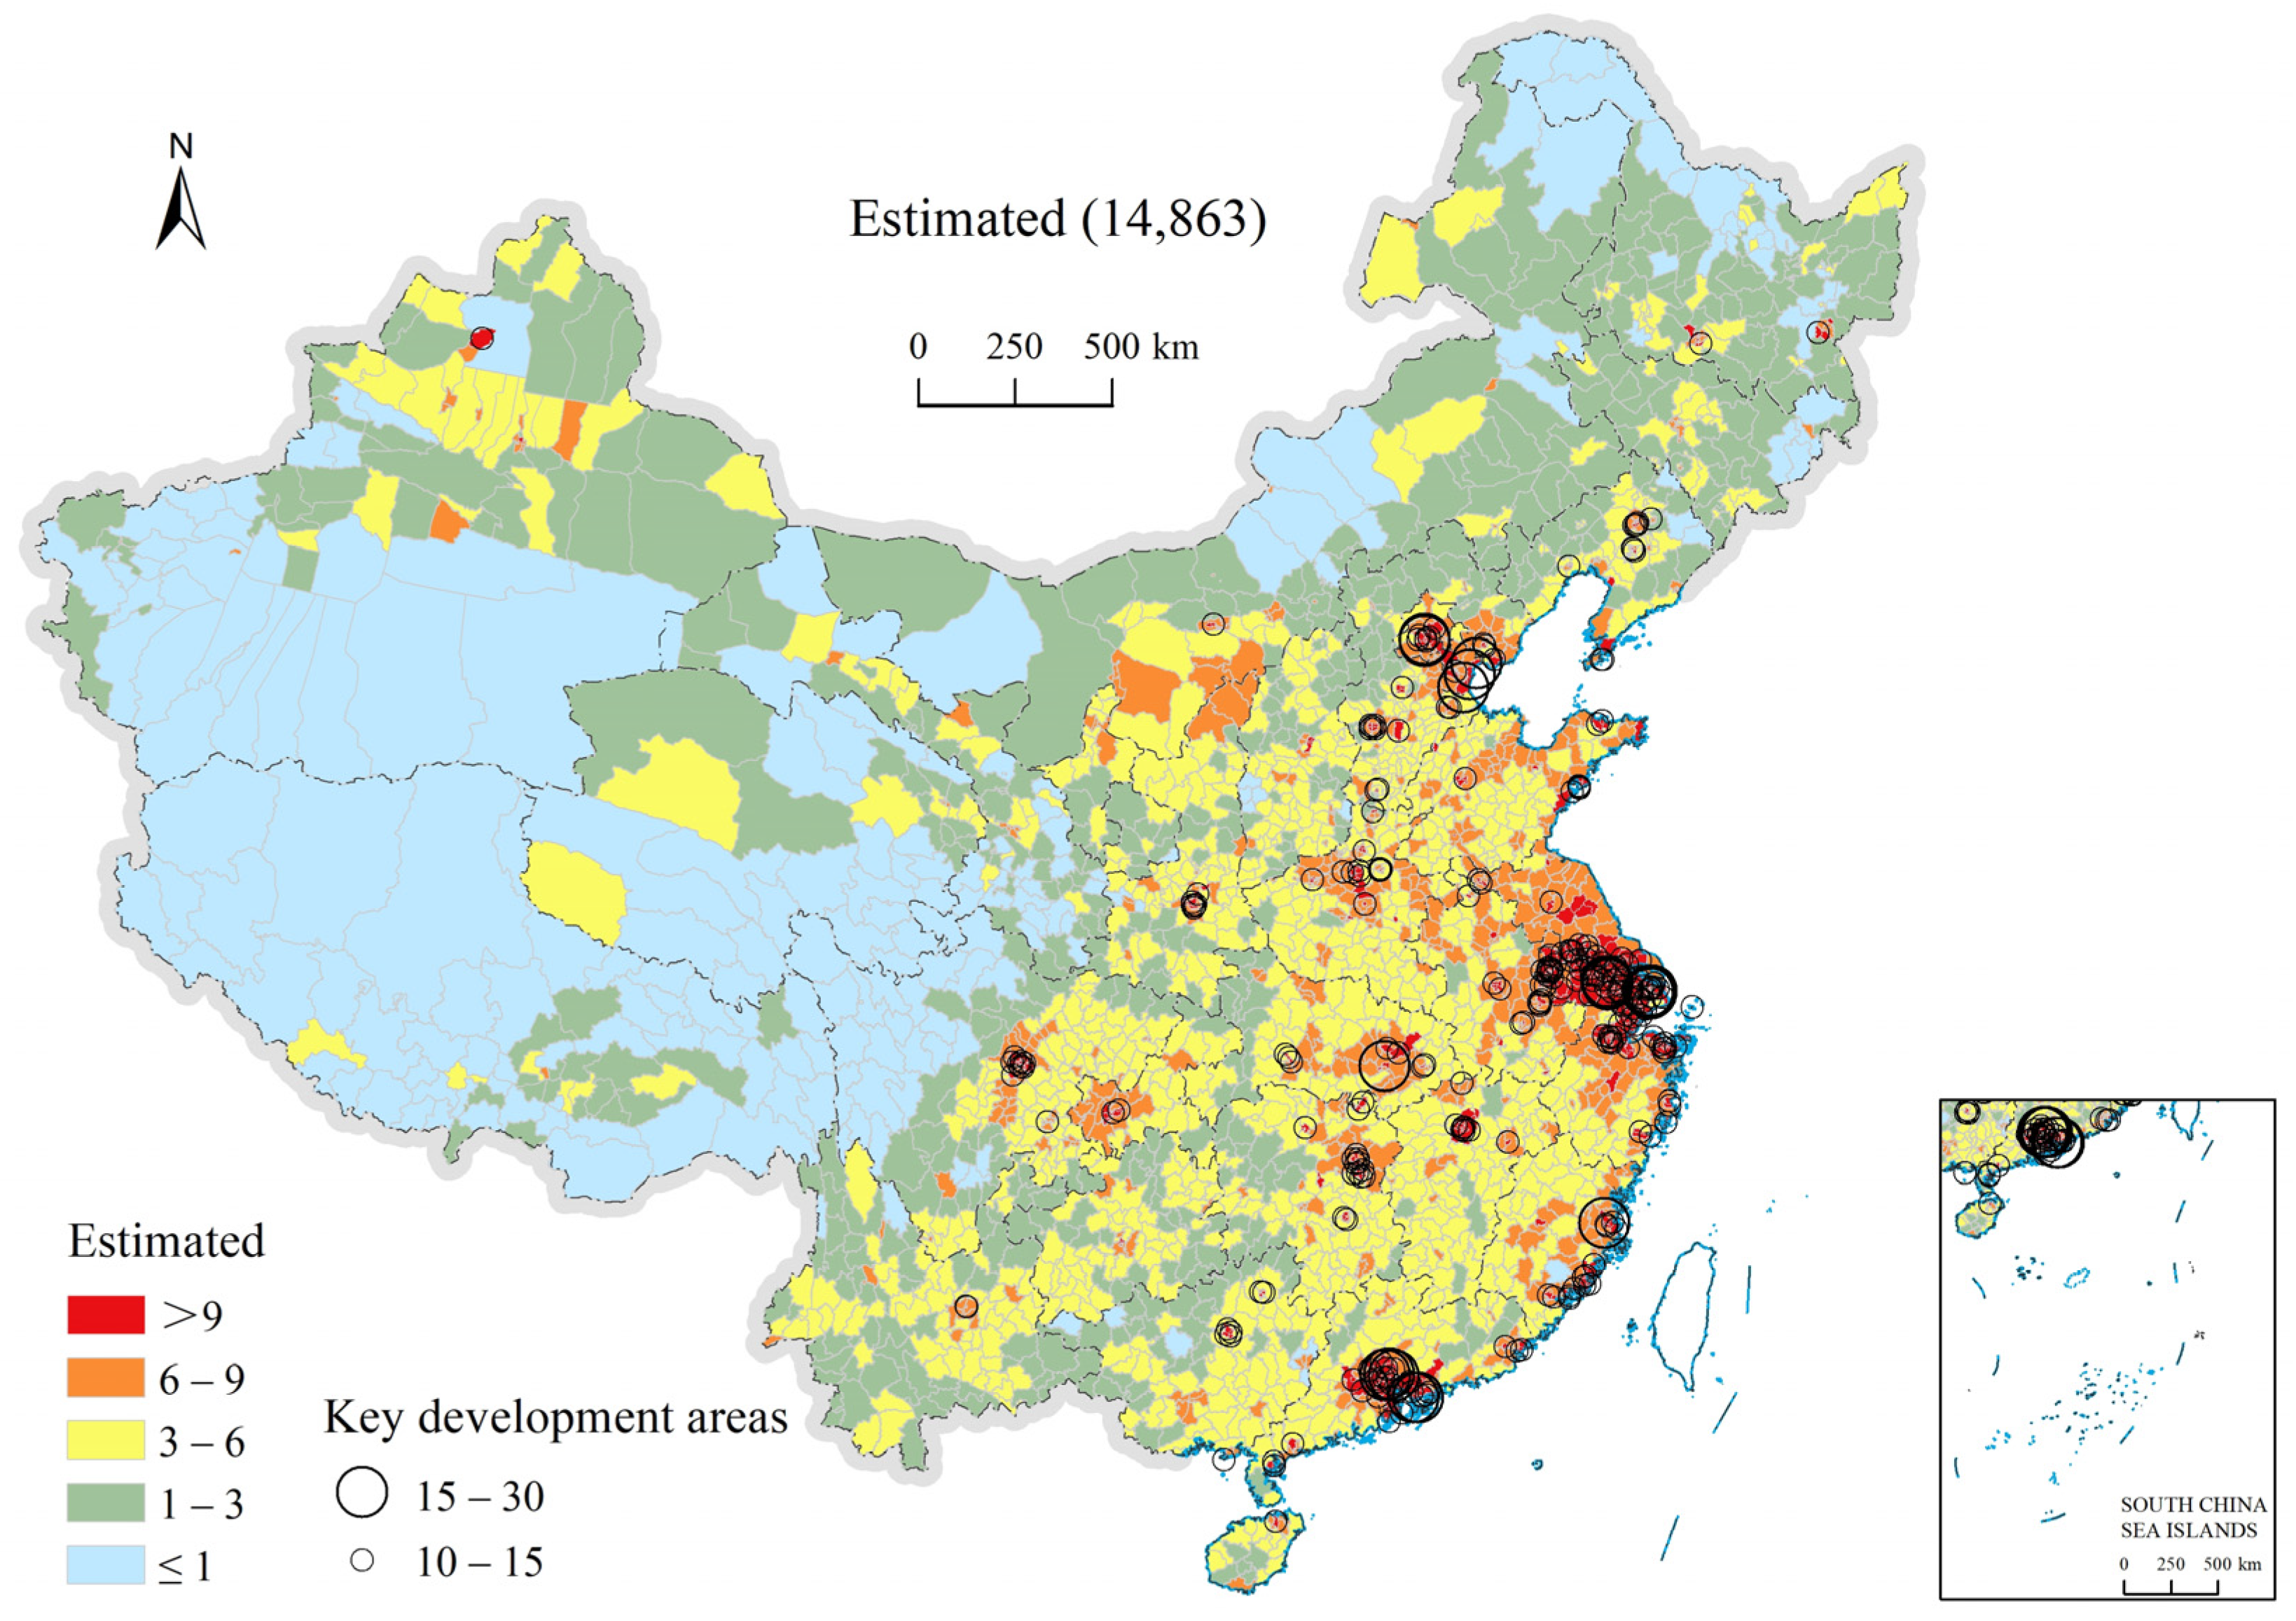
The theoretical number of CDRDCs in China can be estimated based on the fitted coefficient of four influencing factors and the regression equation. The estimated high-value areas (more than 10 CDRDCs) can reflect the key development areas of CDRDCs in the future to a certain extent. As shown in Figure 6, the results show that the estimated spatial pattern of CDRDCs in China is significantly different, and it gradually decreases from east to west. The capital circle, the southeast coast, and the economic belt along the Yangtze River in the eastern and central regions are the densely distributed areas of the estimated CDRDC, while southern Xinjiang, southern Qinghai, and Tibet in the western region are sparsely distributed. The key development areas of CDRDCs are mainly concentrated in the capital circle, the Yangtze River Delta, the Pearl River Delta, eastern Fujian, and eastern Hubei (Table 5).

5. Discussion

5.1. Influencing Factors for CDRDC

We fit the number of CDRDCs with population, GDP, disaster frequency and natural disaster risk based on the stepwise regression method and get the coefficient of four potential factors as shown in Equation (2).
y = −28.32 + 2.49ln(x1) + 0.87ln(x2) + 0.43x3 − 0.06x4,
where y is the theoretical number of CDRDCs in a county; x1 is the GDP of the county (100 million CNY); x2 is the population of the county (10,000 people); x3 is the risk level of integrated natural disaster of the county; x4 is the disaster frequency of the county. All counties in China are selected as statistical samples, with a total number N of 2853.
The significance test (F test) results reveal that F = 241.289, Sig. < 0.001. The t-test results show that t = −17.304 for the constant term, Sig. < 0.001; t = 15.365 of x1 (GDP), Sig. < 0.001; t = 12.523 of x2 (population), Sig. < 0.001; t = 5.598 of x3 (natural disaster risk), Sig. < 0.001; t = −1.643 of x4 (disaster frequency), Sig. = 0.100. The test of fitting degree shows that R2 = 0.252, Sig. < 0.001. These results indicate the significance of the effects of population, GDP, natural disaster risk and the relatively insignificant effect of disaster frequency on CDRDC, consistent with the results of spatial correlation.
However, the poor correlation between CDRDC and disaster frequency is unexpected. Based on the general recognition, regions with high disaster frequency should have more CDRDCs. In fact, CDRDC implements disaster reduction based on the concept of ‘long-term disaster reduction and sustainable development. Disaster frequency is only one of the many standards for creating CDRDCs in China. CDRDC reduces the overall vulnerability of the community from a long-term perspective, improves the ability of community residents to cope with disasters, and establishes a safe, resilient and sustainable community by carrying out resident education and training and community infrastructure construction [57]. Therefore, CDRDC pays more attention to the vulnerability of the exposure and relatively ignores the intensity and frequency of the hazard, which eventually leads to the poor correlation between the disaster frequency and CDRDC, while the population, GDP and natural disaster risk indicators related to the vulnerability of the exposure are highly correlated with CDRDC.
In addition, potential factors that affect the distribution of CDRDC are complex and diverse, and the four influencing factors selected in this paper are not enough. Further research is needed to construct a more scientific and reasonable estimation model for the theoretical number of CDRDCs by comprehensively considering the risk of the hazard and the vulnerability of the exposure. The risk factors of the hazard can be further refined into occurrence frequency, death toll, economic loss of different disasters, etc. Many factors related to the vulnerability of the exposure need to be further explored, including disaster relief capacity, distance from main roads, etc.

5.2. Countermeasures for CBDM

Based on the above spatial–temporal pattern of CDRDCs at different spatial scales and its correlation with population, GDP, disaster frequency and natural disaster risk, the problems faced by the establishment of CDRDCs in the eastern, central and western regions of China were analyzed, and targeted optimization countermeasures for CBDM were proposed as follows.
Eastern China: resource integration. The eastern region of China has a large population and a developed economy, with the largest number of CDRDCs created. As of 2020, a total of 7241 CDRDCs have been built in the eastern region, accounting for 50% of the national total. Although disaster prevention and mitigation infrastructure and residents’ living facilities have been greatly developed, the disaster risk management system and mechanism are still insufficient [13]. The insufficient risk management mechanism leads to insufficient integration of community disaster prevention and mitigation resources, and the role of disaster reduction infrastructure cannot be fully played. Meanwhile, due to insufficient risk management mechanisms, communities usually operate independently in emergency rescue [58,59]. When dealing with emergencies, the communication and coordination between rescue organizations and communities are poor [60,61,62,63]. Hence, the eastern region of China should pay attention to resource integration. Specifically, the CDRDCs in eastern China, as leading pilots, can sign strategic cooperation agreements with academia, government, nongovernment organizations (NGOs), and the private sector to assist the joint construction of fire rescue teams, disaster relief material reserves, identification and investigation of hazard sources, and volunteer teams, thus improving the efficiency of community emergency response. In addition, the CDRDCs should actively cooperate with various rescue forces from NGOs and government agencies by establishing coordination centers to alleviate problems such as ineffective cooperation, disorganized participation, and lack of adequate coordination among some NGOs.
Central China: incorporating risk prevention into sustainable development. Since the introduction of the Central China Rise Policy, the economy and population of central China have grown rapidly, and the number of CDRDCs has increased to 4301 by 2020, accounting for 30% of the national total. However, compared with the eastern region, the central region has frequent natural disasters and a large rural population, and the ability to withstand natural disasters is very weak in rural areas [64], which seriously restricts its sustainable development. Therefore, central China should focus on the vast rural areas and incorporate risk prevention into the sustainable development strategy. Specifically, rural CDRDCs should take disaster prevention and mitigation measures, e.g., establishing a policy-based rural housing disaster insurance system, combining normalized drills and literacy education, and exploring rural disaster prevention and mitigation construction models. Simultaneously, it is necessary to increase the input of relief and assistance to disaster-affected areas, especially in rural areas, to make possible contributions to sustainable development [65].
Western China: making joint efforts in national assistance and public cooperation. With the weak ecology and harsh natural environment in western China, it is necessary to create CDRDCs. However, in this region, the construction progress of CDRDCs is slow, and the created number of CDRDCs accounts for only 20% of the national total. Therefore, policy preferences and financial assistance should be given to western China, and attention should be given to improving the public’s participation and self-rescue ability in disaster prevention and mitigation. Specifically, the population, GDP, disaster frequency and natural disaster risk of the western provinces should be comprehensively considered, especially in areas with high disaster frequency and dense populations. The government can appropriately lower the threshold for establishing CDRDCs and allocate special funds for disaster reduction, thus increasing the number of CDRDCs. In addition, the government should build resilient communities with public participation by strengthening community disaster education and publicity, promulgating special disaster relief strategies for vulnerable groups, and improving the common disaster relief model in western China, where public assistance is greater than self-help.

5.3. Limitations

This study is conducive to effectively improving the effectiveness and quality of CDRDCs and can provide a reference for optimizing the layout of CDRDCs, optimizing the allocation of disaster reduction resources, improving disaster reduction capacity building, and formulating disaster prevention and reduction plans.
Natural disaster risk is a more reasonable indicator than natural disaster frequency derived from historical data to estimate the theoretical number of CDRDCs [63]. The spatial correspondence between CDRCD and natural disaster frequency is poor based on the results of the literature [63]. After we replaced natural disaster frequency with disaster frequency, we found that the correlation between disaster frequency and CDRCD remained poor. In addition, our findings indicate that the number of CDRDCs has a significant positive correlation with natural disaster risk after adding the risk indicator. However, the risk level of integrated natural disasters utilized in this study comprehensively considers the hazards of disasters and the exposure of the population and GDP. Therefore, the overlap among the population, GDP and natural disaster risk may lead to a larger theoretical number of CDRDCs.
In addition, although the CDRDC has played an important role in responding to various emergencies, the disaster risk in the present study only involves natural disasters without taking other public emergencies into account, such as accident disasters, public health events and social security incidents, which may need much more CDRDCs and hence cause a lower estimated theoretical number of CDRDCs.
Furthermore, the natural disaster risk data employed in the present study are derived from the Atlas of Natural Disaster Risk of China in 2011, which may lead to certain deviations from the current realistic scenario. Further research is needed to build a more scientific and reasonable spatial pattern deduction model for CDRDC by opportunely updating natural disaster risk assessment methods and the latest achievements.

6. Conclusions

This study analyzed the spatial–temporal pattern of CDRDCs at the provincial, municipal and county scales in China based on the CDRDC list and constructed an estimation model for the theoretical number of county-level CDRDCs by comprehensively considering the impact of population, GDP, disaster frequency and natural disaster risk. Finally, targeted optimization countermeasures for CBDM were put forward in different regions of China.
We found that the spatial–temporal pattern of CDRDCs shows the evolution process of “first east and then west—the central region rises—east, central and western regions advance together”, and there are significant regional differences. The existing CDRDCs are concentrated in the Pearl River Delta, the capital circle, and the Yangtze River Delta region. The capital circle, the Yangtze River Delta, the Pearl River Delta, eastern Fujian, and eastern Hubei will be the key development areas of CDRDCs in the future. In addition, the number of CDRDCs is significantly positively correlated with population, GDP and natural disaster risk but negatively correlated with disaster frequency. Finally, it is suggested that in the establishment of future CDRDCs, eastern China should pay attention to resource integration, central China should incorporate risk prevention into sustainable development, and western China should make joint efforts of national assistance and public cooperation.

Author Contributions

Conceptualization, Y.M.; methodology, Y.M.; software, S.C. and K.Z.; validation, Y.M., Y.Y. and S.C.; formal analysis, Y.Y.; data curation, Y.M.; writing—original draft preparation, Y.M. and S.C.; writing—review and editing, Y.Y.; visualization, Y.M. and S.C.; supervision, Y.M. All authors have read and agreed to the published version of the manuscript.

Funding

This research received no external funding.

Institutional Review Board Statement

Not applicable.

Informed Consent Statement

Not applicable.

Data Availability Statement

CDRDC list was collected from Ministry of Civil Affairs, Ministry of Emergency Management of China. Natural disaster risk data were drawn from the Atlas of Natural Disaster Risk of China. Socioeconomic data were drawn from China Statistical Yearbook 2021 (County-level).

Acknowledgments

All authors thank the anonymous reviewers and the editor for the constructive comments on the earlier version of the manuscript.

Conflicts of Interest

The authors declare no conflict of interest.

References

  1. Li, B.Y.; Li, J.Z.; Wang, J.J. Areal association of natural hazard in China. Acta Geogr. Sin. 1996, 51, 1–11. [Google Scholar] [CrossRef]
  2. IPCC. Climate Change 2021: The Physical Science Basis. Contribution of Working Group I to the Sixth Assessment Report of the Intergovernmental Panel on Climate Change; Cambridge University Press: Cambridge, UK, 2021. [Google Scholar]
  3. Wu, J.Y.; Ni, W.; Yang, S.N. The development and effectiveness assessment of comprehensive disaster reduction demonstration community in China. J. Catastrophol. 2019, 34, 184–188. [Google Scholar] [CrossRef]
  4. National Disaster Reduction Center of China (NDRCC). The Ministry of Emergency Management Released the National Natural Disaster Situation in China. Available online: http://www.ndrcc.org.cn/zqtj/25017.jhtml (accessed on 13 June 2022).
  5. Federal Emergency Management Agency (FEMA). Building a Disaster Resistant Community: Project Impact; FEMA: Washington, DC, USA, 1997. Available online: https://eric.ed.gov/?id=ed422712 (accessed on 16 November 2022).
  6. Baudoin, M.; Henly-Shepard, S.; Fernando, N.; Sitati, A.; Zommers, Z. From top-down to “community-centric” approaches to early warning systems: Exploring pathways to improve disaster risk reduction through community participation. Int. J. Disaster Risk Sci. 2016, 7, 163–174. [Google Scholar] [CrossRef] [Green Version]
  7. Ohgai, A.; Gohnai, Y.; Watanabe, K. Cellular automata modeling of fire spread in built-up areas—A tool to aid community-based planning for disaster mitigation. Comput. Environ. Urban Syst. 2007, 31, 441–460. [Google Scholar] [CrossRef]
  8. Nakahara, S. Lessons learnt from the recent tsunami in Japan: Necessity of epidemiological evidence to strengthen community-based preparation and emergency response plans. Inj. Prev. 2011, 17, 361–364. [Google Scholar] [CrossRef] [Green Version]
  9. Tanwattana, P. Systematizing Community-Based Disaster Risk Management (CBDRM): Case of urban flood-prone community in Thailand upstream area. Int. J. Disaster Risk Reduct. 2018, 28, 798–812. [Google Scholar] [CrossRef]
  10. Maskrey, A. Disaster Mitigation: A Community Based Approach; Oxfam: Oxford, UK, 1989; Available online: http://hdl.handle.net/10546/121119 (accessed on 16 November 2022).
  11. Chen, C.Y.; Huang, W.L. Land use change and landslide characteristics analysis for community-based disaster mitigation. Environ. Monit. Assess 2013, 185, 4125–4139. [Google Scholar] [CrossRef]
  12. Murosaki, Y. Disaster Prevention State of Communities in Japan; Kobe University: Kobe, Japan, 1999. [Google Scholar]
  13. Kong, F. Perspective on capacity building and regional cooperation in disaster prevention and relief of urban and rural grassroots communities. J. Cap. Norm. Univ. (Nat. Sci. Ed.) 2019, 40, 89–96. (In Chinese) [Google Scholar] [CrossRef]
  14. Choi, Y. Research for Evaluation Method of Urban Disaster Prevention Community Considered Human Ware. Int. J. Urban Sci. 2005, 9, 131–143. [Google Scholar] [CrossRef]
  15. Hosseini, K.A.; Izadkhah, Y.O. From “Earthquake and safety” school drills to “safe school-resilient communities”: A continuous attempt for promoting community-based disaster risk management in Iran. Int. J. Disaster Risk Reduct. 2020, 45, 101512. [Google Scholar] [CrossRef]
  16. Sarabia, M.M.; Kägi, A.; Davison, A.C.; Banwell, N.; Montes, C.; Aebischer, C.; Hostettler, S. The challenges of impact evaluation: Attempting to measure the effectiveness of community-based disaster risk management. Int. J. Disaster Risk Reduct. 2020, 49, 101732. [Google Scholar] [CrossRef]
  17. Räsänen, A.; Lein, H.; Bird, D.; Setten, G. Conceptualizing community in disaster risk management. Int. J. Disaster Risk Reduct. 2020, 45, 101485. [Google Scholar] [CrossRef]
  18. Seddiky, M.A.; Giggins, H.; Gajendran, T. International principles of disaster risk reduction informing NGOs strategies for community based DRR mainstreaming: The Bangladesh context. Int. J. Disaster Risk Reduct. 2020, 48, 101580. [Google Scholar] [CrossRef]
  19. Liu, Y.; Yin, K.L.; Chen, L.X.; Wang, W.; Liu, Y.L. A community-based disaster risk reduction system in Wanzhou, China. Int. J. Disaster Risk Reduct. 2016, 19, 379–389. [Google Scholar] [CrossRef]
  20. Klein, J.A.; Tucker, C.M.; Steger, C.E.; Nolin, A.; Reid, R.; Hopping, K.A.; Yeh, E.T.; Pradhan, M.S.; Taber, A.; Molden, D. An integrated community and ecosystem-based approach to disaster risk reduction in mountain systems. Environ. Sci. Policy 2019, 94, 143–152. [Google Scholar] [CrossRef]
  21. Fraser, T. Japanese social capital and social vulnerability indices: Measuring drivers of community resilience 2000–2017. Int. J. Disaster Risk Reduct. 2021, 52, 101965. [Google Scholar] [CrossRef]
  22. Imperiale, A.J.; Vanclay, F. Conceptualizing community resilience and the social dimensions of risk to overcome barriers to disaster risk reduction and sustainable development. Sustain. Dev. 2021, 29, 891–905. [Google Scholar] [CrossRef]
  23. Robertson, T.; Docherty, P.; Millar, F.; Ruck, A.; Engstrom, S. Theory and practice of building community resilience to extreme events. Int. J. Disaster Risk Reduct. 2021, 59, 102253. [Google Scholar] [CrossRef]
  24. Yin, Z.E.; Yin, J.; Xu, S.; Wen, J. Community-based scenario modelling and disaster risk assessment of urban rainstorm waterlogging. J. Geogr. Sci. 2011, 21, 274–284. [Google Scholar] [CrossRef]
  25. Rana, I.A.; Routray, J.K. Integrated methodology for flood risk assessment and application in urban communities of Pakistan. Nat. Hazards 2018, 91, 239–266. [Google Scholar] [CrossRef]
  26. Islam, M.; Malak, M.; Islam, M.N. Community-based disaster risk and vulnerability models of a coastal municipality in Bangladesh. Nat. Hazards 2013, 69, 2083–2103. [Google Scholar] [CrossRef]
  27. De Silva, M.; Kawasaki, A. Socioeconomic vulnerability to disaster risk: A case study of flood and drought impact in a rural Sri Lankan community. Ecol. Econ. 2018, 152, 131–140. [Google Scholar] [CrossRef]
  28. Wang, X.X.; Shi, R.T.; Lu, Y.T.; Zhou, Y. Fuzzy comprehensive evaluation of the disaster reduction ability of an ethnic minority accumulation area based on an analytic hierarchy process. Environ. Ecol. Stat. 2019, 26, 239–258. [Google Scholar] [CrossRef]
  29. Chou, J.S.; Yang, K.H.; Ren, T.C. Ex-post evaluation of preparedness education in disaster prevention, mitigation and response. Int. J. Disaster Risk Reduct. 2015, 12, 188–201. [Google Scholar] [CrossRef]
  30. Jamshed, A.; Rana, I.A.; Mirza, U.M.; Birkmann, J. Assessing relationship between vulnerability and capacity: An empirical study on rural flooding in Pakistan. Int. J. Disaster Risk Reduct. 2019, 36, 101109. [Google Scholar] [CrossRef]
  31. Duan, R.R.; Liu, J.; Wang, C.K.; Wei, G. Influencing factors of public participation in meteorological disaster prevention and mitigation. Sustainability 2020, 12, 3108. [Google Scholar] [CrossRef] [Green Version]
  32. Hamideh, S. Opportunities and challenges of public participation in post-disaster recovery planning: Lessons from Galveston, TX. Nat. Hazards Rev. 2020, 21, 5020009. [Google Scholar] [CrossRef]
  33. Li, P.; Jing, T.C.; Wei, D.A.; Ying, L.A. Farmers’ participation in community-based disaster management: The role of trust, place attachment and self-efficacy. Int. J. Disaster Risk Reduct. 2020, 51, 101895. [Google Scholar] [CrossRef]
  34. Ruszczyk, H.A.; Upadhyay, B.K.; Kwong, Y.M.C.; Khanal, O.; Bracken, L.J.; Pandit, S.; Bastola, R. Empowering women through participatory action research in community-based disaster risk reduction efforts. Int. J. Disaster Risk Reduct. 2020, 51, 101763. [Google Scholar] [CrossRef]
  35. Ramalho, J. Empowerment in the era of resilience-building: Gendered participation in community-based (disaster) risk management in the Philippines. Int. Dev. Plann. Rev. 2019, 41, 129–149. [Google Scholar] [CrossRef]
  36. Ma, Y.J.; Xu, W.; Qin, L.J.; Zhao, X.J. Site selection models in natural disaster shelters: A review. Sustainability 2019, 11, 399. [Google Scholar] [CrossRef] [Green Version]
  37. Boonmee, C.; Arimura, M.; Asada, T. Facility location optimization model for emergency humanitarian logistics. Int. J. Disaster Risk Reduct. 2017, 24, 485–498. [Google Scholar] [CrossRef]
  38. Hu, F.; Xu, W.; Li, X. A modified particle swarm optimization algorithm for optimal allocation of earthquake emergency shelters. Int. J. Geogr. Inf. Sci. 2012, 26, 1643–1666. [Google Scholar] [CrossRef]
  39. Bozorgi-Amiri, A.; Jabalameli, M.S.; Alinaghian, M.; Heydari, M. A modified particle swarm optimization for disaster relief logistics under uncertain environment. Int. J. Adv. Manuf. Technol. 2012, 60, 357–371. [Google Scholar] [CrossRef]
  40. Zhao, X.J.; Xu, W.; Ma, Y.J.; Qin, L.J.; Zhang, J.L.; Wang, Y. Relationships between evacuation population size, earthquake emergency shelter capacity, and evacuation time. Int. J. Disaster Risk Sci. 2017, 8, 457–470. [Google Scholar] [CrossRef] [Green Version]
  41. Xu, W.; Ma, Y.J.; Zhao, X.J.; Li, Y.; Qin, L.J.; Du, J. A comparison of scenario-based hybrid bilevel and multi-objective location-allocation models for earthquake emergency shelters: A case study in the central area of Beijing, China. Int. J. Geogr. Inf. Sci. 2018, 32, 236–256. [Google Scholar] [CrossRef]
  42. Xu, W.; Zhao, X.J.; Ma, Y.J.; Li, Y.; Qin, L.J.; Wang, Y.; Du, J. A multi-objective optimization based method for evaluating earthquake shelter location-allocation. Geomat. Nat. Hazards Risk 2018, 9, 662–677. [Google Scholar] [CrossRef] [Green Version]
  43. Ma, Y.J.; Xu, W.; Qin, L.J.; Zhao, X.J.; Du, J. Hierarchical supplement location-allocation optimization for disaster supplies warehouse in the Beijing-Tianjin-Hebei region of China. Geomat. Nat. Hazards Risk 2019, 10, 102–117. [Google Scholar] [CrossRef] [Green Version]
  44. Ma, Y.J.; Liu, B.Y.; Zhang, K.W.; Yang, Y.Y. Incorporating multi-criteria suitability evaluation into multi-objective location-allocation optimization comparison for earthquake emergency shelters. Geomat. Nat. Hazards Risk 2022, 13, 2333–2355. [Google Scholar] [CrossRef]
  45. Kongsomsaksakul, S.; Yang, C.; Chen, A. Shelter location-allocation model for flood evacuation planning. J. East. Asia Soc. Transp. Stud. 2005, 6, 4237–4252. [Google Scholar] [CrossRef]
  46. Nolz, P.C.; Semet, F.; Doerner, K.F. Risk approaches for delivering disaster relief supplies. OR Spectr. 2011, 33, 543–569. [Google Scholar] [CrossRef] [Green Version]
  47. Hu, F.; Yang, S.; Xu, W. A non-dominated sorting genetic algorithm for the location and districting planning of earthquake shelters. Int. J. Geogr. Inf. Sci. 2014, 28, 1482–1501. [Google Scholar] [CrossRef]
  48. Zhao, M.; Chen, Q.W.; Ma, J.; Cai, D. Optimizing temporary rescue facility locations for large-scale urban environmental emergencies to improve public safety. J. Environ. Inform. 2017, 29, 61–73. [Google Scholar] [CrossRef] [Green Version]
  49. Gharib, Z.; Yazdani, M.; Bozorgi-Amiri, A.; Tavakkoli-Moghaddam, R.; Taghipourian, M.J. Developing an integrated model for planning the delivery of construction materials to post-disaster reconstruction projects. J. Comput. Des. Eng. 2022, 9, 1135–1156. [Google Scholar] [CrossRef]
  50. Gama, M.; Santos, B.F.; Scaparra, M.P. A multi-period shelter location-allocation model with evacuation orders for flood disasters. EURO J. Comput. Optim. 2015, 4, 1–25. [Google Scholar] [CrossRef]
  51. Ng, M.W.; Park, J.; Waller, S.T. A hybrid bilevel model for the optimal shelter assignment in emergency evacuations. Comput.-Aided Civ. Infrastruct. Eng. 2010, 25, 547–556. [Google Scholar] [CrossRef]
  52. Gharib, Z.; Tavakkoli-Moghaddam, R.; Bozorgi-Amiri, A.; Yazdani, M. Post-disaster temporary shelters distribution after a large-scale disaster: An integrated model. Buildings 2022, 12, 414. [Google Scholar] [CrossRef]
  53. Du, S. Urban Emergency Shelter Site Selection Method Based on ant Colony Algorithm; Shanghai Normal University: Shanghai, China, 2018. (In Chinese) [Google Scholar]
  54. Zhou, H.J.; Zhang, W.X.; Lei, Y.D.; Yin, W.X. Temporal and spatial pattern of national model community of comprehensive disaster-reduction in China. Geogr. Res. 2013, 32, 1077–1083. (In Chinese) [Google Scholar]
  55. Shi, P.J. Atlas of Natural Disaster Risk of China; Science Press: Beijing, China, 2011. [Google Scholar]
  56. Wang, M.H. China Statistical Yearbook 2021 (County-Level); China Statistics Press: Beijing, China, 2021. [Google Scholar] [CrossRef]
  57. Zhou, H.J.; Zhang, W.X. Comparison of community disaster risk management model—Analysis from Chinese comprehensive disaster-reduction demonstration communities and CBDRM communities. J. Catastrophol. 2013, 28, 120–126. (In Chinese) [Google Scholar]
  58. Teets, J.C. Post-earthquake relief and reconstruction efforts: The emergence of civil society in China? China Q. 2009, 198, 330–347. [Google Scholar] [CrossRef] [Green Version]
  59. Espia, J.C.P.; Fernandez, P., Jr. Insiders and outsiders: Local government and NGO engagement in disaster response in Guimaras, Philippines. Disasters 2015, 39, 51–68. [Google Scholar] [CrossRef] [PubMed]
  60. Maiers, C.; Reynolds, M.; Haselkorn, M. Challenges to effective information and communication systems in humanitarian relief organizations. In IPCC 2005, Proceedings of the International Professional Communication Conference, Limerick, Ireland, 10–13 July 2005; IEEE: Piscataway, NJ, USA, 2005; pp. 82–91. [Google Scholar] [CrossRef]
  61. Shittu, E.; Parker, G.; Mock, N. Improving communication resilience for effective disaster relief operations. Environ. Syst. Decis. 2018, 38, 379–397. [Google Scholar] [CrossRef]
  62. Lu, Y.; Zhan, C.Y.; Li, R.; Su, M. An NGO disaster relief network for small and medium-scale natural hazards in China. Nat. Hazards 2021, 106, 2689–2709. [Google Scholar] [CrossRef] [PubMed]
  63. Hillig, Z.; Connell, J. Social capital in a crisis: NGO responses to the 2015 Nepalese earthquakes. Asia Pac. Viewp. 2018, 59, 309–322. [Google Scholar] [CrossRef]
  64. Zhao, L.J.; Wang, X.X. Natural Disaster Reduction, Aid Ability Construction Research Based on analysis of Hubei province. In Proceedings of the 2012 International Conference on Public Management (ICPM-2012), Bali, Indonesia, 11–13 June 2012; Atlantis Press: Paris, France, 2012; pp. 389–394. [Google Scholar] [CrossRef]
  65. Shi, P.J. On the role of government in integrated disaster risk governance—Based on practices in China. Int. J. Disaster Risk Sci. 2012, 3, 139–146. [Google Scholar] [CrossRef]
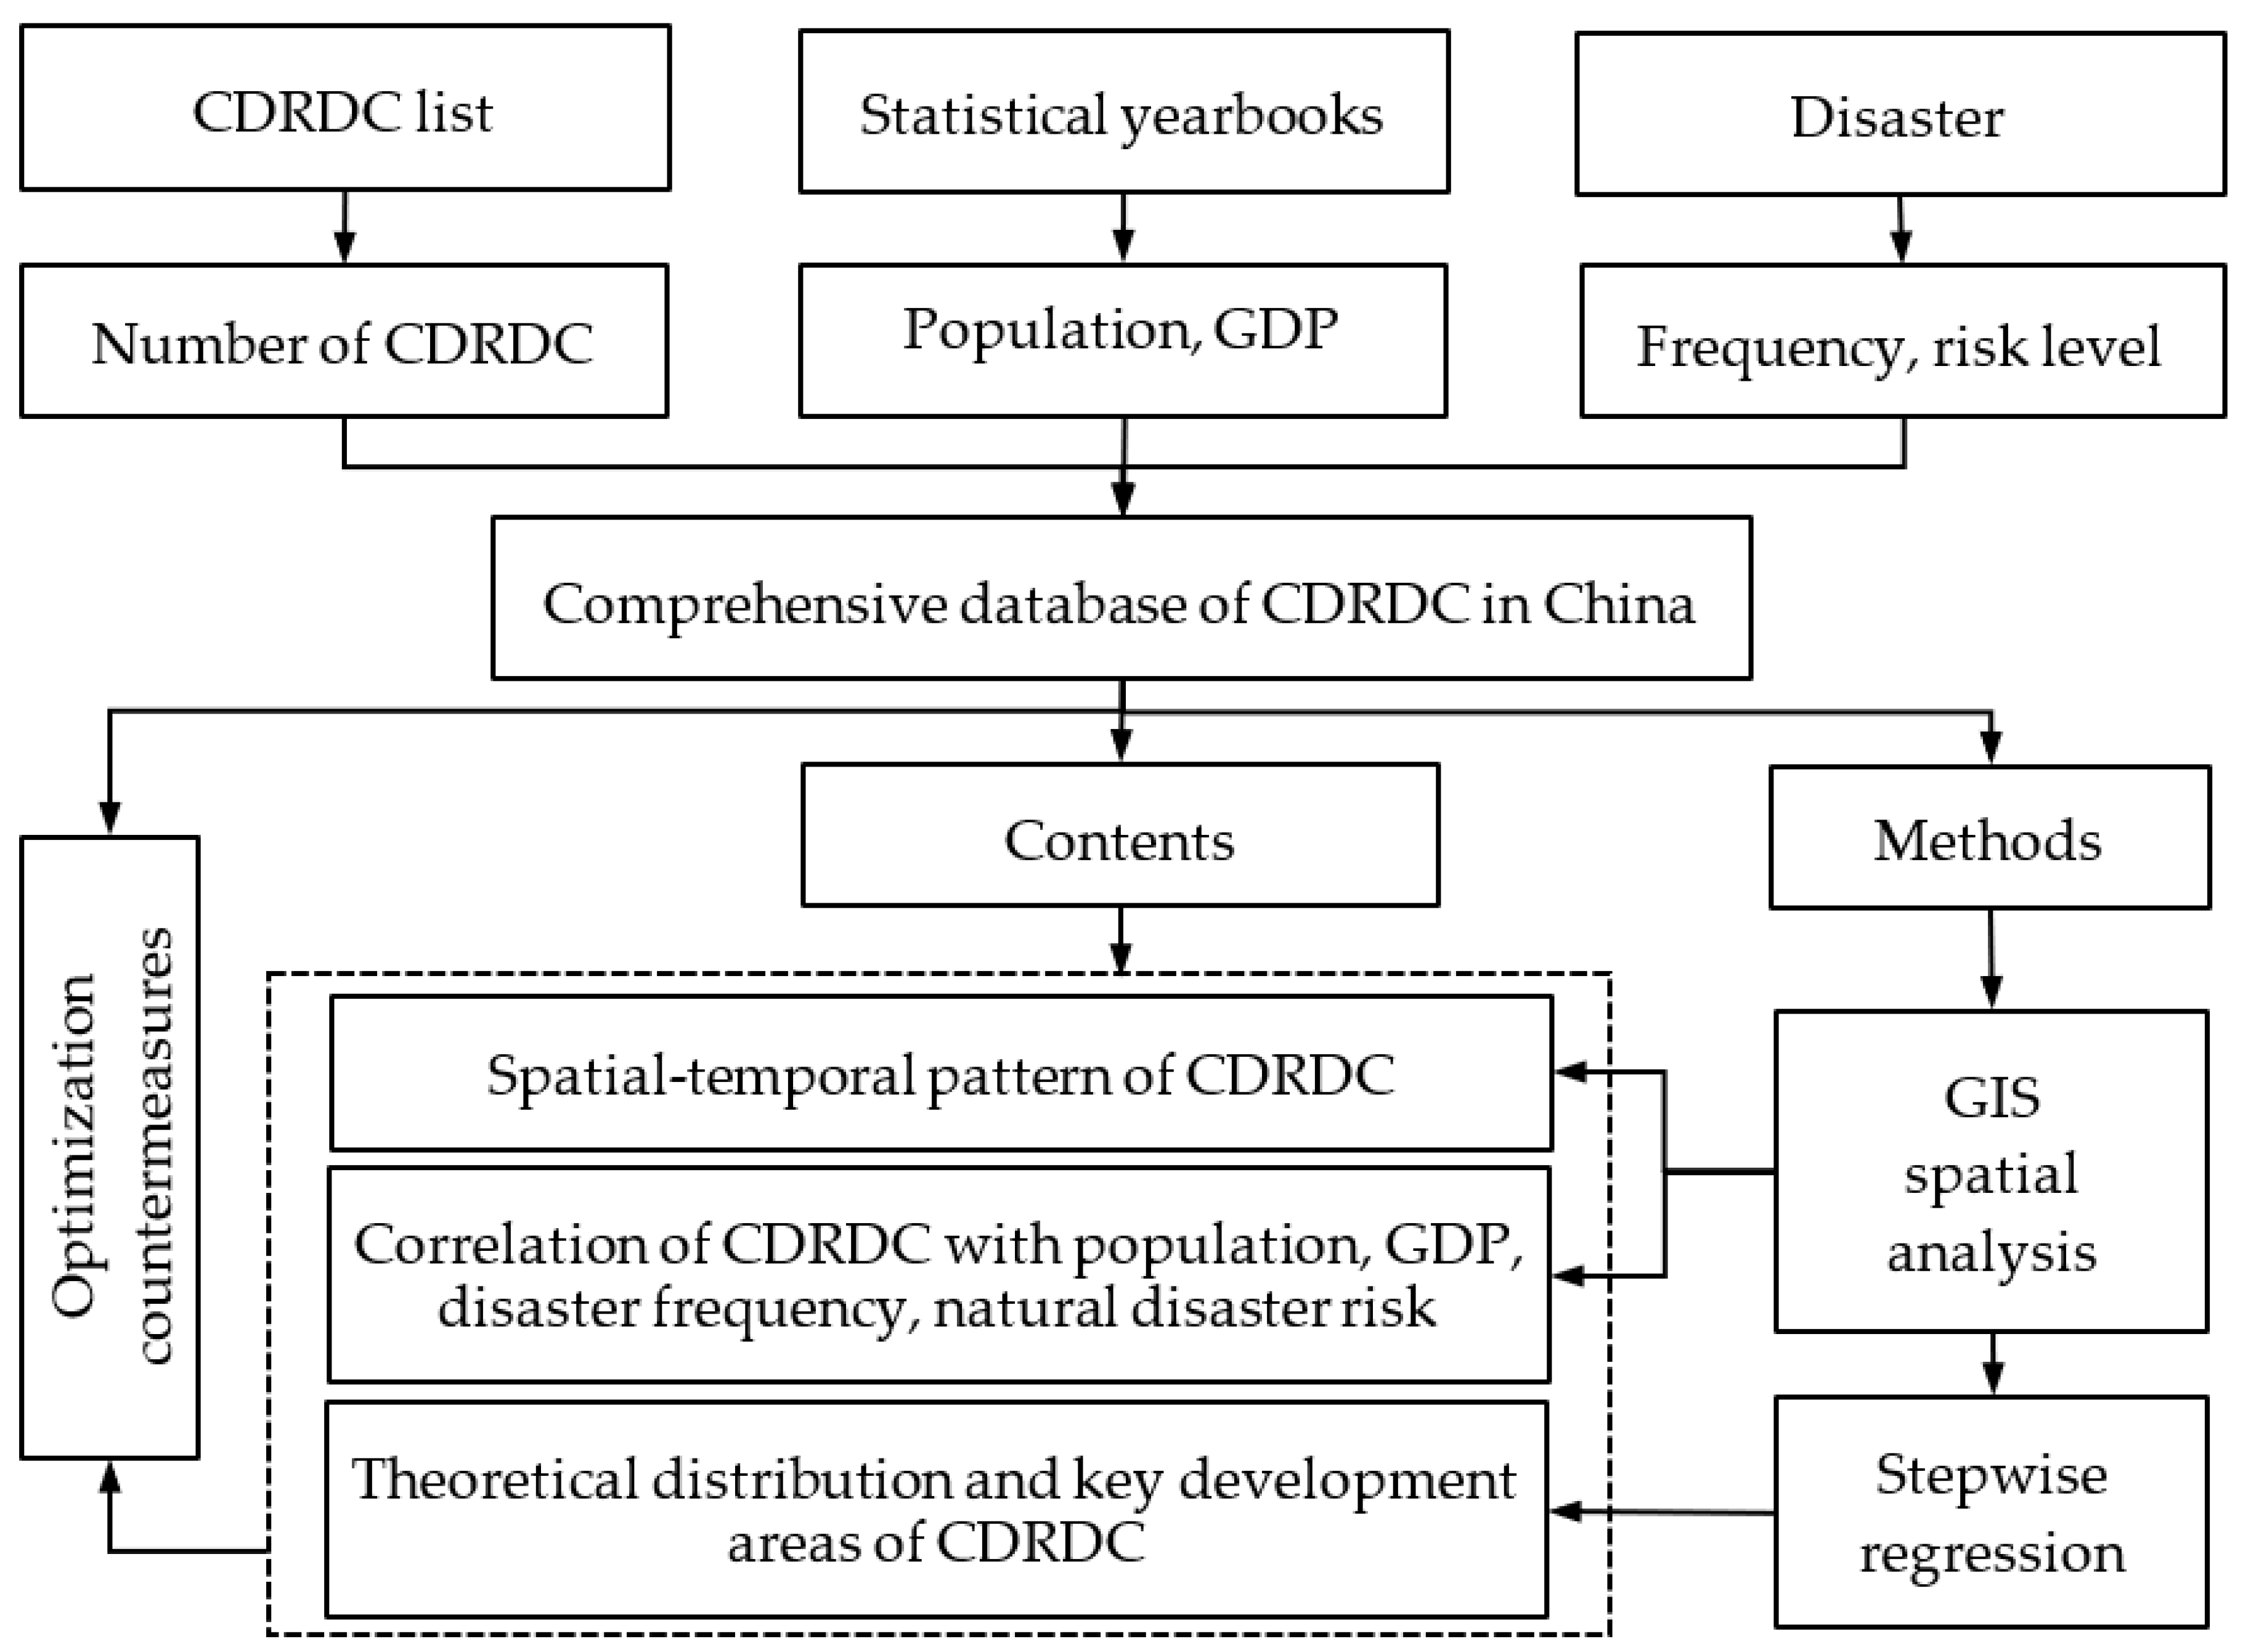
Figure 1. Research framework.
Sustainability 14 15238 g001
Figure 2. Spatial pattern of CDRDC in China (provincial scale). Y denotes the year of CDRDC.
Sustainability 14 15238 g002
Figure 3. Spatial pattern of CDRDC in China (municipal scale). #NMC denotes the number of CDRDC.
Sustainability 14 15238 g003
Figure 4. Spatial pattern of CDRDC in China (county scale).
Sustainability 14 15238 g004
Figure 5. Spatial correlation of CDRDCs with population (a), GDP (b), disaster frequency (c), and natural disaster risk (d).
Sustainability 14 15238 g005
Figure 6. The theoretical distribution and the key development areas of CDRDCs in China.
Sustainability 14 15238 g006
Table 1. Data Sources.
DatabaseData DescriptionScaleSourceYearWebsite/Reference
CDRDC listEstablishment time, community nameCountyMinistry of Emergency Management of China2018–2020https://www.mem.gov.cn/gk/zfxxgkpt/fdzdgknr/202102/t20210207_379798.shtml (accessed on 16 November 2022)
Ministry of Civil Affairs;National Disaster Reduction Center of China2008–2017https://www.mca.gov.cn/article/xw/tzgg/201712/20171215006995.shtml (accessed on 16 November 2022);
http://www.ndrcc.org.cn/tzgg/12297.jhtml (accessed on 16 November 2022)
Disaster frequencyDisaster time, location, typeCountyGlobal disaster data platform2010–2020https://www.gddat.cn (accessed on 16 November 2022)
Natural disaster riskRisk level of integrated natural disasterCountyAtlas of Natural Disaster Risk of China2011[55]
Socioeconomic dataGDP, populationCountyChina Statistical Yearbook 2021 (County-level)2020[56]
Table 2. The annual number variation of CDRDCs in each province of China.
ProvinceYearTotal
2008200920102011201220132014201520162017201820192020
Guangdong1804221291141151101091221261131081201372
Zhejiang1401226531001111111131081069646461068
Jiangsu5071930675180869011511910072886
Shandong6081534808080909192834047800
Sichuan4621655626266757171713555687
Hubei6174060586067566262703540678
Hunan5661221576050917574733535645
Liaoning3972134634957495760592023538
Henan237810444449606666743536522
Jiangxi4751018525652525656564040540
Beijing76102155505050505050443030566
Anhui4771430404241485051555560540
Hebei3861033405555635660542524519
Fujian3121224333642455154585551494
Heilongjiang4481532404039403940404116434
Guangxi195814182125224450522630334
Xinjiang59141622464645402927302225421
Jilin4671013323335354141433633405
Shanghai3501831313127394420343635381
Shaanxi3471119303030303042422023348
Gansu376940333430303029301520343
Guizhou314428232530303333351717310
Inner Mongolia17567313231253130251513268
Chongqing227811293125242628271514267
Shanxi387411232420202826351518269
Yunnan2561517202020202323242014247
Tianjin25791518151911137111222184
Qinghai27261312107122020221014175
Ningxia1561010101010101014101013138
Hainan72561214121267449100
Tibet613055033003433
Total1381184403875127312921315139014551480148997699914,512
Table 3. The annual number variation of CDRDCs in China (cities with more than 100 CDRDCs).
CityYearTotal
2008200920102011201220132014201520162017201820192020
Beijing67101951464646464847402827521
Shanghai3501730302923364018303432354
Ningbo36410172121211817181566210
Guangzhou300024211615142518151311202
Foshan39061926171313101615105189
Hangzhou4112141517161616161688186
Tianjin25691517151811137111919185
Shenzhen2237191515149131616910168
Dalian60562019202020202000156
Chongqing municipal district1653621211312131413105152
Wenzhou161341416171816151455144
Qingdao15257151515151212949135
Changchun182139866121723812125
Dongguan140020139101010101087121
Nanjing51448410121515121312115
Suzhou904691915151514117115
Chongqing municipal county6255810121213141459115
Changsha1333613161116761046114
Xiamen10061088101010101378110
Jiangmen150205788111116117101
Total438401112663343103073173363153262132053518
Table 4. The total number of CDRDCs in different regions of China (counties with more than 20 CDRDCs).
RegionProvinceCountyCityTotal
Pearl River DeltaGuangdongDongguan CityDongguan658
Chancheng, Nanhai, Shunde and Sanshui DistrictsFoshan
Xiangzhou and Jinwan DistrictsZhuhai
Baoan, Longgang, Nanshan and Futian DistrictsShenzhen
Huangpu, Tianhe and Panyu DistrictsGuangzhou
Zhongshan CityZhongshan
Huicheng DistrictHuizhou
Jianghai and Xinhui DistrictsJiangmen
Capital circleBeijingChaoyang, Haidian, Dongcheng, Fengtai, Shijingshan, Xicheng, Shunyi, Daxing, Tongzhou, Fangshan, Miyun, Pinggu and Mentougou DistrictsBeijing573
TianjinHeping DistrictTianjin
HebeiHaigang DistrictQinhuangdao
Qiaodong DistrictZhangjiakou
Yangtze River DeltaShanghaiPudong New Area, Putuo, Jiading, Chongming, Qingpu, Yangpu, Hongkou, Fengxian, Changning, Songjiang and Jianshan DistrictsShanghai550
ZhejiangYuyao City, Beilun and Yinzhou Districts, Cixi CityNingbo
Xihu DistrictHanghzou
Wuxing District, Changxing CountyHuzhou
JiangsuBinhu and Xishan DistrictsWuxi
AnhuiShushan DistrictHefei
Xiangshan DistrictHuaibei
Other regions503
Total2284
Table 5. The key development areas of CDRDCs in China (only list counties with more than 15 CDRDCs).
RegionProvinceCityCountyTheoretical Number
Capital
circle
BeijingBeijingXicheng District30
TianjinTianjinHangu District18
Tanggu District17
Dagang District17
Yangtze
River
Delta
ShanghaiShanghaiHuangpu District17
Luwan District17
Jing’an District17
Changning District16
Xuhui District15
JiangsuWuxiChongan DIstrict16
Nanchang District15
Beitang District15
Pearl
River
Delta
GuangdongShenzhenNanshan District16
Futian District15
GuangzhouYuexiu District16
Tianhe District15
Huangpu District15
Provincial
capital
FujianFuzhouGulou District16
HubeiWuhanHannan District15
Publisher’s Note: MDPI stays neutral with regard to jurisdictional claims in published maps and institutional affiliations.