Abstract
To address the problem of surface subsidence caused by the compression of filling gangue in deep mines, a layered compaction test was designed based on the zonation of the failure of the overburden in the goaf and layered property of the filling gangue. The deformation characteristics of filling gangue in natural and water-bearing states were obtained. The deformation of filling gangue during the 0~100 kN loading stage was an approximately positive S-type, which reflects the relative “advancement” in terms of deformation. The filling gangue deformation in the 100~500 kN loading stage was an approximately inverted S-type, which reflects the relative “lag” in terms of deformation. In a natural state, the load-time curves of the dead load stage were consistent. Under a water-bearing condition, the load-time curve for the dead load stage had apparent “step” characteristics and presented a special phenomenon of displacement rebound. Under gradient loading, the strain showed an exponential growth model, and energy dissipation showed a logarithmic growth model. Under a natural state, the energy dissipation showed consistently increasing distribution patterns, while the energy dissipation showed a normal distribution model under the water-bearing state.
1. Introduction
After gangue filling mining underground, owing to gravity and upper load, a series of bending, subsidence, rupture, and moving damage occur in the overlying strata. Considering the long wall mining method as an example, the overlying rocks affected by gangue mining are divided into fracture and bending failure zones after mining [1,2,3]. Filling gangues can have different degrees of deformation under the conditions of self-weight and overlying rock load, with deformation characteristics being directly related to the height of a developing water-conducting fracture zone of overlying rock and the surface stability of the goaf [4,5,6].
With the in-depth development of green mining in coal mines and the rapid development of infrastructure (e.g., national expressways and high-speed railways), research on the compression characteristics of crushed rock masses (e.g., filling gangue, old goaf collapse zone rock, rockfill body) is increasing. Zhou et al. [7] investigated the compaction deformation and time dependence characteristics of filling gangues through a series of compaction experiments. The gangue underwent three separate stages of compressive deformation: rapid, slow, and stable. The energy density of gangues increased nonlinearly as the strain increased, and the dissipated energy accounted for 10%, 20%, and 70% of the total energy of the three compressive deformation stages, respectively. Correlation studies indicate that particle crushing is related to particle strength [8], loading mode [9] particle size distribution [10,11,12], and fractal characteristics [13], etc.
The mechanical parameters of rock mass, such as its strength, internal friction angle, and cohesion, clearly decrease under saturated water conditions [14,15,16,17]. To examine the role of water in the compression process of crushed rock, scholars have conducted compression tests for rock mass with different dipping heights and water contents [18,19]. The compression of the broken rock mass can result in a denser structure, which may affect the permeability of the broken rock mass. The denser the compression of the broken rock mass, the lower the permeability [20,21]. In order to obtain more accurate destruction characteristics in terms of filling gangue, deep learning and other methods have been introduced into the study of the compression deformation of filling gangue [22,23]. The addition of grouting materials such as fly ash has significantly improved the compression resistance of filling gangue [24].
After filling the goaf with gangue, the roof still collapses owing to the influence of filling gangue compression and other factors. As shown in Figure 1, the failure zones with regard to the overburden rock in the goaf filled with gangue are a block articulated belt, quasi-continuous belt, and bending subsidence zone. The corresponding rock structure is fractured, block fractured, and made up of complete structures. The filling gangue also has a stratification phenomenon under the influence of self-weight [25,26]. The fractured, block fractured, and complete structures on the filling gangue can be regarded as the source of the compaction load of the filling gangue [26,27].
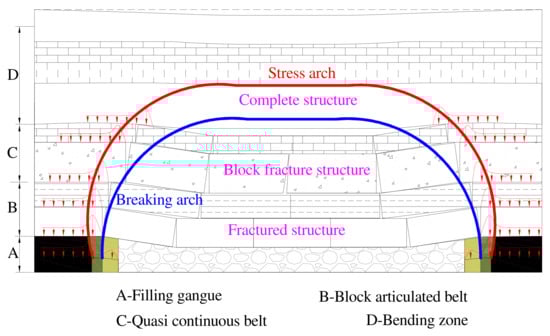
Figure 1.
Zoned failure of gangue filling strata.
Research objects are often a single particle size or simply mixed filling gangue. The stratification of mining-induced rock structures above filling gangue is given less consideration. Most of loading methods involve linear loading. Such study methods cannot accurately reflect the compaction evolution rule of gangue filling in the goaf. In this paper, the integral stratification of overlying strata is simulated by gradient loading. The local stratification of filling gangue is simulated by stratified laying. In order to simulate the water environment in the goaf, two compression tests, involving natural drying and water filling, were designed.
2. Test Method
2.1. Test Instrument
The experimental control system comprises a console and a servo loading system. The servo loading system has two parts: the water pressure and quantity double control servo system and the displacement stress double control servo system. The entire process is automatically controlled by computer. The overall experimental system is shown in Figure 2. During the experiment, real-time monitoring and the acquisition of displacement, load, water pressure, and water quantity can be realized. The sampling frequency can be set according to the different experimental contents. The axial pressure is ≤600 kN, test chamber diameter is 400 mm, and test chamber height is 680 mm.
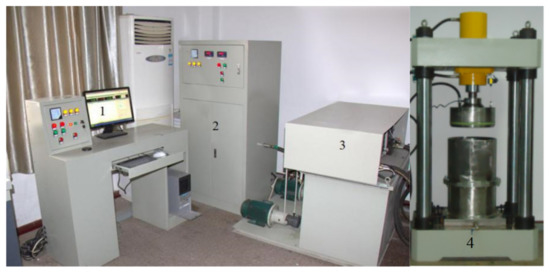
Figure 2.
Testing system. 1—Console. 2—Hydraulic pressure double control servo system. 3—Displacement stress double control servo system. 4—Loading system.
2.2. Test Design
The experimental filling gangue was taken from a coal mine and mainly composed of sandstone, limestone, and mudstone. It was broken into small blocks with particle sizes of less than 60 mm and screened using sieves with apertures of 15, 30, 45, and 60 mm. The filling gangue, mixed with four grades of different types of lithology, was layered while it was loaded into the chamber bin.
The settings of the loading parameters were mainly determined by two factors. One aim was to represent the site conditions as much as possible, the other was the performance of the equipment. To simplify the operation, the axial loads at all levels were set to 100, 200, 300, 400, and 500 kN, respectively. The loading rate was in the loading stage, and loading time of per load gradient in the dead load stage in a natural state was 9000 s. A water pressure of 0.2 MPa was added to the test system in a saturated state. Considering that the pump cannot be pressured for a long time, the corresponding axial load in the test was maintained at 1800 s.
During the compression process, the displacement sensor recorded displacement every 0.18 s. The change in displacement of the filling gangue with axial pressure was analyzed, and the curve for the displacement–load function was obtained.
3. Compaction Test under Natural Conditions
3.1. Test Results
There are three types of filling gangue under natural conditions, namely, 0~15 mm, 23.72 kg; 15~30 mm, 28.20 kg; and 30~60 mm, 51.28 kg, with laying heights of 20, 20, and 22 cm, respectively. We increased the axial load step by step until the test was completed. The time–load and time–displacement curves are shown in Figure 3. The variation in natural filling gangue parameters during compaction is presented in Table 1.
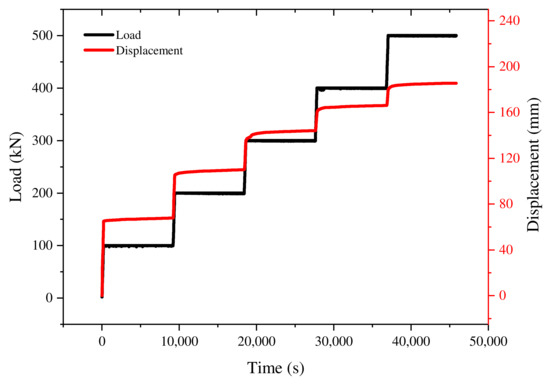
Figure 3.
Time–load, time–displacement curves in a natural state.

Table 1.
Displacement variation of the filling gangue in a natural state.
The change in shape of filling gangue in the natural state after compaction is shown in Figure 4. A large stress concentration with diameter of 40~60 mm is produced at the edge and corner of the filling gangue, which results in the destruction of edges and corners of the filling gangue and more debris fills in the crevice. In contrast to the block before compaction, the block, similar to a cuboid, is broken and it becomes smoother, and there is an apparent mutual dislocation between the blocks. A particle size of 20~40 mm is more compact. Certain mudstones are comminuted, sandstone is less destroyed, and the crushed small blocks are mostly spindles. Rock blocks in the range of 0~20 mm in size are denser, and a caking phenomenon occurs in the process of taking out the test material.
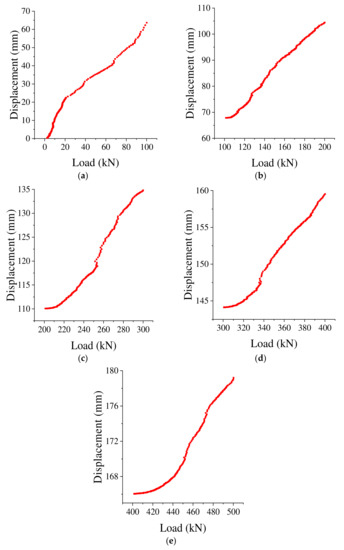
Figure 4.
Loading stress–displacement curve at each loading stage. (a) 0~100 kN; (b) 100~200 kN; (c) 200~300 kN; (d) 300~400 kN; (e) 400~500 kN.
In the test, during the loading process from the initial stage within 100 kN, there wer obvious cracks and vibrations in the test chamber, which were mainly owing to the existence of a larger gap between the filling gangue with larger particle sizes. Moreover, the edges and angles were relatively sharp, and the rock blocks were compacted and produced a large break or rotation. In the process of 100~200 kN gradient loading, there was no breaking sound but a certain vibration. During 200~300, 300~400, and 400~500 kN gradient loading, the vibration was weak.
3.2. Characteristics of Displacement Variation in the Loading Stage
During the loading process, the stress–axial displacement curve for 0~100 kN is of an inverted S-type (Figure 4a), and during 100~200, 200~300, 300~400, and 400~500 kN, the stress–axial displacement curve is a positive S-type (Figure 4b–e).
The main reason for the 0~100 kN loading curve being an inverted S-type is because, in the initial loading stage, the gangue is filled in an approximate free state. Even if there is a certain loading force, its void is larger, and there is a relatively larger space for rotation and compaction, etc. The change in axial displacement is faster than the change in stress. This process is the first half of the inverted S-type, which can be referred to as the relative “forward” of deformation. When the axial pressure reaches a certain value, filling gangue interactions form a certain support structure, resulting in a reaction force on the loading test head. The change in axial displacement increases slowly relative to the change in stress, and this process is known as second half of the inverted S-type.
During the process of loading greater than 100 kN, the main reason for the first half of loading being a positive S-type is, under a dead load, the filling gangue forms a temporary stable structure, with the movement space for filling gangue being small and the compaction degree being high. To break this stable structure, a larger force is required. Before breaking the stable structure, the overall deformation of the filling gangue is smaller; however, after breaking the temporary stable structure, the deformation shows a trend of rapid growth which can be called the relative “lag” of deformation.
3.3. Characteristics of Displacement Variation in the Dead Load Stage
The change in axial displacement in the dead load stage is shown in Figure 5. The curves of axial displacement and time show consistency and can be fitted by a logarithmic curve. The axial displacement initially increases rapidly during the dead load stage, then slows down gradually. At the end of dead load stage, it tends to be stable.
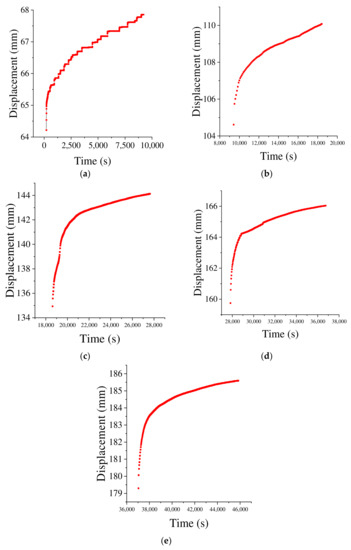
Figure 5.
Displacement–time curve for gradient loads in a natural state. (a) 100 kN; (b) 200 kN; (c) 300 kN; (d) 400 kN; (e) 500 kN.
3.4. Comparison of Deformation in the Loading and Dead Load Stages
As shown in Table 1 and Figure 6, the total displacement in terms of the filling gangue compaction test is 185.60 mm, while the displacement of the loading stage is 154.77 mm, which accounts for 83.39% of the total displacement. The displacement of the dead load stage is 30.83 mm, accounting for 16.61% of the total displacement. The loading stage is the main component of the strain. The results show that the compaction effect of filling gangue is more apparent with an increase in load. The fast subsidence of overlying strata has a more marked effect on the compaction process of filling gangue in the goaf, and the slow subsidence after the overlying strata is stable and has little effect on the compaction of the filling gangue. This corresponds to the fact that the constructions built above the goaf after the movement of the overlying rock are stable. When the stress value increases under loading, the strain value increases with no time delay. However, when the stress is stabilized at a constant value under dead load, the strain value continues to increment, but at a significantly reduced rate.
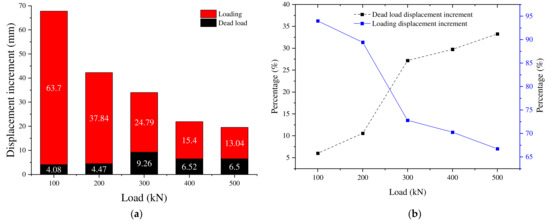
Figure 6.
Displacement increments and proportional distribution in natural state. (a) Displacement increments; (b) proportional distribution.
As shown in Table 1 and Figure 6, the displacement increment of each loading stage is 63.7, 37.84, 24.79, 15.40, and 13.04 mm, respectively, with these gradually decreasing. The percentage of each loading stage displacement increment to the displacement increment of the load gradient is 93.98%, 89.44%, 72.80%, 70.26%, and 66.73%, respectively, and the proportion of the loading displacement also decreases gradually. During the dead load stage, the displacement increment of each dead load stage is 4.08, 4.47, 9.26, 6.52, and 6.50 mm, respectively. The change in displacement increment is small, with a maximum difference of 5.18 mm. For a 300 kN dead load, the displacement increment has the maximum value. The dead load displacement of the five dead load stages for 0~500 kN is 6.01%, 10.12%, 27.20%, 29.70%, and 33.20% of the total displacement of the loading stage and the dead load stage, respectively. The percentage of dead load displacement increases gradually. The compaction effect of the loading stage is more apparent in the process of the re-compaction of filling gangue in the goaf, and the loading stage plays a controlling role in the displacement of the filling gangue.
4. Compaction Test in a Saturated State
4.1. Test Results
Based on the natural state test method, when a saturated state compaction test was performed, the filling gangue was soaked for 5 h and a water pressure of 0.2 MPa was applied by the test system. The time–load and time–displacement curves are shown in Figure 7. The variation in filling gangue parameters in the saturated state during compaction is presented in Table 2.
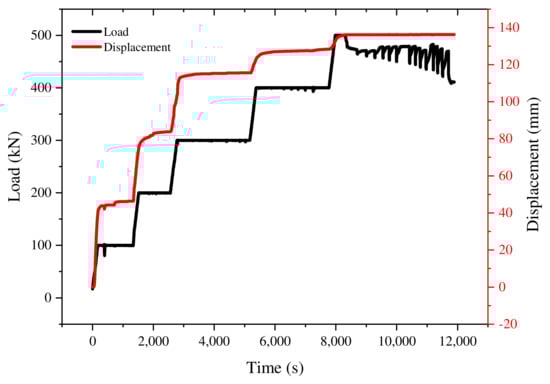
Figure 7.
Time–load and time–displacement curves in the saturated state.
Table 2.
Variation in rock parameters in the saturated water state.
The compaction of the filling gangue in the saturated state (Figure 7) shows that rock blocks with particle sizes of 40~60 mm are more broken than those in the natural state; the larger mudstone blocks produce splitting failure, the crushed mudstone mass has a muddy phenomenon, and the sand rock mass is relatively intact. With a particle size in the range of 0~40 mm, the rock block is more compacted, and the phenomenon of fragmentation is more evident.
During the loading process from the beginning of the test to 100 kN, the sound and vibration of the rupture in the test chamber were relatively mild compared with those in the natural state. This is because there is a large gap between larger particle sizes in filling gangue. The lubrication effect of water helps to adjust the angle of the rock block and reduces the strength of the filling gangue, thereby reducing the severe compression between the filling gangue. Therefore, no break sound was produced during a gradient loading of 100~500 kN; however, a shock was produced.
4.2. Characteristics of the Displacement Variation in the Loading Stage
As shown in Figure 8, the stress–displacement curve for the 0~100 kN loading process stage is special. In the 0~45 kN interval, the stress continues to increase. However, the strain variation is small. This is because the loading cylinder pressure head and the test cylinder are not completely coaxial, leading to a great amount of friction between the loading cylinder seal ring and the side wall of the test cylinder, with the data of the interval section excluded. The loading process between the 45~100 kN also shows an inverted S-type curve, which is consistent with the natural state. The 100~500 kN loading stages are also approximately a positive S-type.
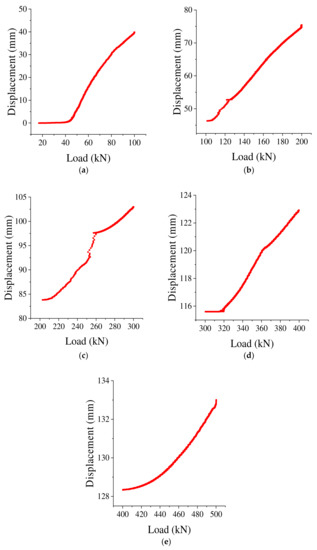
Figure 8.
Stress–displacement curve at each stage of saturated loading. (a) 0~100 kN; (b) 100~200 kN; (c) 200~300 kN; (d) 300~400 kN; (e) 400~500 kN loading.
4.3. Characteristics of the Displacement Variation in the Dead Load Stage
As shown in Figure 9, each stage of dead loading in saturated water has obvious “step” characteristics compared with natural state. As shown in Figure 9a,b, the axial displacements of 100 and 200 kN during dead loading appear as distinct step-like rises. As shown in Figure 9a, during the process of the dead loading of 100 kN, there are three high step displacement elevations, with the maximum step displacement rise being close to 2 mm, and a special phenomenon in terms of displacement rebound appears, indicating that the entire structure of the filling gangue changes. As shown in Figure 9b, there are also three step displacement elevations during the 200 kN dead load process. However, the displacement lifting amplitude is smaller, and the maximum lifting displacement is approximately 0.5 mm. Referring to the time–axial displacement curve for the 300, 400, and 500 dead loading processes, as shown in Figure 9c–e, the obvious “step” displacement lifting disappears. The axial displacement still increases, but the increment decreases, especially during the 500 kN dead load stage. This indicates that the filling gangue is more fully compressed and more stable under the water-bearing condition.
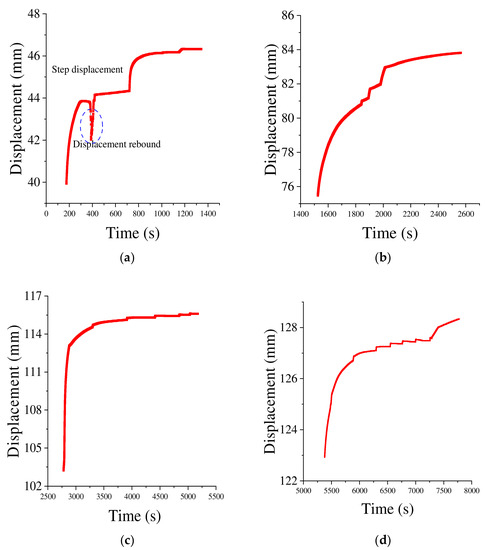
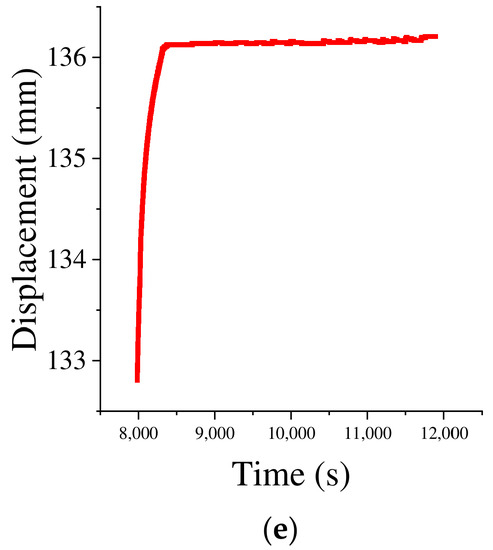
Figure 9.
Displacement–time curve for gradient dead load in saturated water. (a) 100 kN; (b) 200 kN; (c) 300 kN; (d) 400 kN; (e) 500 kN.
The main reasons for the “step” increase in displacement are as follows: on the basis of the change in displacement caused by the small particle sliding filling gap, the increase in axial displacement is mainly due to the fact that a relatively stable supporting structure is formed by the overlap of larger particles in the filling gangue or the angled filling gangue and the fact that the friction coefficient between the filling gangue can be reduced under the effect of water lubrication, producing a large displacement slip, with the position adjustment between the filling gangue being larger, which results in “step” displacement lifting.
The “step” displacement disappears. As the load gradually increases, the filling gangue becomes gradually compacted, with the position adjustment between the filling gangues now completed. The compaction of the filling gangue in the goaf is more adequate than that in the goaf containing water, and the sinking value of the roof strata increases owing to the softening effect of the water.
4.4. Comparison of the Deformation in the Loading and Dead Load Stages
As shown in Table 2 and Figure 10, the total displacement in terms of the filling gangue compaction test is 136.21 mm, while the loading stage and dead load stage displacements are 100.73 mm and 35.48 mm, accounting for 73.95% and 26.05% of the total displacement, respectively. Similar to the natural state, the strain component is a major component of the strain during the loading stage.
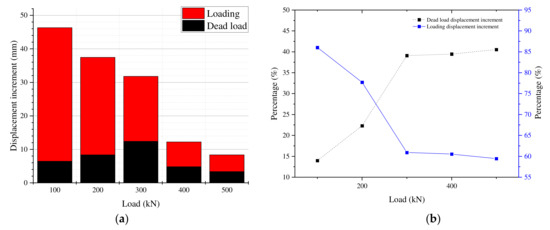
Figure 10.
Displacement increments and proportional distribution in the saturated state. (a) Displacement increments; (b) proportional distribution.
As shown in Figure 10, the displacements during the loading stage are 39.86, 29.13, 19.36, 7.41, and 4.97 mm, respectively, and thus gradually reduce. The percentages of the loading displacement to the total displacement of the load gradient are 86.03%, 77.70%, 60.90%, 60.54%, and 59.45%, respectively. Evidently, the proportion of the loading displacement decreases gradually. During the dead load stage, the displacements are 6.47, 8.36, 12.43, and 4.83 mm, respectively, and the maximum displacement is 9.04 mm. Corresponding to the natural state compaction, 300 kN is also the maximum displacement increment. The percentages of the dead load displacement to the total displacement of the load gradient are 13.97%, 22.30%, 39.10%, 39.46%, and 40.55%, respectively. Evidently, the percentage of the dead load displacement increases gradually.
5. Energy Dissipation of the Filling Gangue
During the compaction process, crushed rock void closure, friction slip, and extrusion failure are all required to dissipate energy, and the friction between the crushed rock and cylinder wall is also required to dissipate energy. The work performed by the testing machine on the crushed rock is the energy dissipated by the crushed rock [26]. Meanwhile, the work performed by the testing machine on the unit volume crushed rock can be expressed as follows:
The axial compaction stress consists of a portion of the friction between the crushed rock and the steel cylinder. When the axial compaction stress is , the lateral stress is , caused by the obstruction of lateral deformation. According to the existing experimental results, the lateral pressure coefficient is 0.43 [28]. The resulting friction is , with being the coefficient of friction between the broken rock and side wall, approximately 0.25 [29], based on which the energy dissipation of friction between the crushed stone and steel cylinder is estimated:
In the formula, H and D are the crushed rock height and diameter, respectively. H = 620 mm, H/D = 1.55, the energy dissipation of friction between the crushed stone and cylinder wall is 33% of the work of the compaction load, and the other 67% of energy dissipation is used to close the void left by the crushed stone, the friction slip between the crushed stone, and extrusion failure.
Table 3 and Figure 11 and Figure 12 show that both in the natural and water-bearing states, the strain and energy dissipation values show a consistent increase during the loading stage. The difference is that the strain is logarithmic, whereas the energy dissipation is exponential. In the natural state, for both the loading and dead load stages, the energy dissipation shows that the larger the load gradient, the larger the increase in amplitude. In the water-bearing state, the energy dissipation shows a trend of normal distribution regardless of the dead load stage in the loading stage. This is because in the natural state, the deformation shows lag, which is more beneficial to the increase in energy dissipation by the later load. In the water-bearing state, owing to the lubrication and softening of water, the deformation lag is not apparent and even shows advance. Therefore, it is more beneficial to increase the energy dissipation in the early stage.
Table 3.
Energy dissipation of the filling gangue.
Figure 11.
Strain and energy dissipation vs. load curve in natural state.
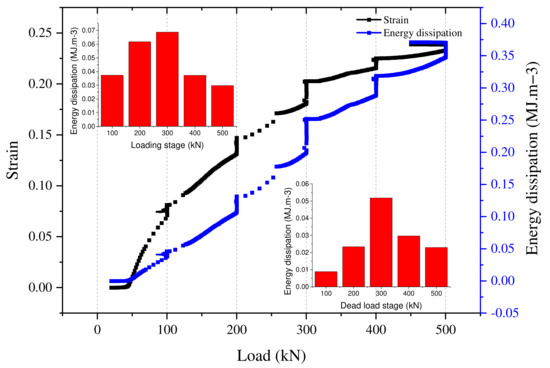
Figure 12.
Strain and energy dissipation vs. load curve in saturated state.
As the test time is relatively long in the natural state and as high pressure cannot be maintained for a long time in the water-bearing state, the stress is unloaded and the deformation appears to spring back in Figure 12, leading to the spring back of the energy dissipation. However, the order of magnitude is quite small, which does not affect the test results.
A physical diagram of the packed filling gangue is shown in Figure 13. In the natural state, after the compaction of the filling gangue, the edges and corners of the filling gangue are mostly damaged, more debris is filled in the gaps, and there is an agglomeration phenomenon. In the saturated state, when compared with the natural state, the rock blocks are split and damaged, and there is mudification. Different compaction disruption features reflect different energy dissipation features.
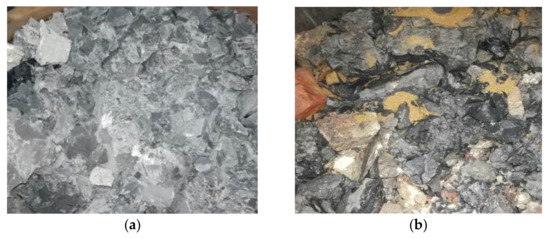
Figure 13.
Morphology of broken rocks: (a) natural state; (b) saturated state.
6. Discussion and Conclusions
The compression deformation of filling gangue determines surface subsidence. Through the drying and water filling compression test of a layered filling gangue, the deformation characteristics of the deep filling gangue were represented as extensively as possible. The influence of the gravity of mining-induced broken rock, water, and filling gangue on the deformation characteristics was analyzed.
- (1)
- Gradient loading stage: the results of the natural state test are consistent with those in the saturated state. During the loading process, the displacement–load curve for 0~100 kN is an inverted S-type, and 100~200, 200~300, 300~400, and 400~500 kN are of a positive S-type. Similar to the natural state, the displacement in the loading stage is the main component of the total displacement. However, the proportion of the loading displacement decreases gradually with an increase in load gradient in the water-saturated state.
- (2)
- Dead load stage: the displacement–time curve for each dead load test stage in the natural state is consistent, and the displacement increment of the dead load stage is small. However, the percentage of the dead load displacement gradually increases. Compared with the natural state, the axial displacement of the water-saturated state has evident “step” characteristics. The deformation in the dead load stage of the water-saturated state is higher than that of the natural state. When the natural and water-saturated states are 300 kN, the dead load deformation is the largest.
- (3)
- For both natural and water-bearing states, in the loading stage, with an increase in load, the strain and energy dissipation consistently increase. The difference is that the strain shows a logarithmic increase, while the energy dissipation shows an exponential increase. In the natural state, whether in the loading stage or in the dead load stage, the larger the load gradient, the greater the increase in range. In the water-bearing state, whether in the loading stage or the dead load stage, the energy dissipation shows a trend of normal distribution.
Author Contributions
All the authors contributed to publishing this paper. Y.L. and N.J. conceived the main idea of the paper; W.L. contributed to the theoretical analysis; C.W. analyzed the data; C.W. and M.Z. wrote the paper; D.K. and M.X. modified the figures and proofread the revised version. All authors have read and agreed to the published version of the manuscript.
Funding
This paper was supported by the High-level Talent Scientific Research Launch Fund of Anhui University of Technology (No. 2021yjrc17); China Postdoctoral Science Foundation (2022M713386); Shandong Provincial Natural Science Foundation (ZR2020QE102); Guizhou Science and Technology Major Projects (Grant No. [2018]3005), and the National Natural Science Foundation of China (No. 51974178, No. 52004146). All authors have read and agreed to the published version of the manuscript.
Institutional Review Board Statement
Not applicable.
Informed Consent Statement
Not applicable.
Data Availability Statement
All the data in this paper are available from the corresponding author upon request.
Conflicts of Interest
The authors declare no conflict of interest.
References
- Chi, M.; Li, Q.; Cao, Z.; Fang, J.; Wu, B.-Y.; Zhang, Y.; Wei, S.-R.; Liu, X.-Q.; Yang, Y.-M. Evaluation of water resources carrying capacity in ecologically fragile mining areas under the influence of underground reservoirs in coal mines. J. Clean. Prod. 2022, 379, 134449. [Google Scholar] [CrossRef]
- Karagianni, A.; Lazos, I.; Chatzipetros, A. Remote Sensing Techniques in Disaster Management: Amynteon Mine Landslides, Greece; Springer Science and Business Media Deutschland GmbH: Istanbul, Turkey, 2019. [Google Scholar]
- Shen, B.; Barton, N. fracturing mechanisms around underground openings. Geomech. Eng. 2018, 16, 35–47. [Google Scholar]
- Jaouhar, E.M.; Li, L.; Aubertin, M. An analytical solution for estimating the stresses in vertical backfilled stopes based on a circular arc distribution. Geomech. Eng. 2018, 15, 889–898. [Google Scholar]
- Moon, H.; Yang, I.J. A study on the characteristics of subsidence according to discontinuous rock masses collapse in abandoned mine. J. Korean Soc. Miner. Energy Resour. Eng. 2014, 51, 385–394. [Google Scholar]
- Yavuz, H. An estimation method for cover pressure re-establishment distance and pressure distribution in the goaf of longwall coal mines. Int. J. Rock Mech. Min. Sci. 2004, 41, 193–205. [Google Scholar] [CrossRef]
- Zhou, N.; Zhang, J.; Yan, H.; Li, M. Deformation behavior of hard roofs in solid backfill coal mining using physical models. Energies 2017, 10, 557. [Google Scholar] [CrossRef]
- Rozenblat, Y.; Portnikov, D.; Levy, A.; Kalman, H.; Aman, S.; Tomas, J. Strength distribution of particles under compression. Powder Technol. 2011, 208, 215–224. [Google Scholar] [CrossRef]
- Donohue, S.; O’sullivan, C.; Long, M. Particle breakage during cyclic triaxial loading of a carbonate sand. Géotechnique 2009, 59, 477–482. [Google Scholar] [CrossRef]
- Gupta, V.K. Effect of size distribution of the particulate material on the specific breakage rate of particles in dry ball milling. Powder Technol. 2017, 305, 714–722. [Google Scholar] [CrossRef]
- Hu, C.M.; Wang, X.Y.; Mei, Y.; Yuan, Y.L.; Zhang, S.S. Compaction techniques and construction parameters of loess as filling material. Geomech. Eng. 2018, 15, 1143–1151. [Google Scholar]
- Li, M.; Zhang, J.; Huang, Y.; Zhou, N. Effects of particle size of crushed gangue backfill materials on surface subsidence and its application under buildings. Environ. Earth Sci. 2017, 76, 603. [Google Scholar] [CrossRef]
- De Bono, J.P.; Mcdowell, G.R. The fractal micro mechanics of normal compression. Comput. Geotech. 2016, 78, 11–24. [Google Scholar] [CrossRef]
- Nieuwmeyer, F.J.; Van der Voort Maarschalk, K.; Vromans, H. Granule breakage during drying processes. Int. J. Pharm. 2007, 329, 81–87. [Google Scholar] [CrossRef]
- Ovalle, C.; Dano, C.; Hicher, P.Y.; Cisternas, M. Experimental framework for evaluating the mechanical behavior of dry and wet crushable granular materials based on the particle breakage ratio. Can. Geotech. J. 2014, 52, 587–598. [Google Scholar] [CrossRef]
- Si, L.; Zhang, H.; Wei, J.; Li, B.; Han, H. Modeling and experiment for effective diffusion coefficient of gas in water-saturated coal. Fuel 2021, 284, 118887. [Google Scholar] [CrossRef]
- Si, L.; Wei, J.; Xi, Y.; Wang, H.; Wen, Z.; Li, B.; Zhang, H. The influence of long-time water intrusion on the mineral and pore structure of coal. Fuel 2021, 290, 119848. [Google Scholar] [CrossRef]
- Li, Y.; Zhang, S.; Zhang, X. Classification and fractal characteristics of coal rock fragments under uniaxial cyclic loading conditions. Arab. J. Geosci. 2018, 11, 201. [Google Scholar] [CrossRef]
- Talbot, A.N.; Brown, H.A.; Richart, F.E. The Strength of Concrete: Its Relation to the Cement Aggregates and Water (No. 137–138); University of Illinois: Chicago, IL, USA, 1923. [Google Scholar]
- Ma, D.; Rezania, M.; Yu, H.S.; Bai, H.B. Variations of hydraulic properties of granular sandstones during water inrush: Effect of small particle migration. Eng. Geol. 2017, 217, 61–70. [Google Scholar] [CrossRef]
- Zhao, J.; Yin, L.; Guo, W. Stress–seepage coupling of cataclastic rock masses based on digital image technologies. Rock Mech. Rock Eng. 2018, 51, 2355–2372. [Google Scholar] [CrossRef]
- Golsanami, N.; Jayasuriya, M.N.; Yan, W.; Fernando, S.G.; Liu, X.; Cui, L.; Zhang, X.; Yasin, Q.; Dong, H.; Dong, X. Characterizing clay textures and their impact on the reservoir using deep learning and Lattice-Boltzmann simulation applied to SEM images. Energy 2022, 240, 122599. [Google Scholar] [CrossRef]
- Liu, Q.; Li, J.; Li, Y.; Gao, M. Recognition Methods for Coal and Coal Gangue Based on Deep Learning. IEEE Access 2021, 9, 77599–77610. [Google Scholar] [CrossRef]
- Murali, S.; Asokan, P.; Morchhale, R.K. Chapter 12—High volume fly ash utilization for reclamation of wastelands with special reference to mine spoil and ash back-haul areas for agriculture and forestry. In Modern Cartography Series; Bhunia, G.S., Chatterjee, U., Kashyap, A., Shit, P.K., Eds.; Academic Press: Cambridge, MA, USA, 2021; pp. 243–263. [Google Scholar]
- Saha, L.; Bauddh, K. Chapter 4—Characteristics of mining spoiled and oil drilling sites and adverse impacts of these activities on the environment and human health. In Phytorestoration of Abandoned Mining and Oil Drilling Sites; Bauddh, K., Korstad, J., Sharma, P., Eds.; Elsevier: Amsterdam, The Netherlands, 2021; pp. 87–101. [Google Scholar]
- Zhang, Z. Analysis of plastic deformation and energy property of marble under pseudo-triaxial compression. Chin. J. Rock Mech. Eng. 2008, 27, 273–280. [Google Scholar]
- Huang, J.; Tian, C.; Xing, L.; Bian, Z.; Miao, X. Green and sustainable mining: Underground coal mine fully mechanized solid dense stowing-mining method. Sustainability 2017, 9, 1418. [Google Scholar] [CrossRef]
- Miao, X.X.; Mao, X.B.; Hu, G.W.; Ma, Z.G. Research on broken expand and press solid characteristics of rocks and coals. J. Exp. Mech. 1997, 12, 394–399. [Google Scholar]
- Su, C.; Gu, M.; Tang, X.; Guo, W. Experiment study of compaction characteristics of crushed stones from coal seam roof. Chin. J. Rock Mech. Eng. 2012, 31, 18–26. [Google Scholar]


Publisher’s Note: MDPI stays neutral with regard to jurisdictional claims in published maps and institutional affiliations. |
© 2022 by the authors. Licensee MDPI, Basel, Switzerland. This article is an open access article distributed under the terms and conditions of the Creative Commons Attribution (CC BY) license (https://creativecommons.org/licenses/by/4.0/).