1. Introduction
According to
The State of Food Security and Nutrition in the World 2022, it was estimated that between 702 and 828 million people were affected by hunger in 2021, and about 3.1 billion people could not afford a healthy diet in 2020 [
1]. Besides that, the Food Waste Index 2021 Report presented that around 931 million tons of food produced was wasted in 2019, representing about 17% of total global food production [
2].
Food waste reduction is crucial to ensure food security, access to sufficient nutrients, and sustainable food for all populations, and it is well recognized that changes to a sustainable food system can bring environmental, health, and social benefits and economic gains [
3]. Reducing food waste brings economic benefits to consumers and operators, and the recovery and redistribution of surplus food that would otherwise be wasted has an important social dimension. It is also linked to policies for the recovery of nutrients and secondary raw materials, feed production, food safety, biodiversity, bioeconomy, waste management, and renewable energies [
3].
According to the Food and Agriculture Organization, “Food waste means waste of scarce natural resources, increasing impacts on climate change and losing the opportunity to feed an exponentially growing population” [
4].
At the environmental level, losses along the food supply chain are summarized in impacts such as loss of biodiversity, inadequate land use, soil degradation, and decreased air quality, among others. The environmental impacts of food waste occurred both in the input flows, such as water consumption, energy, land use, pesticides and fertilizers, and fossil fuels, among others, and in the output flows of the system [
5]. Food waste causes excessive carbon and greenhouse gas emissions from anaerobic waste treatments in landfills [
6].
As food moves along the food supply chain, there are several resources that are lost when food is wasted [
7]. If food that has been processed, transported, and cooked is wasted at the final stage of the food supply chain (final consumption), its impact per kg will be higher than food that is not processed and is wasted at the production stage [
5]. In this context, the concept of ecological footprint emerges, which provides an integrated and multi-stage approach, being an indicator that represents the total environmental load that is placed on the planet. It allows the assessment of the impact of all food and drinks consumed and wasted [
8], involving production, distribution, processing, storage, retail, food service, and households.
The environmental footprint of food waste includes the assessment of components such as carbon footprint, water footprint, impact of land use, and potential impact on biodiversity, and it is complemented by an economic quantification component. It is determined by multiplying the volumes of food wasted and specific factors (carbon, water, and land impact factor) [
5].
Reducing food waste will contribute to the achievement of the United Nations’ Sustainable Development Goals (SDGs). These goals include reducing the environmental and climate footprint of food systems, strengthening their resilience and ensuring food security, and focusing on issues related to the climate footprint, global transition, new opportunities, and resilience [
3]. SDG 12 intends to ensure sustainable consumption and production patterns, and specifically, in point 12.3, there is a commitment to at least halve per capita food waste by 2030, from retail to consumer through the food supply chain [
9].
The European Commission will integrate food loss and waste prevention into other European Union (EU) policies. Coordination of action at the EU level will strengthen action at the national level, and the recommendations of the EU Platform on Food Loss and Waste will help show the way forward for all actors [
3].
In developed countries, the utmost food is wasted during final consumption [
10]. The most recent report of the United Nations revealed that food waste in households in high-income countries was approximately 79 kg per capita per year (61% of food wasted). In the food service sector, food waste was about 26 kg per capita per year, representing 26% of total food waste along the food supply chain [
2]. Estimates of food waste in the EU-28 showed that households and processing were the sectors with high food waste values (72% of EU food waste), while food service represented 12% of food waste (11 million tons) [
11].
It is well known that the food service sector represents an important source of consumption away from home in Europe, including for-profit and non-profit food service establishments such as workplaces, universities, and school canteens, which are high contributors to food waste [
12,
13,
14]. High values of food waste have been reported in university canteens in different countries [
14,
15,
16], ranging from 25 to 135 g of food waste per capita [
17,
18,
19,
20,
21], which makes these settings strategic for waste reduction [
22].
University canteens have an important role in university students’ diet and may provide several benefits in terms of health, well-being, and reduction of risk factors for some chronic diseases [
23]. University canteens are important contributors to the out-of-home consumption of the students [
24]. Nevertheless, substantial amounts of foods are recurrently wasted, preventing the nutritional benefits from meals served in university canteens.
Plate waste is defined as the amount of uneaten food that remains on the consumer’s plate after a meal [
25,
26]. This in turn is preventable, as it depends on the consumer’s need and appetite, preferences, adequacy of portions served, and sensorial meals’ characteristics, among other factors [
27]. In university canteens, the demand is affected by several factors, such as menu variety and composition, daily variations in the number of consumers, weather, student activities, holidays, and others, as it is a very complex problem [
28].
The majority of food waste studies that have been conducted in university canteens focused on plate waste quantification. Nevertheless, besides quantification, it is essential to perceive the environmental, nutritional, and economic impact of food waste in order to design efficient strategies aiming at waste reduction and the achievement of SDGs. In Portugal, a country characterized by high consumption of animal products, namely meat and fish, and remarkable food waste, it is a priority to understand and transform the food system to a more sustainable system [
29]. Food waste reduction in university canteens would promote a sustainable food system and improve consumers’ health.
This study aims to evaluate food waste related to the consumption stage in a Portuguese university canteen, and its environmental, economic, and nutritional impact.
2. Materials and Methods
2.1. Ethics and Sampling Characteristics
The present study was carried out in the canteen of a Portuguese university in northern Portugal with about 7000 university students.
The canteen serves approximately 550 prepared onsite lunches per day, at reduced prices without previous booking, and is accessed predominantly by students of both genders who are aged between 18 and 22 years old during the academic school year.
Consent from the Social Services of the University, who are responsible for the management of the canteen, was previously obtained. The study complied with all of the principles of the Declaration of Helsinki. Data collection did not involve direct participation of canteen users.
2.2. University Canteen and Meal Characteristics
Canteen users collect their trays in service line, and canteen staff are responsible for plating and serving meals. A single main course of users’ choice is served by the staff using standard serving utensils. Meals are prepared according to weight-based recipes and include a vegetable soup, one of four main course options (meat, fish, pasta or ovolactovegetarian), an optional dessert (fruit or sweet), and a drink (tap water or juice).
After lunch, users place their trays on a workbench near the kitchen. Organic (plate waste) and inorganic wastes (plastic spoons, napkins, and plastic glasses) are separated by canteen staff. The canteen has specific bins to deposit plastic and paper.
Before the study began, an initial observation of canteen service and food waste was conducted for two days in order to adjust collection procedures and methodology.
2.3. Data Collection
2.3.1. Food Waste Assessment
Food waste was assessed o 10 days. In this study, food waste comprises leftovers and plate waste that have been measured by physical weighing using a digital scale accurate to the nearest gram (SECA
® model 851, Hamburg, Germany). Leftovers were defined as the food produced in the canteen but not served. Plate waste was defined as the food served to canteen users that was not eaten [
25]. The percentage of leftovers was determined by the ratio of leftovers per food produced. The percentage of plate waste was calculated by the ratio of food discarded per food served. The percentage of total food waste was determined by the ratio of plate waste and leftovers per food produced.
Before lunch service, all containers were weighed empty and after plating, and the total serving amount by food category was determined by the weight difference. At the end of the meal, plates were collected, non-edible items were removed, and edible plate waste was separated by food category and weighed. The non-edible parts, such as meat bones, fish bones, and peels (unavoidable waste), were not included as plate waste and were discarded to separate bags in order to quantify the real avoidable waste rejected by the canteen users.
2.3.2. Footprint Assessment of Food Waste
The Ecological Footprint Accounting (EFA) methodology was chosen, since it assesses and measures the dimension of resources in the socioeconomic development of populations compared to the pressures exerted on ecological assets, also considering the productivity and availability of these same assets [
30].
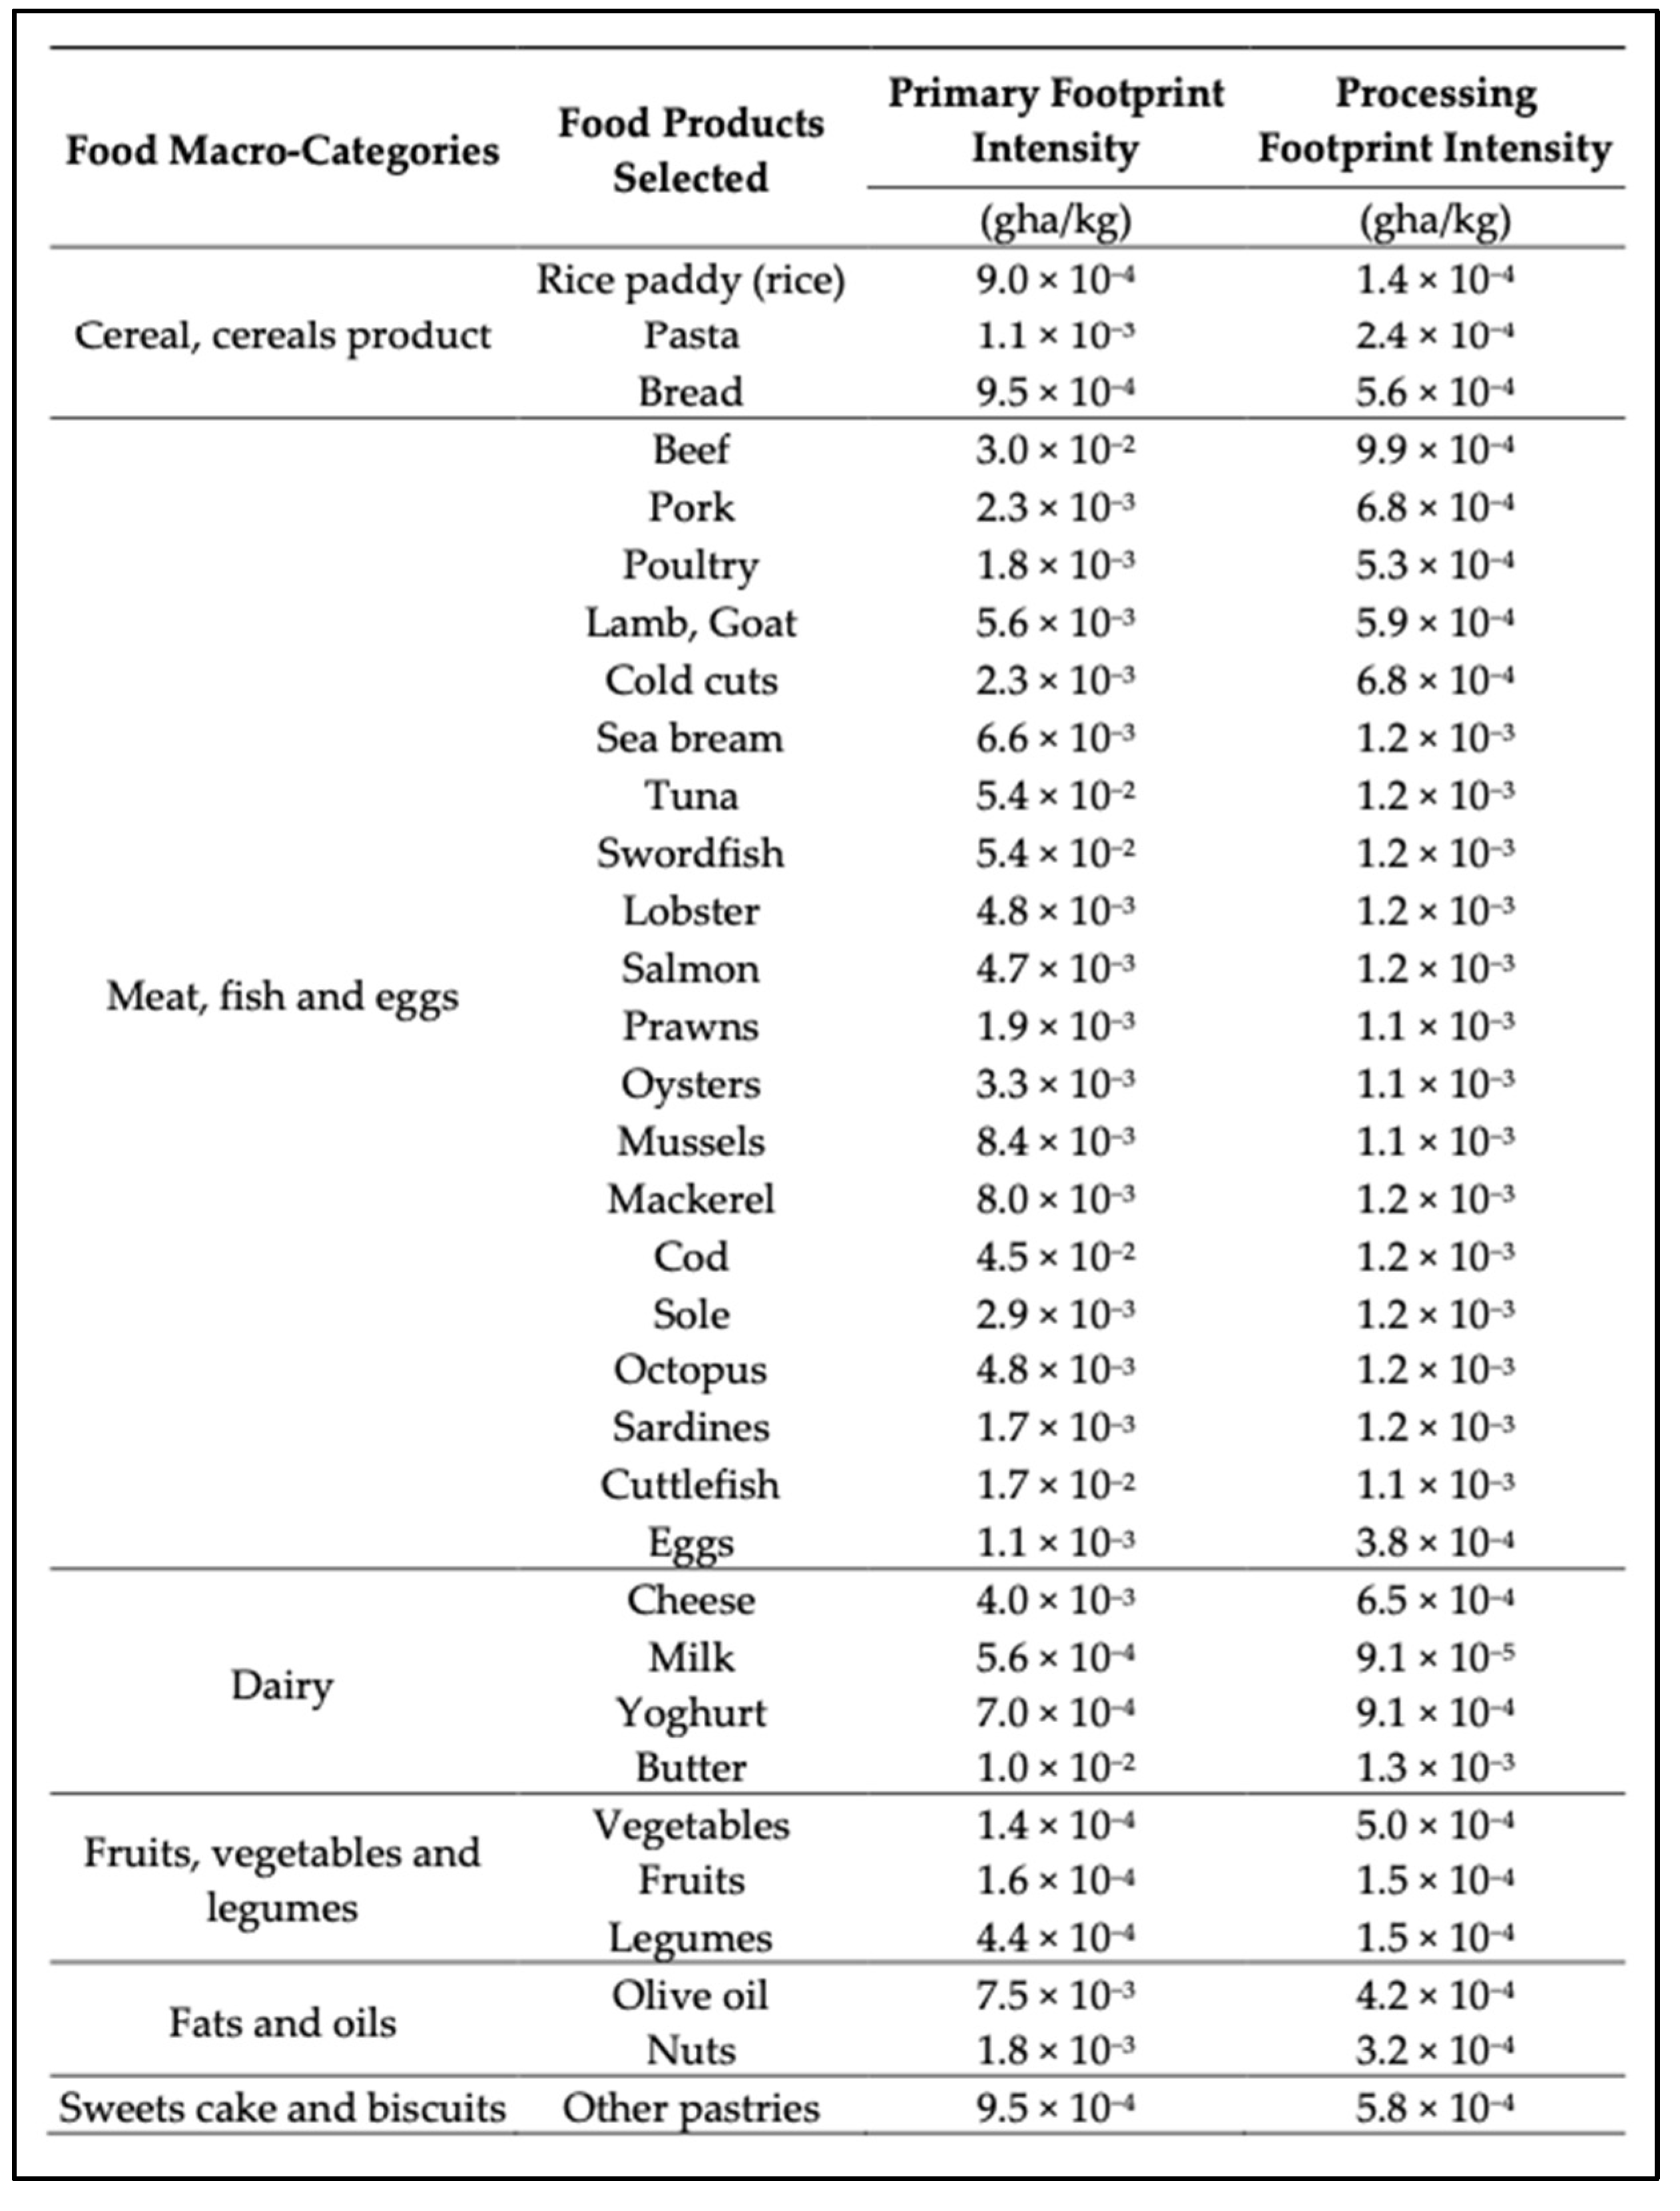
In this study, the EFA methodology was used in combination with the assessment of the ecological footprint through the ecological footprint intensities per product expressed in gha/kg (
Figure 1).
The assessment of the ecological footprint through the ecological footprint intensities considers the number of inputs needed to create a flow along the production chain, the main ecological assets tracked by the EFA methodology [
31], including the terrestrial areas for the supply of plant-based and fiber-based food, production from animals, fish areas (marine and inland) to fishery products; forests for wood production as well as for CO
2 sequestration; and built-up surfaces for the provision of shelter and other urban infrastructure [
29].
The different types of flows that are part of the human economy can be tracked via EFA, varying according to the type of products, such as cereals and products originated by human processing, which is the case of bread and meat, among others. However, some other aspects are also evaluated, such as the use of fossil fuels and electricity that cause substantial impacts on ecosystems through the release of CO
2 into the atmosphere [
32,
33].
The Global Footprint Network comprises a database containing the ecological footprint intensities, which is useful for assessing the global hectares needed to produce (primary footprint) and process 1 kg of a food product [
34].
The primary footprint corresponds to the impacts and emissions typically associated with the impacts of agriculture and livestock, and the footprint referring to processing reflects the impacts associated with the alteration of food and its processing while also encompassing processes such as transport and packaging of the product [
35].
After multiplying the quantities (kg) of each food by the ecological footprint intensity (gha/kg), we obtained the ecological footprint values (gha) per component for each sampling day and for each type of ecological footprint. For the normalization of values, the footprint values were associated with a time unit and the number of meals served.
Thus, values in gha/day and gha/meal were obtained. Values for a month (gha/month) and an academic school year (gha/school year) were also estimated.
For the assessment of footprints associated with soup waste, there were considered footprints of each dry matter constituent used to produce a kilogram of soup. After calculating the footprint of each constituent, these values were added up, and the total value of the soup’s ecological footprint was obtained.
2.3.3. Nutritional Losses Assessment
Energy and nutritional contents (macronutrients and micronutrients) of meals wasted were estimated using the nutritional analysis software Nutrium® 4.0. Foods and recipes not included in the software’s database were added based on university canteen recipes.
It was considered that lunch served in university canteen should provide 35% of the daily nutritional requirements. Considering macronutrient energy distribution recommended by the European Food Safety Authority, it was considered that lunch should provide 20% of proteins, 30% of lipids, and 50% of carbohydrates [
36].
2.3.4. Economic Losses Assessment
Economic losses assessment during the consumption stage was evaluated considering the daily meal price paid by the university students (€2.7), the daily number of consumers, and the percentage of food waste.
2.4. Data Analysis
Statistical software package IBM SPSS Statistics, version 27.0 and Excel Microsoft Office Program Professional Plus 2010 were used for data analyses. Mean, standard deviations (SD), and maximum and minimum values were used to provide descriptive analysis. Food waste and its environmental, nutritional, and economic impact are presented per day, per month (considering 22 days of canteen operation), and per academic school year (considering 200 days of canteen operation).
Mann-Whitney test and Kruskal-Wallis tests were used to evaluate differences between food waste of different food groups. Confidence level was set at 95%.
4. Discussion
This study intends to evaluate food waste associated with the final consumption in a Portuguese university canteen and its environmental, economic, and nutritional impact. Our findings showed that food waste during the study period was higher than recommended and consequently represents high economic and environmental losses. Moreover, the nutritional benefits associated with lunch served in a university canteen were lost, and consequently, consumers’ average intake failed to meet the energy and nutritional requirements.
It is important to note that during the study period, there was a decrease in the number of meals served compared to the usual number of daily served meals as a consequence of fluctuations in attendance in this type of canteen. Considering this, we can expect that a high-attendance scenario will also represent a higher amount of food waste, and consequently, the environmental, nutritional, and economic impacts would be increased.
The average amount of daily food waste was about 44 g per capita. This value is higher than the findings of a previous study at the Turku University Campus (Finland) that estimated about 25–30 g of food waste per consumer [
17]. Otherwise, different authors found higher food waste values in university canteens than those found in our study. Wu et al., 2019 estimated 73.7 g per capita of food waste at a university in Beijing [
18], and other authors showed a food waste value of 88.2 g per capita in an American university [
19].
Besides that, Abdelaal et al., 2019 surveyed the generated food waste at various food outlets at a university campus in Qatar, where they estimated about 329.5 kg of food waste per day [
15].
In recent years, food waste evaluation at university canteens has been carried out in different countries [
15,
16,
17,
18,
19]. The differences between food waste values observed in these studies may be related to different cultures, meal pre-booking systems, and differences in meal composition [
18].
In Portuguese university canteens, there are few studies developed. Ferreira et al., 2013 found that during four consecutive weeks, an average of 200 g was wasted per student in each meal [
14]. Pinto et al., 2018 evaluated food waste at another Portuguese university canteen and observed a waste value of approximately 48 g per capita before the implementation of an education campaign aiming at food waste reduction [
20].
In our study, it was observed that there was a higher consumption of protein animal-based meals than ovolactovegetarian meals. It was also observed that meat-based meals were preferred by students, in accordance with observations by Pinto et al., 2018 [
20]. Moreover, food waste was higher for meat. This finding is important since meat consumption presented a high environmental footprint related to greater natural resources associated with its production [
29]. Consumers must be encouraged to consume responsibly as a necessary shift to nutritious and safe diets with a lower environmental footprint [
37]. Promoting the Mediterranean diet would be a strategy to promote healthy and sustainable eating habits in university students [
38,
39]. The replacement of meat-based meals with vegetarian meals could result in a 32% reduction in the overall carbon footprint [
37,
39]. According to the 2019 EAT-Lancet Commission on Healthy Diets From Sustainable Food Systems, a global shift toward a more nutritious and sustainable diet is urgent. Thus, plant-based diets should be promoted, including more legumes and pulses, whole grains, vegetables, fruits and nuts, and less animal-based foods, especially red meat and processed meat [
37,
40]. Ovolactovegetarian dishes presented a low adhesion as well as a high waste value in this study. These findings could be related to cultural habits (traditions, beliefs, and values) and food preferences. Traditionally, Portuguese meals are characterized by a high availability of animal food products, namely in the north of the country, where meat prevails in typical dishes. This fact could determine the low acceptance of ovolactovegetarian meals observed in this study. Promoting vegetarian meals in canteen universities would be an efficient strategy for encouraging sustainable eating habits and environmental awareness. It is estimated that switching from a meat meal to a vegan or a vegetarian meal significantly helps to lower GHG emissions [
40].
The highest ecological footprint resulting from food waste in this case study was associated with the meat and fish groups. Our results are in accordance with a recent study that showed that red meat accounted for more than 30% of total GHG emissions related to food waste, although it contributed only 4% by weight [
41]. It is well known that meat and fish represent important production volumes and intensities and therefore have considerable impacts on biodiversity. The consumption and waste of fish and meat products, namely red meats, put a lot of pressure on the planet’s ecological assets, specifically plantations, pastures, forests, fish, built-up land, and carbon absorption [
31], which are being consumed at a rate of almost 70% faster than they are renewed. The production of one unit (e.g., one kg) of them requires more resources and CO
2 emissions (i.e., higher ecological footprint intensities) than that associated with poultry, vegetables, cereals, or dairy products.
Different authors have shown that plate waste in university canteens is caused by the lack of meal planning and standardization of processes, as well as by the low quality of food and the large portions served. Adjusting portions and promoting proper preparation and cooking processes are essential to make meals more appealing to consumers. Cooks should be aware of the impact and consequences of food waste and be the subject of ongoing training sessions [
14,
39].
Few studies on food waste in university canteens estimated the associated costs because food waste is widely studied as an environmental problem. This case study also aims to demonstrate the scale of economic losses generated by food waste in the university, which leads to a great impact when reflected over a longer period. Considering the nutritional impact of food waste estimated for one academic school year, in our study, we observed that the energy associated with the food wasted could be enough to supply the nutritional needs for lunch of approximately 156 consumers [
36].
Regarding the results, it will be important to consider a continuous system of monitoring food waste in order to diagnose and implement measurements to optimize resources and processes and reduce food waste, as well as to identify economic losses that can be used for the acquisition of superior quality products with a lower environmental footprint, such as seasonal and local production products. In line with the Farm to Fork Strategy, food services should promote access to food from cost-effective sources, such as organic production and aquaculture, and from short food supply chains [
3].
In addition, many of the products consumed and wasted in this study are imported from other countries, which increases the intensity of the ecological footprint due to emissions resulting from the transport of the origin country to the final consumer. Planning menus with local and seasonal foods should be encouraged by governmental institutions and food policies aiming to meet sustainable development goals and simultaneously contribute to a lower environmental impact resulting from food waste [
9,
39].
Some limitations were identified in the present study. Bread and desserts discarded were not always considered due to canteen service constraints. The lack of this information could be a source of bias in evaluating the nutritional and environmental impacts. To determine the economic impact, the costs associated with the collection, treatment, and disposal of food waste were not considered, and that could be a source of bias in evaluating the economic impact. Additionally, and considering the methodology chosen, not all foods present at the meals evaluated had available information on the footprint intensities. To overcome this limitation, we used the most similar food values in terms of production and processing processes [
29].
5. Conclusions
The high food waste values observed (about 13.4%) in this university canteen estimate a monthly economic loss of €3080, an ecological footprint of 2.8 gha, and a total food waste of 417 kg.
During the study period, plate waste (164.1 kg) presented higher values than leftovers (25.3 kg).
Based on these results, we suggest that university canteens should adopt strategies to promote a healthier and sustainable food system. Reducing food waste is an important step to achieve this goal. Implementing an online pre-booking meal system, sensitizing food handlers and cooks to food waste, and providing training regarding portion sizes through a model plate or standardized utensils can be important strategies to increase meal sustainability. Moreover, awareness-raising actions with the active involvement of university students, as well as the development of digital applications for continuous food waste monitoring, the improvement of menu planning, focusing on the reduction of animal-based products’ availability, and the inclusion of local and seasonal products while prioritizing of fresh and minimally processed foods, are crucial to promote a more adequate, healthy, and sustainable diet in this setting.


 ,
, 


