Article

Application of Geodesign Techniques for Ecological Engineered Landscaping of Urban River Wetlands: A Case Study of Yuhangtang River

1
Department of Environmental Design, School of Design and Architecture, Zhejiang University of Technology, 288 Liuhe Rd., West Lake District, Hangzhou 310023, China
2
Beijing Enterprises Water Group Co., Ltd. (Company of Eastern Region), 108 Yunlian Rd., Yuhang District, Hangzhou 311121, China
*
Author to whom correspondence should be addressed.
Sustainability 2022, 14(23), 15612; https://doi.org/10.3390/su142315612
Submission received: 26 October 2022 / Revised: 22 November 2022 / Accepted: 22 November 2022 / Published: 24 November 2022

Abstract

:
Although geodesign techniques have been studied and developed worldwide, there is still a lack of in-depth application of geodesign workflows for redesigning urban river wetlands with characteristics of ecologically engineered landscaping (EEL). The study mainly aims at putting forward a proper approach in the methodological foundation for EEL practices in river wetlands. A typical EEL-oriented project of river restoration in Hangzhou, China, was conducted in this study. Based on in-situ geodata and tools within QGIS, individual geological factors analysis, with the hierarchical analysis method (AHP) and ecological vulnerability evaluation (EVE), was conducted by experts’ voting and the weighted linear combination (WLC) method. Analysis of hydrological-related factors proceeded. This GIS-based analysis with expert knowledge provided comprehensive redesign solutions for the redesign project, i.e., restoration of the riverbed, spatial restoration in the horizontal and vertical dimensions, and integration with the multifunctional design. Detailed three-dimensional models for design practices were developed to present redesigned topology and space accordingly. Terrain, inundation, and visibility analysis proceeded with parametric mapping programs within Grasshopper to check the feasibility. The adapted geodesign-based workflow in the study also applies to the site analysis, sustainable assessment and landscape planning for urban wetlands EEL projects.

1. Introduction

Geodesign is defined as a design and planning methodology that closely integrates the digital design process with geographical knowledge and geographic and environmental modelling tools, i.e., 3-D modelling, a geological information system (GIS), and a building information modelling system (BIM) [1]. The geodesign movement, which emerged in the 2000s, was initiated by both academics and practitioners from spatial planning and related disciplines, i.e., landscape architecture, ecology, tourism, and urban design [2]. Since the 2010s, geodesign solutions have been frequently integrated with sketching, modelling, GIS, and parametric design tools. Geodesign solutions have been introduced into quantitative-tool-based design practices by planning and engineering consultancies, e.g., AECOM, Jacobs, etc. [3].
Hybrid geodesign systems with various techniques and platforms are more process-driven. Sufficient and reliable information is vital for geodesign. The datasets in different formats (2-D drawings, raster files, vector files, 3-D models) with geographic data are often preceded in geodesign practice by suitable spatial-temporal scales. Graphic tools are used for 2-D drawings and 3-D modelling, simulation tools are used for predictions of dynamic physical geographic situations, and digitalisation tools are used in image interpretation and/or design presentation. Thus, specific knowledge should be obtained from various geographic information, which can be comprehended and further interpreted into landscape design interventions [4]. In the lifecycle of landscape design, six step-by-step models of stages, i.e., representation, process, evaluation, change, and impact, are recommended to be produced by landscape architects [5]. Steinitz at Harvard University developed and applied concepts about specific shifts in macro-scale design workflows for landscape architects, i.e., six steps of geodesign with corresponding dynamic, conceptual hydrologic modelling. A six-steps-based decision workflow called the Steinitz Geodesign Framework was scoped, designed, and implemented for the planning of rivers [6]. Geodesign methodology is often of help to identify conflicts and verify the suitability of landscape and urban design by geostatistical calculation, e.g., scenario-based flood risk assessment [7]. The status quo of geodesign theory has also occurred in practical academic collaboration applicable to the education of landscape architects [8].
River wetlands are among the most diverse ecosystems in most climate zones with high environmental heterogeneity. Water connectivity between rivers and floodplain lakes is critical for maintaining biodiversity and ecological functions [9]. River wetlands often have characteristics of linear morphology and dynamic water levels, constituting their unique spatial structure and the function of ecosystems and water quality treatment (WQT) [10]. By incorporating ecological engineered landscaping (EEL) measures into the construction of river wetlands, various advantages can be developed, i.e., shore and river restoration, landscape enhancement of wildlife habitats, and natural education, as well as other utilities, which will create a comprehensive urban green infrastructure (GI) and eco-landscapes [11]. Urban river naturalisation projects have been conducted successfully for public open spaces in eastern Asia, e.g., River Cheonggyecheon in South Korea [12]. However, there is still a lack of practical research on geodesign-based methodologies for river wetlands landscaping. Advanced digital geo-mapping tools are still seldom integrated into EEL projects of river wetlands, especially for those geodesign tools for complex spatial analysis, e.g., ecological vulnerability analysis, viewshed analysis, flood risk analysis, etc. [13], which should be taken into consideration. In this research, geodesign-based workflows of planning and designing small-scale river restorations are presented and integrated with geodesign-based approaches as the methodology, which can be further applied in similar landscaping projects.

2. Materials and Methods

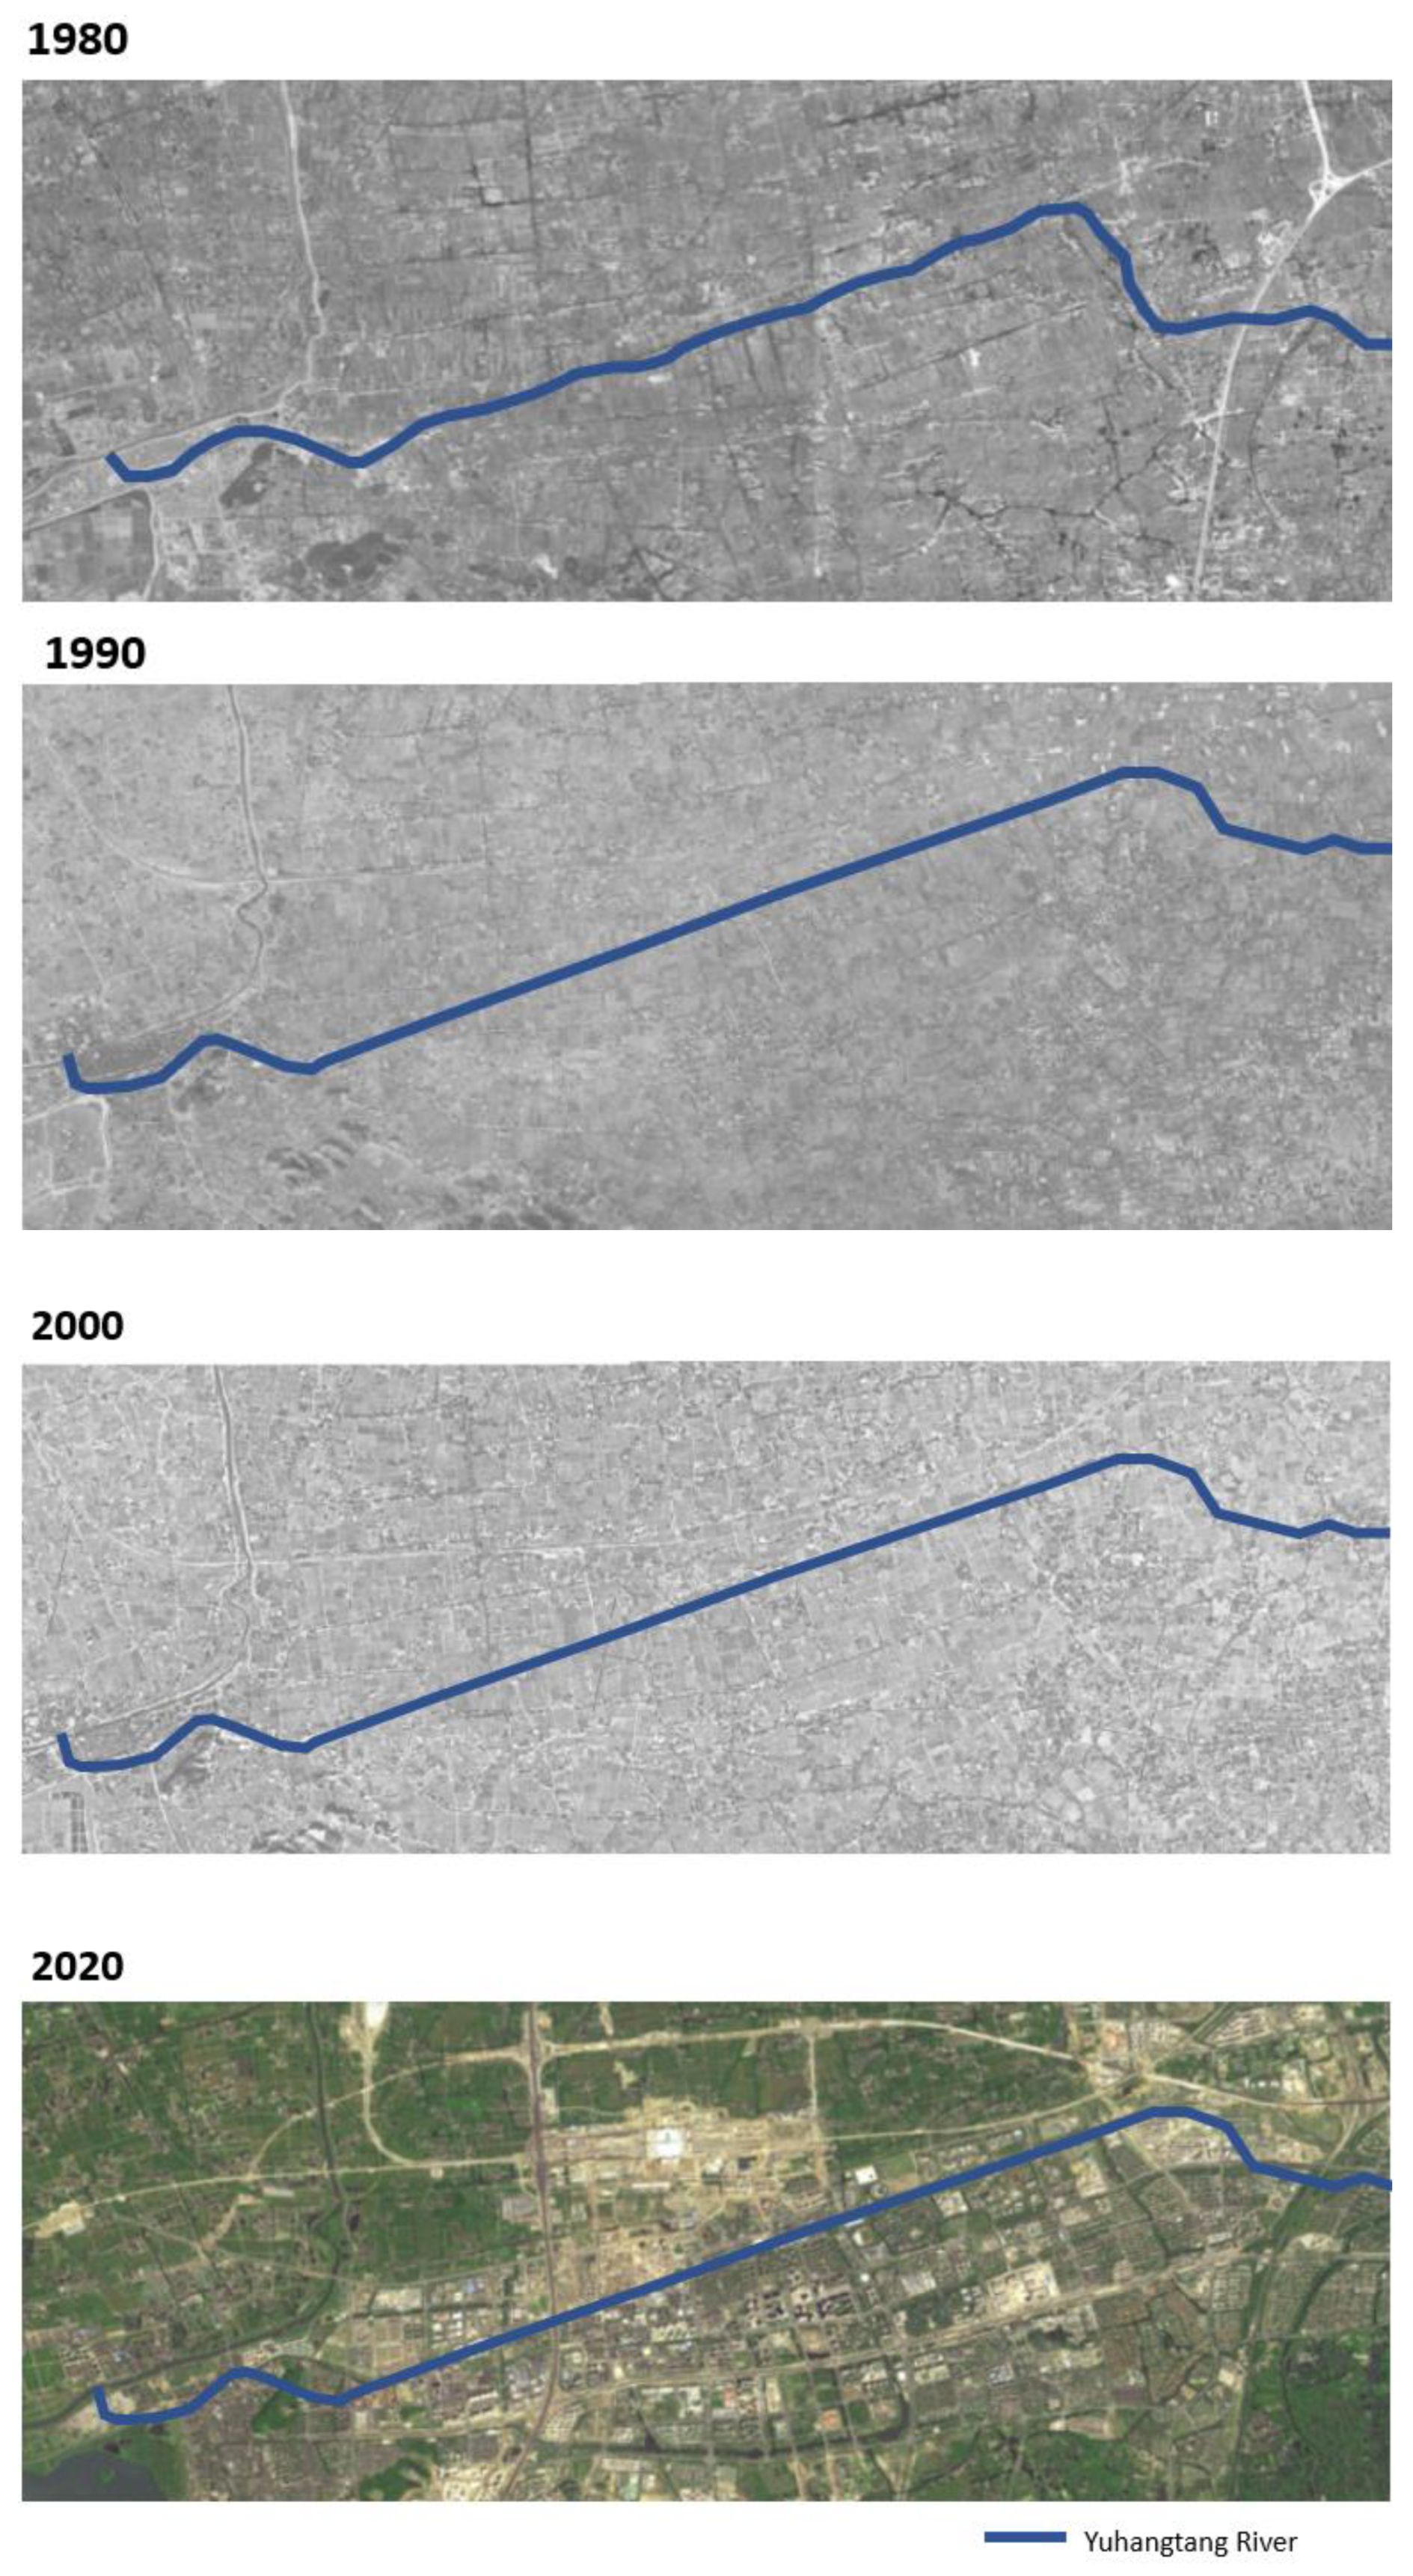
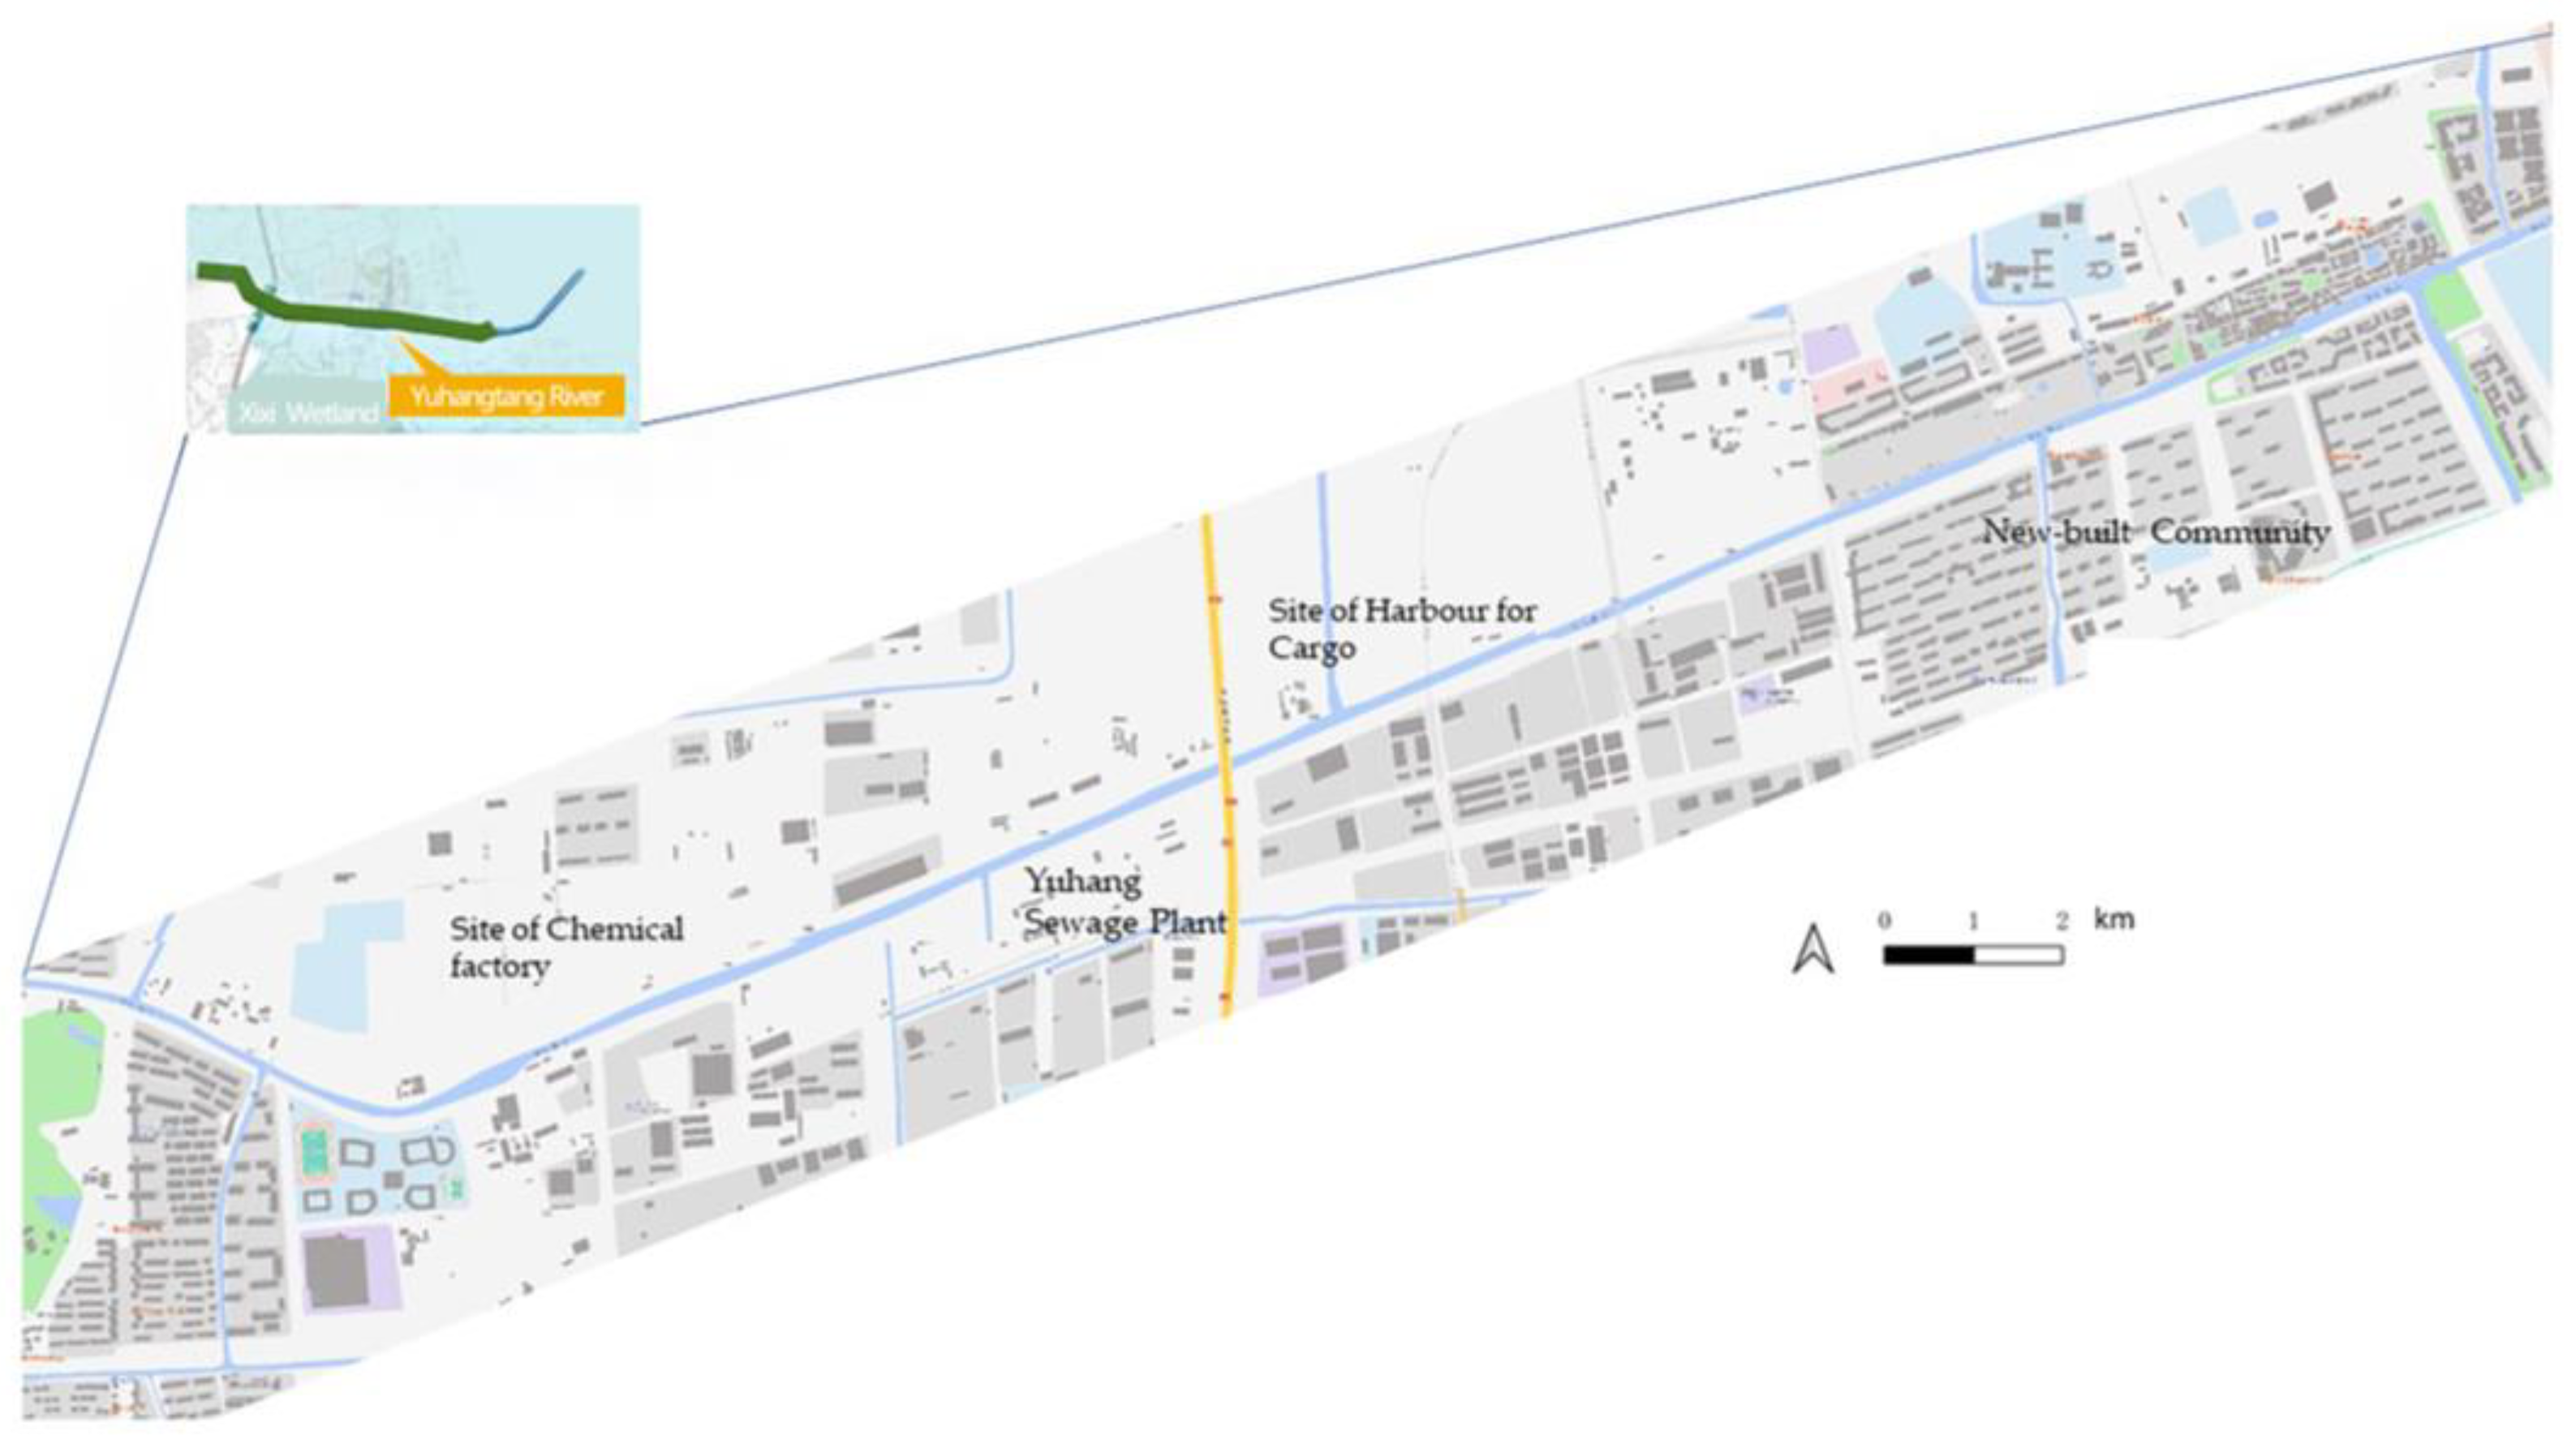
2.1. Introduction of the Study Area

Yuhang District of Hangzhou City is located in the transition zone of the hilly plains of the western Zhejiang Province, China, with diversified geomorphological features. The water system in Yuhang is centred on the Tiao River basin, originating in the East Mt. Tianmu and flowing from west to east through Hangzhou, which has been a source of water supply for the district through the ages. Yuhangtang River is the main downstream channel of the Tiao River (119.92° E–120.05° E, 30.26° N–30.31° N) with a total length of 19.8 km. During 605–618 A.D., the Yuhangtang River was dredged for canal transport and was one of the main waterways in the Yuhang District, located north of Xixi Wetland. A harbour for cargo ships was established near the Tiao River during the Northern Song Dynasty. In 1359, the river was connected to the Grand Canal to promote navigation.
Since the second half of the 20th Century, the water environment surrounding the Yuhangtang River wetland has changed dramatically, as temporal satellite remote sensing (RS) images show in Figure 1. In the 1970s, Riverbanks were reconstructed into rip-raps, and the river was cut and straightened for flood prevention. Around 1980, the Thermal Power Plant of Hangzhou was constructed along the river, while the river wetland was transformed into a river for coal transportation. Simultaneously, chemical plants along the river began to discharge industrial wastewater into the river. Furthermore, riverbeds were artificially extracted and excavated. From 1990 to 2008, 18 wharves were built along the river to transport approximately 19,000 tons of cargo, i.e., stone, coal, and sand. Thus, water pollution has grown increasingly severe. In 2009, the power plant and the chemical plant were shut down for industrial transformation and upgrading and Yuhangtang River was closed to cargo ships. Yuhang Sewage Treatment Plant set up a wastewater treatment system to discharge effluent into the river after the water quality treatment (WQT) process.
To enhance the ecogeographic variability of the wetlands, the Environmental Protection Bureau of Hangzhou decided to restore certain segments of the river along the downtown as a constructed river wetland for multiple functions, i.e., flood storage, wildlife preservation, natural education, and WQT. Since 2018, a water environment management project for the Tiao River has been coordinated. 8400 m-long riverbanks were planned to be renovated; an area of 71.85 million m² along the river has been restored by various engineering measures, including barge renovation, maintenance of bridges and facilities, water supply and drainage engineering, etc. However, in 2020, although a certain part of the Tiao River was partially restored, water quality standards for individual parameters of the Yuhangtang River failed to meet hydrogeological standards in P. R. China. Moreover, the project is still focused on hydroengineering and lacks EEL planning and design for the river wetland per se. A regional map of the study range of the EEL redesign is presented in Figure 2.

2.2. Research Design

2.2.1. Methodology and Research Process

Compared with other qualitative models for ecology, GIS-based suitability models with expert knowledge are more general, fuzzy, and predictive, which scopes better for specific planning research [14]. For 2-D drawings that do not accurately depict topographic information, 3-D geoprocessing is acquired during the practice. For qualitative design methods that are not sufficient for EEL of urban river wetlands, a multi-process technical framework combined with multiple geodesign technologies is essential, which produces an intelligent and accurate workflow for landscape planning and design. The framework of the research process is presented in Figure 3.
Firstly, the hierarchical analysis method (AHP), used for multi-criteria decision analysis (MCDA), is implemented within GIS [15]. The AHP method judges the relative importance of the criteria for measuring the achievability of each objective [16]. The hierarchical structure of the AHP model consists of two levels. The AHP voting is conducted by experts, who reasonably give the weights of each bar for each decision option. Ranks of importance are determined to find the order of merit of each option. Secondly, weighted linear combination (WLC) is used for evaluation within the GIS environment to calculate the ecological vulnerability evaluation (EVE) index. In accordance with redesign solutions provided by experts referencing geospatial analysis, landscape architects conduct in situ adaption for microscale redesign for trade-offs. Later, during the redesign process, a detailed 3-D model constructed of the project is made by professional landscape architects within Rhinoceros 7 (a software developed by Robert McNeel & Associates, Seattle, WA, USA). At last, to further test the suitability, geospatial analysis programs for slope and inundation of terrains in the study area are developed within Grasshopper 1.0.

2.2.2. Tools for the Geodesign Process

Overall, geodesign software was implemented in the study. QIS 3.18 is open software for geomorphic analysis and geostatic analysis (developed by Open Source eospatial Foundation (OSGeo), Bern, Switzerland). Rhinoceros 7 is a multi-functional digital modelling software package for landscape architecture, geography, and engineering. Grasshopper 1.0 is the parametric platform of Rhinoceros 7 (developed by Robert McNeel & Associates, Seattle, WA, USA).

2.2.3. Specification and Limitation of Geodata

Accurate landscape morphology plays a vital role in understanding the study area. Increased GIS adaptions are effective in both spatial data interpretation and visualisation, especially in those domains related to landscape ecology [17]. Data conducted from laser scanning technology can describe the landscape in 3 dimensions. A DEM dataset transformed from a point cloud model (DEM resolution: 30 m, geodetic datum: WGS84, sampling time: 2022) and 2D shapefiles of river reaches, provided by the Geographic Information Public Service Platform of Zhejiang Province, P. R. China, was adopted.
However, in the design practice, professional data and software for conducting hydraulic models for assessing the accurate performance of WSUD designs were lacking. Thus, only the topological rainstorm risk index (TRRI) was available for predicting rainstorm and flood risks.

3. Results

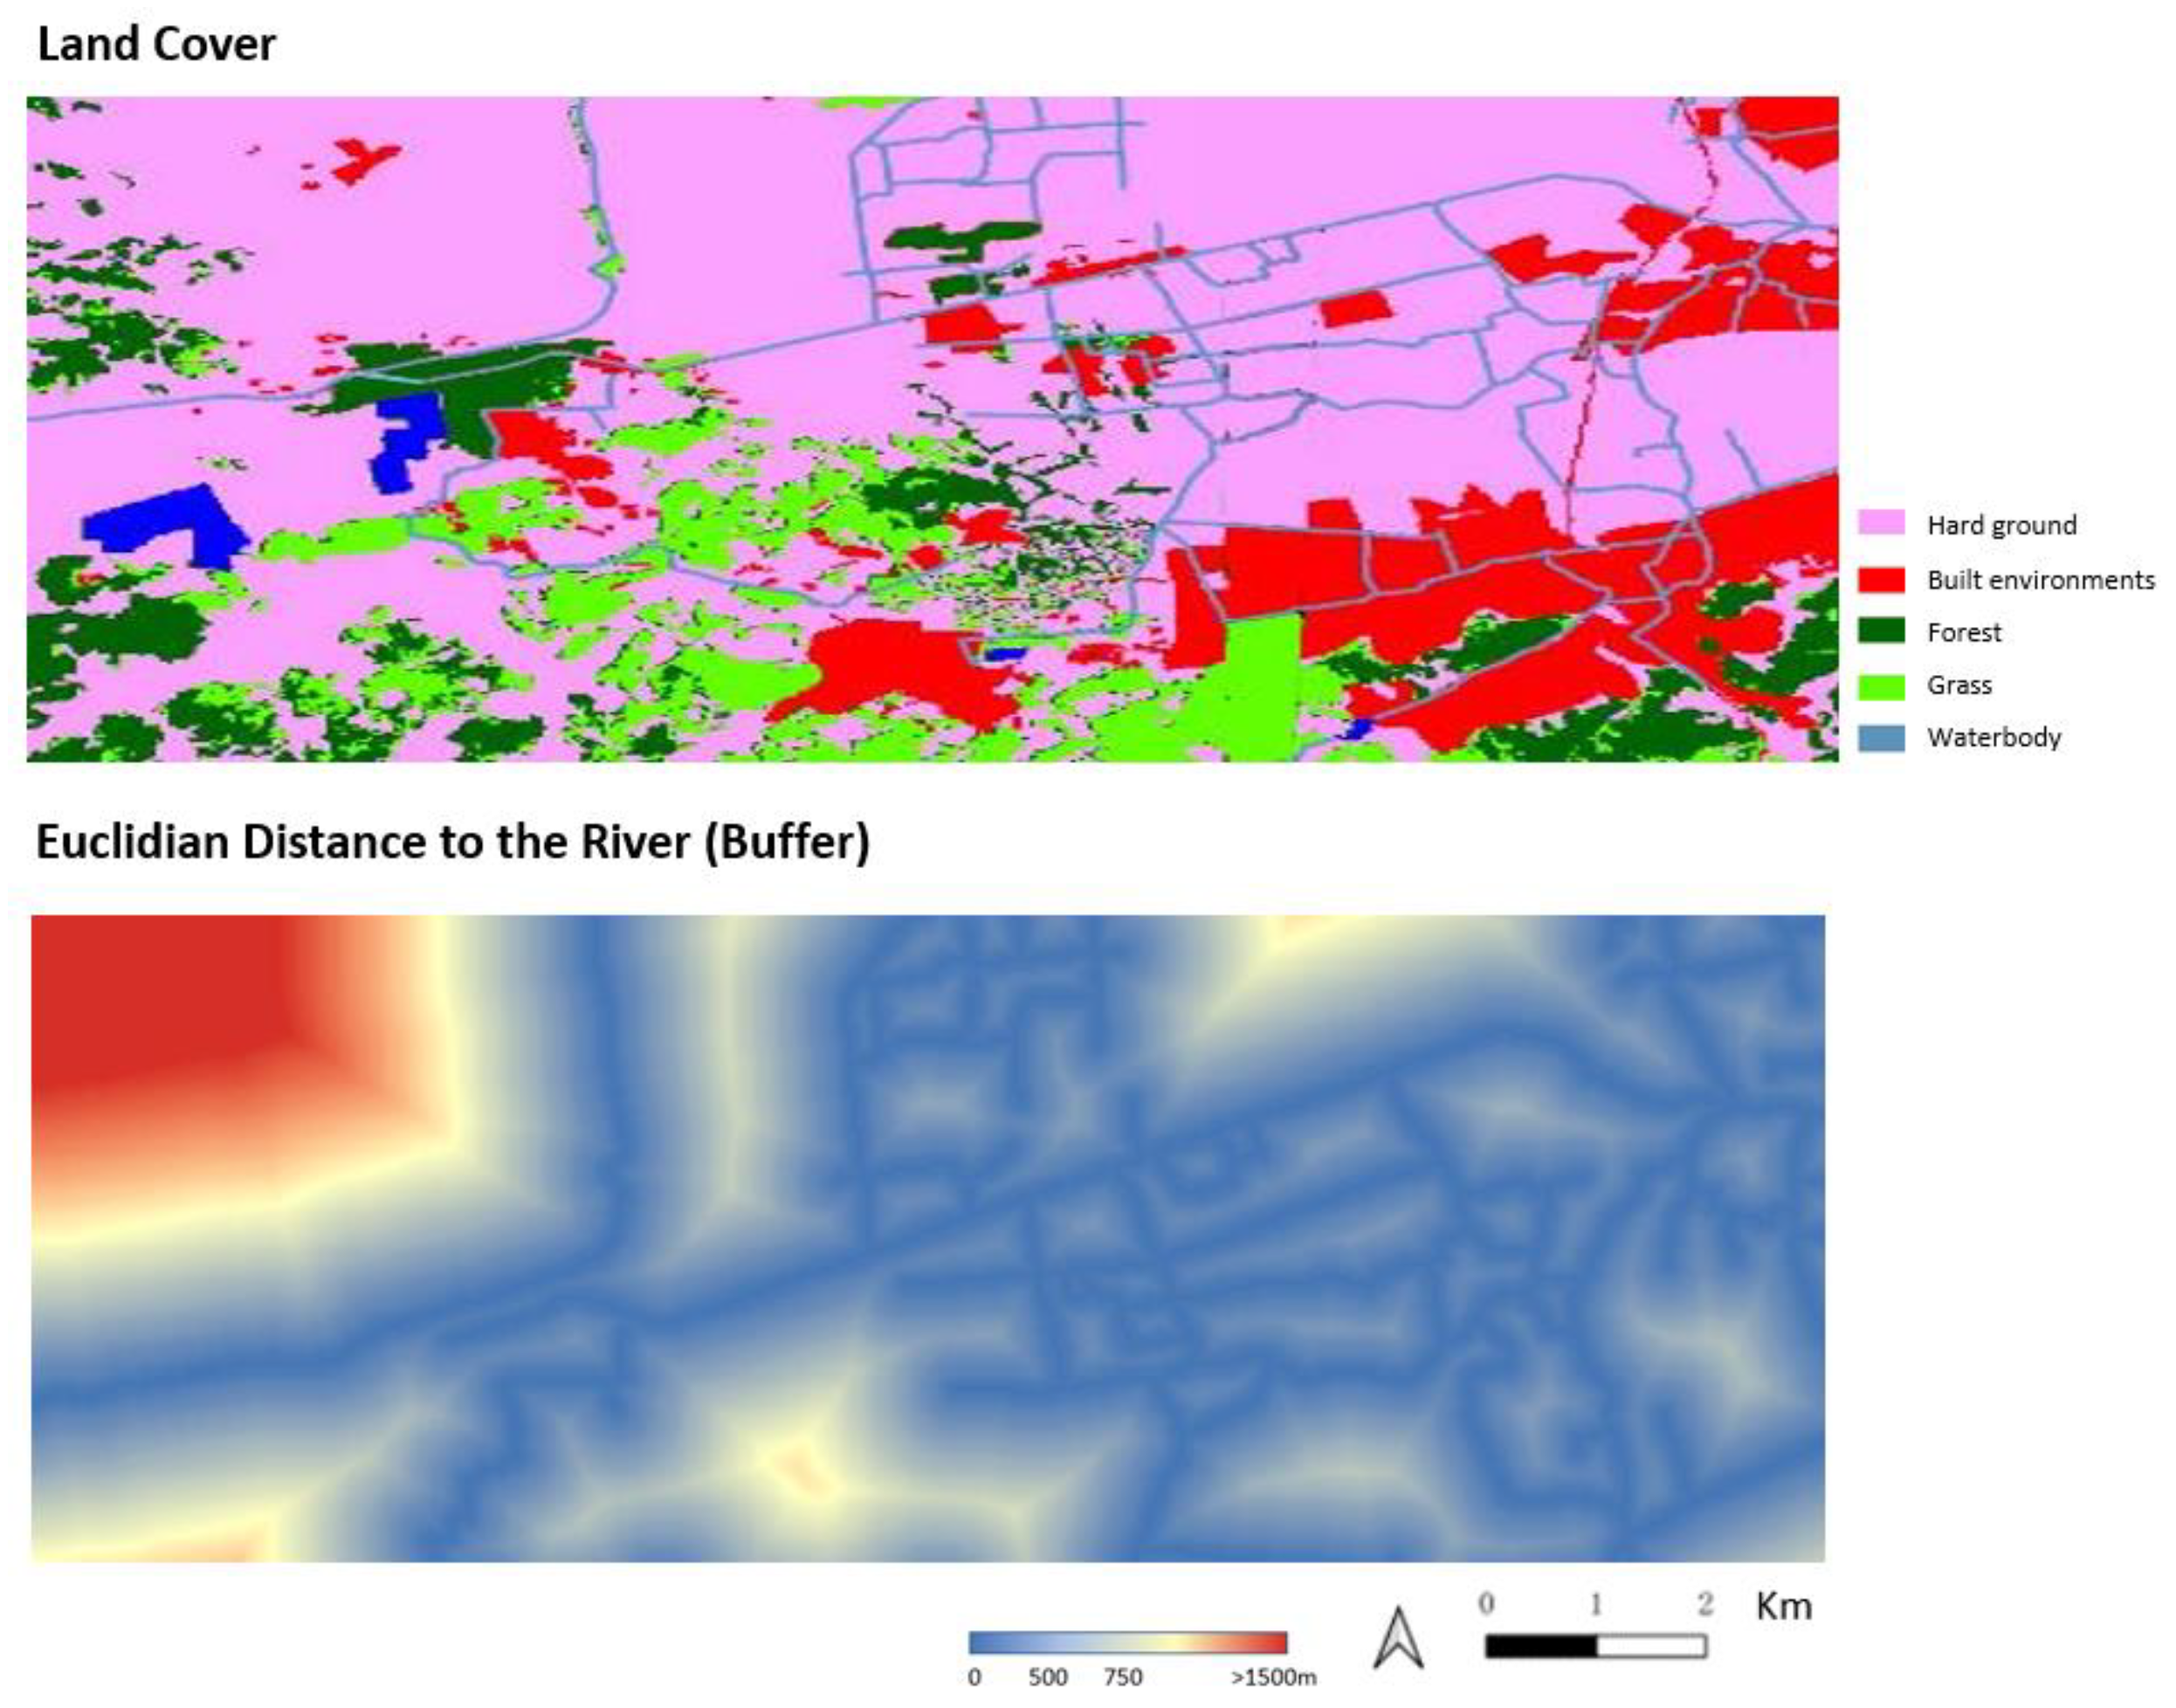
3.1. Individual Geological Factors Analysis

Topography often influences water quantity and quality in river wetlands as a typical design element in EEL projects. The regular channel cross-section can be effectively reduced by combining topography with embankment and barge morphology in practical engineering. It is indicated that geomorphologic factors heavily affect the water-land interface with different inundation cycles [18]. Simultaneously, riparian zones can retain and purify stormwater runoff and promote infiltration, primarily dependent on geomorphic conditions [19]. For limited available geodata, some landscape-related criteria, e.g., viewshed, scenic beauty, vegetation, etc. have not been taken into AHP criteria. Thus, only 6 individual factors, i.e., slope, aspects, and topological toughness, have been considered. Topological roughness is defined by Riley’s TRI index.
Most GIS and 3-D modelling software offer spatial manipulation functionalities. The raster analysis function in QGIS 3.0 was used to conduct single-factor analyses of the physical geography, i.e., elevation, aspect, slope, and terrain roughness. As shown in Figure 4, the topography of the study area is mainly flat, with scattered hills on the south side, a northwest–southeast slope, and a gentle slope near the main river on the north side. Scattered topographic relief exists in the central part of the basin. The topological relief is small except for the hilly areas on the south side. The slope on the southeastern side of the basin is undulating, and the basin slopes. The riparian terraces near the river wetland are relatively flat.
Land covers surrounding the river have significantly changed in recent years for suburban development. Thus, it was necessary to study the surface cover along the river. Based on the GlobeLand30 dataset (DEM resolution: 30 m, geodetic datum: WGS84, sampling time: 2021), the remote sensing images were further modified based on the field survey, and the surface cover of the surroundings along the river wetland was mapped by RS interpretation and necessary manual modification, according to the in-situ survey. Land cover and Euclidian distance to the river wetland (wetland buffer distance) are presented in Figure 5. Impervious surfaces dominate the terrain of the river basin, and the waterbodies are mostly channelised. The primary water source in the basin comes from the lakes and reservoirs on the west and north sides. Architecture clusters along the foothills east and south of the river basin. At the southwest of the river basin, there are patches of dense forests and woodlands.

3.2. AHP-Based Ecological Vulnerability Evaluation

3.2.1. AHP Weights and Rating

In existing studies, AHP-based GIS mapping has been adopted in selecting potential sites for water harvesting for identifying landscape potentials of urban rivers [20] and holistic flood hazard zones [21]. AHP-based ecological vulnerability evaluation is one of the quantitative mapping techniques for geodesign studies for wetlands. Area-based flood risk maps can be generated based on a fuzzy AHP technique consisting of thirteen flood vulnerability and hazard criteria [22]. Vulnerability maps were also developed with multiple parameters, including physical and human geographical ones [23]. Otherwise, ecological vulnerability evaluation (EVE) has seldom been integrated with river wetlands EEL.
The EVE index for river wetlands was developed to assess the river wetland’s ecological vulnerability accurately. As different evaluation criteria have their impacts on environmental vulnerability, six individual criteria were selected to constitute the EVE index based on the characteristics of river wetland ecosystems, combined with the accessibility and operability of raw geographic data of urban wetlands, mainly for geomorphic elements, namely, wetland buffer distance (B1), slope (B2), aspect (B3), topological roughness (B4), land cover (B5), and elevation (B6). These six criteria apply to the ecological vulnerability evaluation of urban semi-natural river wetlands [24]. However, for limited available geodata and feasibility of data processing, some landscape-related criteria, e.g., viewshed, scenic beauty, vegetation, etc. have not been taken into AHP criteria. Limited to the composition of the project team, five experts in five related fields, respectively, i.e., hydroengineering, geography, ecology, urban design, and landscape architecture, were invited to rate the weights of relevant indicators. A face-to-face voting process was conducted, during which voting questionnaires on a scale of 1 to 9 were distributed (1 = Equal significance in a pair, 3 = Moderate significance, 5 = Obvious significance, 7 = Strong significance, 9 = Extreme significance) (Table 1). The voting questionnaires were set to figure out the comparative ranks of significance between every pair of factors, such as B1-B2, B2-B3, etc. Experts were required to cross-click for every pair per row.
Using the software “Yaahp”, a pairwise comparison matrix (PPM) was constructed from voting results by the experts. The most potent factors were given the most significant weight at each level, and vice versa [25]. The weight value of each index in the EVE evaluation was obtained (Table 2). To get rid of possible errors of judgements, it was necessary to assess whether the pair-wise comparisons were consistent. Therefore, Wi and the consistency ratio (CR) of all data were also calculated according to Saaty [26]. The CR value of the matrix is 0.0765, which satisfies the consistency test according to statistical studies [27].

3.2.2. AHP-Based EVE Mapping

The EVE index put forward in the study is a dimensionless number which identifies an ecological vulnerability. As explained above, the EVE index equals the total weight of the integrated single-factor geological analysis layer, which can be generated following the weighted linear combination (WLC) method by Formula (1).
EVE = Bw·Bv + SLw·SLv + Aw·Av + TRw·TRv + LCw·LCv + Ew·Ev
In the formula above: w—the weight of each criterion, v—the voting score of each criterion, namely: Wetland buffer distance (B), Slope (SL), Aspect (A), Topological roughness (TR), Land cover (LC) and Elevation (E). Wetland buffer distance is determined by the Euclidean distance to the outer edge of the river at the normal water level. The elevations are defined as altitudes above the mean sea level (m) of the Yellow Sea. The weights of each criterion are listed in Table 3, according to expert voting.
Then, the following GIS tools and techniques were utilised for EVE mapping (Figure 6).
  • “Rasterize” tool to convert all maps to raster layers;
  • “Reclassify by the table” tool for raster layers, where the table for reclassification was set manually;
  • “Raster calculator” tool, by which the EVE index was calculated by the WLC method, in accordance with the weights in Table 3;
  • “Reclassify by the table” tool for calculating EVE index layers by WLC method, where the table for reclassification was set by the 5-class Natural Jenks method.
It can be indicated that the EVE of the river wetland is moderate in general. Areas with higher EVEs are concentrated in the upper reaches of the main river channel to the west and the lower tributaries of the river channel to the southeast. The ecological sensitivity of the riverfront generally decreases from upstream to downstream. Thus, in practical planning and design, the upstream riverfront area along the west reach will be divided into four reaches, which respectively focus on water conservancy, flood control, ecological restoration, and eco-tourism. In contrast, the middle and downstream on the east will appropriately be redesigned for recreation, nature education and other service functions. Trade-offs in the practical redesign with the EVE and in situ condition and will be presented in a later section.

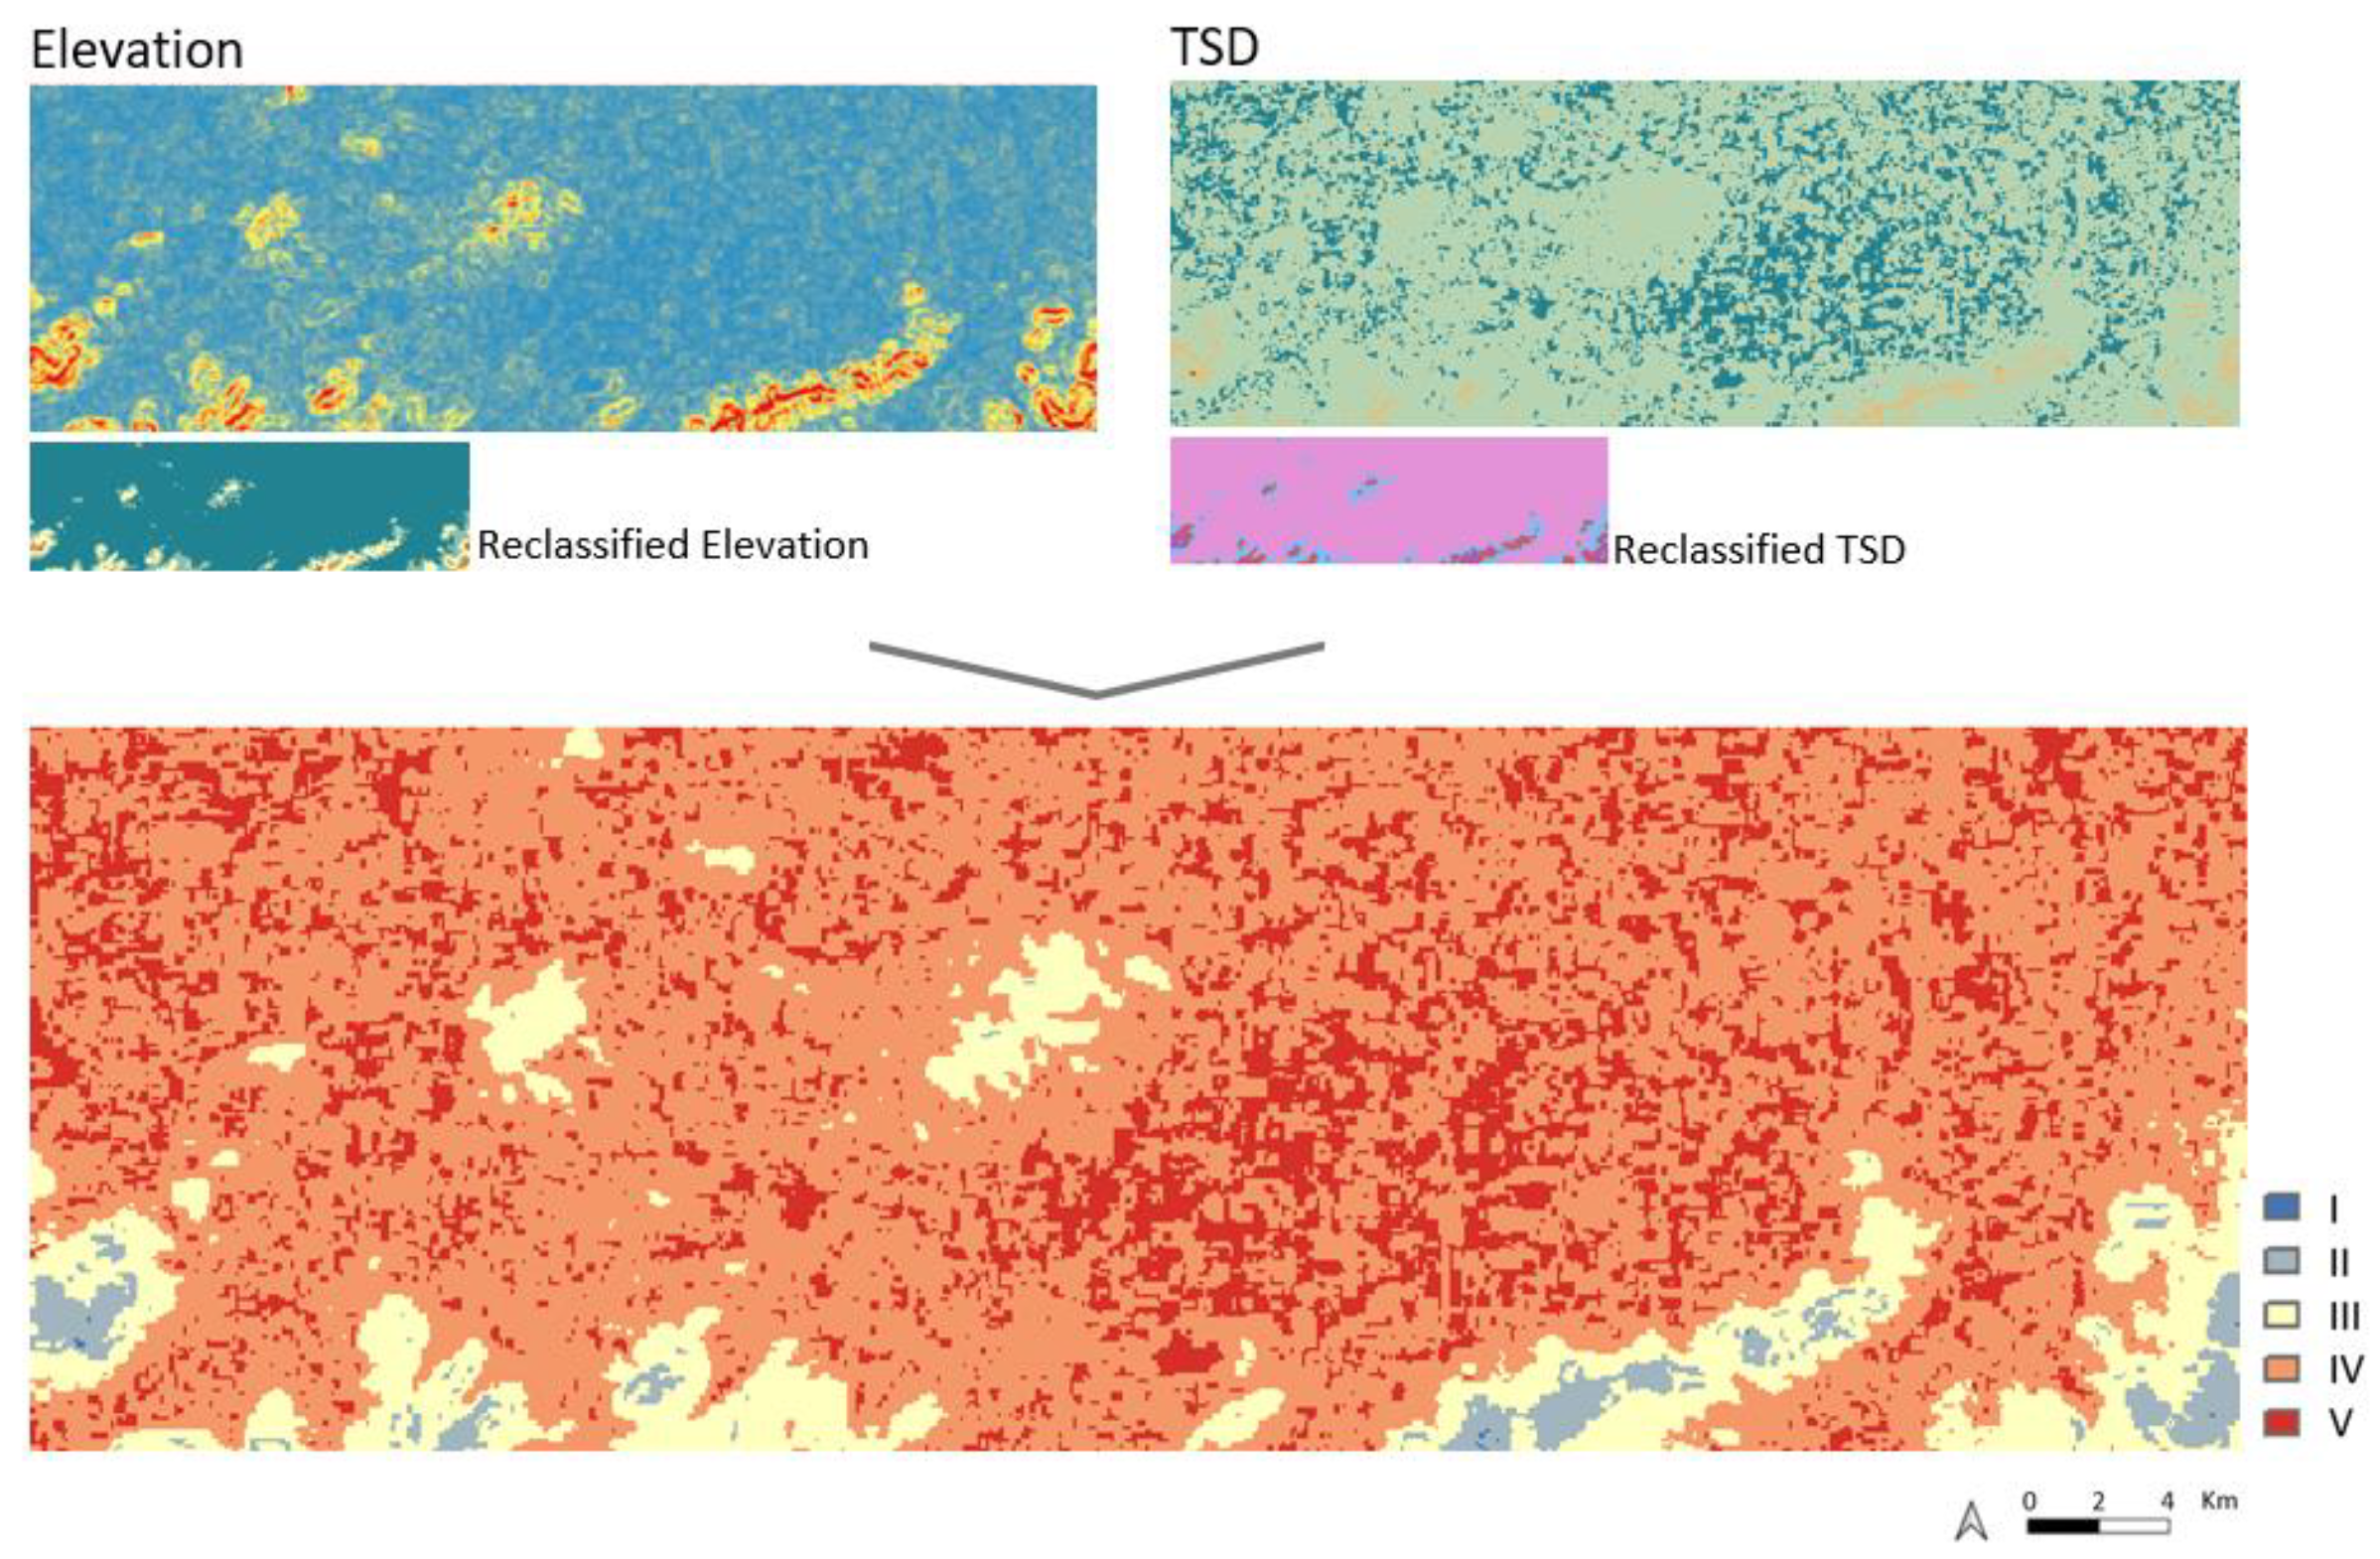
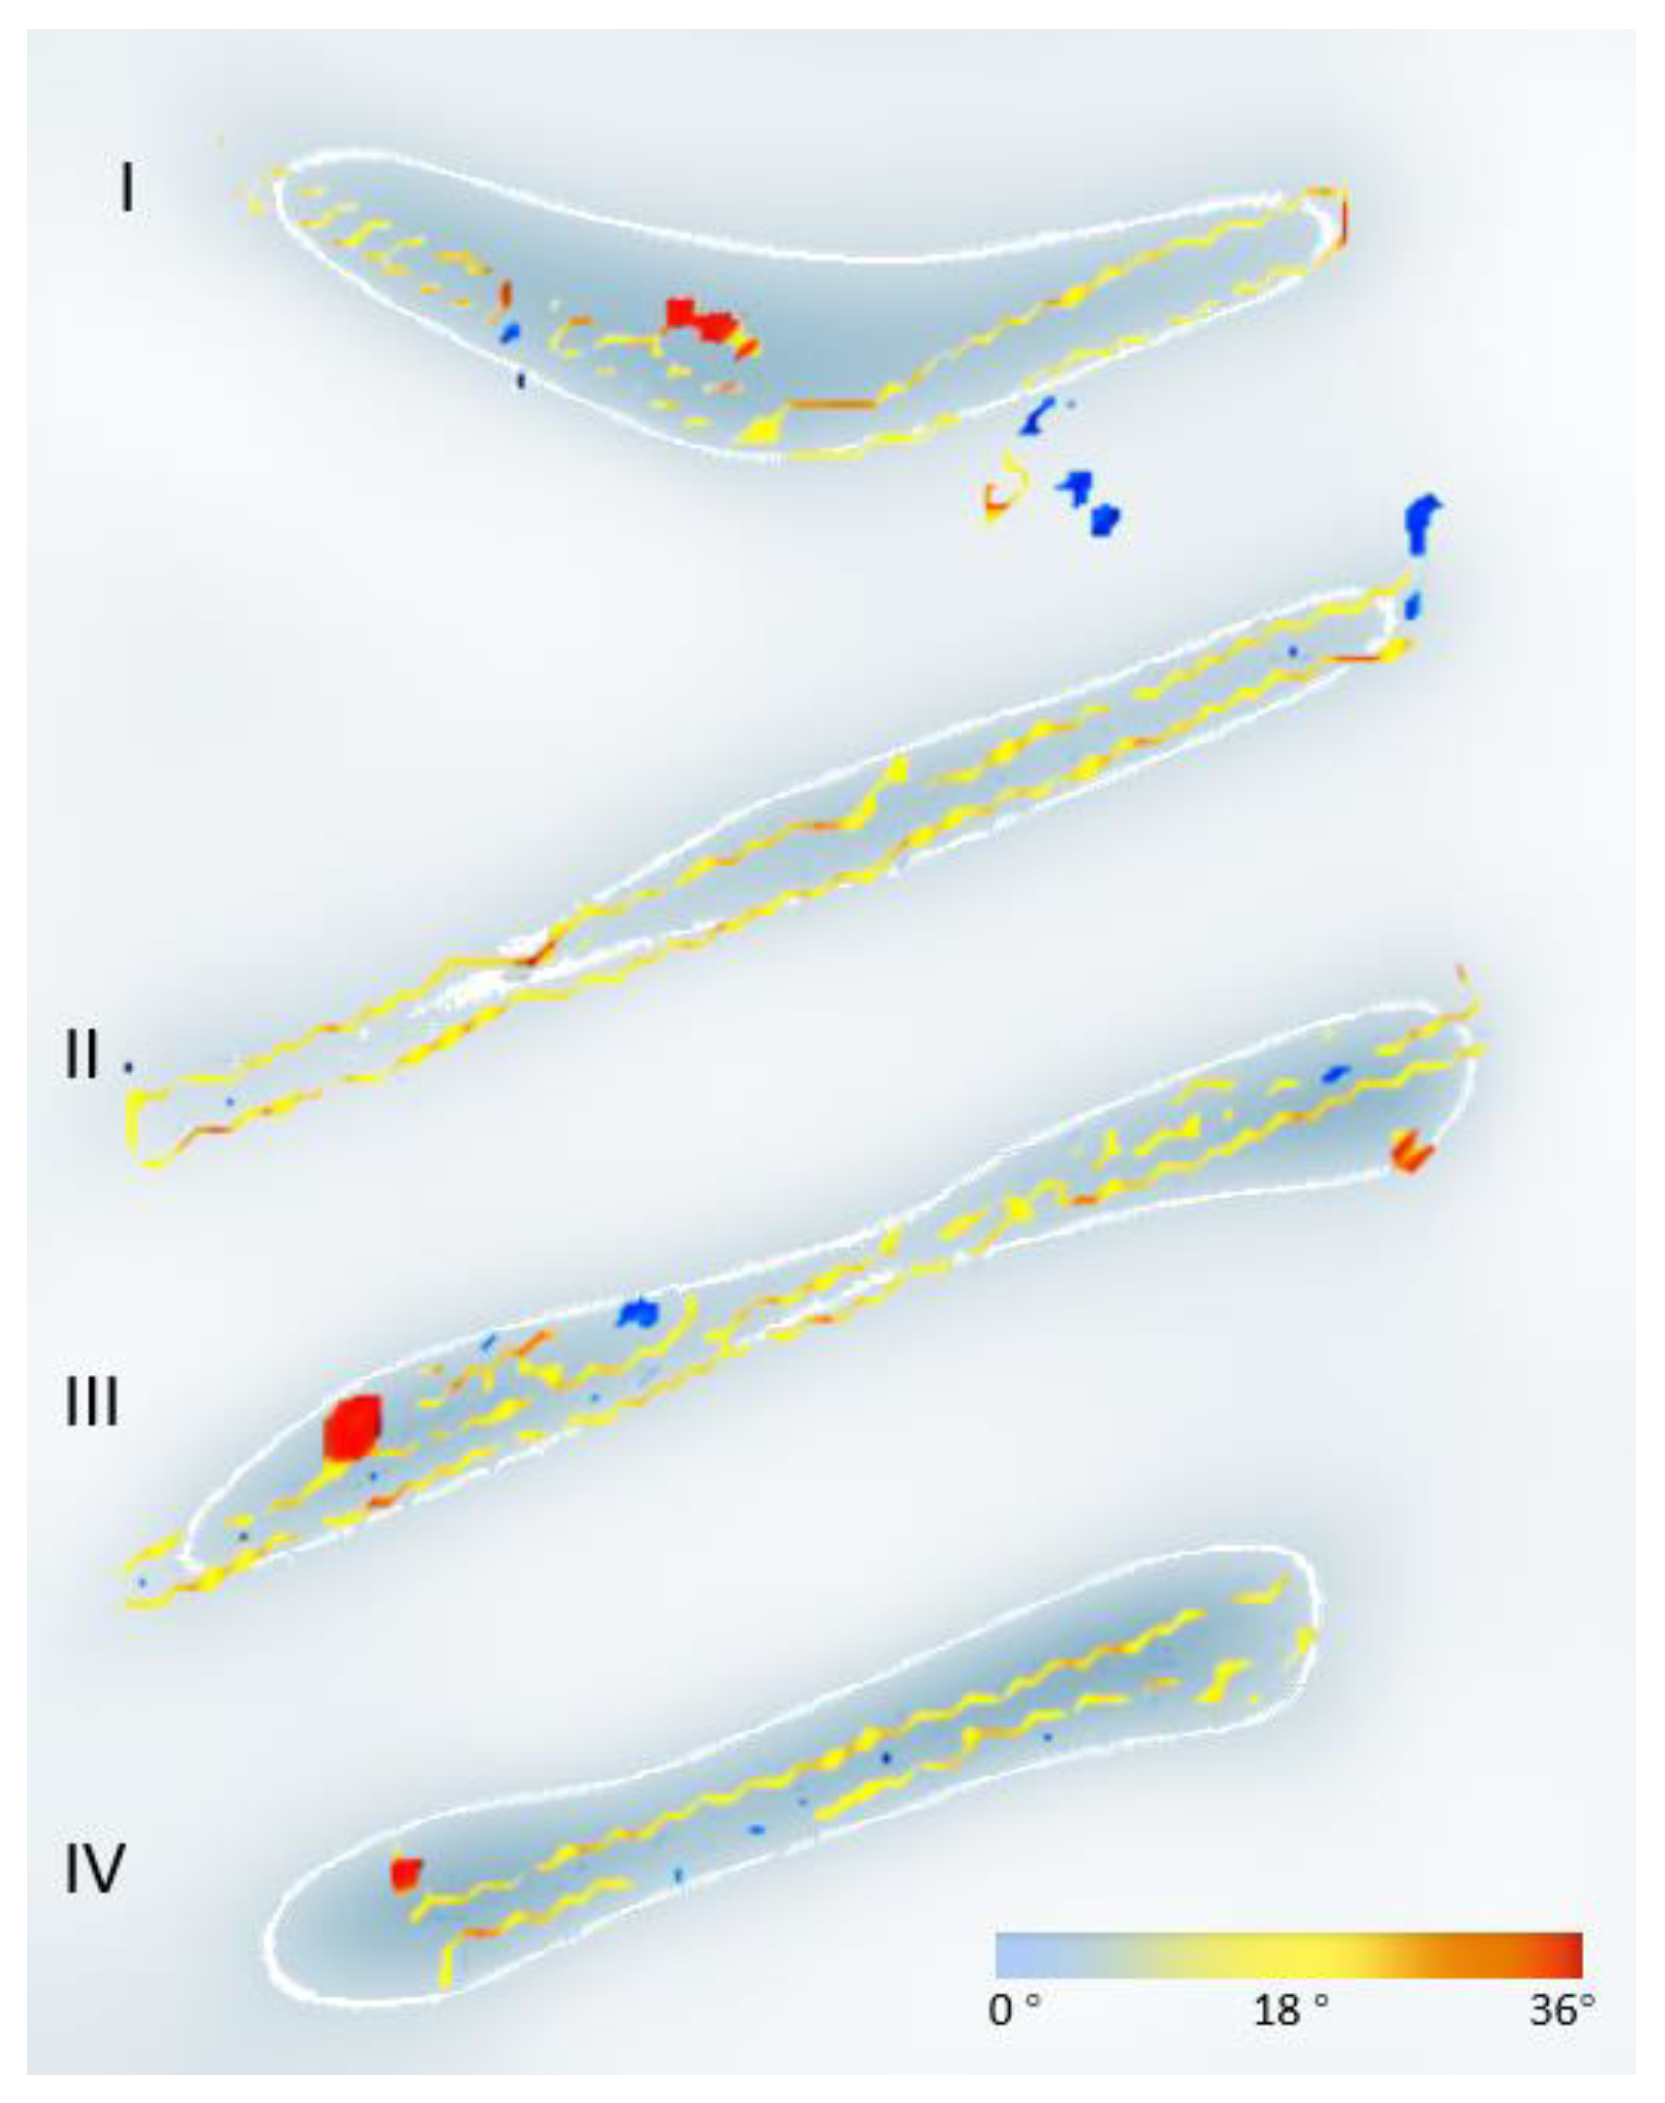
3.3. Analysis of Hydrological-Related Factors

Due to the relatively high precipitation in the study area, with a mean annual rainfall of 2077 mm during 2012–2021, according to the Meteorological Bureau of Hangzhou, the perennial problems of poor drainage in some reaches were severe; at the same time, conditions in hydrology and solar radiation surrounding the river should be further assessed. With the DEM data of the filled topology, the river wetland’s hydrological and insolation-related individual factors were analysed. The following GIS tools and techniques were utilised:
  • “Fill” tool to remove minor imperfections that existed in topological data;
  • “Flow direction” tool with D8 method to create flow directions from each cell to its steepest downslope neighbour;
  • “Flow accumulation” tool with D8 method;
  • The output of the former steps was input into the “Flow length” tool to create distance-area diagrams of hypothetical rainfall and runoff events. In QGIS, “flow length” is defined as the upstream (or downstream) distance or weighted distance along the flow path of each cell.
As indicated in Figure 7, surface runoff on both banks of the main river is predominantly west to east, with the cumulative surface runoff path along the river channel. The direction of surface runoff (N represents North, E represents East, S represents South) in the middle reaches of the river is primarily northwest-southeast, and the runoff path is relatively concentrated. The length of surface runoff in the riparian areas on both sides of the main river varies spatially, i.e., decreasing abruptly from upstream to downstream, resulting in a more rapid peak flow in the downstream river during the peak rainfall season and a tendency for the riverbanks to be inundated.
Although some hydraulic models integrated with GIS can explicitly assess the performance of NbS or WSUD designs concerning water quantity and quality, complex datasets are acquired to operate, which are not assessable for landscape architects in this study. However, it can be observed that the geomorphic condition acts as the main factor for the flood risk of river wetlands in the study area. Thus, it is possible to primarily predict flooding risks to a certain degree with topological situations. Based on the description in the Technical Specification for Assessing the Risk Level of Flooding formulated by the Department of Natural Resources of Zhejiang Province, the topological rainstorm risk index (TRRI) of the study area (Table 4) was calculated by related GIS tools:
  • “Fill” tool;
  • “focal statistic” tool to calculate the topographic standard deviation (TSD);
  • “Reclassify by the table” tool;
  • “Raster calculator” tool.
The TRRI mapping (Figure 8) indicates that the flood risk in the study area is evident based on probability. Risk is lower in the middle reaches of the main channel, followed by the upper reaches and a higher risk in the lower reaches. Therefore, further resilient water-sensitive design measures need to be adopted in the planning and design of the river landscape to cope with rainfall inundation scenarios.

4. Design-Driven Findings

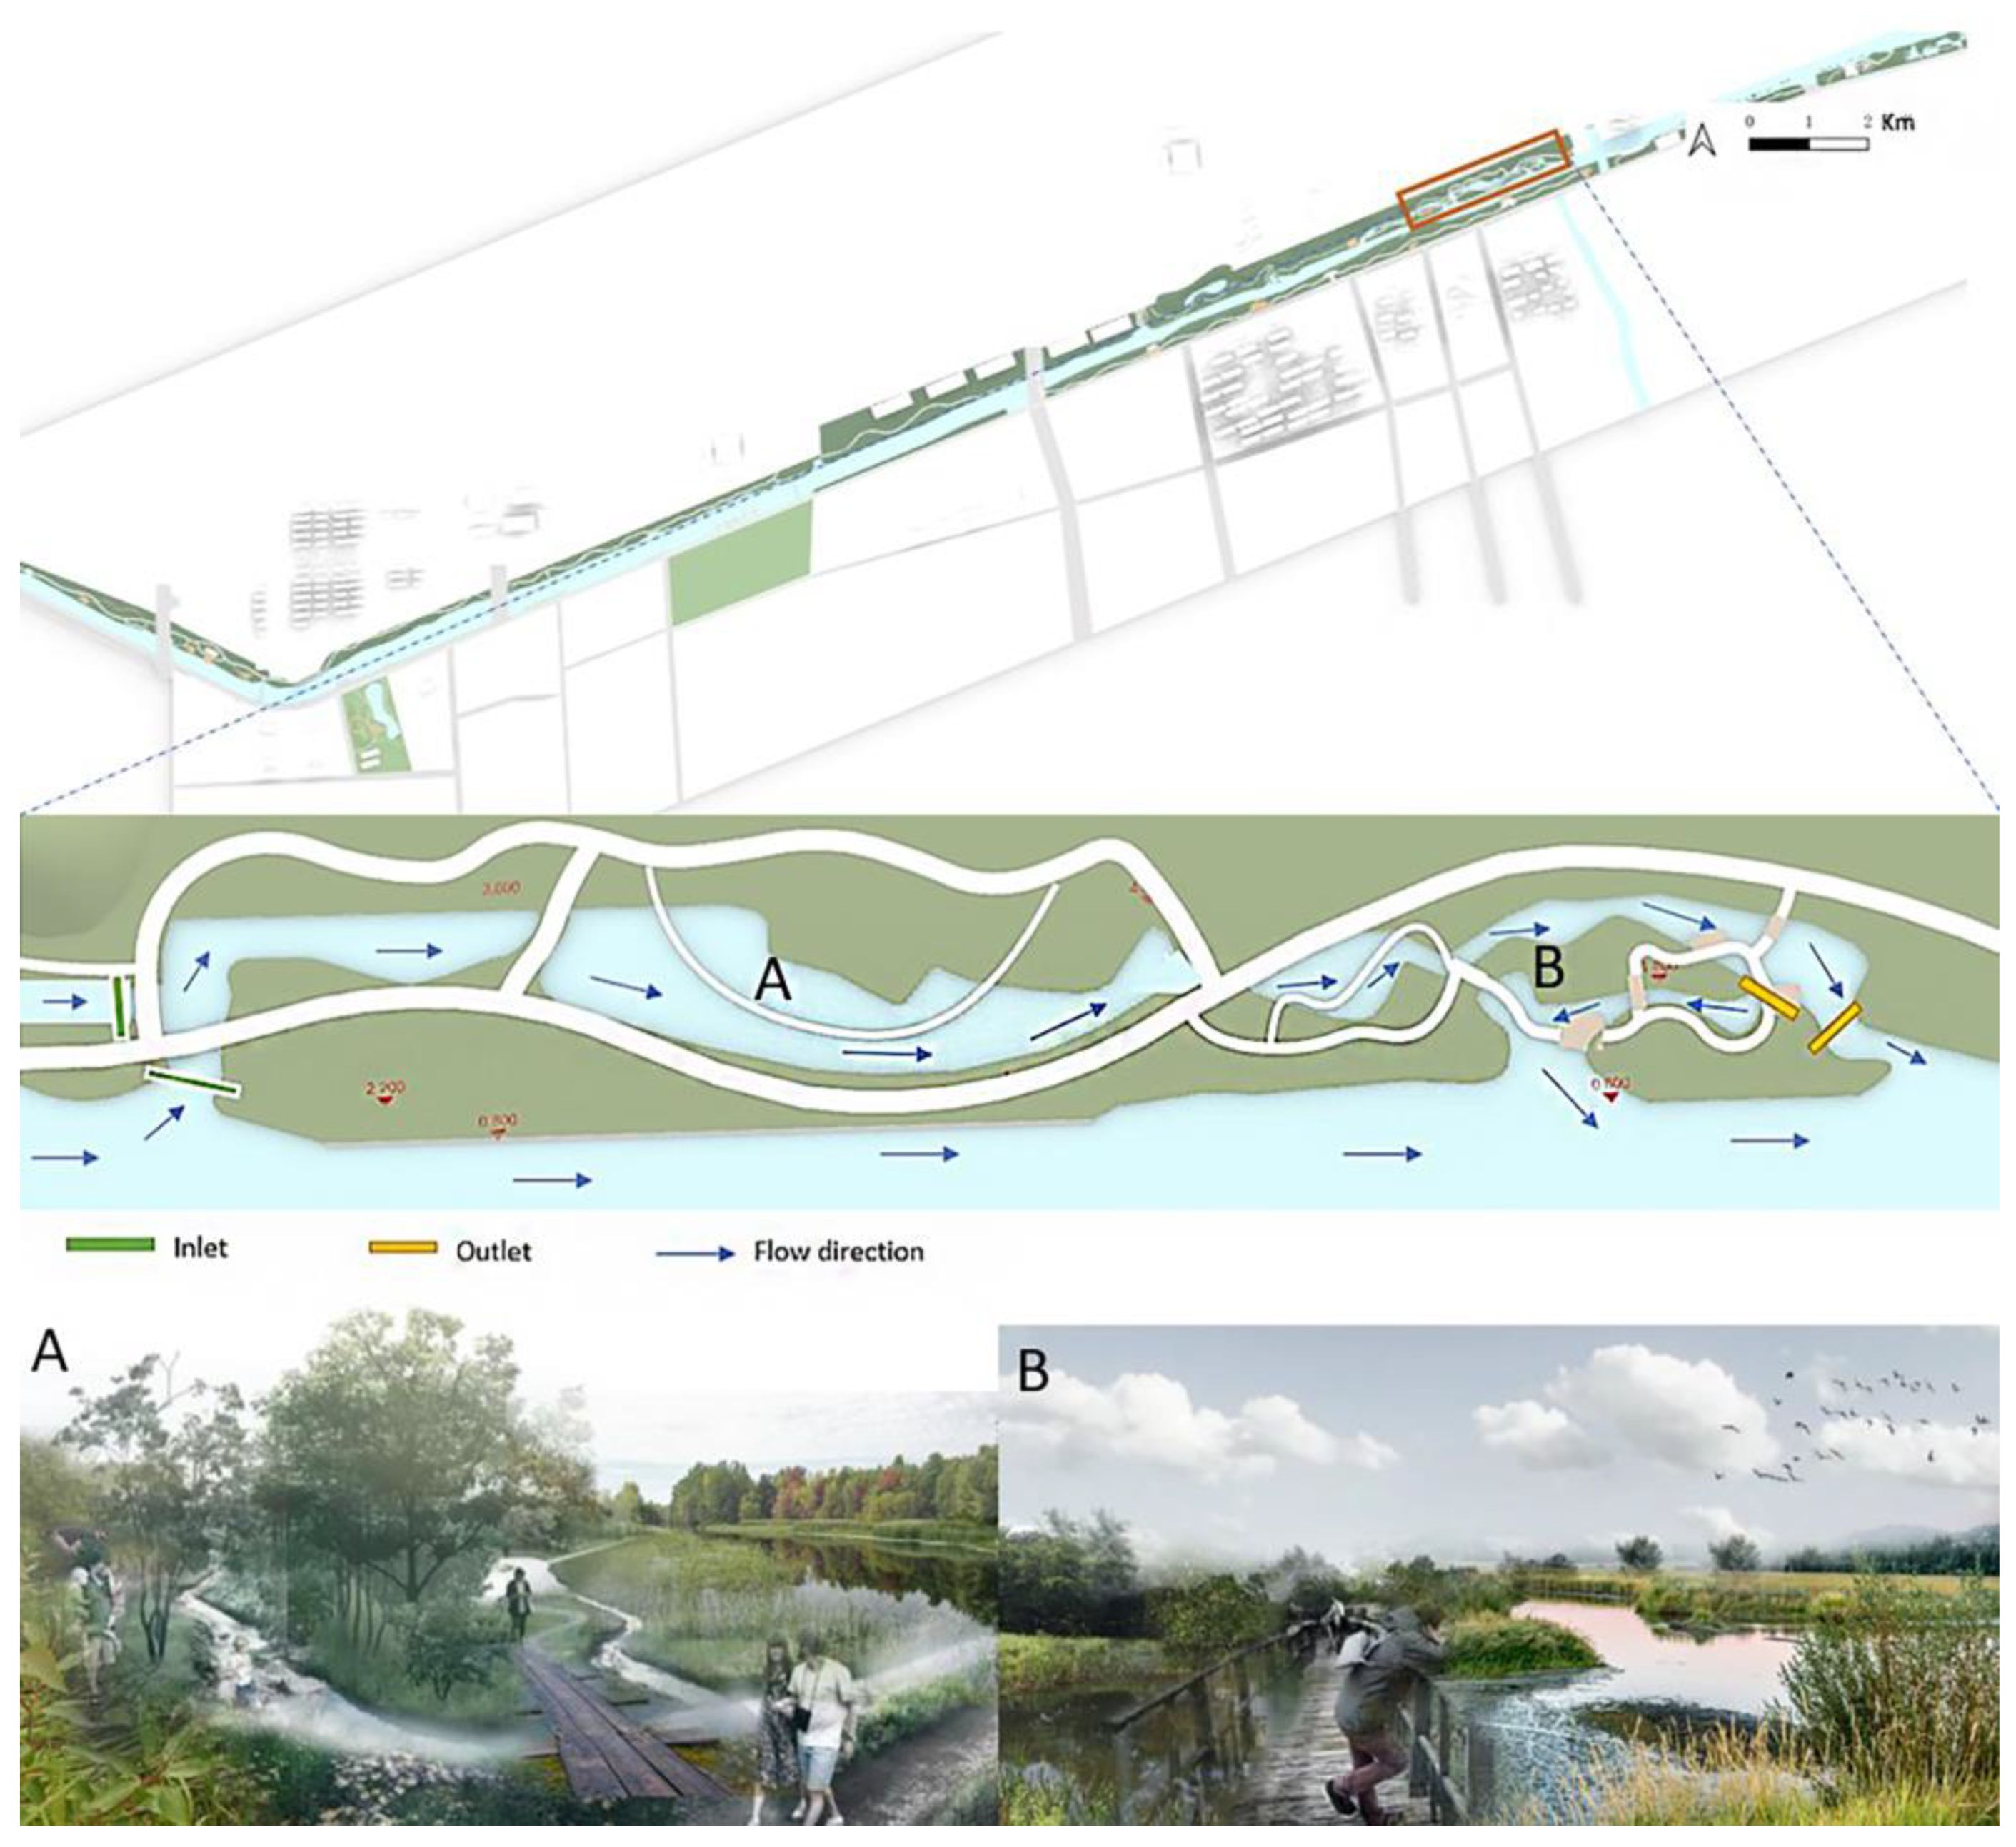
4.1. Redesign Solutions

Following the in-situ survey and geological information interpretation, the results of the geodesign analysis conducted above were presented to experts. Following the agreement at the meeting of the local government, stakeholders, and the local community, the planning area of the project was set along the river, limited within a range (with an average width of 40 m along the outer edge of the river), and the minimum total area of waterbodies was approximately 340,900 m2, while the average width of the riparian greenery belts was beyond 30 m.
At present, improper constructions of river terrace dams and the anthropogenic regulation of wastewater treatment plants’ operation have affected the hydrological characteristics of the river. The riparian zone along the river has undergone explicit changes, especially in the interface characteristics of unnatural flood patterns. Abnormal changes in water level have caused a decline in the original functions of surface runoff interception and purification, bank tabilization, and biodiversity conservation [28], which frequently affect the hydrological processes and ecosystems of river wetlands. “Semi-natural river wetland management” advocated that integrating hydroengineering project construction with ecogeographical principles can significantly help create a low-cost and low-impact semi-natural landscape [29]. Therefore, a comprehensive design is required for the specific water level changes at the river interface affected by improper hydrologic construction. Thus, the results of the geostatistical analysis were presented to experts in related fields in a face-to-face meeting to further planning strategies for the project. Four planning strategies were concluded as follows:

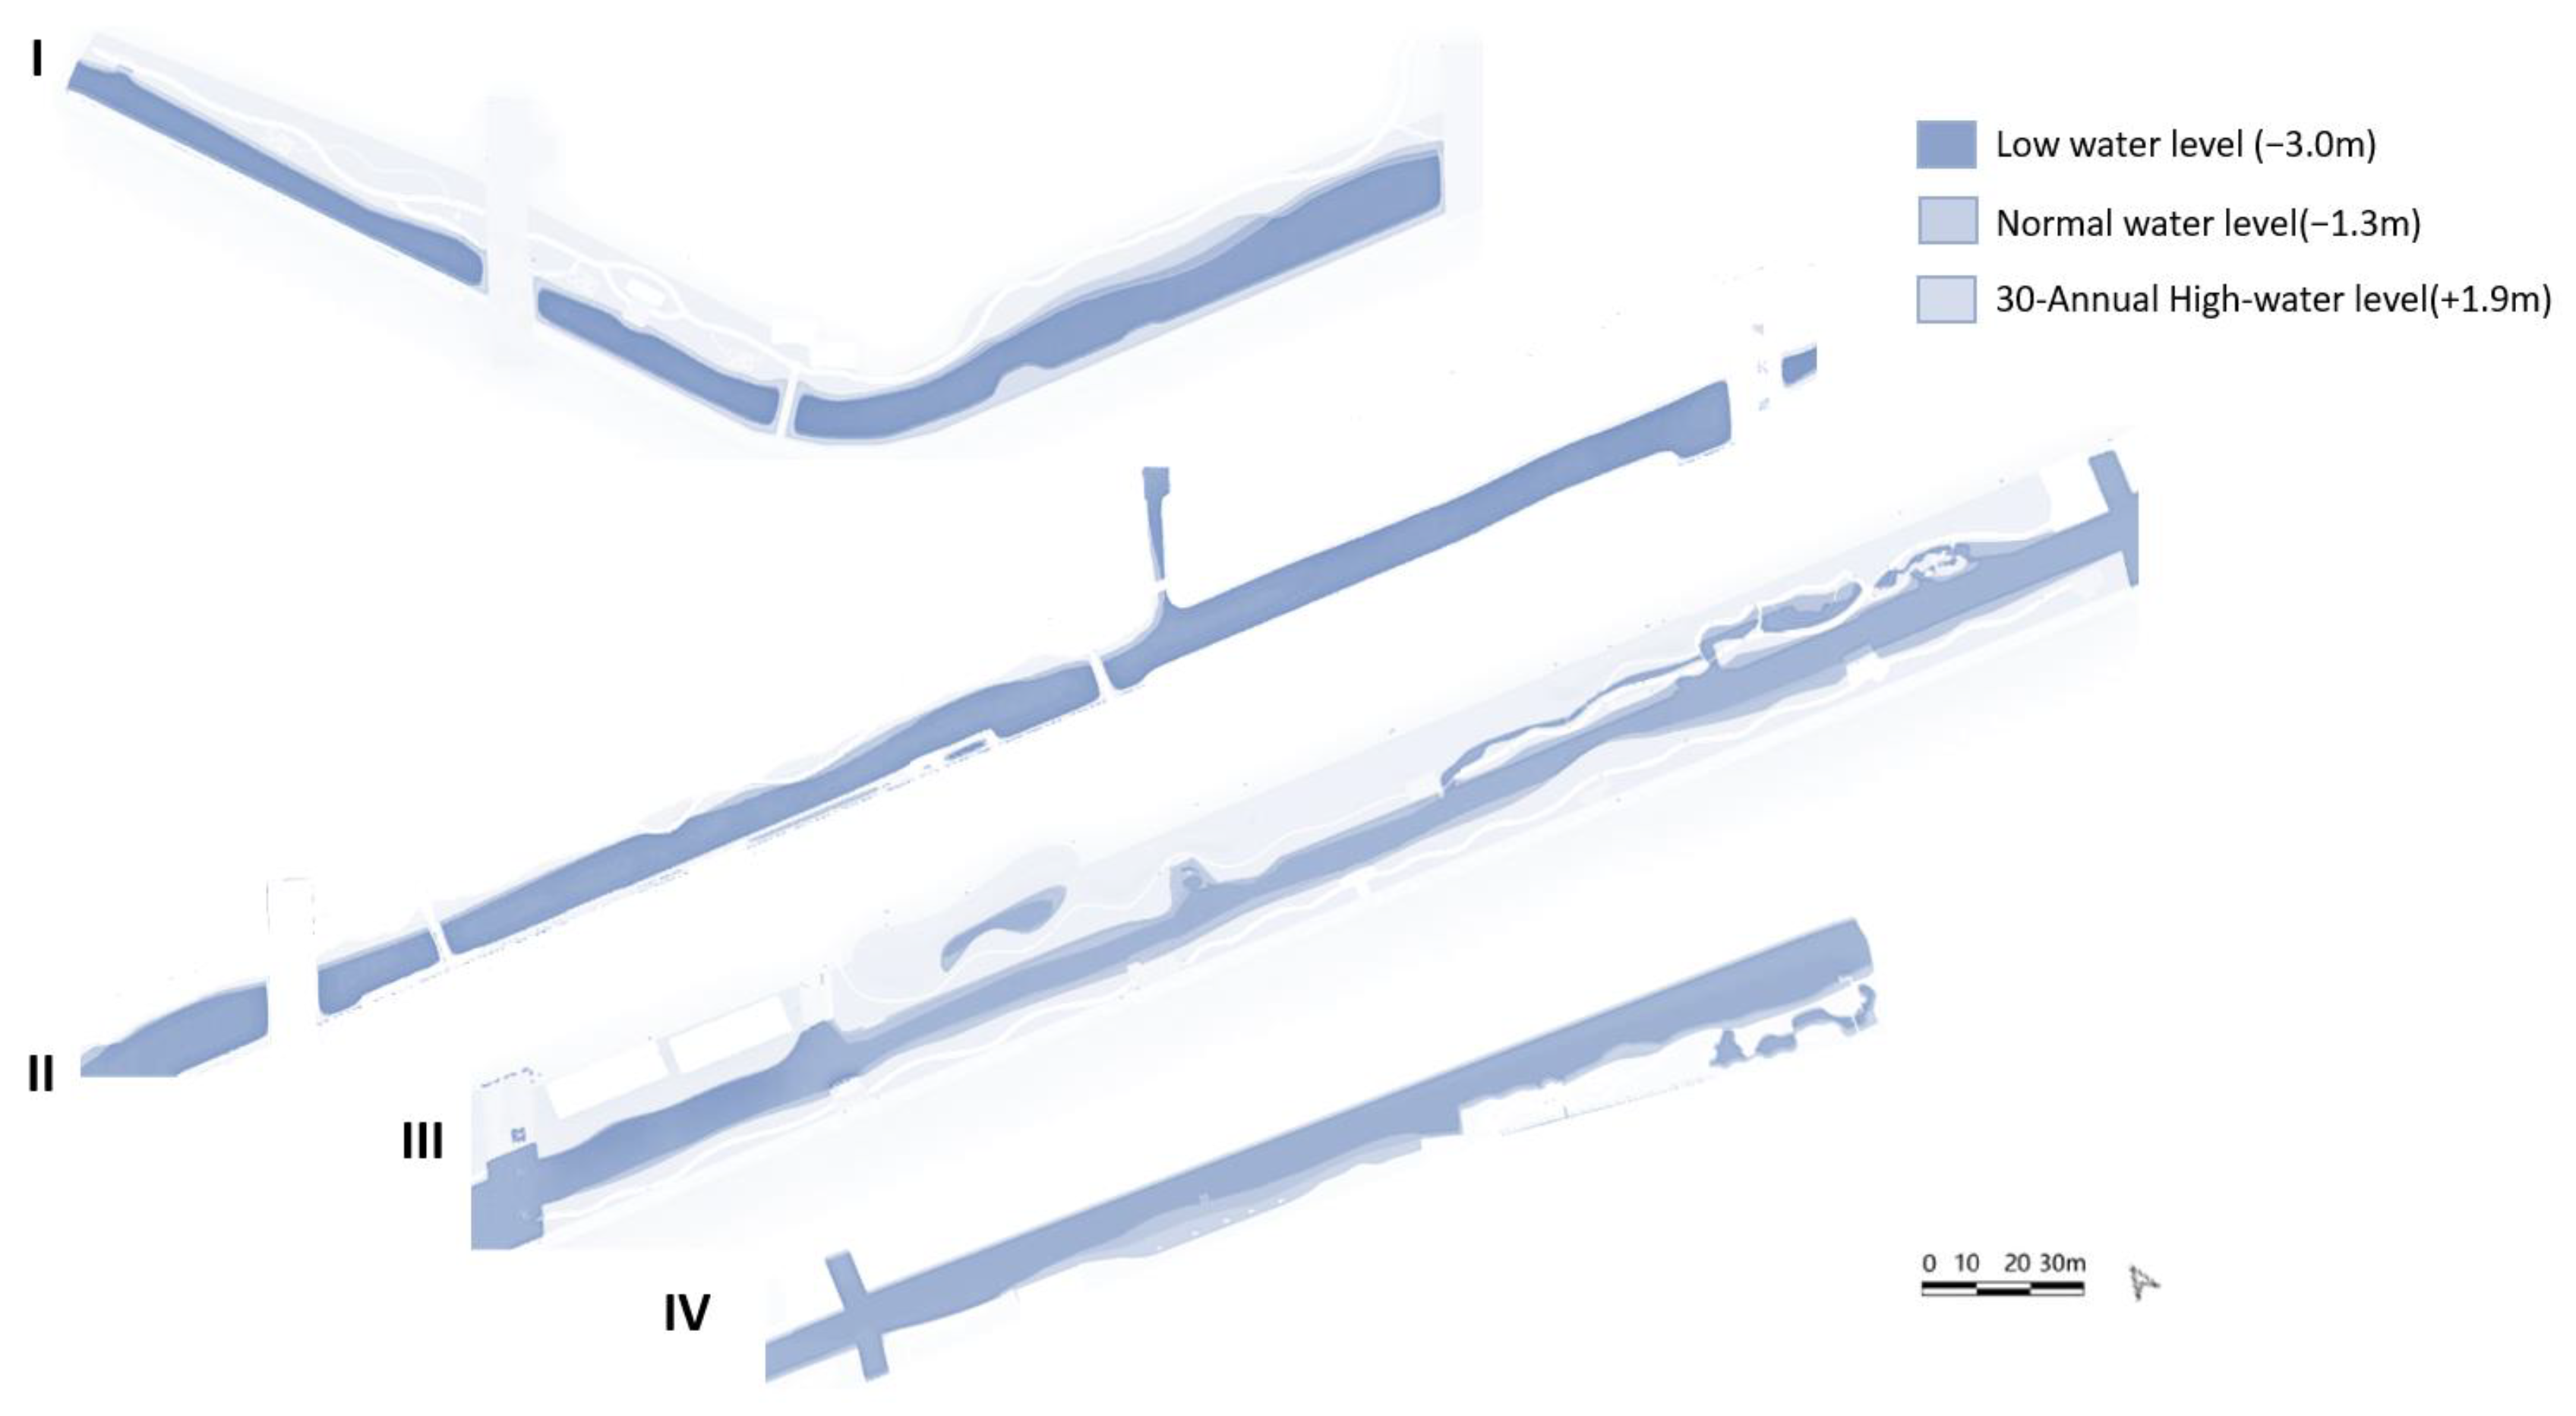
4.1.1. Restoration of Riverbeds

The original riverbed cannot create living space for benthic fauna. Remeandering measures help to form a better structure of the river wetland with the function of regulating the infiltration of the water system. A bigger and more permeable floodplain area will increase infiltration. By increasing the area of water bodies, infiltration will be regulated, and the river will help to create a rich and diverse habitat for aquatic plants and creatures. The existing river water network should be tabiliza to keep the soil and plants working sufficiently in the WQT process.

4.1.2. Spatial Restoration in the Horizontal Dimension

From upstream to downstream, the river’s runoff, depth, and width gradually increase, and the gradient of water flow gradually decreases, making it easier to carry sediments. The greater the width and width-to-depth ratio (w/d) of a riparian wetland, the lower the gradient required to take the water load. The flow is slowest near wetland beds, shallow banks, and ditches, and fastest by the centre of the water [30]. As the width or hydraulic radius of a channel increases, the slope does not have to be as great to transport the same sediment load. Thus, it is necessary to dredge the river channels to follow semi-natural forms. From the aspect of landscape architecture, it is applicable to increase the area of lower-lying areas along the river, e.g., gravel shoal, beach. As cyclical changes tabilizatio riparian zones, the suitability of habitats for different water levels should be considered. Riparian zones are relatively less ecologically sensitive and have a transitional role between rivers and lands. The width of the riparian zone should be redesigned, and a particular area should be divided for ecological restoration. Constructed free surface flow wetlands can be constructed at the riparian area in the middle part of the reach to purify input water from the main channel of the river, and the landscape should be recreated in conjunction with the topographical characteristics of the site.

4.1.3. Spatial Restoration in the Vertical Dimension

Experts believe that horizontal geomorphic structures should be restored along the centre of the river towards riparian structures. The structure of the bank slope, riverbed and microtopography should be reconstructed to adapt to the staggered and variable hydro-environment. Semi-natural river geomorphology of beaches, banks, terraces, and uplands also need to be restored [18]. For micro-geomorphic areas with differentiated hydrothermal conditions, redesign should be conducted to meet various engineering techniques, drainage conditions and vegetation conditions of each reach. Landscapes with hydrodynamic features should also be considered, i.e., preventing bank area erosion and slope collapse, forming an efficient water-nutrient cycle [31]. Specific EEL measures are concluded as follows.
Firstly, water tabilization and flow restoration measures should be taken to maintain a stable river flow. The maintenance of water in the riparian zone should be supplemented by water replenishment from the effluents of the Yuhang Sewage Plant.
Secondly, the restoration of open water bodies and the construction of riparian engineering should be conducted.
Furthermore, adapting proper vegetation restoration measures will reduce flooding to a certain extent and purify the water by removing pollutants, e.g., N, P, etc. Wetlands’ vegetation belts can also provide recreation and ecological services, especially for the hydro-fluctuation belt [32]. It is planned to increase the planting area of emergent plants by 43,000 m2 and submerged plants by 33,000 m2, while the growing duration of aquatic plants is 120 days/year, according to another similar environmental engineering project in Hangzhou.

4.1.4. Integration with the Multifunctional Design

Multifunctional landscape design refers to design that gives divergent functions to limited space, often performed as a methodology for managing space [33]. It is indicated that on-point source pollution loads can be recurrently reduced by tabiliza the hydro-ecosystem’s filtering and sewage interception functions, improving riparian landscapes [34]. Thus, landscape architects should consider integrating diverse functional layers, i.e., substrate, vegetation, waterbody, and recreational layers. Proper-designed constructed WQT wetland parks should have multiple characteristics, i.e., environmental, sociocultural, and economic benefits. To enhance the visual qualities of the wetland landscape, native species should be adapted in waterfront planting design, spaces for social interaction should be designed along the riverbank, and visibility from facility spots [35] should be redesigned and checked for their feasibilities.

4.1.5. Topological Redesign Practices

With the redesign solutions concluded above, landscape architects made some adaptations to mid-and-small-scale landscape design. Practices for spatial restoration in both horizontal and vertical dimensions are closely connected with topological redesign. Therefore, landscape architects need to check the feasibility of the design by accurate 3-D modelling and parametric programs.
Semi-natural river wetlands can be self-sustaining within a specific limit. At the same time, matters and energies between upstream and downstream ecosystems are usually transported through flows and sediments, which enrich the ecological spaces of river wetlands [36]. Hence, to improve the riparian zone and riverbanks, the concrete embankment was partially removed, a gravel filter layer was added, and floating wetland islands (FWIs) were set, which can improve the water treatment effectiveness by the interface. It is indicated from in situ experiments in Hangzhou that FWIs vegetated with Iris tectorum, Nymphaea tetragona, Lythrumsalicaria, Cynanchumriparium, Scirpusvalidus, etc. can significantly reduce TP, NH3-N, and organic matters [37]. The topsoil of the low-lying areas was partially excavated to enhance the aeration. The soil was backfilled to the flat terrain and shaped into a semi-natural concave and convex terrain, effectively combining topographic redesign with landscape ecology principles.
The theory of restoration ecology suggests that the ‘restoration’ of ecological functions is not an attempt to return to the original state but rather an emphasis on integrating ecological processes with the surrounding environment. In practical redesign and engineering, only the range within 40 m on average along the outer border of the river was permitted to be conducted. Concerning the in situ environment of each reach along the river wetland, various types of waterfront micro-topology, i.e., gravel shoal, gabion, slope with grass, viewing platform, micro-terrace, and stone steps, were required in the redesign process. Shallow water areas at 0–0.6 m were planted with various aquaponic plants to attract wading birds. Sites with a depth of 0–0.2 m are planned to be vegetated with different floating and submerged plants to purify the water; areas with a depth of 2–3 m were preserved as amphibian habitats; areas with a depth of >3 m were planted with submerged plants and provided with fish microhabitats.
Landscape architects can adapt GIS and 3-D modelling tools to assess the vulnerability of physical geographic elements, the suitability of planning options, and view attractiveness. A detailed EEL design model was developed within Rhinoceros 7 by landscape architects. Geographic information was exported from QGIS into Rhinoceros. By the hydrological characteristics of each reach, artificial vertical barges and hard barges were partially retained in the reaches where flooding is more severe. Concrete embankments, low-interference barges, semi-natural graded slope barges, semi-natural shallow barges, and barges with pickets were modified in another reach. Following the EVE and redesign solutions, the area was divided into a linear pattern from upstream to downstream, consisting of four reaches, i.e., Reach I for flood protection, Reach II for aeration, Reach III for free surface flow wetlands (FSFs), and Reach IV for rainstorm wetlands and ecotourism (Figure 9). Various forms of banks, e.g., plant tabilization, timber pile bank tabilization, plant-stone bank tabilization, and gabion grid bank tabilization, were adopted. Microtopographic variations between the two banks of the river wetland were appropriately balanced to make the slope gentler.
Geodesign techniques for landscape are defined as those tools for dynamic modelling and simulation and are informed by systems thinking. Visualised parametric programs within Grasshopper have been indicated to be effective in evaluating the performance of landscape design in geodesign workflow [38]. Programs for terrain analysis were developed in Grasshopper 1.0 (developed by Robert McNeel & Associates, Seattle, WA, USA). The 3-D model of modified terrain was tested by the program, updating the model simultaneously. It was indicated that the slope of more than 94% of the total area is in the range of 0–25° (Figure 10).
River wetlands in the study area are ones with seasonal characteristics. By integrating river wetlands and low-lying areas in urban spaces, river wetland landscapes can be developed in synergy with the urban drainage network, which is conducive to relieving the pressure of flooding during the rainy season, helping to keep the water level stable and getting rid of damages caused by flooding simultaneously [39]. Thus, resilient flood management measures must be set up by in situ inundation conditions. Another program developed within Grasshopper 1.0 was used to simulate the inundation of the planning area according to data on elevation and flow (Figure 11), indicating that the topological redesign practices allow the river wetlands to be capable of rainstorm storage. More accessible spaces will be available above water level during winter, leaving temporary recreational spaces accessible for visitors. During floods that occur annually in summer, the flexible sites are submerged by water. Visitors can only conduct activities at limited higher levels, ensuring that the river can adequately perform its flood discharge and drainage.
3-D visualisation of the EEL design model proceeded in Rhinoceros 7 for intuitional presentations, which offered direct and comprehensive views of varied water levels (Figure 12). Semi-natural wetlands can present wilderness for tourists to get close to nature. Some details of the redesign were developed by landscape architects, according to the redesign solutions. By improving the vertical structure of the riparian zone, the diversity of water morphology and forms was restored. In the space with low use intensity at the northern bank of the eastern part in Reach III, FSF wetlands (Site A) and some eco-islands with FWIs (Site B) were set. Sluice gates were set up at the inlet and outlet to control the water level, and the water in the main channel flowed into the riparian wetland from west to east and was purified by FFS and FWI. Semi-natural vegetation communities were recommended to be vegetated, which could self-sustain and develop under appropriate artificial control (Figure 13).

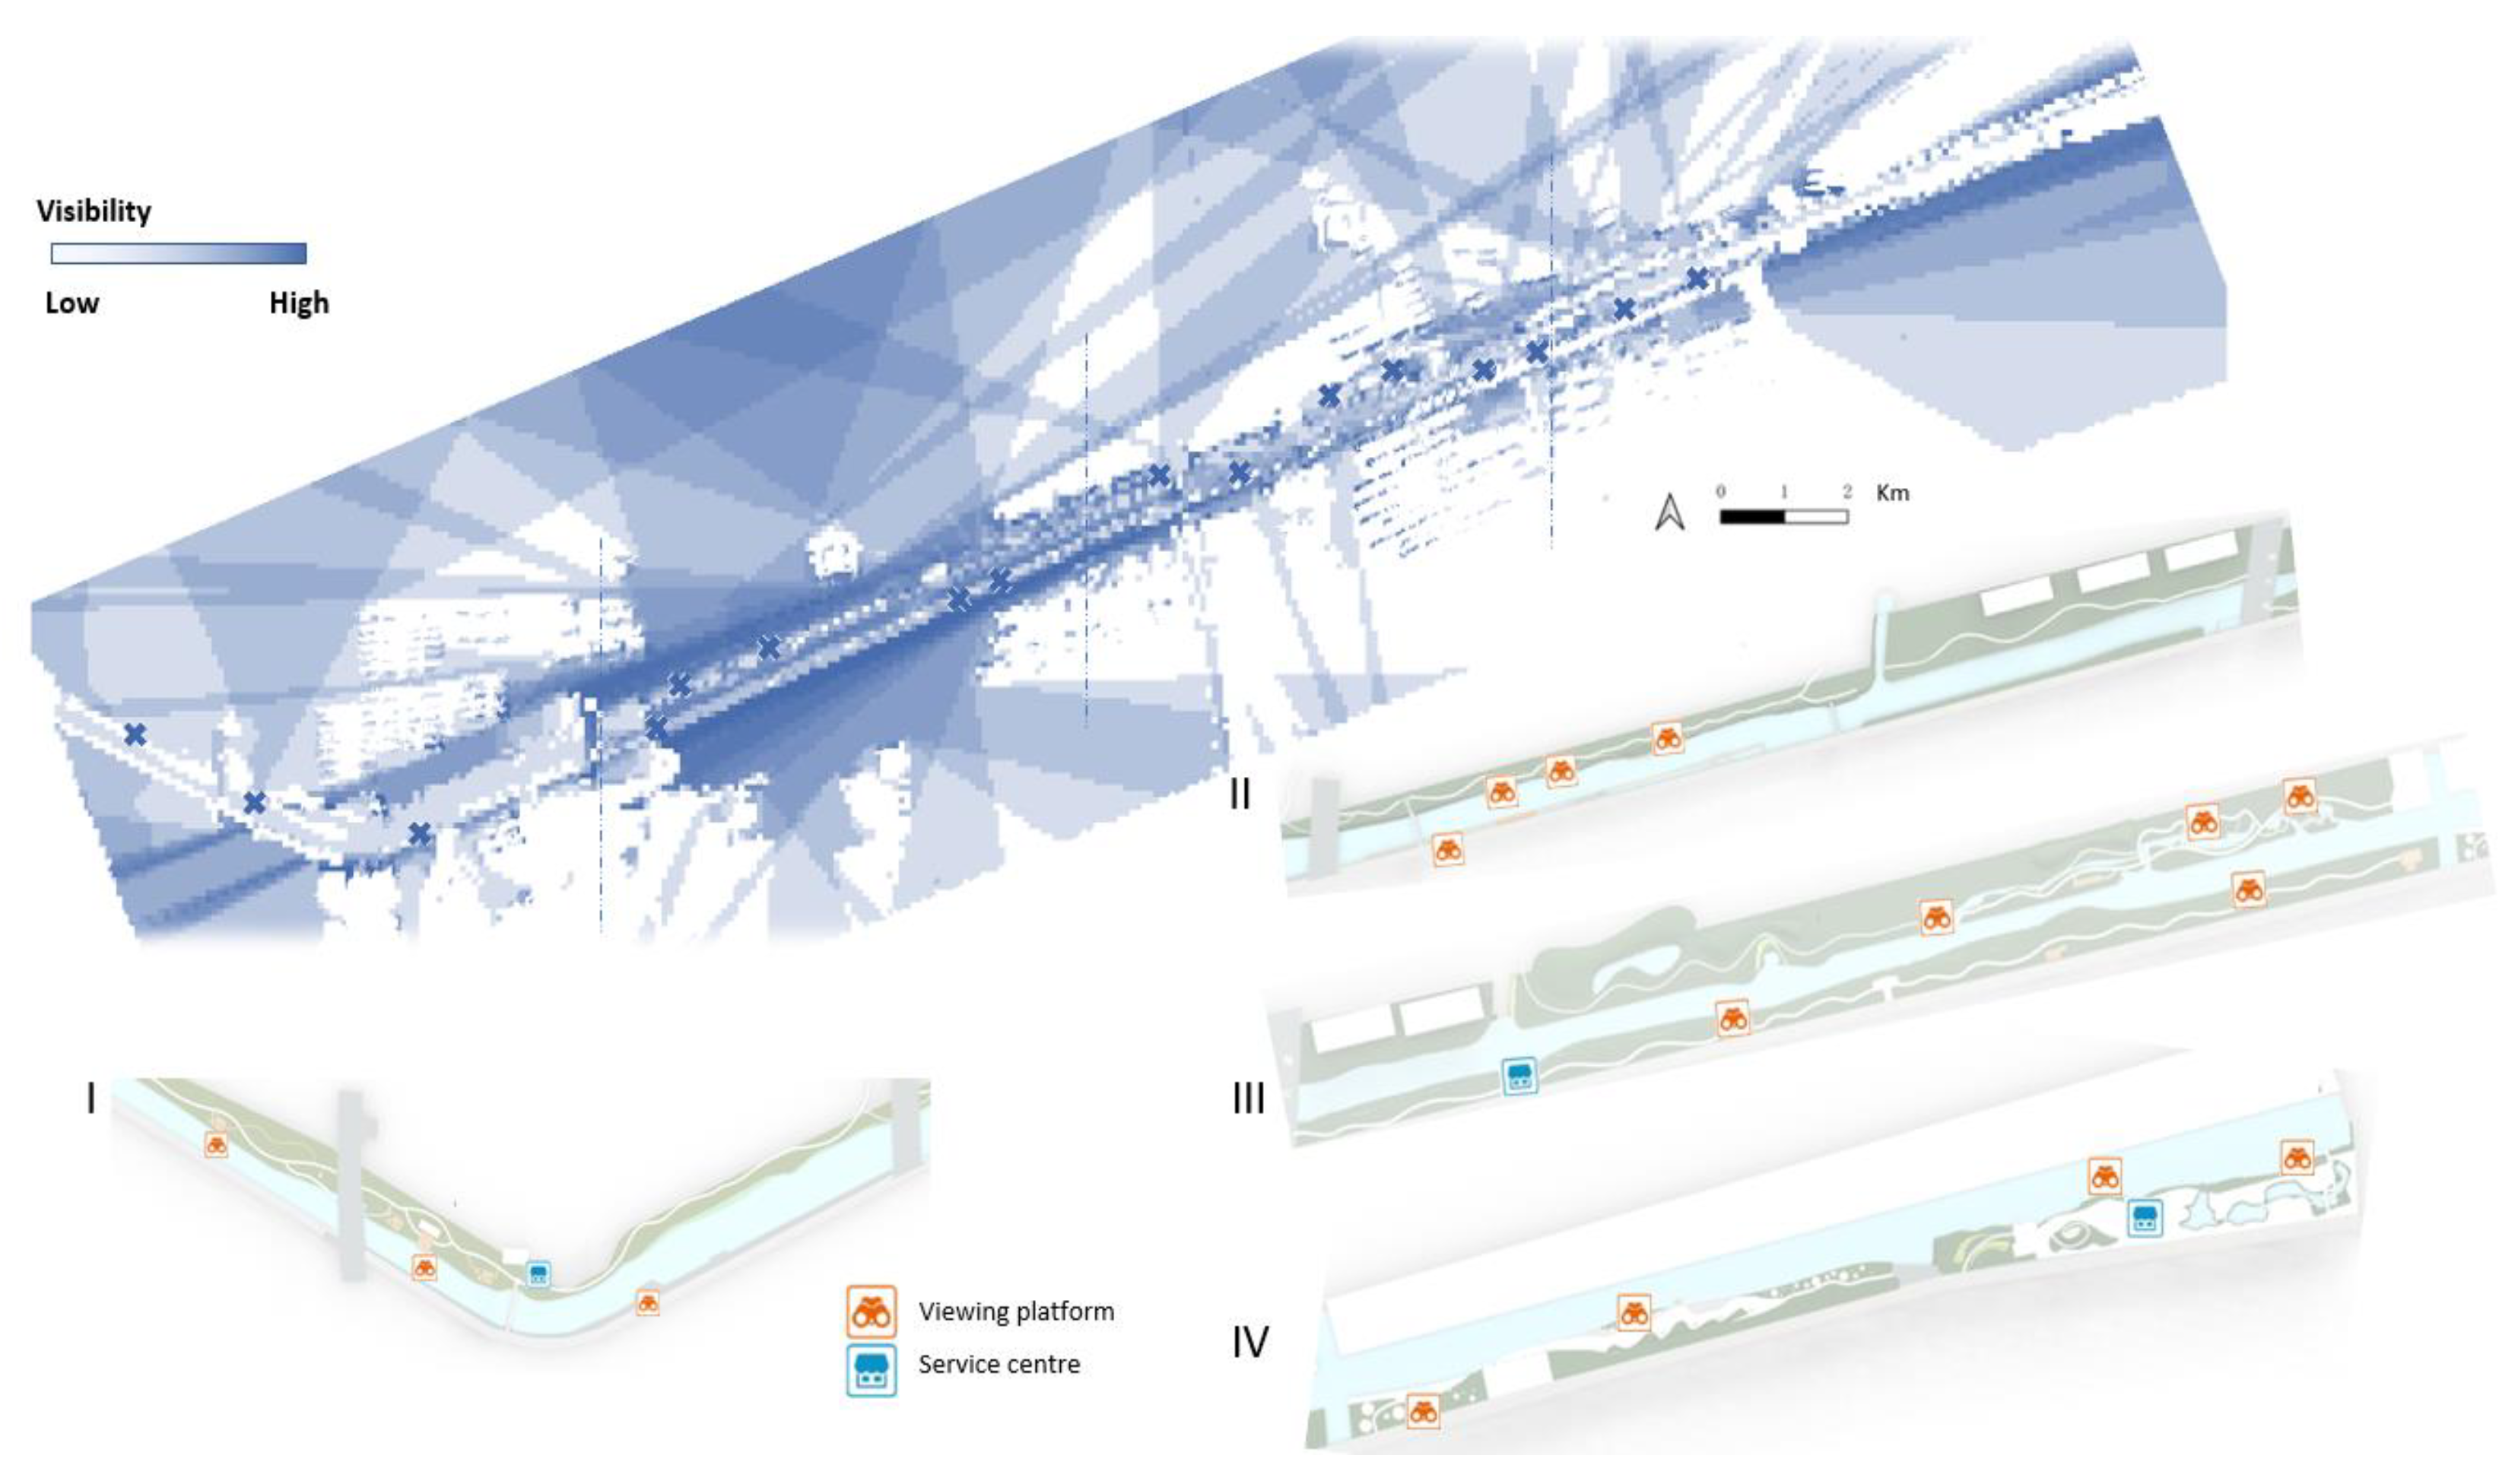
4.2. Facility Redesign Practices

The study area has been abandoned for many years. Former sites of factories and docks have occupied some sections of the river, while there is a lack of public amenities. There are also several service spots along the river wetlands, while no landscape facility spots existed before. Thus, places for resting or viewing have been selected by landscape architects. Most of these facilities are located in spots with open views. To test the feasibility, visibility analysis was conducted from the service stations and resting places at a constant height of 1.6 m (Figure 14) by a program within Grasshopper 1.0. Views from these spots are coherently contributed, and the viewshed to the river is relatively open. Views from surroundings along the river wetland are also heterogenous at various viewpoints, while a view corridor is formed along the riparian zones. It is demonstrated that visitors will get gorgeous view in places surrounds viewing platforms and semi-natural paths.

5. Further Discussion

Urban river wetland EEL projects are complex tasks integrated with hydroengineering and landscaping. The sustainability of river wetlands is based on the succession of dissipating external disturbance factors; hence, EEL-oriented river wetlands should mimic the effectiveness of semi-natural wetlands [40]. Although organisations worldwide have worked on river wetland restoration projects since the 1990s, only a few studies have provided practical geodesign workflows for wetland EEL [41]. Most existing research applies systems thinking, provides multi-scale impact assessments and facilitates collaborative design processes, which allow designers to recognise challenges and opportunities in environmental sustainability [42]. Otherwise, 3-D modelling tools have seldom been used. It is indicated that geodata and geodesign tools are found efficient and convenient to be integrated into dynamically comprehensive redesign workflows in order to deal with complex relationships. Accordingly, several comparisons between other geodesign-based EEL projects and this study are presented as follows.
Firstly, most existing research asserts the belief that it is vital for processing geographic data to reveal ecogeographic qualities by utilising quantitative tools, e.g., RS interpreting, AHP-based weighting, hydrological analysis, inundation simulation, etc., to enhance the quality of planning solutions [43]. AHP criteria should be arranged, which enlightens the understanding of ecogeographic features. Expert interviews are significant in determining weights by the AHP method. For limited available geodata, some landscape-related criteria, e.g., viewshed, scenic beauty, vegetation, etc. have not been taken into AHP criteria. AHP voting with proper types of landscape-related criteria will be of great help to improving the knowledge and exploration of ecological spatial features based on quantitative geostatistical results.
Secondly, as for the geodesign process, process-driven geological information tools can offer efforts in workflows with complex decisions during the planning and redesign process, i.e., representation, process, evaluation, change, impact, decision [44]. As for co-design, geodesign is indicated to have potential in facilitating NBS co-design, by analysing the impacts of priority areas and land uses on ecosystem services in the existing research [45]. However, a similar co-design workflow should be developed during larger collaborative processes, which is still lacking in this study. Limited to the composition of the team, only five experts participated in the AHP voting. For more convincing results, more experts should be invited to the voting if possible.
Thirdly, the river wetland in this study was planned and designed as ecological media linked to the surrounding matrix to deal with energy flow and pollutants, while eco-geographic principles were considered in redesign strategies. In existing research, the utility of integrating data-driven modelling and simulation in collaborative processes has been primarily developed [2]. The author supposes that more landscape and EEL-related factors should be integrated into AHP-based EVE mapping to improve the usability of EEL methodology within the geodesign framework, and the value of performance evaluation during decision-making.
Last but not least, for geodesign practices related to nature-based solutions (NBS), 3-D-based geodesign technologies should be taken into consideration, i.e., characteristics of problems, integrated workflows, and geo-information tools [46]. During this stage of detailed redesign, the use of 3-D modelling tools and the use of quantitative mapping programs within the parametric tools can be developed to test the rationality of schemes and conduct visualised presentations by certain type of BIM platforms (e.g., Revit, Civil 3D, etc.), which can enhance the rationality in the design practice of river wetland restoration [47]. Besides, limited to toolkits, 3-D modelling tools are relatively widely used by urban designers and landscape architects but are not prevalent among hydrologic engineers. The study aims at redesign problems of river wetland EEL, with integrated workflows of macro- and micro-scales. Thus, landscape architects need to better integrate dynamic, process-oriented, and conceptual mathematical modelling into the assessment of design performance. Opportunities for cross-discipline collaborative workflows should be developed in future.

6. Conclusions

In the case study, a geodesign-based approach in the methodological foundation for EEL practices of river wetlands is put forward. Geospatial methods were applied to the analysis of the in situ situation of urban river wetlands. 3-D modelling was used for spatial redesign, while parametric programs were used to assess the feasibility of the design.
It indicates that geodesign techniques can facilitate the intensive use of geographic information, especially in the planning and redesign process in river wetlands EEL. Integrally, a preliminary geodesign-based workflow for river wetlands planning has been constructed to promote the sustainability of water environments. The geodesign workflow, which combines AHP-based GIS, 3-D modelling, and parametric simulation techniques, applies to the site analysis and feasibility assessment of redesign solutions for river wetlands. The workflow can also be adopted into homogenous types of urban wetlands by appropriately adjusting specific factors and/or indexes.

Author Contributions

Conceptualisation, Y.H. and T.L.; methodology, T.L. and C.G.; software, T.L.; resources, F.Q.; writing—original draft preparation, T.L.; writing—review and editing, Y.H.; visualisation, T.L. All authors have read and agreed to the published version of the manuscript.

Funding

This research was supported by the Scientific Research Foundation for the High-level Talent Introduction, Zhejiang University of Technology (Project #118001929).

Institutional Review Board Statement

Not applicable.

Informed Consent Statement

Not applicable.

Data Availability Statement

All relevant data are included in the paper.

Conflicts of Interest

The authors declare no conflict of interest (including appropriate disclosures).

References

  1. Li, W.M.; Milburn, L.A. The evolution of geodesign as a design and planning tool. Landsc. Urban Plan. 2016, 156, 5–8. [Google Scholar] [CrossRef]
  2. Debnath, R.; Pettit, C.; Leao, S.Z. Geodesign Approaches to City Resilience Planning: A Systematic Review. Sustainability 2022, 14, 938. [Google Scholar] [CrossRef]
  3. Campagna, M. Geodesign in the Planning Practice: Lessons Learnt from Experience in Italy. PAS Memo 2022, 7, 496–503. [Google Scholar]
  4. Nijhuis, S.; Van Der Hoeven, F. Exploring the Skyline of Rotterdam and The Hague. Visibility Analysis and its Implications for Tall Building Policy. Built Environ. 2018, 43, 571–588. [Google Scholar] [CrossRef]
  5. Steinitz, C. Landscape architecture into the 21st Century methods for digital techniques. In Digital Landscape Architecture; Buhmann, Pietsch, Kretzler, Eds.; Wichmann Verlag, VDE Verlag GmbH: Berlin, Germany, 2010; pp. 2–26. [Google Scholar]
  6. Cocco, C.; Rezende Freitas, C.; Mourão Moura, A.C.; Campagna, M. Geodesign Process Analytics: Focus on Design as a Process and Its Outcomes. Sustainability 2020, 12, 119. [Google Scholar] [CrossRef] [Green Version]
  7. Nguyen, C.; Daly, E.; Pauwels, V.R. A dynamic connectivity metric for complex river wetlands. J. Hydrol. 2021, 603, 127163. [Google Scholar] [CrossRef]
  8. Steinitz, C. On Landscape Architecture Education and Professional Practice and Their Future Challenges. Land 2020, 9, 228. [Google Scholar] [CrossRef]
  9. Lin, W.; Sun, Y.; Nijhuis, S.; Wang, Z. Scenario-based flood risk assessment for urbanizing deltas using future land-use simulation (FLUS): Guangzhou Metropolitan Area as a case study. Sci. Total. Environ. 2020, 739, 139899. [Google Scholar] [CrossRef] [PubMed]
  10. Wohl, E.; Castro, J.; Cluer, B.; Merritts, D.; Powers, P.; Staab, B.; Thorne, C. Rediscovering, Reevaluating, and Restoring Lost River-Wetland Corridors. Front. Earth Sci. 2021, 9, 653623. [Google Scholar] [CrossRef]
  11. Kelly, D.; Maller, C.; Farahani, L.M. Wastelands to Wetlands: Questioning wellbeing futures in urban greening. Soc. Cult. Geogr. 2022, 1–22. [Google Scholar] [CrossRef]
  12. Miller, W. Introducing Geodesign: The Concept; ESRI Press: Redlands, CA, USA, 2012. [Google Scholar]
  13. Mariarinaldi, B. Landscapes of metropolitan hedonism The Cheonggyecheon Linear Park in Seoul. J. Landsc. Arch. 2007, 2, 60–73. [Google Scholar] [CrossRef]
  14. Weiers, S.; Bock, M.; Wissen, M.; Rossner, G. Mapping and indicator approaches for the assessment of habitats at different scales using remote sensing and GIS methods. Surround. Landsc. Urban Plan. 2004, 67, 43–65. [Google Scholar] [CrossRef]
  15. Kumar, P.J.S. GIS-based mapping of water-level fluctuations (WLF) and its impact on groundwater in an Agrarian District in Tamil Nadu, India. Environ. Dev. Sustain. 2021, 24, 994–1009. [Google Scholar] [CrossRef]
  16. Al-Adamat, R.; Diabat, A.; Shatnawi, G. Combining GIS with multicriteria decision making for siting water harvesting ponds in Northern Jordan. J. Arid. Environ. 2010, 74, 1471–1477. [Google Scholar] [CrossRef]
  17. Harsha, G.; Anish, T.S.; Rajaneesh, A.; Prasad, M.K.; Mathew, R.; Mammen, P.C.; Ajin, R.S.; Kuriakose, S.L. Dengue risk zone mapping of Thiruvananthapuram district, India: A comparison of the AHP and F-AHP methods. Geo J. 2022, 1–22. [Google Scholar] [CrossRef] [PubMed]
  18. Klötzli, F.; Grootjans, A.P. Restoration of natural and semi-Natural wetland systems in central Europe: Progress and pre-dictability of developments. Restor. Ecol. 2001, 9, 209–219. [Google Scholar] [CrossRef]
  19. Qiao, L.F.; Zhang, Y.C.; Cao, W. Evaluation of urban river landscape design rationality based on AHP. Water Sci. Enineering 2008, 1, 75–81. [Google Scholar] [CrossRef]
  20. Al-Shabeeb, A.R. The Use of AHP within GIS in Selecting Potential Sites for Water Harvesting Sites in the Azraq Basin—Jordan. J. Geogr. Inf. Syst. 2016, 8, 73–88. [Google Scholar] [CrossRef] [Green Version]
  21. Aydin, M.C.; Birincioğlu, E.S. Flood risk analysis using gis-based analytical hierarchy process: A case study of Bitlis Province. Appl. Water Sci. 2022, 12, 1–10. [Google Scholar] [CrossRef]
  22. Ekmekcioğlu, Ö.; Koc, K.; Özger, M. District based flood risk assessment in Istanbul using fuzzy analytical hierarchy process. Stoch. Environ. Res. Risk Assess. 2020, 35, 617–637. [Google Scholar] [CrossRef]
  23. Ghosh, P.K.; Bandyopadhyay, S.; Jana, N.C. Mapping of groundwater potential zones in challenging rock terrain using geoinformatics: A case of Kumari watershed in the western part of West Bengal. Model Earth Syst. Environ. 2016, 2, 1. [Google Scholar] [CrossRef]
  24. Gaber, R.M. Implementation Of Constructed Wetlands Landscape Design A Resilient Application. J. Urban Res. 2020, 36, 82–101. [Google Scholar] [CrossRef]
  25. Saaty, T.L. Decision making with the analytic hierarchy process. Int. J. Serv. Sci. 2008, 1, 83–98. [Google Scholar] [CrossRef] [Green Version]
  26. Saaty, T.L. How to make a decision the analytic hierarchy process. Eur. J. Oper. Res. 1990, 48, 9–26. [Google Scholar] [CrossRef]
  27. Wei, X.; Zhang, Y.; Feng, S. Construction and Research of Converged Media Random Matrix Model and Multivariate Evaluation System. Math. Probl. Eng. 2022, 2022, 1–11. [Google Scholar] [CrossRef]
  28. Ward, J. Riverine landscapes: Biodiversity patterns, disturbance regimes, and aquatic conservation. Biol. Conserv. 1988, 83, 269–278. [Google Scholar] [CrossRef]
  29. Schlueter, U. Ueberlegungen zum naturahen Ausbau von Wasseerlaeufen. Landsch. Stadt. 1971, 9, 73–82. [Google Scholar]
  30. Zhu, R.; Tsubaki, R. The Role of Riparian Vegetation Flexibility in a Bio-Hydro-Morphodynamic Simulation. Earth Surf. Process. Landf. 2022. [Google Scholar] [CrossRef]
  31. Wittmann, F. The Landscape Role of River Wetlands. In Encyclopedia of Inland Waters, 2nd ed.; Elsevier: Amsterdam, The Netherlands, 2022; pp. 51–64. [Google Scholar] [CrossRef]
  32. Liao, S.; Wei, Q.; Meng, Y.; Gao, G.; Cai, J.; Li, Y.; Zhang, Y. Four kinds of plants with flood-resisting and drought-enduring apply in the hydro-fluctuation Belt. Soil Water Conserv. Chin. 2009, 5, 13–16. [Google Scholar]
  33. Hölting, L.; Felipe-Lucia, M.; Cord, A. Reference Module in Earth Systems and Environmental Sciences; Elsevier: Amsterdam, The Netherlands, 2019; Chapter: 9.24. [Google Scholar]
  34. Huang, Y.; Lange, E.; Ma, Y. Living with floods and reconnecting to the water landscape planning and design for delta plains. J. Environ. Eng. Landsc. Manag. 2022, 30, 206–219. [Google Scholar] [CrossRef]
  35. Wang, L.; Ge, M.; Chen, N.; Ding, J.; Shen, X. An Evaluation Model of Riparian Landscape: A Case in Rural Qingxi Area, Shanghai. Land 2022, 11, 1512. [Google Scholar] [CrossRef]
  36. Le, P.Q. The Lower Mekong River Wetlands, the Lives of Local People and Their Sustainability. J. Ocean Cult. 2019, 2, 110–135. [Google Scholar] [CrossRef]
  37. Li, T.; Jin, Y.; Huang, Y. Water quality improvement performance of two urban constructed water quality treatment wetland engineering landscaping in Hangzhou, China. Water Sci. Technol. 2022, 85, 1454–1469. [Google Scholar] [CrossRef] [PubMed]
  38. Yoffe, H.; Plaut, P.; Fried, S.; Grobman, Y.J. Enriching the Parametric Vocabulary of Urban Landscapes. In eCAADe Conference: Anthropologic Architecture and Fabrication in the Cognitive Age; eCAADe: Berlin, Germany, 2020. [Google Scholar] [CrossRef]
  39. Brix, H. Use of constructed wetlands in water pollution control: Historical development, present status, and future perspectives. Water Sci. Technol. 1994, 30, 209–223. [Google Scholar] [CrossRef] [Green Version]
  40. Acharya, S.; Adak, T. Wetland management for sustainable development. J. Soil Water Conserv. 2009, 8, 25–30. [Google Scholar]
  41. Bernhardt, E.S. Synthesising, U.S. river restoration efforts. Science 2005, 308, 636–637. [Google Scholar] [CrossRef] [PubMed]
  42. Mitsch, W.J.; Gosselink, J.G. The value of wetlands: Importance of scale and landscape setting. Ecol. Econ. 2000, 35, 25–33. [Google Scholar] [CrossRef]
  43. Wilson, M.W. On the criticality of mapping practices: Geodesign as critical GIS? Landsc. Urban Plan. 2015, 142, 226–234. [Google Scholar] [CrossRef]
  44. Steinitz, C. Which Way of Designing? In Geodesign by Integrating Design and Geospatial Sciences; Lee, D., Dias, E., Scholten, H., Eds.; GeoJournal Library; Springer: Berlin/Heidelberg, Germany, 2014; Volume 111. [Google Scholar] [CrossRef]
  45. Gottwald, S.; Brenner, J.; Janssen, R.; Albert, C. Using Geodesign as a boundary management process for planning nature-based solutions in river landscapes. Ambio 2020, 50, 1–20. [Google Scholar] [CrossRef]
  46. Nyerges, T.; Ballal, H.; Steinitz, C.; Canfield, T.; Roderick, M.; Ritzman, J.; Thanatemaneerat, W. Geodesign dynamics for sustainable urban watershed development. Sustain. Cities Soc. 2016, 25, 13–24. [Google Scholar] [CrossRef] [Green Version]
  47. Huang, L.; Xiang, W.; Wu, J.; Traxler, C.; Huang, J. Integrating Geodesign with landscape sustainability science. Sustainability 2019, 11, 833. [Google Scholar] [CrossRef]
Figure 1. Satellite remote sensing images of the study site.
Sustainability 14 15612 g001
Figure 2. Regional map of the study range of EEL redesign in 2022.
Sustainability 14 15612 g002
Figure 3. The framework of the research process.
Sustainability 14 15612 g003
Figure 4. Results of individual geological factors analysis (the blue line presents the channel of Yuhangtang River).
Sustainability 14 15612 g004
Figure 5. Land cover and Euclidian distance to the river.
Sustainability 14 15612 g005
Figure 6. Ecological vulnerability evaluation map for the river wetland (Level 1 represents the most lowest EVE level, while Level 5 represents the highest EVE level).
Sustainability 14 15612 g006
Figure 7. Analysis of hydrological-related factor.
Sustainability 14 15612 g007
Figure 8. TRRI mapping of hydrological-related factor (Level I represent the lowest TRRI, while level V represents the highest TRRI).
Sustainability 14 15612 g008
Figure 9. Detailed redesigned banks along 4 reaches.
Sustainability 14 15612 g009
Figure 10. Terrain analysis for the redesign plan within Grasshopper (I, II, III, IV represent the Reach I, Reach II, Reach III and Reach IV).
Sustainability 14 15612 g010
Figure 11. Simulation of the inundation for the redesign plan (I, II, III, IV represent the Reach I, Reach II, Reach III and Reach IV).
Sustainability 14 15612 g011
Figure 12. 3-D visualisation of the EEL design model.
Sustainability 14 15612 g012
Figure 13. Rendering of redesigned sites at details of Reach III.
Sustainability 14 15612 g013
Figure 14. Visibility analysis from facility spots (I, II, III, IV represent the Reach I, Reach II, Reach III and Reach IV).
Sustainability 14 15612 g014
Table 1. A sample of the voting questionnaire.
Criteria 1Criteria 1 is More Significant
Equally Significant Criteria 2 is More Significant
Criteria 2
98765432123456789
Buffer distance (B1) Slope (B2)
Slope (B2) Aspect (B3)
Aspect (B3) Topological roughness (B4)
Topological roughness (B4) Land cover(B5)
Land cover (B5) Elevation (B6)
Elevation (B6) Buffer distance (B1)
Table 2. The PCM was constructed according to the voting by experts.
CriteriaB1B2B3B4B5B6Weight
Wetland buffer distance (B1)1455530.3399
Slope (B2)1/4121/31/31/30.1676
Aspect (B3)1/51/211/21/31/20.0575
Topological roughness (B4)1/53211/31/30.0949
Land cover (B5)1/533311/20.1538
Elevation (B6)1/3323210.1924
Table 3. Criteria rating results based on literature review and weights.
CriteriaWeightConditionRatingDegree of Vulnerability
Wetland buffer distance (B1)0.3399B > 2001Lowest
100 < B < 2003Low
50 < B < 1005High
B < 507Highest
Slope (B2)0.16760° < SL < 5°1Lowest
5° < SL < 10°3Low
10° < SL < 15°5High
SL > 15°7Highest
Aspect (B3)0.0575135° < A < 225°1Lowest
225° < A < 315°3Low
45° < A < 135°5High
0 < A < 45°, 315° < A < 360°7Highest
Topological roughness (B4)0.09490 < TR < 201Lowest
20 < TR < 403Low
40 < TR < 605High
60 < TR < 807Highest
Land cover(B5)0.1538Impervious surfaces and Built environments1Lowest
Grass3Low
Forest5High
Waterbody7Highest
Elevation (B6)0.19240 < E < 501Lowest
50 < E < 1003Low
100 < E < 1505High
150 < E < 3007Highest
Table 4. Description of the topological rainstorm risk index.
Topographic Standard DeviationElevation/m
E < 5050 ≤ E < 100100 ≤ E < 200200 ≤ E < 300300 ≤ E
TSD < 10.90.80.70.60.5
1 ≤ TSD < 100.80.70.60.50.4
10 ≤ TSD < 200.70.60.50.40.3
20 ≤ TSD0.50.40.30.20.1
Publisher’s Note: MDPI stays neutral with regard to jurisdictional claims in published maps and institutional affiliations.

