Article

A Microsimulation Modelling Approach to Quantify Environmental Footprint of Autonomous Buses

1
School of Civil and Mechanical Engineering, Curtin University, Perth, WA 6845, Australia
2
Emirates Centre for Mobility Research, United Arab Emirates University, Al Ain 15551, United Arab Emirates
3
Department of Civil and Environmental Engineering, United Arab Emirates University, Al Ain 15551, United Arab Emirates
*
Author to whom correspondence should be addressed.
Sustainability 2022, 14(23), 15657; https://doi.org/10.3390/su142315657
Submission received: 10 October 2022 / Revised: 18 November 2022 / Accepted: 23 November 2022 / Published: 24 November 2022

Abstract

:
In this study a novel microsimulation-based methodology for environmental assessment of urban systems is developed to address the performance of autonomous mass-mobility against conventional approaches. Traffic growth and microsimulation models, calibrated using real data, are utilised to assess four traffic management scenarios: business-as-usual; public bus transport case; public-bus rapid transit (BRT) case; and, a traffic-demand-responsive-autonomous-BRT case, focusing on fuel energy efficiency, headways, fleet control and platooning for lifecycle analysis (2015–2045) of a case study 3.5 km long 5-lane dual-carriageway section. Results showed that both energy consumption and exhaust emission rates depend upon traffic volume and flow rate factors of vehicle speed-time curves; acceleration-deceleration; and braking rate. The results measured over-reliance of private cars utilising fossil fuel that cause congestions and high environmental footprint on urban roads worsen causing excessive travel times. Public transport promotion was found to be an effective and easy-to-implement environmental burden reduction strategy. Results showed significant potential of autonomous mass-mobility systems to reduce environmental footprint of urban traffic, provided adequate mode-shift can be achieved. The study showed utility of microsimulations for energy and emissions assessment, it linked bus network performance assessment with environmental policies and provided empirical models for headway and service frequency comparisons at vehicle levels. The developed traffic fleet operation prediction methodology for long-term policy implications and tracking models for accurate yearly simulation of real-world vehicle operation profiles are applicable for other sustainability-oriented urban traffic management studies.

1. Introduction

Many scenario analysis studies have assessed the long-term impact of traffic management strategies developed by transport policy-makers. McCollum and Yang [1] note that vehicle fuel consumption, fuel type, urban population growth and most significantly, travel demand, are the key factors for achieving lower pollutant emissions from car traffic. Peng et al. [2] observed that to reduce the energy consumption and pollutant emissions, transport policymakers seek public transport (PT) services that cater for passenger needs and reduce reliance on private vehicles by increasing PT usage. Conversely, alternate-fuel autonomous vehicles (AVs) have changed the dynamics and overall outlook of urban transit [3]. Behavioural rebounds such as increased demand of private transit due to ease offered by AVs may reduce the efficiency and energy savings from the use of interconnected AV fleets capable of communicating with each other and smart transit road infrastructure [4]. Nonetheless, conventional transit operators have become early adopters of AV-based mobility services [5]. Autonomous PT is not a novel idea as land-based passenger transport is already dominated by autonomous rail transit in many cities [6].
Though, significant focus of environmental research on AVs has been related to shared or personalised AV cars [7], largely contributed by reduced air drag and cooperative braking, also targeted private car traffic [8,9]. Brown et al. (2014) estimated that shared autonomous vehicles (SAVs) may generate up to 90% fuel energy savings––arguably, such vehicles can only act as the first- and last-mile feeder services [10]. Conversely, the results from Europe’s pilot trial study “CityMobil2” not only show the real benefit of autonomous vehicles (AVs) in terms of the energy conservation potential of autonomous buses, but also social acceptance towards such vehicles [11], however, the long-term impact of AVs in PT still needs to be estimated.
Globally many studies have attempted to estimate the yearly energy consumption and emissions using annual vehicle inventories on several traffic management scenarios. Traffic microsimulation models (such as VISSIM, Aimsun, Sidra Intersection, etc.) can estimate the energy and pollutant-control benefits of various traffic management strategies [12] when combined with vehicle emission inventory models. However, this usage has been fairly limited to signal optimisation [13], highway and network capacity optimisation [14], and traffic safety research [15]. Some researchers have applied microsimulation modelling for estimating environmental impact on a limited scale. For instance, Oikonomou et al. [16] applied limited microsimulation models to show that automated public buses can have 11.3 kg CO2-eq. (2%) emissions during peak and 62.3 kg CO2-eq. (24%) during off-peak hour on an arterial road, but did not address the lifecycle impact under various driving conditions and particularly the benefit in urban traffic when AVs are introduced instead of the conventional transport. This remains a significant factor particularly when the overall sustainability benefit of AV-based PT needs to be traded-off against the high acquisition cost and potential issues in its operation [17,18].
Further analysis on quantifying the environmental footprint of introducing AVs in PT fleet, specifically in intensive private car-demanding urban areas can thus improve understanding of the lifecycle impacts of such endeavours being proposed in many municipalities. A comparative advantage of microsimulation models is the ability to focus on managing the vehicle network of a target area, non-linear traffic flow behaviour, dynamic modelling of each vehicle and potential for monitoring the platooning behaviour of individual vehicles in the fleet. As such, a case study highway section in Abu Dhabi, United Arab Emirates is studied as a representative of car-centric city (~80% car-share [19]), and a microsimulation based methodology is developed to determine the long-term environmental impacts. The methodology tested in this study can then be extended to analyse other cases in different cities, as well as fill a gap regarding long-term performance assessment of AV based PT comparative to other PT options in an urban traffic situation using high-resolution per vehicle behavioural and driving estimation models.
The remainder of this paper is structured as follows. First, a background of the study is presented in the next section. The study methodology including description of case study model, data sources, traffic management scenarios, and energy and emission calculation technique are explained in Section 3. Results of proposed methodology by each vehicle type, the investigation and comparison of trajectories across the four traffic management scenarios, and long-term policy implications (from year 2015–2045) are provided in Section 4. The conclusions are drawn in Section 5.

2. Background

Today’s roads are subject to excessive traffic congestions that increase energy consumption and exhaust emissions from the transport sector around the world. In the United States, transport sector is the 2nd largest contributor to greenhouse gas (GHG) emissions, while the emissions data from other G8 countries and European Union found it contributes around 2/3rd of the total GHG emissions [20]. Most of these CO2, nitrogen oxides (NOx) and particulate matter (PM) air pollutant emissions are generated from the fuel consumed by cars, while the pavement-related emissions form a smaller component of the lifecycle emissions from road transport sector [21,22]. For example, the passenger car fleet has been forecasted to remain the single largest contributor to environmental emissions within the transport sector in Australia for the year 2020, accounting for around 49,384 gigagrams CO2 eq. emissions [23]. Thus, reducing passenger car traffic has become one of the hot topics focused on various green transport policy initiatives to conserve/save energy and emissions reduction from the road transport networks.
Mikhail et al. [24] noted that by ensuring a shift of around 20–30% from private vehicle passengers towards PT, significant reductions can be obtained in the total energy demand from transport network, CO2, and PM emissions. In addition to reducing private vehicle demand through PT, literature also proposed alternate fuel technologies: compressed natural gas (CNG), electric and hybrid-electric. McKenzie and Durango-Cohen [25] estimated that due to differences in energy input, greenhouse gas (GHG) emissions from CNG bus operation in United States was 747 CO2 eq./mile lower than diesel bus. They also noted that emissions from hybrid diesel-electric (834 CO2 eq./mile) and hydrogen fuel cell (1088 CO2 eq./mile) were even lower but were dependent upon infrastructural support and energy-supply (fuel) pathways.
AVs are projected as potentially generating significant environmental benefits while enhancing cost and social performances of transport systems due to reduced air drag and cooperative braking, as well as creating safe spaces for road users [26]. Traffic simulation results from automation of private car fleet by Conlon and Lin [27] showed that introduction of 30% to 100% AVs can reduce the environmental footprint by 0.5% to 4.5%. Greenblatt and Shaheen [28] found up to 80% emissions reduction due to automation of on-demand and personal cars. Conversely, Krueger et al. [29] argue that instead of replacing public transit services, SAVs may in fact offer the “last/first mile solution”. On the other hand, autonomous public buses may be the future of urban transit due to capacity and early stage absorbance at less cost than rail transit, particularly as an intermediary to large-scale AV adoption [5,30] and thus automation of public bus fleets can also enhance environmental benefits for cities.
The GHG and energy policy analysis tool “Long-range Energy Alternatives Planning system (LEAP)” was used by Peng et al. [2] to perform analysis of Tianjin-China’s urban passenger transport sector under different scenarios on a per annum scale. Their results showed that PT promotion may result in reducing energy consumption by 22% and GHG emissions by 22.6% over the 30-year analysis period. Barth et al. [31] used International Vehicle Emissions (IVE) model to estimate high-resolution hourly emissions. The authors expressed the need for traffic models capable of modelling the real-world stochastic driving behaviour (cruising, acceleration, and braking) to assess the actual energy consumption of vehicles.
Generally, these studies used generalised emission factors aggregated by total number of vehicles for generating results or required extensive library, lifecycle inventory and calculation components that are not easily reproduceable [32]. For example, Lajunen and Lipman [33] used vehicle simulation models of various driving cycles representative of city bus operations to exhibit that energy consumption and pollutant emissions depend upon accurate modelling of driving behaviour, power-train technology, and bus operation cycles. Generally, electric buses exhibited lowest GHG emissions (180 g/km CO2 eq.), followed by hybrid (600 g/km CO2 eq.) and CNG (900 g/km CO2 eq.) compared to diesel buses. Ali et al. [34] addressed vehicle emissions for a developing country by applying COPERT model which utilises the impact of fuel technology, vehicle engine type and technology level, speed, and mileage on the emissions. However, a strong criticism of these models is that they use average speed to calculate the effect of driving on emissions without any regards for the on-road conditions and the actual speed profiles that affect the accuracy of results [35]. Additionally, these models need to be validated and modified for the application region through national-level adjustment measures (e.g., the work by Smit and Ntziachristos [36] in Australia for modifying and adapting COPERT for Australian traffic fleet). For accurate vehicle modelling, Varga et al. [37] proposed microsimulation environment to compare relative performance, headway, optimisation and platooning behaviour of different traffic management scenarios.
Traffic microsimulation software VISSIM was used in a study by Yulianto [38] to assess road network performances during peak-hours under various simulated traffic management scenarios. Traffic flow factors of vehicle speeds, travel times, and queue delays were used to benchmark performances after the Wiedemann-99 based car-following model was built using actual traffic counts and calibrated for the field conditions. Another study [39] applied VISSIM using Wiedemann-74 model for simulating local street traffic to assess the impact of capacity optimisation strategies after the model was calibrated. Speed-flow curves were used to determine the change in capacity with the change in car traffic and its impact on lane capacity and roadside parking manoeuvres. The study showed that an increase in traffic volume reduces vehicle speeds. Focusing on the interaction between multiple road users, i.e., vehicles and pedestrians, Ziemska-Osuch and Osuch [40] calibrated a VISSIM microsimulation model using GEH statistic and hourly traffic volume for analysing vehicle movements on an intersection. These studies demonstrated the utility of microsimulation for delivering insight about vehicle movements’ mechanics under various traffic management strategies, however, the analyses were performed for only hourly based period with limited insight for long-term assessment.
Microsimulation modelling using VISSIM was also adopted by Bandi and George [41] to evaluate long-term infrastructural improvement project alternatives for addressing traffic congestions. Although, the study focused on prioritising long-term investments, no projection for the traffic over the long-term were actually estimated and the study concluded with only noting the benefit of microsimulation modelling in calculating changes in traffic flow profiles as the road infrastructure is modified. The impact of reduced queue delays and improved flow on potential fuel consumption were also noted but no actual lifecycle impact calculations were presented. Further addressing the environmental component, Chen and Yu [42] investigated the energy and emissions impact of a bus rapid transit lane scenario to control private vehicle flow in Beijing. The authors used VISSIM and CMEM to estimate that due to the difference in fuel energy consumption caused by variations in stop-delay and braking behaviour, the pollutant emissions might increase by around 10.68%.
Some studies have examined the environmental footprint of AVs through microsimulation. For example, Manjunatha et al. [43] integrated VISSIM with EPA’s MOVES model to estimate vehicle energy consumption and exhaust emissions. They used speed and acceleration outputs from an hour long VISSIM model combined with MOVES emission factors to calculate impact of different AV penetration rates in car traffic on a small section. Although, the study provided interesting insight about the environmental benefit of AVs, it still modelled AV penetration on private cars whereas there is considerable debate about the impact of AV based PT to be higher than using AVs to just replace conventional cars on the road [17,44]. Furthermore, the study only estimated short-term benefits on traffic with limited volume-capacity ratios and only for one direction of traffic which is rarely the case. Only CO2 emissions were estimated using indirect integration of traffic data, while these are the most significant exhaust pollutants, NOx and PM emissions may be equally important.
Song et al. [45] included emissions, safety, and energy consumption indicators by comparing VISSIM and TransModeler microsimulation models on a simple highway section after the models were calibrated using GEH and car-following. In both cases, MOVES was used to calculate the environmental footprint from vehicle movement and traffic flow factors. It should be noted here that MOVES, despite its estimation capabilities and accuracies, is a country-specific estimator that can only model the energy consumption and exhaust emissions for United States traffic fleet. Although, efforts are currently underway for upgrading MOVES for global applications, currently its usability is limited.
On the other hand, Quaassdorff et al. [46] observed that a combination of VISSIM with the microscale emission model VERSIT+ is better equipped to assess the energy and emission reduction potential of various traffic management strategies by providing extremely fine temporal and spatial resolution for a global application with more generalised vehicle inventories that are adjustable for different vehicle types and engine efficiency. Additionally, an incremental introduction of alternate fuels (e.g., CNG, biofuel, electric) and vehicles (e.g., AVs) may also be easily modelled to represent a complex discontinuous adaption rate. Compared to the energy and emission calculators applied for large-scale energy policy forecasts, the limited modelling atmosphere of VISSIM is capable of creating several sub-models of psycho-physical, stochastic and time-step interaction of individual vehicles on a road section under different traffic conditions, which is better equipped to anticipate and visualise the long-term implications of strategies applied by the local transport agencies in many parts of the world to manage traffic on a micro or local scale.
The points covered in the preceding paragraphs and summarised in Table 1 highlight that sustainable transportation systems have to address public attraction towards private automobiles, intangible economic productivity factors and congested traffic routes. Although, the lifecycle assessment literature on road transport acknowledges the importance of usage stage [47], largely due to car traffic, the lifecycle assessment methods that provide a detailed methodology which is not geographically constrained to the US or Europe are limited at best as most lifecycle assessment work is focused on the pavement surface and its performance [48,49]. On the other hand, studies analysing environmental aspect of traffic management strategies focused on aggregated simplified emission or fuel use equations without any regard to stochastic vehicle behaviours, dynamic penetration rates or change in mode choice. Few studies analysed sustainable transport management options beyond a macro level, but mainly analysed the impact using localised models that are not applicable to the global audience. There are no studies that used micro level models and included lifecycle implications when implementing alternate transport management strategies. To demonstrate an alternate modelling technique coupling vehicle and emissions microsimulation with lifecycle assessment, a case study project in the United Arab Emirates (UAE) is selected. The United Arab Emirates has one of the highest per capita GHG emissions in the world at 23.3 tonnes per capita CDE and a significant share of these emissions are contributed by the fuel energy demands from transport sector.
The car traffic in United Arab Emirates has been increasing dramatically due to the construction boom, population growth (~25% in 2005–2008) and travel demand share of private vehicles. The local transport department [19] estimates that car trips account for approximately 80% of total “travel mode split” in the largest and capital City of Abu Dhabi. This is arguably the primary cause of 18 Mt CDE of GHG emissions in the city from road transport sector. No water-based PT options are available while the hot climate and high humidity levels in the region [50,51] makes it difficult for uptake of active transport modes common in “developed” cities (walking, shared micromobility, etc.), while public bus service is currently unoptimized [19]. These factors make it an interesting location for analysing the impact of implementing PT-based alternate traffic management strategies in a considerably controlled urban environment where the only two transport options, car traffic and PT services, are easy to analyse under various scenarios. The estimation and simulation models forming the methodological basis utilise globalised inventories that can be used by other studies to project long-term environmental footprint of alternate traffic management strategies, specifically prioritising between the conventional PT and the AV-based PT as the technological improvements further improve lane capacity and platooning behaviours.
The aim of this study is hence to provide a novel assessment methodology for traffic management strategies using empirical, predictive, and detailed vehicle models scaled over to asset’s lifecycle. This approach utilises stochastic car-following behaviour of individual vehicles to optimise the PT service at a localised/project-level stage and predict future emissions and energy consumption rates. The controlling technique is the use of real-world traffic counts and flow data to develop and validate microsimulation models against field-observed driving behaviour. Study methodology has a wide applicability to transport system design projects in regions where an over-utilised, high density and mixed private car traffic is dominant and alternate land-based traffic modes are to be investigated

3. Methodology

All the existing vehicle types from the traffic counts are modelled using detailed inventory data, traffic growth models, and advancements in fuel and vehicle technologies. Four scenarios: baseline, bus-based and bus rapid transit-based cases were analysed. The benefits of vehicle-to-vehicle communication and increased lane capacity offered by autonomous vehicles are modelled as the future-projected case.

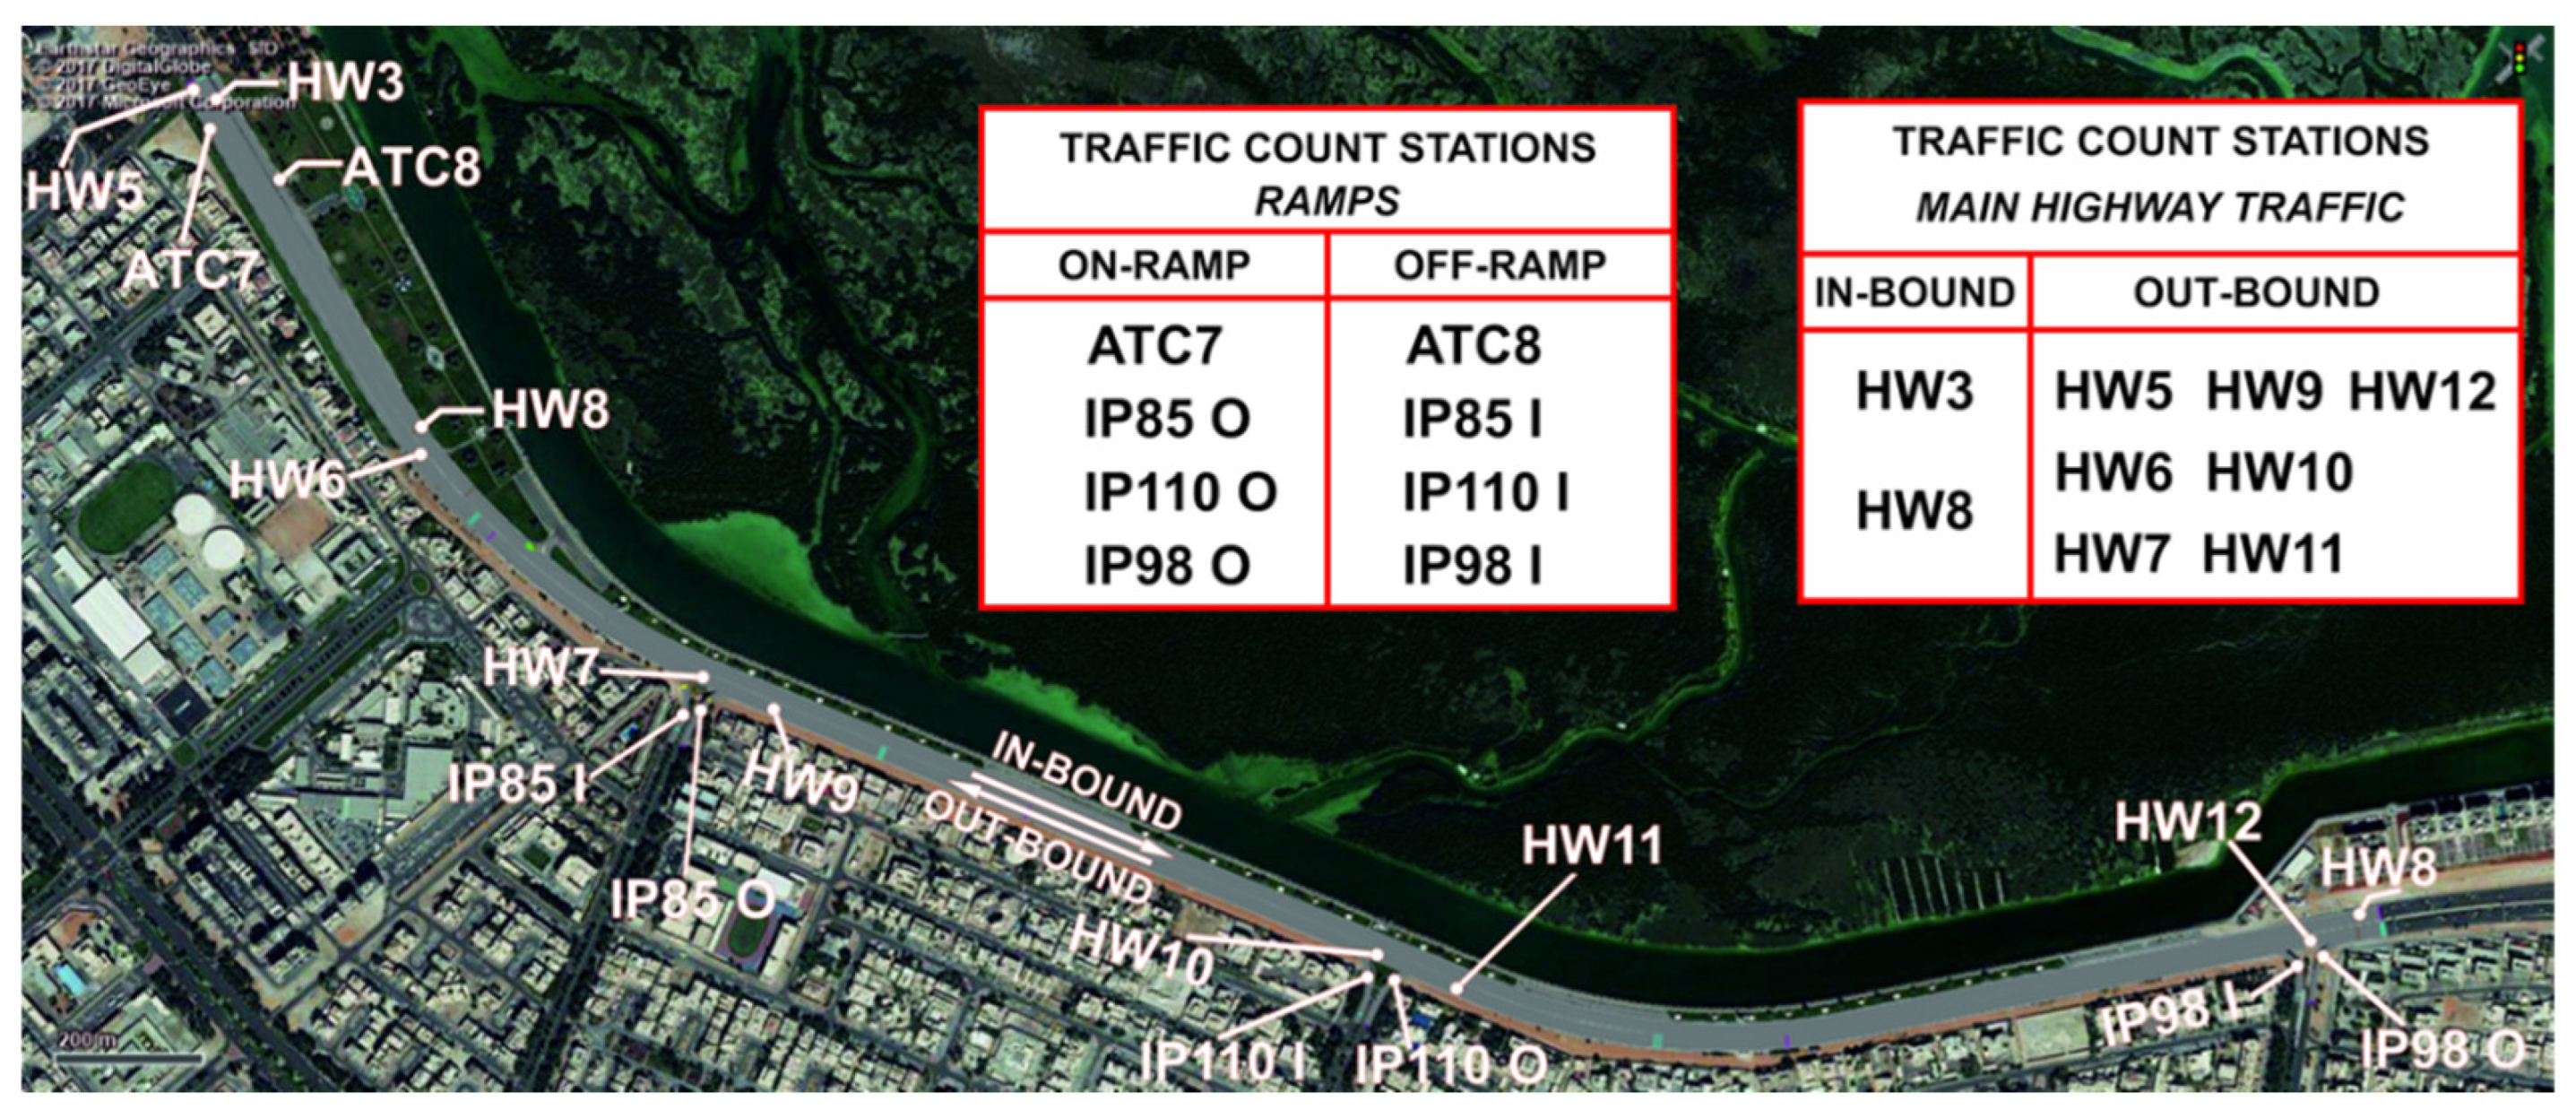
3.1. Case Study Model

The case study location is a 3.5 km stretch of a major five-lane dual-carriageway road “E10” within Abu Dhabi city highway network. This highway section is among the highest traffic density roads in the city and has undergone major extension in 2009 and 2019 to tackle growing traffic needs. Traffic counts for this road were initially estimated by the Abu Dhabi Department of Transport (ADDoT) and the Abu Dhabi Municipality (ADM) in 2015, which is selected as the base year for this study. The locations of these traffic count stations are illustrated in Figure 1. These stations collected information about the vehicle types, routes, and traffic intensity.
The purpose of using actual traffic counts is to minimise any uncertainties in results. Traffic data for representative weeks in the base year was used to model and validate the case study road segment and origin-destination matrices of the different vehicles for the simulation of current traffic situation. Traffic is gradually increased to model the traffic-related emissions and energy consumption of subsequent years up to a projected year 2045 to reflect a 30-year analysis period recommended by local experts [19]. Kazim [52] and Chinery [53] have performed scenario studies on passenger car growth in the United Arab Emirates and have recommended an exponential function of time and annual vehicle growth rate to project the future number of vehicles as follows:
N = N o × e α ( t t 0 ) , t 0 t t 1
where “N” is the number of vehicles in year “t”, “NO” is the initial number of vehicles in base year “to” and the annual vehicle growth rate is “α” which is taken as 6% for United Arab Emirates based on the estimates proposed by Chinery [53]. Additional traffic models are then created here for each subsequent year using the project traffic levels calculated from this equation, this approach can then be used to provide a more realistic impact of the promotion of PT traffic management strategies with the annual increase in traffic.

3.2. Traffic Management Scenario Design

The idea behind this study is to compare the long-term energy consumption and pollutant emission impact of implementing three public bus transport-based traffic management strategies against the existing base case traffic conditions. The United Arab Emirates relies heavily on imported vehicles to meet its travel needs and no specific regulations were implemented prior to the year 2000 [54]. Euro IV emissions standard vehicles started rolling out from 2005 and mandated by 2018 [55]. New vehicles are now recommended to have Euro V [56] and Euro VI fuel technology engines by 2030. Based on these reasons and age distribution of vehicles, Table 2 shows the distribution of each Euro emission standard projected by this study. The vehicles with Euro I and earlier fuel technology occupy 31.7% share in the base year 2015 and Euro II with 33.5% share, with the share of the subsequent Euro standards (Euro III–VI) improving each subsequent year to constitute 78.06% share by the year 2045. The detailed mode share distribution between various vehicle types is shown in Table 3.

3.2.1. Do Nothing or Business-as-Usual: Traffic Management Scenario 1 (BAU)

The BAU scenario assumes that the current lane configuration on the case study highway section shall continue without any modifications. The five lanes in each carriageway shall continue to be dedicated to conventional mix-vehicle type traffic. Following the current situation on the case study route, no PT is provided on the road. Assuming consecutive growth in economy and vehicle sales, the traffic continues to grow 6% every year based on the secondary growth models from literature (Section 3.1), until the year 2045. The vehicle weight classes in the collected traffic counts are used to establish the vehicle fleet breakdown as: small-size cars (length ≤ 4.5 m and engine size ≤ 2.5 litres); regular-size cars; minibus and coaches; light-duty trucks (LDV); and heavy trucks. It is also assumed that following the two recent extensions, i.e., in 2009 and 2019, and lack of adjacent vacant land, no extra budget is allocated for future extension works.
The vehicle fuel policy is assumed to be consistent with the current trends where the majority of passenger cars (small and regular) are petrol vehicles [66,67] followed by diesel and other fuel technology types [53] as also shown in Table 3. The fuel energy consumption of these cars is based on the average value for vehicles in each class. The vehicle sales report from Fox [68] states that majority (32%) of the passenger vehicles sold in the United Arab Emirates region during past few years were Toyota followed by Nissan (16.6%), Mitsubishi (11.1%), Hyundai (7.1%), BMW (4.8%) and Ford (3.5%). Among the individual vehicle makes; Toyota Corolla and Camry, Land Cruiser and Pajero SUV were the most common models. Passenger taxi vehicle policy is dominated (80–85%) by Toyota Camry vehicle share [69], and as such, it is modelled within the passenger car category with United Arab Emirates average car occupancy rate (1.7 passengers/car [19,70]). Following the current vehicle sales and policy trend in the United Arab Emirates, the average age of all cars in case study location is assumed as 5.2 years [71] and the average age for other vehicle types is assumed as 6.39 years [72].

3.2.2. Public Bus Transport Service: Traffic Management Scenario 2 (Bus)

The information gathered by authors from the publicly available intercity bus schedules and DoT Abu Dhabi [19] indicate that local public bus services typically operate hourly or half-hourly frequency, with around 50 passenger seats (per bus) regardless of the peak/off-peak traffic demand. Local traffic surveys [70] show that the average public bus occupancy is in the range of 40–60% of the passenger seats, while DoT Abu Dhabi [19] found that public bus transport currently carry 20% of daily passenger traffic. Most buses operate on diesel fuel technology, with CNG buses only recently introduced in the region. It is assumed that if a bus service is introduced in the case study area with the current city-wide average bus headway of 30 min between two buses, the passenger mode share may switch to the existing mode-share profile in the areas of Abu Dhabi where such services have been already provided, i.e., 20% for PT and a total of 80% for small- and regular-size car traffic (Table 3). The total number of car passengers for the BAU case (CPjBAU) is determined first by multiplying the total car traffic count from the counting stations in Figure 1 with the “average car occupancy” value of 1.7. It is then used to calculate the reduction in the car traffic for the “Bus” scenario as follows.
C T j s = C P j B A U × C S j s a v g . c a r o c c u p a n c y
where “CT” is the car traffic of category “j” (small/regular) car, “s” represents any of the traffic management scenarios considered in this study, and “CS” is the mode share of “j” type cars in the scenario “s”. The traffic count for other vehicle types is assumed to be the same as the BAU scenario with only the passenger car traffic reduced due to the bus service operating alongside the existing traffic by the year 2045. Traffic growth model from Equation (1) are used to project future traffic levels. The fuel technology, fuel energy consumption and the CO2 emissions are detailed in Table 3. Based on the characteristics of the Abu Dhabi bus fleet and the findings by Chinery [53] on gradual penetration of CNG vehicles, around 29% of bus fuel is assumed to be CNG-based. However, as the United Arab Emirates already has an extensive CNG distribution network, CNG bus use may significantly improve in the coming years. This equation can also be used by other studies to calculate the approximate decrease in car traffic when an alternate mode, particularly public transport is provided, in absence of the larger land-use, transit routes and area profile models.

3.2.3. Bus Rapid Transit Service: Traffic Management Scenario 3 (BRT)

The current service frequency in the case study region is not generally varied throughout the day to address the peak hour traffic demand. Although, a demand-responsive bus network is planned to provide a reliable service with peak period frequencies of at least 4 buses per hour [19] over long-term. As a potential traffic management scenario on the case study highway route, the frequency of bus service is increased (headway = 15 min) to match the 4 buses/h target. The extreme left lane on both carriageways is constrained to only serve the public BRT service. BRT service is considered to operate constantly at same service frequency level (i.e., headways) by the year 2045. Due to a significant decrease in the BRT travel time compared to the bus scenario, it can be logically argued that more passengers may choose to travel by PT, following Wu and Pojani [73] and the findings of a previous study by the authors on the case study route where respondents were more inclined to use buses provided a more frequent service is introduced [74,75]. Thus, mode share of PT service is slightly increased to 25%. Vehicle fuel technology is assumed to remain unchanged throughout the years. Table 3 lists the detailed vehicle fuel consumption parameters.

3.2.4. Autonomous Vehicle-Based BRT: Traffic Management Scenario 4 (AV-BRT)

The AV-BRT scenario is a future-based theoretical scenario which is an escalation of the high-speed tram service policy plans and the BRT scenario. The low energy consumption benefits of autonomous vehicles which were investigated in this study include vehicle-to-vehicle communication to minimise the gaps between vehicles and the acceleration-deceleration rate to increase fuel economy [26] and space utilisation, gear-shift perfection and improved speed-flow profiles. The fuel technology of autonomous vehicles being developed currently is mainly based on electric powertrains [17]. Although the complete adoption of electric fuel engines in transport sector may drastically reduce the energy consumption and exhaust emissions, many uncertain factors in the Abu Dhabi and GCC region remain. The energy-intensive need for air-conditioned vehicles due to the hot Middle Eastern climate, large investment required in fuel distribution infrastructure and upgrades of power generation grids to reduce reliance on electricity generation by fossil fuels in the United Arab Emirates [76] and the global uncertainty in travel range of electric vehicles still need further research.
Conversely, manufacturers such as Ford Motor Company, are already researching CNG or electric-CNG hybrid autonomous vehicles [77]. The focus of the current paper is to assess the reductions in fuel energy consumption and exhaust pollutants due to the reduction in private car use and improved traffic flow profile at a micro level to provide decision-makers worldwide with an alternate assessment methodology. As such it is assumed that the hypothetical autonomous buses utilise existing CNG fuel distribution networks for their energy needs (Table 3). On the case study highway section, the extreme left lane on both carriageways is restricted to only serve the AV-BRT service. Hasan et al. [75] found that public bus transport use can be increased in Abu Dhabi by increasing bus service frequency during peak traffic hours and by providing a dedicated BRT service due to the resulting reduction in passenger journey time on buses. In the AV-BRT scenario, peak hour bus frequency is increased to 5 min headway between two buses while the off-peak service frequency is unchanged from the BRT scenario. The mode share of public bus service is increased to 35% during peak hours and 25% during off-peak hours, which is still less than the 41% PT mode share estimated by the preferred PT traffic management scenarios of the local department of transport. Therefore, the actual benefits of implementing the improved PT strategy may be more than the conservative calculations in this study.

3.3. Vehicle Modelling System

This study utilises VISSIM as microsimulation vehicle modelling system to model the traffic flow behaviour, queue formation and delays by considering the interaction between passenger cars, light- and heavy-duty vehicles, and public bus transport service. VISSIM is a behaviour- and time step-based microsimulation model capable of analysing vehicle transit under traffic control strategies by taking into account the interactions between several types of vehicles [78]. Fellendorf and Vortisch [79] argue that since VISSIM is based on link-connector system, it can accurately model the complex geometries of actual roads to represent the real-world traffic movement patterns and flow behaviours of the driver-vehicle-fuel units. To that end, the vehicle acceleration-deceleration, and speed-time parameters in VISSIM can be stochastically varied to consider the “car-following” logic of drivers under traffic management scenarios based on the relative distances and speeds compared to surrounding vehicles.
The exhaust emissions model VERSIT+ developed by TNO Laboratories [80] is used alongside VISSIM to analyse the real-world high-resolution energy and emission impacts. It is preferred over other models due to its capability of importing complex vehicle speed-acceleration spatial trajectories and predict the emission rates (g/h) for each vehicle class modelled in VISSIM. The VERSIT+ model is based on more than 12,000 vehicle types, fuel energy consumption, vehicle make and model, fuel technology and 246 emission algorithms for each type and category representing real-world driving conditions [46,81]. The model uses multivariate regression techniques to calculate the traffic emissions (TEj) for each of the vehicle classes by taking into account the g/km emission factors (EFj,k,l) based on fuel energy consumed due to actual driving patterns [82] in terms of speed-time profile. It also considers engine response to aggressive acceleration-braking as well as cold-started engines.

3.4. Microsimulation Model Development

VISSIM is used in this study for simulating traffic flow data and analyse the benefit of PT and AV-based solutions. The road section geometric conditions and vehicle profiles were modelled as per the base year traffic counts. This VISSIM-based model uses a time-step stochastic modelling approach which models vehicle-driver unit as fundamental entity applying a psychophysical Wiedemann-74 (merging traffic) and Wiedemann-99 (highway) car-following-model relying on ten parameters for modelling actual driving behaviour [83,84]. These parameters are presented in Table 4. This paper does not focus on the mathematical interrelation between these parameters and as such the empirical formula for these are not presented in this study since others [85] extensively cover this. A brief description of these parameters is provided below while default values are listed in Table 4. The vehicle sizes, speed curves, bus headway, and dwell times are modelled based on the actual conditions on the case study area.
  • CC0” and “CC1” are the coefficients applied for calculating safe car-following distance in metres as following, and values can range from 0 to ∞.
d x s a f e = C C 0 + ( v × C C 1 ) ,   for   v = s p e e d   o f   f o l l o w i n g   v e h i c l e
  • CC4” and “CC5” represent the speed and acceleration coupling relation of a succeeding and following vehicles, both values should be equal but carry opposite signs and smaller values indicate a tighter coupling of vehicles in the simulation traffic.
  • CC6” represents speed oscillation of following vehicle compared to preceding vehicle, i.e., a higher value indicates that the following vehicle driver will accelerate more frequently as its distance to preceding vehicle grows which is not a common observation in congested situations, so its effect is negligible on congested highways.
  • CC7” is the acceleration during above oscillation phase, and it controls for driver tendency to accelerate gently or suddenly depending upon the magnitude.
  • CC8” is the acceleration from a stopping condition and the actual accelerations within the simulation are varied stochastically by the in-built algorithms in the software as per the user-defined upper- and lower-bound values.
  • CC9” defines the vehicle acceleration when travelling at 80 km/h and has little effect on congested highway situations.

3.4.1. Microsimulation Model Calibration

The process of calibrating a microsimulation model involves changing various parameters until the model faithfully replicates field vehicle movements. During calibration, VISSIM’s settings are changed to reflect the behaviour of the modelled highway network as closely as possible. The typical weekday traffic dataset from first week of the base year 2015 traffic counts was used to build the OD matrix input. Figure 2 shows a graph of the model run results for the whole week plotted against the field-observed vehicle flow profile (vehicles/h).
The initial simulation run had a number of errors, with more than 2000 vehicles becoming lost vehicles upon queuing over 1 min for a lane-change. Overall, the simulated model did not meet the GEH statistic criterion with the simulated traffic counts for nearly all traffic stations failing the cut-off criteria of GEH < 5 for 85% of the cases [86], highlighting the need for model calibration. Although the calibration was done manually, it takes into account appropriate parameter modifications and realistic driving movements. Its purpose was two-fold (i) reducing the differences in the parameters set, and (ii) bringing the GEH value within an acceptable range [41], with an overall aim to create a microsimulation model capable to replicate field-observed conditions. As such, following several optimization approaches, the calibrated parameters presented in Table 4 are selected. In general, the calibration procedure started from specifying enhancement scenarios where the values for the first three user-calibrated parameters (CC0, CC1 and CC2) are progressively altered by different percentages (e.g., 15%, 25%, 50%, etc.). This procedure is already well-established within research and industrial applications of microsimulation modelling [12,86]. The simulated traffic count results using these driving behaviour parameters only negligible (15% error or less than 100 vehicles per hour) differed from the observed counts, as shown in Figure 3.

3.4.2. Microsimulation Model Validation

The traffic-count dataset for the second week of 2015 base year applied to the developed microsimulation model was then used for validating the calibrated base-case VISSIM model. Figure 4 shows a comparison between the traffic-volume profile for the modelled and field-observed dataset. The findings indicate that, with the exception of a few small inaccuracies, the simulated traffic-counts were able to accurately reflect the actual traffic condition on studied highway section, since the percentile error is within the acceptable margins.

3.5. Calculation of Pollutant Emissions and Energy Consumption

The pollutant emissions based on VERSIT+ are calculated using the EnViVer emission modelling tool containing the real-world driving conditions representative of several on-road and laboratory trials of vehicles to accurately account for driving behaviour, speed, and traffic control measures for different road types. The emissions calculations are determined from vehicle age, engine fuel consumption based on the injection technology (Euro I, Euro II, Euro III, Euro IV, Euro V and Euro VI engines), fuel technology (diesel, petrol, CNG, electric) and their distribution over fleet [87]. Traffic exhaust emissions (TEj) are calculated as follows [88]:
T E j = k , m ( E j , k , l F × T V k , m × L m )
where EFj,k,l is the g/km emission factor for “j” pollutant, vehicle class “k” and speed-time profile “l”, per h traffic volume is “TVk,m” on a road section “m” of road length “Lm”. The vehicle categories (light-duty, heavy-duty, passenger cars, bus, minibus, and coach, etc.), vehicle size, fuel technology, and engine fuel consumption standards are input into the model. EnViVer then calculates the pollutant emissions based on these factors and the fuel consumption of vehicles which is dictated by the relevant Euro standards. The energy consumption values were calculated based on fuel consumption of each vehicle type, fuel and vehicle distribution in the traffic and the average CO2 emissions per litre of each fuel type [89]. The lifecycle inventory (LCI) which is used in this study to calculate the pollutant emissions and energy consumption is shown in Table 3 earlier.

4. Results and Discussion

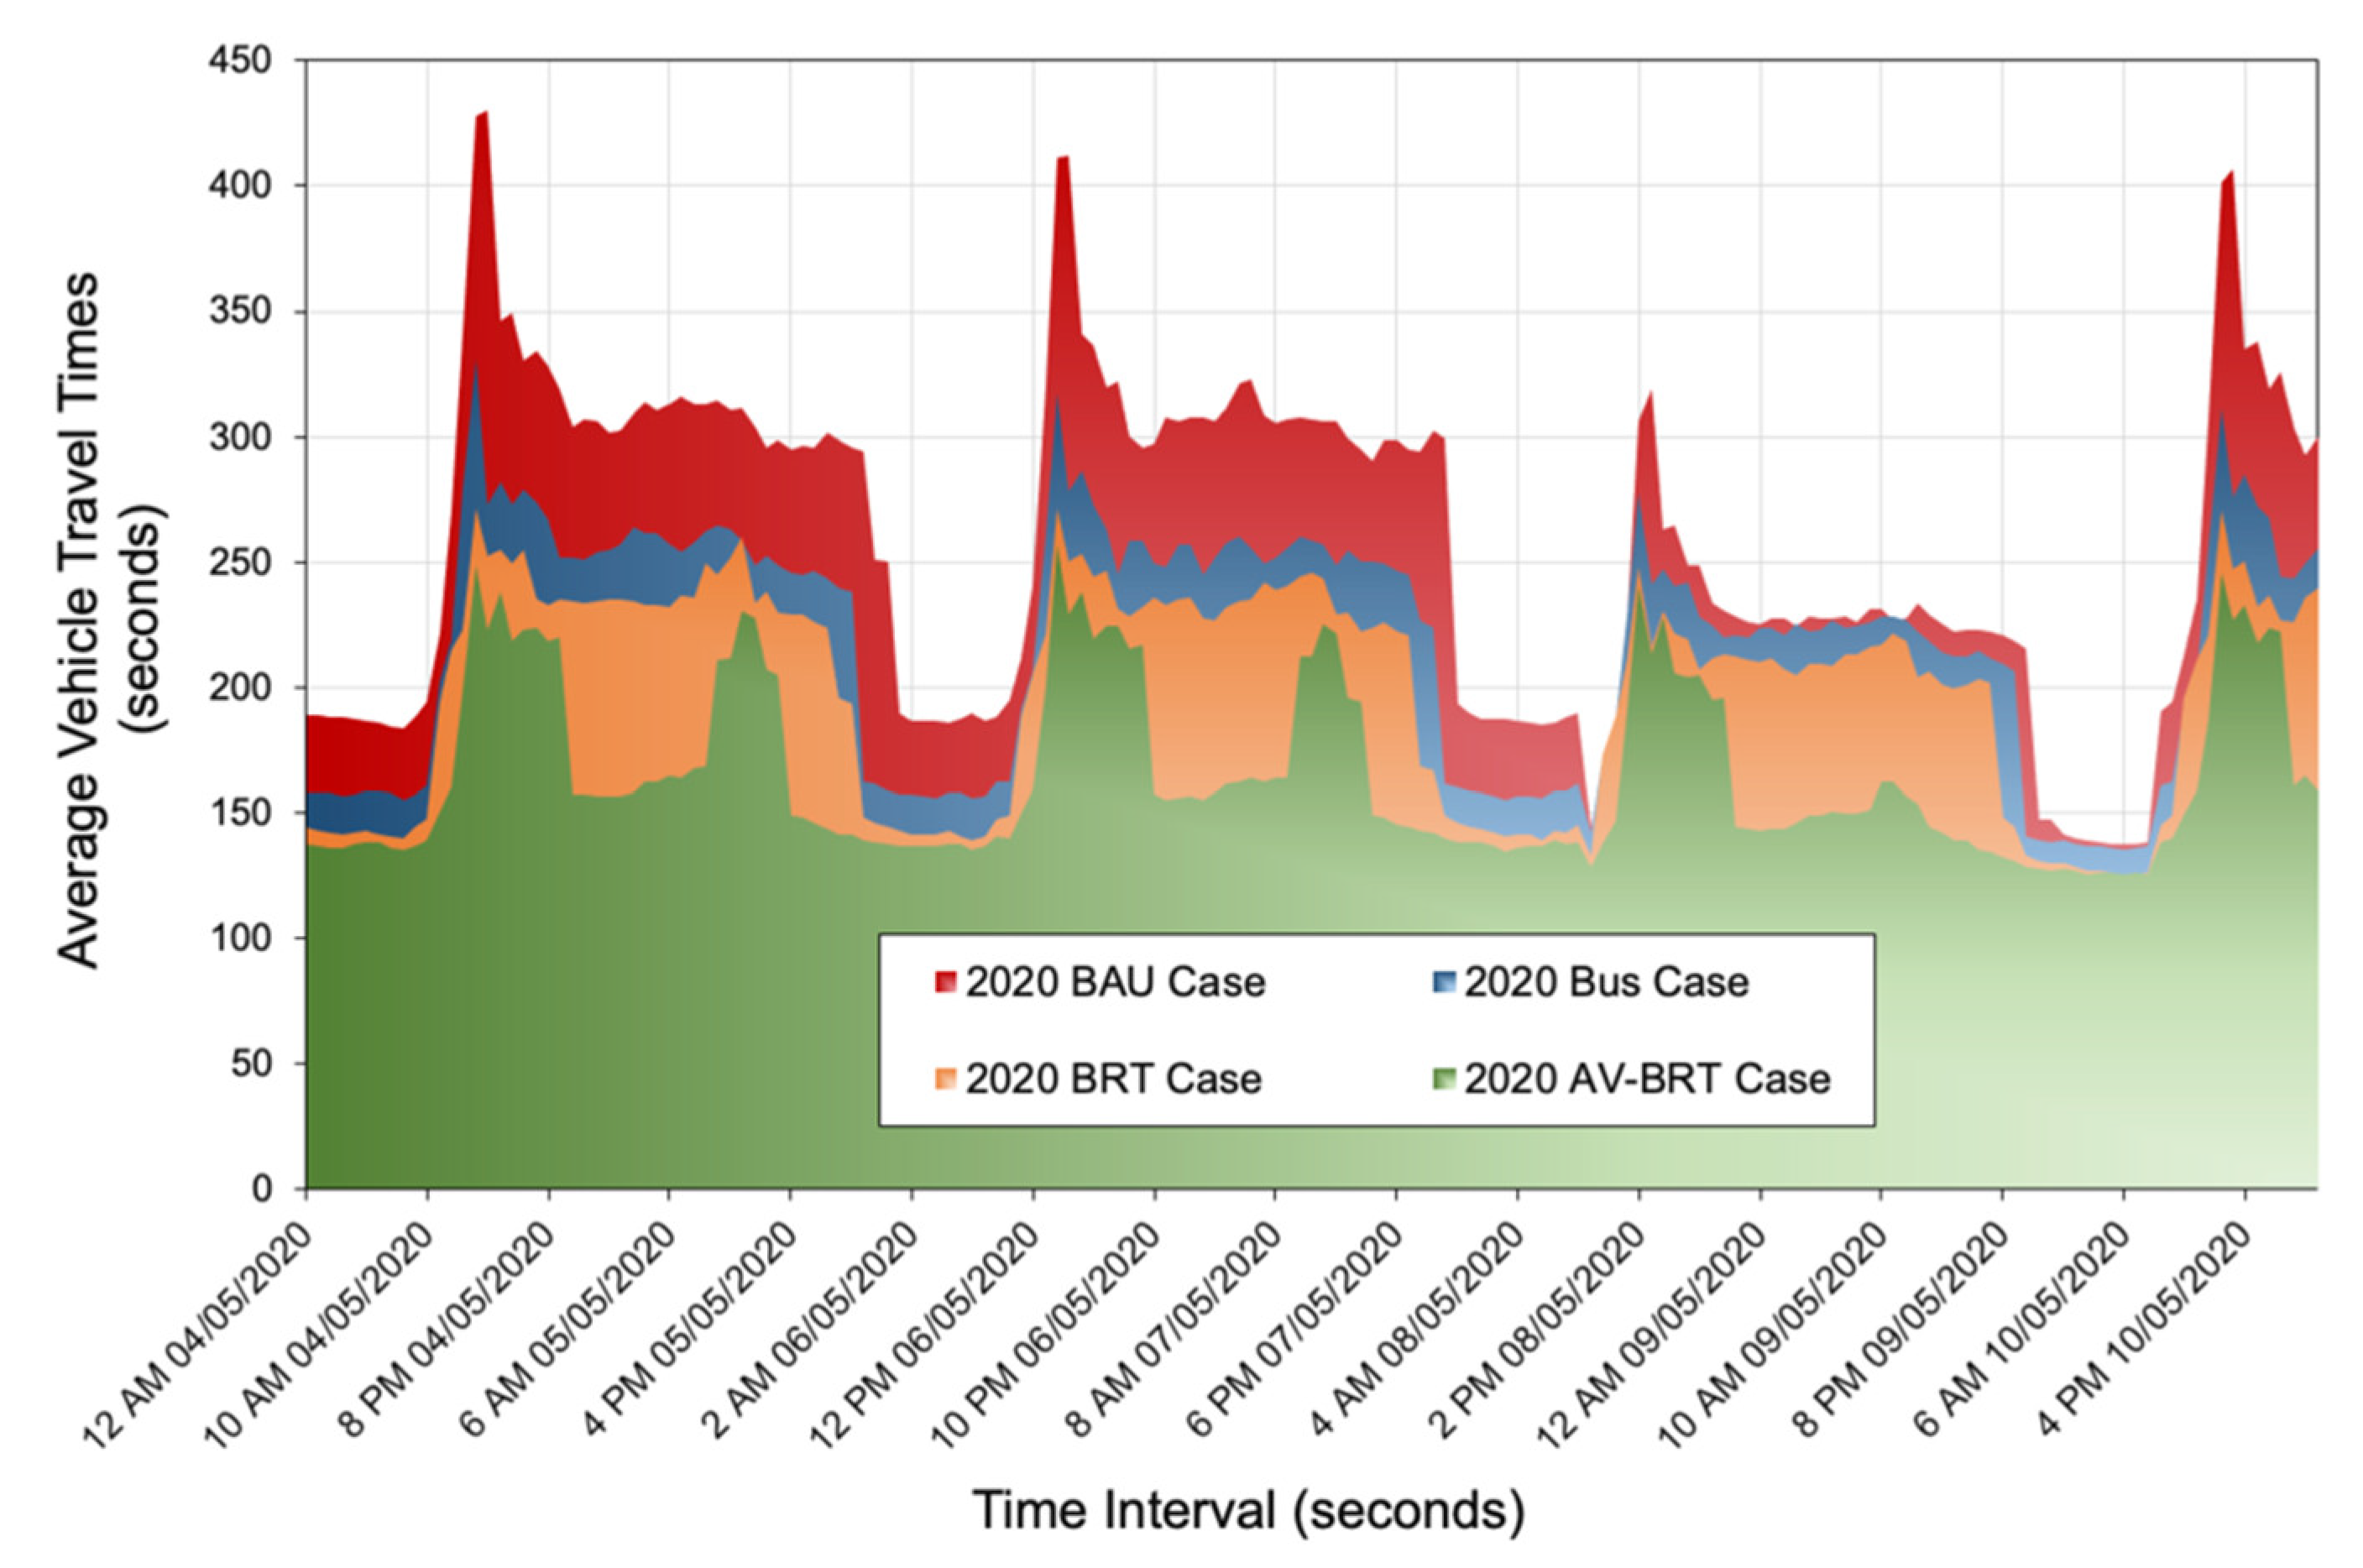
4.1. Current Traffic Situation

Traffic counts from representative weekday traffic dataset of the base year 2015 were used to provide the OD matrix in the BAU scenario. The current weekly traffic count results for the different vehicle types are graphed at hourly resolution in Figure 5 below. The period from 4–7 May 2015 and 10 May 2015 represents typical working days for the Abu Dhabi city. The peak in traffic between 7:00 am and 8:00 am during workdays corresponds to the morning rush hours due to the start of the workday, particularly significant for passenger car traffic in terms of small-size cars (~8700 vehicles) and regular-size cars (~7200 vehicles). The period between 2:00 pm–3:00 pm represents the high traffic densities during lunch hours which again show a rise in general traffic with a substantial increase in private vehicle traffic. The evening peak hours between 7:00 pm–8:00 pm also exhibit a similar trend corresponding to the end of workday traffic. The period from 8–9 May 2015 represents the weekend. The traffic peak period trends are hence indicative of the typical non-working days flow patterns. For example, the 5:00 pm–7:00 pm passenger vehicle peak may show travel activities of residents for leisure purposes.

4.2. Projected Energy Consumption and Exhaust Emissions Distribution in BAU

BAU energy consumption due to fuel consumed by vehicles, was dominated by private car traffic due to the larger vehicle population share of small- and regular-size cars. Figure 6 shows that during the base year 2015, energy consumption for small-size cars was the highest at 360.66 TJ, followed by regular-size cars (174.96 TJ) and heavy trucks (174.75 TJ). The CO2 and PM exhaust emissions were also highest for small-size cars (20.772 kilo-tonnes CO2 and 2.134 tonnes PM) and regular-size cars (17.904 kilo-tonnes CO2 and 1.644 tonnes PM) followed by heavy trucks (9.342 kilo-tonnes CO2 and 0.936 tonnes PM). These comparatively higher exhaust emissions and energy consumption indicated that more attention should be focused on addressing the high traffic volume of private cars.
The significant energy consumption associated with heavy trucks is due to the high calorific value of diesel fuel used by heavy-duty engines. In case of NOx emissions, diesel fuel consumed by heavy trucks yielded the highest exhaust emission of 41.373 tonnes. Small- and regular-size cars also exhibited high NOx emissions, i.e., 12.559 tonnes and 16.293 tonnes. The higher NOx exhaust emissions of heavy trucks were caused by the higher volume of diesel fuel compared to passenger cars that largely relied on catalyst-based petrol engines. Similarly, difference between the two types of petrol cars (small- and regular-size) was caused by the category of fuel consumed and differences among the in-cylinder combustion processes of both types of cars due to the make and model variations. In United Arab Emirates, a significant portion of regular-size cars, e.g., Land Cruisers, BMWs, and Mercedes, etc., use RON 98 high-octane fuel which has a lower NOx emission rate than the RON 95 low-octane fuel used in the prevalent small-size cars such as Toyota Corolla and Hyundai Accent, etc.
The vehicle population in the United Arab Emirates is expected to continuously grow over the years due to the population growth, economic development, and demand for private passenger cars. Traffic modelling has demonstrated that the rate of energy consumption and the rate at which exhaust pollutants are emitted from the vehicles on the case study highway section will increase several fold in the next 30 years (Figure 7) if no attempt at improvement is made. Gao et al. [90] note that the frequent acceleration and deceleration of vehicles account for large fuel use in high traffic density areas. Similarly, the energy consumption rate for the case study highway was also determined by the traffic density, vehicle flow rate, acceleration-deceleration, and speed. The traffic volume increased with each subsequent year which then corresponded to a rapid reduction in engine speed and vehicle velocity as the studied highway section approaches saturation flow rate. These findings are evident in Figure 7 which shows that even though over the years more Euro V and Euro VI energy and pollutant-control vehicles are introduced into the daily traffic and the older models are retired, the accumulative energy consumption and exhaust emissions are significantly dependent upon the engine operating conditions, traffic flow rate, fuel economy and acceleration-deceleration rate.
Figure 7 shows that the energy consumption and exhaust emissions rate continued to increase in the subsequent years and the highest values were observed during the last 10 years, i.e., from 2035–2045. During base year 2015, energy consumption rate for small-size cars was 41.54 × 10³ MJ/h, for regular-size cars 20.154 × 10³ MJ/h and 20.129 × 10³ MJ/h for heavy trucks. The reason for these results was the low fuel economy of small-size cars, particularly in traffic congestions, large total travel distance of both types of passenger cars due to the larger share in traffic, and larger fuel economy of heavy-duty engines. After considering all vehicle types, the total energy consumption rate for the entire vehicle fleet on the case study highway section for the last 10 years was 2.91 times higher than the combined energy consumption rate of vehicles during the initial 20 years. The minimum overall vehicle energy consumption rate was 91.224 × 10³ MJ/h observed for the base year 2015 and the highest value of 4225.18 × 103 MJ/h was calculated for the year 2045 which was 46.32 times higher than the base value.
Exhaust emission rates further confirmed the results of total emissions for base years in terms of individual contribution by each vehicle type as: CO2, NOx and PM for small-size cars (2.393 tonnes/h for CO2, 1.877 kg/h for NOx and 0.246 kg/h for PM), regular-size cars (2.062 tonnes/h CO2, 1.446 kg/h NOx and 0.189 kg/h PM), heavy trucks (1.076 tonnes/h CO2, 4.766 kg/h NOx and 0.108 kg/h PM) followed by light trucks (0.306 tonnes/h CO2, 0.269 kg/h NOx and 0.021 kg/h PM) and minibus and coaches (0.264 tonnes/h CO2, 1.098 kg/h NOx and 0.039 kg/h PM). Similar to the accumulative energy consumption rate, exhaust emissions rates were minimum for base year due to high acceleration-deceleration in subsequent years caused by traffic growth. The CO2, NOx, and PM exhaust emissions rates during the years 2035–2045 were, respectively 2.65, 2.08 and 1.83 times higher than the combined emissions rates for the initial 20 years period. The maximum values reached 126.379 tonnes/h (CO2), 126.369 kg/h (NOx) and 6.267 kg/h (PM) for the accumulated emissions rates of the year 2045, respectively accounting for 20.71, 13.36-, and 10.37-times higher values than the base year 2015.
It is noteworthy that the passenger car traffic remains problematic in the case study region. The energy consumption rate was highest for the car traffic accounting for 67.63% in the base year 2015 and 86.80% in the year 2045. Similarly, 73.01% of the total yearly exhaust CO2 emissions rate and 72.05% of the total yearly exhaust PM emissions rate from the entire traffic fleet were contributed by the passenger cars. The NOx emission rate for the “heavy trucks” category traffic is also a huge challenge as it constituted around 50.40% of the total NOx emission rate per year, as shown in Figure 7. The primary reason behind this observation is high NOx emissions from older diesel engines. Euro III and earlier heavy-duty diesel fuel engines are more prevalent as the Euro V and Euro VI standards have only recently been introduced in the United Arab Emirates. This may cause low emission trucks to being introduced much later into the vehicle fleet. However, it is argued here that a large-scale policy change is needed on the national level to mitigate this issue and initiate stricter emission regulations on diesel fuel and particularly heavy trucks. Conversely, at a micro level, some reduction in car traffic is needed to meet the energy consumption and exhaust pollutants decrement goals of the local authorities.

4.3. Projection of Car Traffic in Traffic Management Scenarios

The case study highway represents a key travel route connecting several outer suburbs to the inner-city and central business district areas and running parallel to the entire city. Hence, it is expected that it will also experience rapid growth in passenger car traffic along with rest of the country mirroring a steady population growth. Total passenger car traffic on the case study route is thus expected to increase from 57.589 million/year in 2015 to 330.763 million/year in 2045, accounting for an increase of 273.174 million cars in the BAU scenario (Figure 8).
This indicates that the highway will reach its operational capacity in a few years. After the introduction of a dedicated PT service and corresponding mode shift of private car passengers in favour of PT, the expected increase in passenger car population will be around 179.32 million (34.4% less), 151.38 million (44.6% less) and 136.13 million (50.2% less) vehicles for the bus, BRT and AV-BRT scenarios, respectively after 30 years. This progressive reduction in car traffic will undoubtedly result in an improvement in traffic flow factors of vehicle speed-time curves, less acceleration-deceleration, and braking. The last two are due to reduced queue delays and vehicle travel times. A combination of these will result in decreased energy consumption and exhaust emissions, as discussed in the following sections.

4.4. Projection of Flow Rate Factors in Traffic Management Scenarios

The microsimulation results for the 2015 and the subsequent years in the BAU-case supported the preliminary results from field measurements, showing that peak-hour traffic periods consistently experienced traffic congestion and lower vehicle speeds that resultantly cause frequent acceleration-deceleration and braking. The duration of the vehicle queues, average vehicle speed-time curves for the various years’ traffic volumes were recorded. The average weekly vehicle queue delays in all traffic management scenarios are presented in Figure 9. The results for year 2020 are used here as the earliest period in the studied highway’s lifecycle when the differences in flow rate factors between the different scenarios start becoming prominent. Additionally, these are calculated for the starting and end-counter on the mainline adjacent to HW3 counting station on the studied highway.
These results show a consistency with the traffic count results where the weekdays and peak working hours (6 am–7 am and 5 pm–7 pm) exhibited the highest queue delays at 189 s (at peak) and 152 s at the very least which was observed at 10:30 am on the first weekday, for the base case. After implementing PT bus service, the queue delays reduced by 27% (50 s) for the Monday 6 am–7 am peak, further reducing by 35% (66 s) in BRT case, and 46% (85 s) in the AV-BRT case. For the intermediate decline at 9 am, the queue delay difference between BAU and bus case was 25% (45 s), BRT by 34% (57 s), and AV-BRT by 45% (73 s). These trends were similar for the rest of the weekdays, while during weekend, the AV-BRT exhibited queue delays as 67 s (45%) for the 7 pm–8 pm evening peak.
Figure 10 shows the results for vehicle speed-time curves on studied road section for a representative week in year 2020 across all traffic management scenarios. It can be seen from this figure that the vehicle speeds initially increased at an average hourly rate of 0.2% per h in BAU case, after which it started to decline by 5.1% per h to hit the lowest at 48 km/h at 7 pm on Tuesday, 5 May 2020 following which it increased at an average hourly rate of 16% to reach the peak of average vehicle speed of 66 km/h on Friday 2 am, 8 May 2020. It should be noted here that these are average speeds that include both private cars and heavy vehicles that are regulated to drive at different speeds, yet these average values present a good estimate of the projected driving conditions. These speeds somewhat remained same until 3 pm on Saturday, 9 May 2020 when it started declining at an average rate of 0.7% as the week started.
These trends continued for the other traffic management scenarios, further confirming the queue delays results. The AV-BRT scenario showed the highest increase in average vehicle speeds, arguably due to shifting of more passengers to PT, a reduction of car traffic and congestions, and reduction in acceleration-deceleration and braking cycles that are often causal outcomes of congestions. For this AV-BRT case, the average vehicle speeds initially plateaued at 71 km/h, following which it started declining at an hourly rate of 2.3% to reach the bottom-limit of 64 km/h at 5 pm on Tuesday 5 May 2020. It then started increasing at the rate of 18% per h for the peak average vehicle speed of 83 km/h on Friday 2 am 8 May 2020. The BRT case was the second-best performing, followed by the bus case.
The results presented in Figure 11 show the average vehicle travel time results for the studied highway section that show cumulative effect of vehicle flow rate factors. The situation was worst for BAU case with an hourly increase of 51% where the peak average travel time was for the 6 pm–7 pm traffic at 430 s confirming the average speed results of ~48 km/h, after which the travel time started reducing. Nonetheless, it remained over 300 s during weekdays, while it exhibited a weekend peak of 319 s at 3 pm on Friday, 8 May 2020 and started reducing afterwards to remain over 220 s before sharply declining to 138 s at 5 am on Sunday 10 May 2020 for the BAU scenario. These trends were similar for the bus and BRT cases with a decline of 23% (98.8 s) and 37% (158.3 s), respectively for the 6 pm–7 pm peak hours.
For the off-peak hours of 10 pm–11 pm, this reduction in travel time was lower at 16% (29.7 s) for bus and 25% (47 s) for the BRT case during rest of the weekday. During weekend, this reduction was at 177.4 s for bus 186 s for BRT cases at the peak hours. The AV-BRT case exhibited a slightly different trend where the weekdays showed two different travel time inclination peaks at 2 pm–3 pm and second at 6 pm–7 pm. Similarly, the reduction in travel times were more prominent between the peak and off-peak hours showing a difference of 45% (112 s) between them. The reduction between BAU and AV-BRT for the 6 pm–7 pm peak was 48% (206.5 s) and 27% (50.2 s) during the 3 am–4 am off-peak period, for the weekdays.

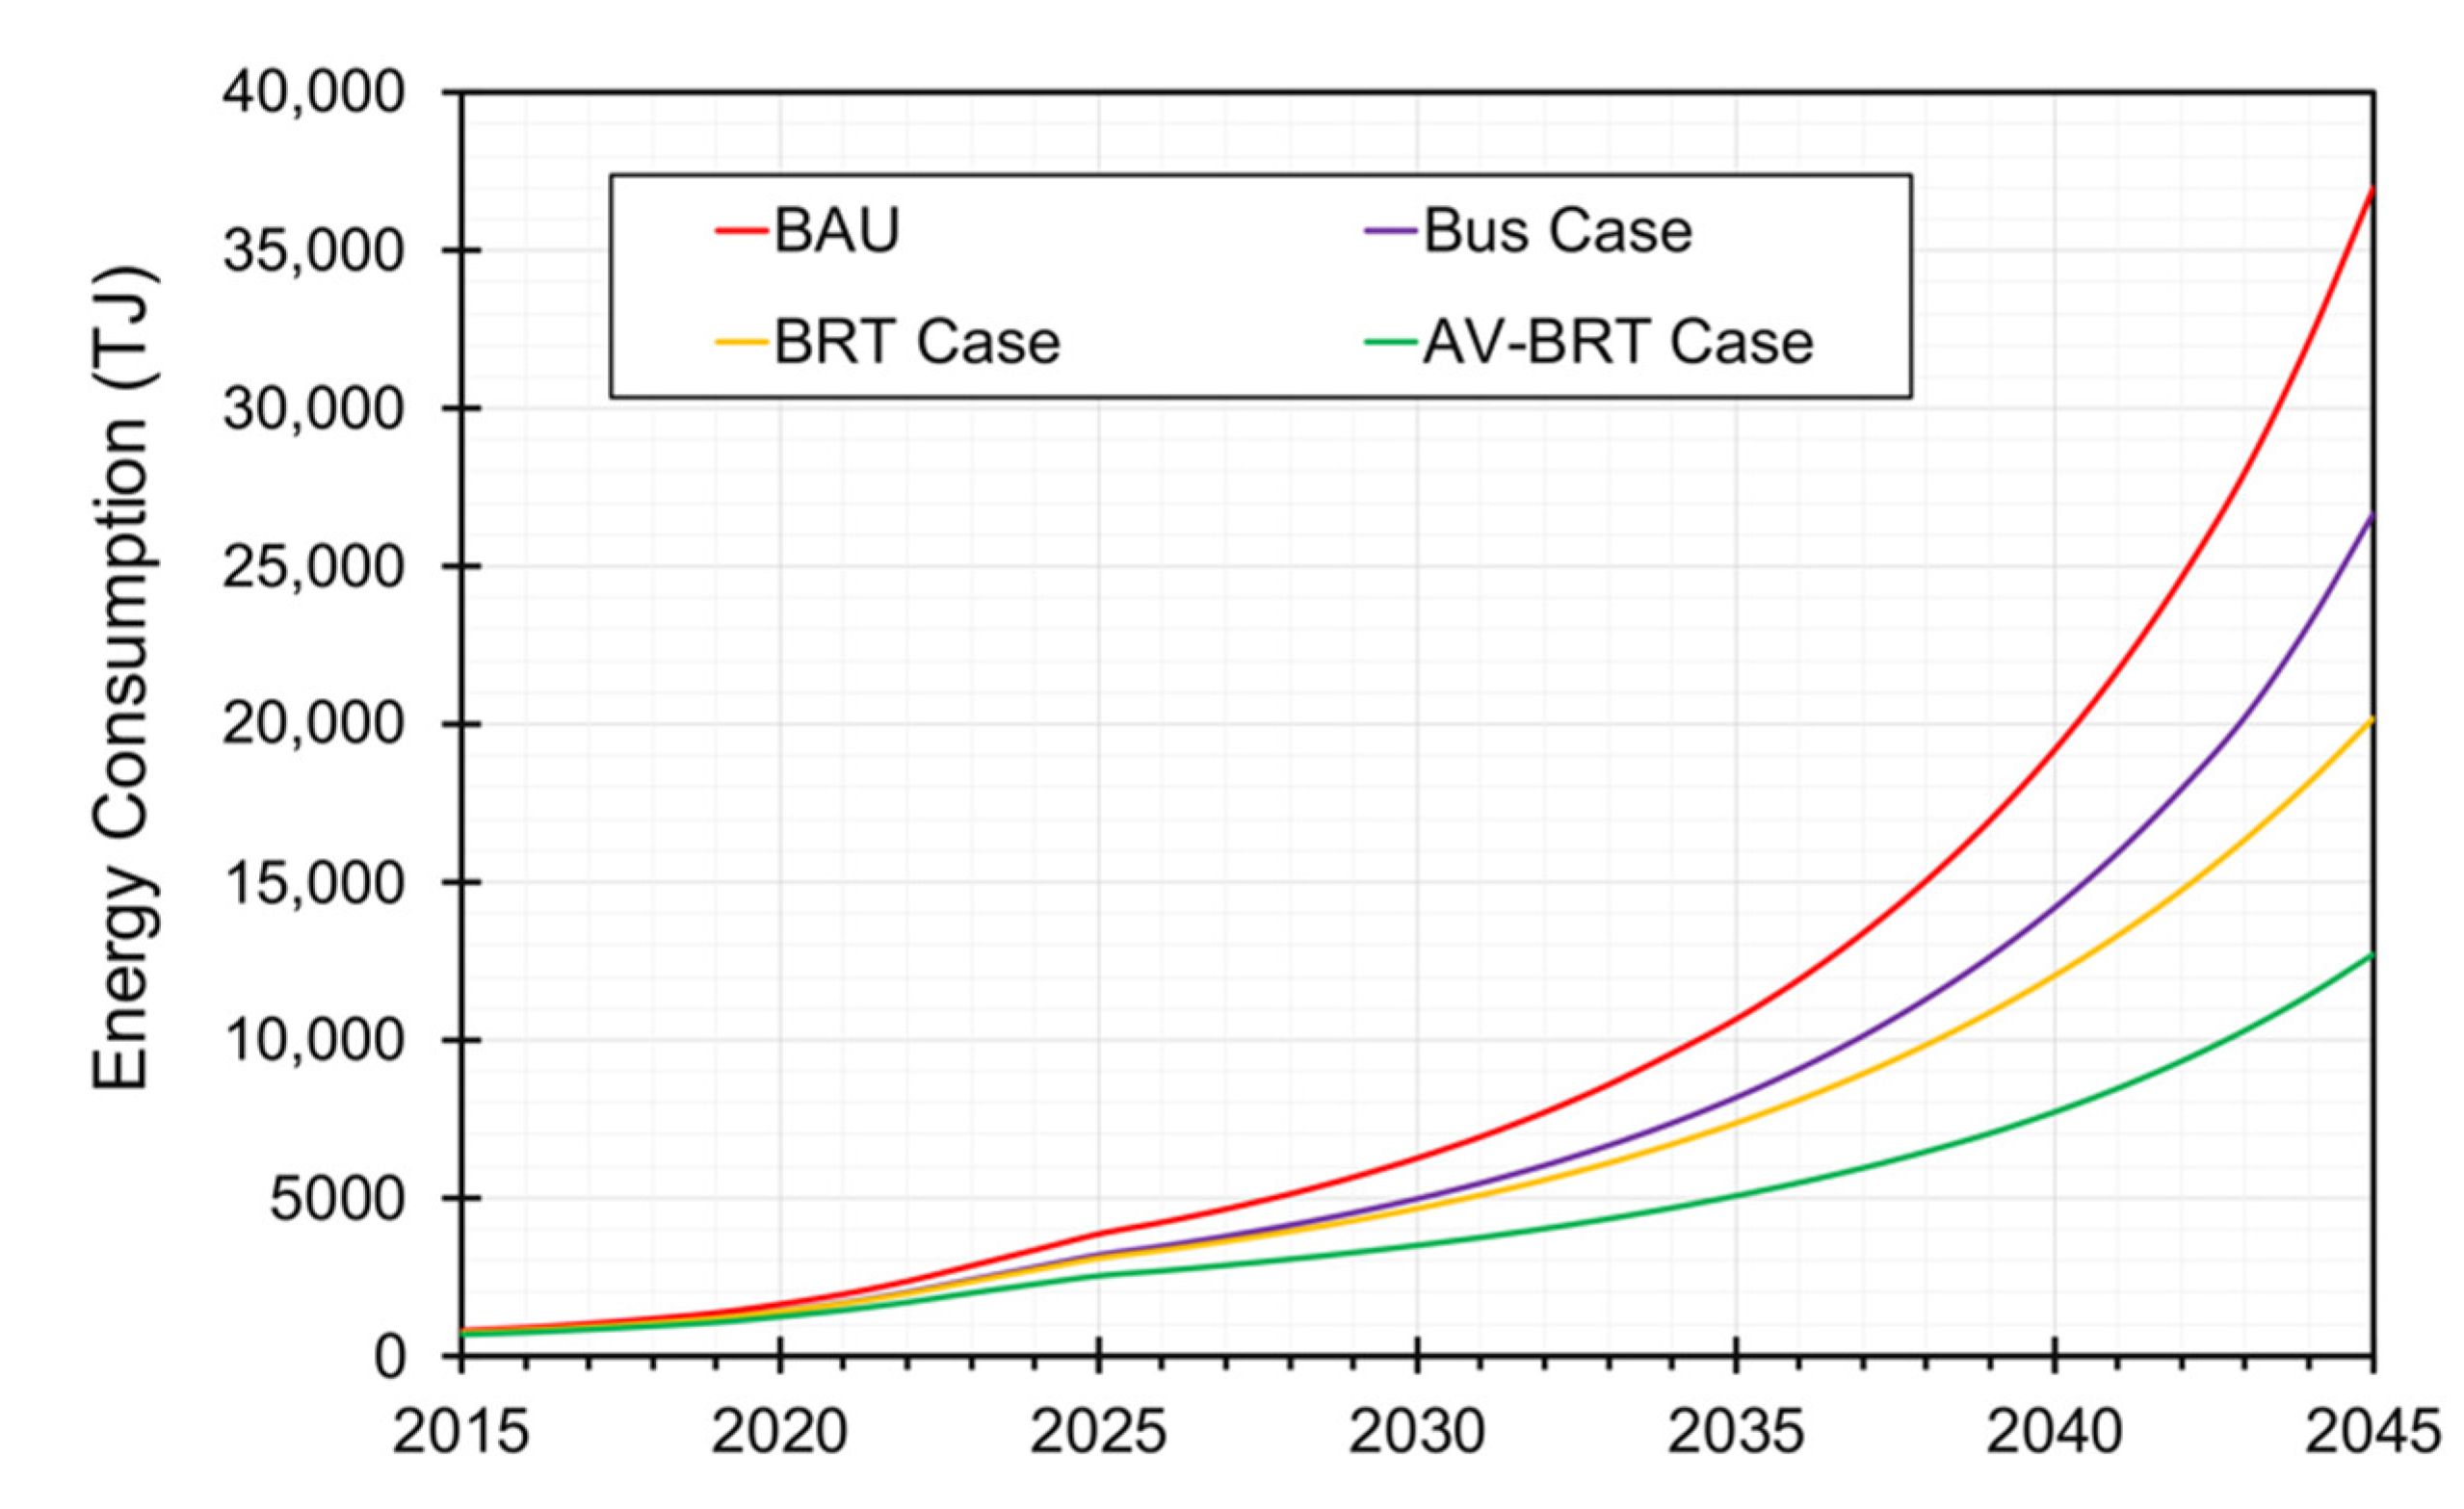
4.5. Energy Consumption

In general, a significant reduction in traffic energy consumption was observed that further reinforce the observation for the queue delays, vehicle speeds and travel times variables. Figure 12 shows accumulated energy consumption results for all vehicle types in all scenarios from the years 2015–2045. The energy consumption for the base year 2015 was estimated at 791.95 TJ which increased at an average yearly growth rate of approximately 14% to attain the year 2045 energy consumption value of 36,953.18 TJ after exhibiting an increase of 46.66 times, in the BAU scenario. As discussed earlier, this high energy consumption over the long-term was mainly caused by the passenger car traffic, and traffic modelling projected the significant energy conservation potential of public bus transport-based traffic management scenarios (Figure 12).
The maximum values reached in year 2045 for “Bus Case”, “BRT Case” and “AV-BRT Case” traffic scenarios were 26,685.73 TJ, 20,197.66 TJ and 12,723.84 TJ, respectively. These results show that the energy consumption reduced by 27.8%, 45.3%, and 65.6%, respectively for the three scenarios in the year 2045. Up to 12% of the accumulated vehicle fuel energy is consumed during this period of the total highway traffic lifecycle considered in this study. These results not only show the dominant role of passenger vehicles in the total energy consumption of the case study highway traffic but also the huge benefit of optimising PT according to the traffic demand.
Additionally, despite the mode shift in favour of PT, the private car is still assumed as the dominant transport mode accounting for around 53.97% share of the traffic on the case study highway section. It is also noteworthy that this study only assessed the impact of optimising BRT around peak traffic hours using fast, reliable, and interconnected autonomous buses that mainly provided the benefit of automated acceleration-deceleration driving, better vehicle platooning and smooth vehicle speed profile. The energy conservation benefits are therefore from lower fuel consumption, i.e., improved fuel economy, smoother traffic flow behaviour, and the high calorific value of CNG. However, the fuel energy consumption may be further reduced by using electric buses, provided the energy supply grid is adequately developed and not based on fossil fuels for production needs.

4.6. Exhaust CO2 Emissions

The exhaust CO2 emissions results are mainly generated from the petrol fuel consumed by passenger cars and diesel fuel from heavy vehicles. Out of all the exhaust emissions considered, CO2 emissions are the most environmentally significant due to higher global warming potential of CO2. The alternate traffic management scenarios assess CO2 emissions reduction through provision of hypothetical PT service. The accumulative CO2 exhaust emissions reduction potential of public bus service was estimated as 300.68 kilo-tonnes (27.2%) in “Bus Case” scenario compared to the BAU scenario for the year 2045 as shown in Figure 13.
Figure 13 also shows that BRT and AV-BRT scenarios yielded a higher reduction potential of 499.28 kilo-tonnes (45.2%) and 722.97 kilo-tonnes (65.4%), respectively, in the year 2045. Similar to the findings of Peng et al. [2], exhaust CO2 emissions trend from vehicles is comparable to the energy consumption trend from Figure 12 for the 2015–2045 period. On the other hand, the BAU CO2 emissions from year 2045 as estimated from microsimulation traffic modelling were 20.87 times higher than the 2015 base year. Exhaust CO2 emissions exhibited an average growth rate of approximately 11% which is significantly higher than the estimates of Ou et al. [91] and Peng et al. [2] based on macro level city-wide emissions; and micro level road emission case studies by Barandica et al. [92] and Santos et al. [93].

4.7. Exhaust NOx Emissions

The BAU scenario results for the year 2015 exhaust NOx emissions presented in Section 3.2 earlier showed that NOx emissions share of diesel fuel consumed by heavy trucks is significantly larger than other vehicle types. Figure 14 shows that over long-term, the NOx emissions increased at an average rate of 9.7% to attain the highest value of 1292.23 tonnes in the year 2045 which is 15.74 times higher than the base year NOx emissions of 82.1 tonnes, in the BAU scenario. For the NOx emission reduction potential of the alternate traffic management scenarios in the year 2045: the “Bus Case” exhibited 361.32 tonnes lower emissions (28%); the BRT scenario emissions were 604.48 tonnes (46.8%); and AV-BRT scenario emissions were 755.13 tonnes (58.4%) lower than BAU. These reductions are caused by the lower NOx emission potential of the CNG fuel used in bus vehicles and reduction in the total volume of petrol fuel combusted in passenger car engines due to the decline in car traffic. The decrement in NOx emissions may not only reduce acid rain potential but also influence the smog and PM formation in the densely populated areas surrounding the key E10 highway analysed in the current study.

4.8. Exhaust Particulate Matter (PM) Emissions

The PM emissions were calculated as 55.16 tonnes for the year 2045 in the BAU scenario (Figure 15), which increased at an average rate of 8.2% per year from the 5.24 tonnes PM emissions estimated for the base year 2015. A significant share of PM emissions was caused by diesel and petrol combustion engines of heavy trucks and passenger cars. The reduction potential of alternate traffic management scenarios in terms of exhaust PM emissions was not significantly realised until about the year 2020 with an average reduction rate of <5% during this period for the accumulative vehicle emissions.
Traffic modelling results showed significant reduction in subsequent years as the “Bus Case”, BRT and AV-BRT scenarios exhibited an average PM exhaust emissions reduction potential of 18.3%, 20.1%, and 23.8%, respectively for the 2021–2045 period, as shown in Figure 15. Exhaust PM emissions for year 2045 for these three PT scenarios were 42.76 tonnes, 41.08 tonnes and 34.48 tonnes. The difference between PM emission reduction benefits of “Bus Case” and BRT scenarios was comparatively lower than the AV-BRT scenario over the assessed 30-year period. This was due to the lower PM emission from the 100% CNG combustion engines used in AV-BRT scenario, compared to the higher (71%) share of diesel fuel engines in the “Bus Case” and BRT scenarios.

4.9. Long-Term Policy Implications

The total energy consumption and exhaust pollutants (CO2, NOx, and PM) emissions for the different traffic management scenarios assessed in this study are illustrated in Figure 16. The main causes of energy consumption and CO2 and PM exhaust emissions are the excessive reliance of (potential) passengers on private car transport, combusted petrol and diesel fuel, and the high emissions from the large number of older Euro III vehicles in the traffic fleet. The case study highway “E10” currently serves more than 9500 vehicles at peak hour in each direction, as counted for the base year 2015. Traffic growth and variations in the vehicle driving characteristics in the subsequent years are modelled in the current study using high-resolution microsimulation models. It was observed that large-scale traffic gridlocks will occur if no improvements are made to the transport network.
The fluctuating traffic flow acceleration-deceleration and higher operating duration of vehicle engines in traffic gridlocks are undoubtedly expected to increase the total fuel energy consumption of the studied traffic fleet. Figure 16 shows that total energy consumption of BAU scenario over the 30 years period from 2015–2045 is estimated to be primarily generated from the fuel consumption of small-size cars at 235.301 × 10³ TJ. It was followed by regular-size cars with 33.154 × 10³ TJ, heavy trucks at 28.646 × 10³ TJ, light trucks at 8.746 × 10³ TJ and minibus and coach at 4.741 × 10³ TJ due to engine fuel combustion. Petrol was noted as the most dominant fuel consumed by the passenger cars, followed by diesel and CNG and other alternate fuel types contributing the smallest share.
Exhaust CO2 and PM emissions from cars carry the highest share among the accumulative emissions of all vehicle types. In BAU scenario, 39.2% (3.733 × 10³ kilo-tonnes) of CO2 emissions are generated by small-size cars from 2015–2045. Regular-size cars contributed 33.8% (3.218 × 10³ kilo-tonnes), heavy trucks added 17.6% (1.679 × 10³ kilo-tonnes), light trucks generated 5% (0.478 × 10³ kilo-tonnes) and minibus and coaches only contributed 4.3% (0.412 × 10³ kilo-tonnes) to the accumulative CO2 emissions from the vehicle fleet on the studied highway section.
Figure 16 shows that 232.525 tonnes (40.7%) of the total PM emissions for the 30-year period in BAU scenario are from small-size cars. These are caused by; substantially large vehicle counts of small-size cars and the resulting higher travel distances compared to other vehicle types, higher primary and secondary organic aerosol emissions from the Euro V and Euro VI petrol cars after atmospheric aging [94]. The use of diesel particulate filters in modern diesel engines may also influence the comparative PM emissions rates among the studied vehicle types. Similarly, PM emissions from regular-size cars were estimated as 179.180 tonnes (31.4%), followed by diesel engine heavy trucks (17.9%) and minibus (6.6%) and light trucks (3.5%) due to the fuel type, fuel combustion technology and volumetric share in the total traffic count of the studied highway section.
Compared to other exhaust emission categories, heavy-duty diesel engines are recognised for higher NOx emissions than other vehicle engines [90]. Figure 16 shows that for the BAU scenario, approximately 50.4% (5.985 × 10³ tonnes) of the accumulative NOx emissions were generated by heavy trucks. Small-size cars contributed 19.8% (2.357 × 10³ tonnes) followed by regular-size cars with 15.3% (1.817 × 10³ tonnes). To effectively control the NOx emissions, further improvement policies regarding freight transport are needed which are outside the scope of the current study focused on passenger transport.
The development plans for Abu Dhabi city [95] are aimed at increasing the mode share of PT to 41% and reducing CO2 emissions by around 35% by adding tram lines, developing clean energy and expanding non-oil commercial sectors. However, the traffic management scenarios assessed in the current study require fewer changes in the existing infrastructure. Based on existing governmental reports and passenger survey conducted by Hasan et al. [75] for Abu Dhabi city, Figure 16 results show that with only 20% mode shift in favour of public bus transport modelled in the “Bus Case”, accumulative vehicle energy consumption from a representative highway section case study can be reduced by 76.396 × 10³ TJ (24.6%), exhaust CO2 emissions by 2.258 × 10³ kilo-tonnes (23.71%), exhaust NOx emissions by 3.409 × 10³ tonnes (28.71%) and exhaust PM emissions by 104.307 tonnes (18.25%) over 30 years period from 2015–2045. This scenario only considered replication of the existing city-wide mode share patterns on the studied highway. Moreover, the current public bus fleet composition is assumed with diesel fuel as the dominant fuel technology.
In the hypothetical BRT scenario for the 2015–2045 period, energy consumption reduced by 109.842 × 10³ TJ (35.37%), exhaust CO2 emissions by 3.3 × 10³ kilo-tonnes (34.66%), exhaust NOx emissions by 5.337×10³ tonnes (44.94%) and exhaust PM emissions by 114.986 tonnes (20.12%). Although the BRT scenario can achieve the energy consumption and exhaust emissions reduction aims of local policymakers, it still utilises diesel fuel for 71% of its energy needs. As the local transport department currently imports vehicles to support its public bus fleet and is also investing in converting diesel engines of many of its existing buses to CNG engines, a hypothetical AV-BRT scenario may match these energy consumption and exhaust pollutants reduction measures. It is a supply side measure, and as such may be easier to implement [2] with little investments and over a very short duration. Furthermore, AV-based PT systems have already been tested in many parts of the world. The results for the AV-BRT scenario show that with slight modification to the bus fleet, reliance on the already developing CNG fuel grid and bus service frequency variation according to peak/off-peak traffic demand; significant energy and pollutant reductions can be achieved.
Figure 16 shows that the energy consumption of AV-BRT was 173.16 × 10³ TJ (55.75%) lower than the BAU scenario over 30 years period. The CO2, NOx, and PM emissions were also significantly lower at 5.213 × 10³ kilo-tonnes (54.76%), 5.967 × 10³ tonnes (50.24%) and 140.931 × 10³ tonnes (24.66%), respectively, in the 2015–2045 period. Although all assessed scenarios were effective in reducing the energy consumption and exhaust pollutants, AV-BRT has been found as the most effective short-term measure. However, creation of secondary clean fuel energy resources for electric fuel and fuel technology improvements should also be assessed for their individual reduction potential.
This study contributes to the existing research by developing a theoretical foundation to analyse and compare the interrelated lifecycle impacts of traffic management policies on the road transport system. It also contributes by developing a detailed inventory data, which can be used by future researchers for predicting energy and emissions in/outflows. A wide majority of literature on the topic is focused on the road transport sector in the United States and Europe [47,96], where the transport system is already highly developed, the passenger mode share between cars and public transport is more balanced [97,98,99], and the vehicle inventories and analysis models and methodologies are also specific to these regions which cannot be generalised to other regions, particularly in the developing world where the over-reliance on cars and lack of systematic lifecycle analysis approach is affecting optimisation of traffic management strategies [100,101]. Although, the analysed benefits will be region-specific, as is the case with any lifecycle analysis study where the results are benchmarked against a base case, this does not affect the validity of microsimulation models to calculate high-resolution per vehicle environmental impacts.
The benefit of microsimulation models compared to the distance-based emission multiplication approach is that it can model the dynamic per second acceleration-deceleration due to queue formation, gradual introduction of better vehicle fuel technology (Euro I vs. later standard engines) vehicle units in the traffic fleet and the more accurate impact of PT and automation of PT techniques in reducing lifecycle impacts from road transport sector. These reductions can help the local municipal and transport authorities in meeting the long-term energy conservation and pollution-control, which can be also useful for meeting similar government-led environmental targets in other regions. The modelling approach, which extends microsimulation from a per h or peak hour road capacity analysis to a lifecycle analysis tool, estimation equations for calculating the projected reduction in car traffic by precisely calculating the number of road passengers (using average vehicle occupancy) and the baseline analysis results can be followed by any other study in other regions to estimate the impact of traffic management strategies. Such studies can utilise the approach from this study to monitor the effect on exhaust emissions and energy consumption to aid the policy-makers in justifying the cost–benefit of control strategies.

5. Conclusions

Private car dominance, population growth, and growing metropolitan areas are projected to result in high energy consumption and exhaust pollutants emissions from road traffic. The local transport policymakers in many cities are developing plans to encourage a shift from conventional cars to clean energy measures and upgrading the existing PT network with more bus vehicles, autonomous PRT vehicles, high-speed trams, and light rail. The methodological approach, relying on microsimulation models utilising high-resolution traffic flow data, presented here provides a detailed assessment of fuel energy and pollutant emissions under different traffic policy scenarios based on the lifecycle analysis approach.
Case study 30-year (2015–2045) lifecycle results for a major highway section serving large traffic volume (peak hour > 9500 vehicles/h, each direction) were analysed. By introducing a public bus transport line and slightly varying bus frequency based on traffic demand (as being considered by local transport authority), significant reduction in fuel energy consumption (35.37%) and exhaust pollutants emissions (>20.12%) can be achieved. Energy consumption rate in “Bus Case” can be cut by 1186.088 × 103 MJ/h (28.1%), CO2 emissions rate by 34.745 tonnes/h (27.5%), NOx by 34.109 kg/h (27%) and PM emissions rate by 1.595 kg/h (25.5%) in year 2045. Similarly, BRT scenario reduced year 2045 energy consumption, CO2, NOx, and PM emission rates by 1904.484 × 103 MJ/h (45.1%), 57.055 tonnes/h (45.1%), 56.343 kg/h (44.6%), and 1.608 kg/h (25.7%), respectively. AV-BRT scenario demonstrated the optimum results with nominal upgrades of existing bus fleet. The highest reduction was estimated for energy consumption as 55.75% (173.16 × 10³ TJ), followed by CO2 emissions as 54.76% (5.213 × 10³ kilo-tonnes), NOx emissions as 50.24% (5.967 × 10³ tonnes) and PM emissions as 24.66% (140.931 × 10³ tonnes) over the period from 2015–2045.
These reductions were mainly generated by reduced reliance (25–35%) on private cars and replacing diesel by CNG as the fuel source for PT buses. This diversion of users from cars to PT caused an improvement in traffic flow rate which was responsible for the reduction in exhaust emissions and energy consumption. For example, in year 2020, the introduction of buses reduced average weekly vehicle queue delays by 27%, travel times by 23%, and increased average vehicle speeds by 13%. After introducing a public BRT service, average weekly vehicle queue delays decreased by 35% and travel times by 37%, while average vehicle speeds increased by 29%. The AV-BRT service exhibited a decline of 46% in queue delays and 48% in travel times, while the average vehicle speeds increased by 26%.
A general relationship between vehicle counts or travel distances and energy consumption was also noted. Results also show that energy use and pollutants generation are not only directly correlated but also highly dependent upon private car ownership. Large-scale policy initiatives to reduce reliance on private cars such as reliable, high-speed, and optimised PT systems are required. Significant potential of traffic microsimulation models for road and traffic policies scenario analyses regarding long-term energy conservation and pollution-control was noted which may be useful for similar studies in other regions. The prototype methodology presented in this study exhibits the utility of microsimulation modelling for calculating the long-term energy consumption and emissions from traffic fleet and the benefit of alternate traffic management strategies such as autonomous buses within an urban setting. Although, there are some environmental footprint assessment models in literature for road traffic, these either use aggregated values to determine the overall impact of traffic management strategies that may not be accurate for comparative assessment or use region-specific models that are not generalizable for global application.
Nonetheless, there are some limitations of this methodology. The storage demand for the microsimulation models is quite significant as the models are being run which might be affect its application on low specification devices. However, the optimization options offered by the models may warrant a trade-off against computation power as it can be adequately run using medium range personal computers. Furthermore, the data used in this study is for different approaches on the same highway section and additional work is required to generalize the results for large scale application. The benefit in traffic flow-profile (indicative by the travel time and queue formation) in the microsimulation models are determined for the modelled area and may be higher or lower depending upon the traffic flow situations in another area. While this does not affect the modelling capabilities of the presented method to be transferrable to another area or the sustainability benefit of using autonomous buses for PT, it will still need calibration for local conditions as is true for any simulation study.
Another limiting aspect is the use of the historical growth model to predict the increase in traffic. Although, this does not prevent the study method to be used for comparison of traffic management strategies and its efficacy as a long-term emission measuring tool, it may be improved by using a land-use and socio-economic calculator for estimating a more realistic traffic growth trend as part of future work. The emission estimation tool presented in this study calculate the exhaust emissions to compare the benefit of autonomous public buses as emission abatement strategy, but future studies can build upon to also include non-exhaust emissions as part of the estimation.

Author Contributions

Conceptualization, methodology, software, validation, formal analysis, investigation, writing—original draft, writing—review and editing, visualization, U.H.; Supervision, project administration, funding acquisition, A.W.; Supervision, resources, data curation, writing—review and editing, visualization, project administration, H.A. All authors have read and agreed to the published version of the manuscript.

Funding

This research project is supported by an Australian Government Research Training Program (RTP) scholarship.

Institutional Review Board Statement

Not applicable.

Informed Consent Statement

Not applicable.

Data Availability Statement

Data is available from the authors upon request.

Acknowledgments

The authors also thank the Abu Dhabi Municipality for their support and assistance in data collection.

Conflicts of Interest

The authors declare no conflict of interest.

References

  1. McCollum, D.; Yang, C. Achieving deep reductions in US transport greenhouse gas emissions: Scenario analysis and policy implications. Energy Policy 2009, 37, 5580–5596. [Google Scholar] [CrossRef]
  2. Peng, B.; Du, H.; Ma, S.; Fan, Y.; Broadstock, D.C. Urban passenger transport energy saving and emission reduction potential: A case study for Tianjin, China. Energy Convers. Manag. 2015, 102, 4–16. [Google Scholar] [CrossRef]
  3. Hasan, U.; Whyte, A.; Al-Jassmi, H. A life-cycle decision-making framework to assess the need for autonomous mobility. Transp. Res. Procedia 2019, 42, 32–43. [Google Scholar] [CrossRef]
  4. IPCC. Climate Change 2007: The Physical Science Basis—Contribution of Working Group I, II and III to the Fourth Assessment Report of the IPCC; Core Writing Team, Pachauri, R.K., Reisinger, A., Eds.; Intergovernmental Panel on Climate Change: Geneva, Switzerland, 2008; p. 104. [Google Scholar]
  5. Abe, R. Introducing autonomous buses and taxis: Quantifying the potential benefits in Japanese transportation systems. Transp. Res. Part A Policy Pract. 2019, 126, 94–113. [Google Scholar] [CrossRef]
  6. International Transport Forum. Urban Mobility System Upgrade—How Shared Self-Driving Cars Could Change City Traffic; OECD Corporate Partnership Board: Paris, France, 2015; p. 34. [Google Scholar]
  7. Howard, D.; Dai, D. Public perceptions of self-driving cars: The case of Berkeley, California. In Proceedings of the Transportation Research Board 93rd Annual Meeting, Washington, DC, USA, 12–16 January 2014. [Google Scholar]
  8. Hasan, U. Development of a Multi-Criteria Decision-Making Framework for Sustainable Road Transport Systems: Integrating Stakeholder-Cost-Environment-Energy Lifecycle Impacts. Ph.D. Thesis, Curtin University, Perth, WA, Australia, 2019. [Google Scholar]
  9. Hasan, U.; Whyte, A.; Al Jassmi, H. Framework for delivering an AV-based mass mobility solution: Integrating government-consumer actors and life-cycle analysis of transportation systems. In Proceedings of the 46th European Transport Conference, Dublin, Ireland, 10–12 October 2018; p. 18. [Google Scholar]
  10. Thomopoulos, N.; Givoni, M. The autonomous car—A blessing or a curse for the future of low carbon mobility? An exploration of likely vs. desirable outcomes. Eur. J. Futur. Res. 2015, 3, 14. [Google Scholar] [CrossRef] [Green Version]
  11. Alessandrini, A.; Mercier-Handisyde, P. CityMobil 2 Experience and Recommendations; POLIS: Brussels, Belgium, 2016; p. 52. [Google Scholar]
  12. Song, G.; Yu, L.; Zhang, Y. Applicability of Traffic Microsimulation Models in Vehicle Emissions Estimates: Case Study of VISSIM. Transp. Res. Rec. 2012, 2270, 132–141. [Google Scholar] [CrossRef] [Green Version]
  13. Vuong, X.-C.; Mou, R.-F.; Nguyen, H.-S.; Vu, T.-T. Signal timing optimization of isolated intersection for mixed traffic flow in Hanoi city of Vietnam using VISSIM. In Proceedings of the International Conference on Smart Vehicular Technology, Transportation, Communication and Applications, Mount Emei, China, 25–28 October 2018; pp. 133–139. [Google Scholar]
  14. Leyn, U.; Vortisch, P. Calibrating VISSIM for the German highway capacity manual. Transp. Res. Rec. 2015, 2483, 74–79. [Google Scholar] [CrossRef]
  15. Guo, Y.; Sayed, T.; Zheng, L.; Essa, M. An extreme value theory based approach for calibration of microsimulation models for safety analysis. Simul. Model. Pract. Theory 2021, 106, 102172. [Google Scholar] [CrossRef]
  16. Oikonomou, M.G.; Orfanou, F.P.; Vlahogianni, E.I.; Yannis, G. Impacts of autonomous shuttle services on traffic, safety and environment for future mobility scenarios. In Proceedings of the IEEE 23rd International Conference on Intelligent Transportation Systems (ITSC), Rhodes, Greece, 20–23 September 2020; pp. 1–6. [Google Scholar]
  17. Hasan, U.; Whyte, A.; Al Jassmi, H. A Review of the Transformation of Road Transport Systems: Are We Ready for the Next Step in Artificially Intelligent Sustainable Transport? Appl. Syst. Innov. 2020, 3, 1. [Google Scholar] [CrossRef] [Green Version]
  18. Deveci, M.; Pamucar, D.; Gokasar, I.; Pedrycz, W.; Wen, X. Autonomous bus operation alternatives in urban areas using fuzzy Dombi-Bonferroni operator based decision making model. IEEE Trans. Intell. Transp. Syst. 2022, 1–10. [Google Scholar] [CrossRef]
  19. DoT Abu Dhabi. Surface Transport Master Plan—A Vision for Connecting Abu Dhabi; Department of Transport: Abu Dhabi, United Arab Emirates, 2009; p. 171.
  20. Andersen, O.; Jensen, C.S.; Torp, K.; Yang, B. EcoTour: Reducing the environmental footprint of vehicles using eco-routes. In Proceedings of the IEEE 14th International Conference on Mobile Data Management (MDM), Milan, Italy, 3–6 June 2013; pp. 338–340. [Google Scholar]
  21. Hasan, A.; Hasan, U.; Whyte, A.; Al Jassmi, H. Lifecycle analysis of recycled asphalt pavements: Case study scenario analyses of an urban highway section. CivilEng 2022, 3, 242–262. [Google Scholar] [CrossRef]
  22. Hasan, U.; Whyte, A.; Al Jassmi, H.; Hasan, A. Lifecycle cost analysis of recycled asphalt pavements: Determining cost of recycled materials for an urban highway section. CivilEng 2022, 3, 316–331. [Google Scholar] [CrossRef]
  23. Bureau of Infrastructure. Greenhouse Gas Emissions from Australian Transport: Projections to 2020; Department of Infrastructure, Transport, Regional Development and Local Government: Canberra, ACT, Australia, 2009; p. 169.
  24. Mikhail, C.; Stephanie, P.; Zoe, E.; William, E.; Juan, M. Infrastructure and automobile shifts: Positioning transit to reduce life-cycle environmental impacts for urban sustainability goals. Environ. Res. Lett. 2013, 8, 015041. [Google Scholar]
  25. McKenzie, E.C.; Durango-Cohen, P.L. Environmental life-cycle assessment of transit buses with alternative fuel technology. Transp. Res. Part D Transp. Environ. 2012, 17, 39–47. [Google Scholar] [CrossRef]
  26. Fagnant, D.J.; Kockelman, K. Preparing a nation for autonomous vehicles: Opportunities, barriers and policy recommendations. Transp. Res. Part A Policy Pract. 2015, 77, 167–181. [Google Scholar] [CrossRef]
  27. Conlon, J.; Lin, J. Greenhouse gas emission impact of autonomous vehicle introduction in an urban network. Transp. Res. Rec. 2019, 2673, 142–152. [Google Scholar] [CrossRef]
  28. Greenblatt, J.B.; Shaheen, S. Automated Vehicles, On-Demand Mobility, and Environmental Impacts. Curr. Sustain. Renew. Energy Rep. 2015, 2, 74–81. [Google Scholar] [CrossRef] [Green Version]
  29. Krueger, R.; Rashidi, T.H.; Rose, J.M. Preferences for shared autonomous vehicles. Transp. Res. Part C Emerg. Technol. 2016, 69, 343–355. [Google Scholar] [CrossRef]
  30. Currie, G. Lies, damned lies, AVs, shared mobility, and urban transit futures. J. Public Transp. 2018, 21, 19–30. [Google Scholar] [CrossRef]
  31. Barth, M.; Davis, N.; Lents, J.; Nikkila, N. Vehicle Activity Patterns and Emissions in Pune, India. Transp. Res. Rec. 2007, 2038, 156–166. [Google Scholar] [CrossRef]
  32. Briggs, I.; Murtagh, M.; Kee, R.; McCulloug, G.; Douglas, R. Sustainable non-automotive vehicles: The simulation challenges. Renew. Sustain. Energy Rev. 2017, 68, 840–851. [Google Scholar] [CrossRef]
  33. Lajunen, A.; Lipman, T. Lifecycle cost assessment and carbon dioxide emissions of diesel, natural gas, hybrid electric, fuel cell hybrid and electric transit buses. Energy 2016, 106, 329–342. [Google Scholar] [CrossRef]
  34. Ali, M.; Kamal, M.D.; Tahir, A.; Atif, S. Fuel consumption monitoring through COPERT model—A case study for urban sustainability. Sustainability 2021, 13, 11614. [Google Scholar] [CrossRef]
  35. Lyu, P.; Wang, P.; Liu, Y.; Wang, Y. Review of the studies on emission evaluation approaches for operating vehicles. J. Traffic Transp. Eng. 2021, 8, 493–509. [Google Scholar] [CrossRef]
  36. Smit, R.; Ntziachristos, L. COPERT Australia: A new software to estimate vehicle emissions in Australia. In Proceedings of the Australasian Transport Research Forum, Brisbane, QL, Australia, 2–4 October 2013; pp. 1–11. [Google Scholar]
  37. Varga, B.; Tettamanti, T.; Kulcsár, B. Energy-aware predictive control for electrified bus networks. Appl. Energy 2019, 252, 113477. [Google Scholar] [CrossRef] [Green Version]
  38. Yulianto, B. Traffic management and engineering analysis of the Manahan flyover area by using traffic micro-simulation VISSIM. IOP Conf. Ser. Mater. Sci. Eng. 2020, 852, 012005. [Google Scholar] [CrossRef]
  39. Madushanka, P.H.S.; Jayaratne, D.N.D.; Pasindu, H.R. Study of the impact roadside parking has on traffic flow characteristics—A VISSIM simulation based approach. In Proceedings of the 2020 Moratuwa Engineering Research Conference (MERCon), Moratuwa, Sri Lanka, 28–30 July 2020; pp. 419–424. [Google Scholar]
  40. Ziemska-Osuch, M.; Osuch, D. Modeling the assessment of intersections with traffic lights and the significance level of the number of pedestrians in microsimulation models based on the PTV Vissim tool. Sustainability 2022, 14, 8945. [Google Scholar] [CrossRef]
  41. Bandi, M.M.; George, V. Microsimulation modelling in VISSIM on short-term and long-term improvements for Mangalore City road network. Transp. Res. Procedia 2020, 48, 2725–2743. [Google Scholar] [CrossRef]
  42. Chen, K.; Yu, L. Microscopic Traffic-Emission Simulation and Case Study for Evaluation of Traffic Control Strategies. J. Transp. Syst. Eng. Inf. Technol. 2007, 7, 93–99. [Google Scholar] [CrossRef]
  43. Manjunatha, P.; Roy, S.; Elefteriadou, L.; Guin, A.; Hunter, M. Evaluation of the operational effects of autonomous and connected vehicles through microsimulation. Transp. Res. Rec. 2022, 03611981211068460. [Google Scholar] [CrossRef]
  44. Gruyer, D.; Orfila, O.; Glaser, S.; Hedhli, A.; Hautière, N.; Rakotonirainy, A. Are connected and automated vehicles the silver bullet for future transportation challenges? Benefits and weaknesses on safety, consumption, and traffic congestion. Front. Sustain. Cities 2021, 2, 607054. [Google Scholar] [CrossRef]
  45. Song, Z.; Wang, H.; Sun, J.; Tian, Y. Experimental findings with VISSIM and TransModeler for evaluating environmental and safety impacts using micro-simulations. Transp. Res. Rec. 2020, 2674, 566–580. [Google Scholar] [CrossRef]
  46. Quaassdorff, C.; Borge, R.; Pérez, J.; Lumbreras, J.; De la Paz, D.; De Andrés, J.M. Microscale traffic simulation and emission estimation in a heavily trafficked roundabout in Madrid (Spain). Sci. Total Environ. 2016, 566, 416–427. [Google Scholar] [CrossRef] [PubMed]
  47. Hasan, U.; Whyte, A.; Al Jassmi, H. Critical review and methodological issues in integrated life-cycle analysis on road networks. J. Clean. Prod. 2019, 206, 541–558. [Google Scholar] [CrossRef]
  48. Hasan, U.; Whyte, A.; Al Jassmi, H. Life cycle assessment of roadworks in United Arab Emirates: Recycled construction waste, reclaimed asphalt pavement, warm-mix asphalt and blast furnace slag use against traditional approach. J. Clean. Prod. 2019, 257, 120531. [Google Scholar] [CrossRef]
  49. Hasan, U.; Chegenizadeh, A.; Budihardjo, M.A.; Nikraz, H. Experimental evaluation of construction waste and ground granulated blast furnace slag as alternative soil stabilisers. Geotech. Geol. Eng. 2016, 34, 1707–1722. [Google Scholar] [CrossRef]
  50. Khamis, J. Cycling culture growing in the UAE: Rent-a-bike services introduced in Abu Dhabi, Dubai and Sharjah. Gulf News, 2014. [Google Scholar]
  51. Aljoufie, M. Examining the Challenges of Bicycle Use in Jeddah City. Procedia Environ. Sci. 2017, 37, 269–281. [Google Scholar] [CrossRef]
  52. Kazim, A. Introduction of PEM fuel-cell vehicles in the transportation sector of the United Arab Emirates. Appl. Energy 2003, 74, 125–133. [Google Scholar] [CrossRef]
  53. Chinery, L.E. Modeling transportation in Abu Dhabi: A 25-year projection of emissions under alternative scenarios of the passenger vehicle fleet. Master’s Thesis, University of North Carolina at Chapel Hill, Chapel Hill, NC, USA, 2010. [Google Scholar]
  54. Raeside, J. Middle East Emissions Legislation. Available online: https://www.integer-research.com/industry-insight/emissions-legislation/middle-east/ (accessed on 9 June 2019).
  55. Ahmed, S. Dubai to have Euro 4 emission norms soon. Khaleej Times 2011. [Google Scholar]
  56. GSO 02/01/CD/Update for No. 42:2003 2014; General Requirements-Motor Vehicles. GSO: New York, NY, USA, 2014; p. 55.
  57. Romilly, P. Substitution of bus for car travel in urban Britain: An economic evaluation of bus and car exhaust emission and other costs. Transp. Res. Part D Transp. Environ. 1999, 4, 109–125. [Google Scholar] [CrossRef]
  58. Simons, A. Road transport: New life cycle inventories for fossil-fuelled passenger cars and non-exhaust emissions in ecoinvent v3. Int. J. Life Cycle Assess. 2016, 21, 1299–1313. [Google Scholar] [CrossRef]
  59. DIRDC. Australian Green Vehicle Guide; Government of Australia: Canberra, ACT, Australia, 2019.
  60. ABS. Catalog #9208.0: Survey of Motor Vehicle Use; Government of Australia: Canberra, ACT, Australia, 2019.
  61. Zanni, A.M.; Bristow, A.L. Emissions of CO2 from road freight transport in London: Trends and policies for long run reductions. Energy Policy 2010, 38, 1774–1786. [Google Scholar] [CrossRef]
  62. Wang, A.; Ge, Y.; Tan, J.; Fu, M.; Shah, A.N.; Ding, Y.; Zhao, H.; Liang, B. On-road pollutant emission and fuel consumption characteristics of buses in Beijing. J. Environ. Sci. 2011, 23, 419–426. [Google Scholar] [CrossRef]
  63. Kuschel, G.; Cooper, A.; Metcalfe, J. Evaluating Bus Emissions: What colour, how big and how much is that elephant in the window? In Proceedings of the 39th Australasian Transport Research Forum (ATRF), Auckland, New Zealand, 27–29 November 2017; p. 18. [Google Scholar]
  64. Nanaki, E.A.; Koroneos, C.J.; Roset, J.; Susca, T.; Christensen, T.H.; De Gregorio Hurtado, S.; Rybka, A.; Kopitovic, J.; Heidrich, O.; López-Jiménez, P.A. Environmental assessment of 9 European public bus transportation systems. Sustain. Cities Soc. 2017, 28, 42–52. [Google Scholar] [CrossRef]
  65. Davis, S.C.; Diegel, S.W.; Boundy, R.G. Transportation Energy Data Book, 27th ed.; Oak Ridge National Laboratory, U.S. Department of Energy: Oak Ridge, TN, USA, 2008; p. 359.
  66. Sgouridis, S.; Helmers, E.; Al Hadhrami, M. Light-duty electric vehicles in the gulf? Techno-economic assessment and policy implications. Int. J. Sustain. Transp. 2018, 12, 92–106. [Google Scholar] [CrossRef]
  67. Sgouridis, S.; Abdullah, A.; Griffiths, S.; Saygin, D.; Wagner, N.; Gielen, D.; Reinisch, H.; McQueen, D. RE-mapping the UAE’s energy transition: An economy-wide assessment of renewable energy options and their policy implications. Renew. Sustain. Energy Rev. 2016, 55, 1166–1180. [Google Scholar] [CrossRef]
  68. Fox, T. Monthly Insights 19 October 2016; Emirates NBD Research: Dubai, United Arab Emirates, 2016; p. 32. [Google Scholar]
  69. AbuHijleh, B.; Nik, A. Economic and Environmental Benefits of Using Hybrid Taxies in Dubai-UAE. In Proceedings of the SB13 Dubai: Advancing the Green Agenda Technology, Practices and Policies, Dubai, United Arab Emirates, 9–11 December 2013; pp. 1–10. [Google Scholar]
  70. Mott MacDonald; Steer Davies Gleave. Working Paper No 5a Results of Surveys Carried out for Enhanced Model; Department of Transport of Abu Dhabi: Abu Dhabi, United Arab Emirates, 2008; p. 49.
  71. Staff Report. 5.2 Years: Average Age of Cars in UAE. Emirates. 2015. Available online: https://www.emirates247.com/news/emirates/5-2-years-average-age-of-cars-in-uae-2015-08-15-1.600360 (accessed on 22 November 2022).
  72. EYGM Limited. Mega Trends Shaping the Middle East Light Vehicle Market; EYGM Limited: Abu Dhabi, United Arab Emirates, 2012; p. 4. [Google Scholar]
  73. Wu, I.; Pojani, D. Obstacles to the creation of successful bus rapid transit systems: The case of Bangkok. Res. Transp. Econ. 2016, 60, 44–53. [Google Scholar] [CrossRef]
  74. Hasan, U.; Whyte, A.; Al Jassmi, H. Public bus transport service satisfaction: Understanding its value to urban passengers towards improved uptake. Trans. Transp. Sci. 2021, 12, 25–37. [Google Scholar] [CrossRef]
  75. Hasan, U.; Whyte, A.; Al Jassmi, H. Life-cycle asset management in residential developments building on transport system critical attributes via a data-mining algorithm. Buildings 2018, 9, 1. [Google Scholar] [CrossRef] [Green Version]
  76. Treyer, K.; Bauer, C. The environmental footprint of UAE׳s electricity sector: Combining life cycle assessment and scenario modeling. Renew. Sustain. Energy Rev. 2016, 55, 1234–1247. [Google Scholar] [CrossRef]
  77. Giarratana, C. Will Autonomous Cars Be Powered by Gas Battery or Hybrid Energy. Available online: https://www.trafficsafetystore.com/blog/will-autonomous-cars-be-powered-by-gas-battery-or-hybrid-energy/ (accessed on 8 July 2019).
  78. Bloomberg, L.; Dale, J. Comparison of VISSIM and CORSIM Traffic Simulation Models on a Congested Network. Transp. Res. Rec. 2000, 1727, 52–60. [Google Scholar] [CrossRef]
  79. Fellendorf, M.; Vortisch, P. Microscopic Traffic Flow Simulator VISSIM. In Fundamentals of Traffic Simulation; Barceló, J., Ed.; Springer: New York, NY, USA, 2010; pp. 63–93. [Google Scholar]
  80. Smit, R.; Smokers, R.; Rabé, E. A new modelling approach for road traffic emissions: VERSIT+. Transp. Res. Part D Transp. Environ. 2007, 12, 414–422. [Google Scholar] [CrossRef]
  81. De Coensel, B.; Can, A.; Degraeuwe, B.; De Vlieger, I.; Botteldooren, D. Effects of traffic signal coordination on noise and air pollutant emissions. Environ. Model. Softw. 2012, 35, 74–83. [Google Scholar] [CrossRef] [Green Version]
  82. Margreiter, M.; Krause, S.; Twaddle, H.; Lüßmann, J. Evaluation of Environmental Impacts of Adaptive Network Signal Controls Based on Real Vehicle Trajectories. Transp. Res. Procedia 2014, 4, 421–430. [Google Scholar] [CrossRef]
  83. PTV AG. VISSIM User Manual V11; Planung Transport Verkehr Group: Karlsruhe, Germany, 2018; p. 1219. [Google Scholar]
  84. Wiedemann, R. Simulation des Strassenverkehrsflusses; Institute fur Verkehrswesen: Karlsruhe, Germany, 1974; p. 95. [Google Scholar]
  85. Higgs, B.; Abbas, M.; Medina, A. Analysis of the Wiedemann car following model over different speeds using naturalistic data. In Proceedings of the 3rd International Conference on Road Safety and Simulation, Indianapolis, IN, USA, 14–16 September 2011; pp. 1–22. [Google Scholar]
  86. Balakrishna, R.; Antoniou, C.; Ben-Akiva, M.; Koutsopoulos, H.N.; Wen, Y. Calibration of microscopic traffic simulation models: Methods and application. Transp. Res. Rec. 2007, 1999, 198–207. [Google Scholar] [CrossRef]
  87. Ligterink, N.; Van Baalen, J.; Eijk, A.; Mak, W.; Broeders, W.; Vortisch, P. Predicting local vehicle emissions using VERSIT+ and VISSIM. In Proceedings of the 7th European Congress and Exhibition on the Intelligent Transport Systems and Services, Geneva, Switzerland, 4–6 June 2008. [Google Scholar]
  88. Linton, C.; Grant-Muller, S.; Gale, W.F. Approaches and Techniques for Modelling CO2 Emissions from Road Transport. Transp. Rev. 2015, 35, 533–553. [Google Scholar] [CrossRef]
  89. Bohm, F.; Häger, K. Introduction of Autonomous Vehicles in the Swedish Traffic System: Effects and Changes Due to the New Self-Driving Car Technology; Uppsala University: Uppsala, Sweden, 2015. [Google Scholar]
  90. Gao, J.; Chen, H.; Li, Y.; Chen, J.; Zhang, Y.; Dave, K.; Huang, Y. Fuel consumption and exhaust emissions of diesel vehicles in worldwide harmonized light vehicles test cycles and their sensitivities to eco-driving factors. Energy Convers. Manag. 2019, 196, 605–613. [Google Scholar] [CrossRef]
  91. Ou, X.; Zhang, X.; Chang, S. Scenario analysis on alternative fuel/vehicle for China’s future road transport: Life-cycle energy demand and GHG emissions. Energy Policy 2010, 38, 3943–3956. [Google Scholar] [CrossRef]
  92. Barandica, J.M.; Fernández-Sánchez, G.; Berzosa, Á.; Delgado, J.A.; Acosta, F.J. Applying life cycle thinking to reduce greenhouse gas emissions from road projects. J. Clean. Prod. 2013, 57, 79–91. [Google Scholar] [CrossRef]
  93. Santos, J.; Ferreira, A.; Flintsch, G. A life cycle assessment model for pavement management: Road pavement construction and management in Portugal. Int. J. Pavement Eng. 2015, 16, 315–336. [Google Scholar] [CrossRef]
  94. Platt, S.M.; El Haddad, I.; Pieber, S.M.; Zardini, A.A.; Suarez-Bertoa, R.; Clairotte, M.; Daellenbach, K.R.; Huang, R.J.; Slowik, J.G.; Hellebust, S.; et al. Gasoline cars produce more carbonaceous particulate matter than modern filter-equipped diesel cars. Sci. Rep. 2017, 7, 4926. [Google Scholar] [CrossRef] [PubMed] [Green Version]
  95. MOCCAE. National Climate Change Plan of the United Arab Emirates 2017–2050; Ministry of Climate Change & Environment: Dubai, United Arab Emiates, 2017; p. 63. [Google Scholar]
  96. Yue, M.; Jemei, S.; Gouriveau, R.; Zerhouni, N. Review on health-conscious energy management strategies for fuel cell hybrid electric vehicles: Degradation models and strategies. Int. J. Hydrog. Energy 2019, 44, 6844–6861. [Google Scholar] [CrossRef]
  97. Buehler, R.; Pucher, J.; Gerike, R.; Götschi, T. Reducing car dependence in the heart of Europe: Lessons from Germany, Austria, and Switzerland. Transp. Rev. 2017, 37, 4–28. [Google Scholar] [CrossRef]
  98. Patterson, R.; Webb, E.; Millett, C.; Laverty, A. Physical activity accrued as part of public transport use in England. J. Public Health 2019, 41, 222–230. [Google Scholar] [CrossRef] [PubMed]
  99. Sharif, A.; Shahbaz, M.; Hille, E. The transportation-growth nexus in USA: Fresh insights from pre-post global crisis period. Transp. Res. Part A Policy Pract. 2019, 121, 108–121. [Google Scholar] [CrossRef]
  100. Perugu, H. Emission modelling of light-duty vehicles in India using the revamped VSP-based MOVES model: The case study of Hyderabad. Transp. Res. Part D Transp. Environ. 2019, 68, 150–163. [Google Scholar] [CrossRef]
  101. Bonsu, N.O. Towards a circular and low-carbon economy: Insights from the transitioning to electric vehicles and net zero economy. J. Clean. Prod. 2020, 256, 120659. [Google Scholar] [CrossRef]
Figure 1. Case study section of E10 highway and traffic count station locations.
Sustainability 14 15657 g001
Figure 2. Field vs. modelled traffic flow profile for model run with default VISSIM driving behaviour settings.
Sustainability 14 15657 g002
Figure 3. Field vs. modelled traffic flow profile for model run with calibrated VISSIM driving behaviour settings.
Sustainability 14 15657 g003
Figure 4. Field vs. modelled traffic flow profile for model run using 2nd week (base year 2015) traffic data and calibrated VISSIM driving behaviour settings.
Sustainability 14 15657 g004
Figure 5. Current weekly traffic on E10 highway section by vehicle type (BAU, year 2015).
Sustainability 14 15657 g005
Figure 6. Total energy consumption and CO2, NOx, and PM emissions by vehicle type for the base year 2015 in BAU scenario.
Sustainability 14 15657 g006
Figure 7. (a) Energy consumption and (b) CO2, (c) NOx, and (d) PM exhaust emissions rates by vehicle types in the business-as-usual (BAU) scenario, years 2015–2045.
Sustainability 14 15657 g007
Figure 8. Long-term projection of passenger car traffic from 2015–2045.
Sustainability 14 15657 g008
Figure 9. Average weekly vehicle queue delays in all traffic management scenarios for year 2020.
Sustainability 14 15657 g009
Figure 10. Vehicle speed-time curves in all traffic management scenarios for year 2020.
Sustainability 14 15657 g010
Figure 11. Average weekly vehicle travel times in all traffic management scenarios for year 2020.
Sustainability 14 15657 g011
Figure 12. Total energy consumption trends in all traffic scenarios, years 2015–2045.
Sustainability 14 15657 g012
Figure 13. Total exhaust CO2 emissions trends in all traffic scenarios, years 2015–2045.
Sustainability 14 15657 g013
Figure 14. Total exhaust NOx emissions trends in all traffic scenarios, years 2015–2045.
Sustainability 14 15657 g014
Figure 15. Total exhaust PM emissions trends in all traffic scenarios, years 2015–2045.
Sustainability 14 15657 g015
Figure 16. Total energy consumption and exhaust emissions reduction potential in the traffic management scenarios by vehicle type, years 2015–2045.
Sustainability 14 15657 g016
Table 1. Summary of the findings and contributions of the previous studies on vehicle emissions and energy demand estimations.
StudyCountryModelling ToolModel TypeModelling MethodologyEmission FactorsMethodology
Application
Category
Captured Traffic Fleet Elements
Mode-Shift/Mode SplitTraffic AssignmentQueue FormationActual Speed FactorTravel DelaysTraffic Load FluctuationsDynamic Driving CyclesNew Fuel & Engine Technologies
Current studyUnited Arab EmiratesVISSIM & VERSIT+MicrosimulationCaptured vehicle movement, queue delays and speed-time profiles on a network using pre-defined vehicle profiles based on real-world data using multiple PT traffic management scenariosCO2, NOx, PM, Energy use
-
Generic
-
Instantaneous speed model
-
Instantaneous trajectory data
McKenzie and Durango-Cohen [25]USA-I-O LCAApplied an input-output based methodology using average fuel consumption and mileage values to calculate lifecycle emissionsCO2 eq.
-
Average mileage model
-
Generic
Peng et al. [2]ChinaLEAPEnergy planning modelEvaluated long-term environmental impact assessment of enhancing PT sector using average mileage, consumption, and lifecycle parameters CO2, NOx, CO, HC, PM, & Energy use
-
Average mileage & consumption
-
Generic
Lajunen and Lipman [33]USA & FinlandAutonomieSimulinkEvaluated lifecycle impact of multiple types of powertrain technologies for PT services CO2 eq.
Barth et al. [31]IndiaIVEMicro- & macroEstimated exhaust emissions and energy consumption on a network using traffic fleet characteristicsCO2, NOx, CO, VOC, & PM
-
Generic
-
Multiscale model
Ali et al. [34]PakistanCOPERTEmission factor modelUtilised average speed profile and user-defined traffic fleet distribution to calculate environmental footprintEnergy use
-
Average speed model
-
Semi-generic
Varga et al. [37]HungaryVISSIMMicrosimulationEnhanced PT bus performance on a network by using a multi-objective speed and platooning control to reduce energy consumption and waiting times
-
Instantaneous speed model
-
Generic
Chen and Yu [42]ChinaVISSIM & CMEMEvaluated the environmental footprint of creating a dedicated bus laneCO, CO2, HC, NOx, PM & Energy use
-
Instantaneous speed model
-
Semi-generic
Manjunatha et al. [43]USAVISSIM & MOVESCaptured vehicle movement trajectories aggregated by type and using pre-defined vehicle types to evaluate the exhaust emissions and energy consumption
-
US-specific
-
Multiscale model
Song et al. [45]
Quaassdorff et al. [46]SpainVISSIM & VERSIT+Evaluated environmental footprint across different traffic hours on a roundabout using pre-defined vehicle profiles based on real-world dataNOx & PM
-
Instantaneous speed model
-
Generic
Table 2. European exhaust emissions standard distribution for vehicles in the United Arab Emirates.
Euro
Standard
Global Regulation YearIntroduction Date in United Arab EmiratesSmall and
Regular Cars
Minibus and CoachLight TruckTraditional and Autonomous BusHeavy Truck
2015204520152045201520452015204520152045
Euro I and earlier1992200731.67%4.72%67.5%3.33%62.22%1.39%66.94%0%52.78%4.93%
Euro II1996201033.47%1.39%20.28%15.42%20.56%12.5%19.17%18.75%29.44%5.42%
Euro III2000201327.78%1.25%11.94%13.75%13.75%13.75%13.61%13.75%17.5%8.13%
Euro IV200520156.94%14.58%0.181%20.69%3.33%25.28%0.167%20.97%0.194%18.19%
Euro V200920180.14%16.39%0.097%8.89%0.139%13.89%0.11%8.61%0.083%9.93%
Euro VI201420200%61.67%0%37.92%0%33.19%0%37.92%0%53.40%
Table 3. LCI data for CO2 emission factors and fuel consumption by vehicle type, fuel and analysis year.
Vehicle TypeVehicle Traffic Share in Each Scenario (%) 1Fuel Type Distribution (%) 2Emission StandardEuro I & EarlierEuro IIEuro IIIEuro IVEuro VEuro VIData Sources
Small-size cars (Length ≤4.5 m)BAU: 45.5%Petrol: 99.6%Emission Factors (kg/km)0.21680.21680.21200.19900.18900.1774Romilly [57], Simons [58], DIRDC [59], and ABS [60]
Bus: 36.4%Fuel Consumption (kg/km)0.09620.07270.06650.35420.33770.3219
BRT: 32.3%Diesel: 0.3%Emission Factors (kg/km)0.19360.19360.18100.17300.16600.1587
AV-BRT: 29.57%Fuel Consumption (kg/km)0.05980.05980.05780.05460.05280.0511
CNG/LPG/Other: 0.1%Emission Factors (kg/km)0.18750.17500.16600.15500.14700.1373
Fuel Consumption (kg/km)0.05000.05000.05280.05850.05540.0525
Regular-size cars (Length: 4.5 m–6 m)BAU: 37.54%Petrol: 99.6%Emission Factors (kg/km)0.42310.41200.31630.30800.31200.3038Romilly [57], Simons [58], DIRDC [59], and ABS [60]
Bus: 30.032%Fuel Consumption (kg/km)0.08760.07870.07840.07430.07090.0676
BRT: 26.719%Diesel: 0.3%Emission Factors (kg/km)0.31180.30800.24800.24500.28700.2835
AV-BRT: 24.40%Fuel Consumption (kg/km)0.12310.09400.07360.06880.06680.0648
CNG/LPG/Other: 0.1%Emission Factors (kg/km)0.28090.26640.24770.23990.24270.2350
Fuel Consumption (kg/km)0.10710.11250.07340.06970.06630.0630
Minibus and coach (6 m–8 m)All scenarios: 4.735%Diesel: 100%Emission Factors (kg/km)0.44100.44100.34380.33980.33530.3315Romilly [57], and DIRDC [59]
Fuel Consumption (kg/km)0.08990.09150.08990.07650.08820.1016
Light truck/LGV (8–10 m)All scenarios: 6.64%Petrol: 97.4%Emission Factors (kg/km)0.25410.23830.23830.23830.23830.2383Zanni and Bristow [61], DIRDC [59], and ABS [60]
Fuel Consumption (kg/km)0.13000.12200.09650.09580.09060.0856
Diesel: 2.5%Emission Factors (kg/km)0.24610.24060.24040.24040.24020.2402
Fuel Consumption (kg/km)0.12500.12100.10400.10070.10070.1007
CNG/LPG/Other: 0.1%Emission Factors (kg/km)0.22170.20810.24010.23540.20310.1991
Fuel Consumption (kg/km)0.16900.16900.15210.15030.14130.1328
Traditional public transport busBAU: 0%Diesel: 71%Emission Factors (kg/km)1.21741.18401.23891.11611.08901.0200Romilly [57], Wang et al. [62], Kuschel et al. [63] Nanaki et al. [64], and ABS [60]
Bus: 16.61%Fuel Consumption (kg/km)0.29120.30360.29760.25410.23480.2081
BRT: 24.02%CNG: 29%Emission Factors (kg/km)1.10001.25001.13921.26271.12781.1221
AV-BRT: 0%Fuel Consumption (kg/km)0.46350.22230.20550.31020.31410.2047
Autonomous public transport busBAU: 0%CNG: 100%Emission Factors (kg/km)1.10001.25001.13921.26271.12781.1221
Bus: 0%Fuel Consumption (kg/km)0.46350.22230.20550.31020.31410.2047
BRT: 0%
AV-BRT: 29.06%
Heavy truck (10 m–12 m)All scenarios: 5.586%Diesel: 100%Emission Factors (kg/km)0.68450.67260.67260.65240.64100.6218Zanni and Bristow [61], and ABS [60]
Fuel Consumption (kg/km)0.28900.28900.24040.24040.23550.2306
Table 4. Default vs. calibrated parameters of the Wiedemann-99 highway driving behaviour model.
Model Parameters (Unit)Default ValuesCalibrated Values
Standstill distance—CC0 (m)1.501.50
Headway time—CC1 (s)0.9 ± 0.20.5
“Following” variation—CC2 (m)4.006.80
Threshold for entering “following”—CC3 (s)−8.00−8.00
Negative “following” threshold—CC4 (m/s)−0.35−0.35
Positive “following” threshold—CC5 (m/s)0.350.35
Speed dependency of oscillation—CC6 (1/m·s)11.4411.44
Oscillation acceleration—CC7 (m/s2)0.250.25
Standstill acceleration—CC8 (m/s2)3.503.50
Acceleration with 80 km per hour—CC9 (m/s2)1.501.50
Publisher’s Note: MDPI stays neutral with regard to jurisdictional claims in published maps and institutional affiliations.

